the bioeconomic feasibility of culturing triploid crassostrea ariakensis in north carolina jonathan...
TRANSCRIPT

THE BIOECONOMIC FEASIBILITY OF CULTURING TRIPLOID CRASSOSTREA
ARIAKENSIS IN NORTH CAROLINA
Jonathan H. Grabowski
Gulf of Maine Research Institute, Portland, ME 04101

Bioeconomic Model of C. ariakensis Culture Venture
(1) Quantify investment costs
(2) Quantify production costs
(3) Estimate cash flow
(4) Calculate the annual enterprise budget

Bioeconomic Model (Continued)
(5) Evaluate the sensitivity of profitability during the first five years of operation to variation in the following parameters:– Seed price– Operation size– Market price – Mud-blister infestation – Oyster survivorship

Background Information:C. Ariakensis Culture Venture
• 3 acre lease in North Carolina
• 500,000 triploid oysters planted per year
• 5 year duration (annual crops)
• Rack-and-cage grow-out

Growout Phases
1. Hatchery phase – oyster spawned, eggs fertilized, & larvae reared to ~3 mm shell height (SH) seed
– 6-8 weeks duration– Not included in our analyses
2. Nursery phase – 3 mm (SH) oysters raised to 25 mm (SH) in upwellers or in fine-mesh cages in the field
– 6-8 weeks duration
• Grow-out phase -25 mm oysters raised to edible sizes (75+ mm SH)
– 4-9 months duration (time-length depends on season of initiation and salinity regime)

Culture Scenarios Investigated
• Nursery phase– On-site nursery grow-out in the field (3 mm SH) vs.
purchase of more costly larger seed (25 mm SH)
• Seasonal comparisons– Spring vs. summer vs. fall initiation
• Salinity regimes– intermediate (10-25‰) vs. high (>25‰)

Sources of Data and Info Used in Calculations
• Growth and survivorship data– Grabowski et al. 2004, Bishop and Peterson 2005a
• Palatability data– Grabowski et al. 2003, Bishop and Peterson 2005b
• Additional info (i.e., Labor estimates, materials costs, etc.)– Unpublished data (Peterson, Grabowski and Bishop)– Numerous conversations with NC fishermen

Biological Data Used in Analyses
Season of Initiation Salinity Regime
Survivorship (%)
Grow-out Time
(months)
Spring High (>25 ‰) 56.2 4
Intermediate (10-25‰) 75.4 7
Summer High 56.2 4
Intermediate 75.4 7
Winter High 90.0 6
Intermediate 94.0 9
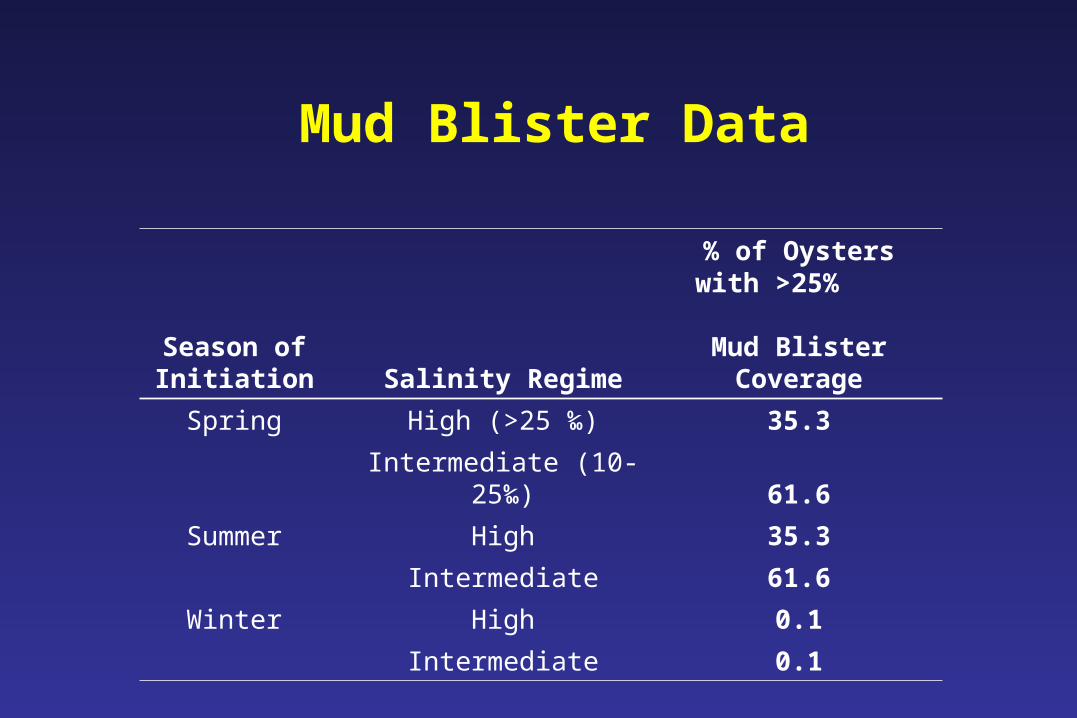
Mud Blister Data
Season of Initiation Salinity Regime
% of Oysters with >25% Mud Blister Coverage
Spring High (>25 ‰) 35.3
Intermediate (10-25‰) 61.6
Summer High 35.3
Intermediate 61.6
Winter High 0.1
Intermediate 0.1
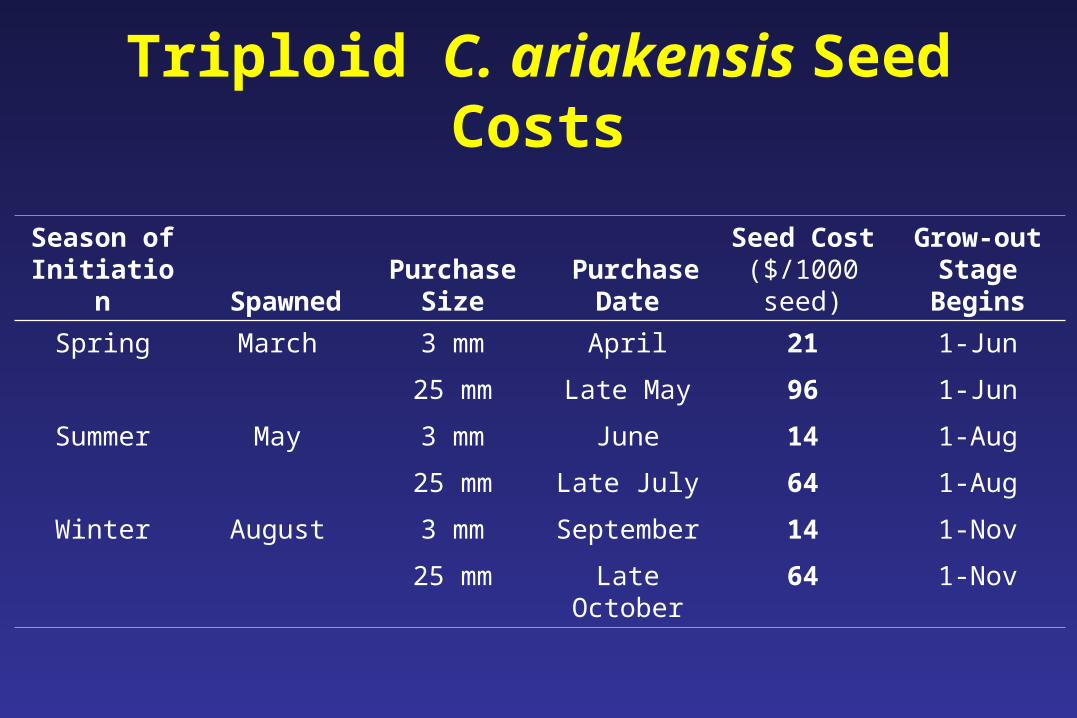
Triploid C. ariakensis Seed Costs
Season of Initiation
Spawned
Purchase Size
Purchase Date
Seed Cost($/1000 seed)
Grow-outStage
Begins
Spring March 3 mm April 21 1-Jun
25 mm Late May 96 1-Jun
Summer May 3 mm June 14 1-Aug
25 mm Late July 64 1-Aug
Winter August 3 mm September 14 1-Nov
25 mm Late October 64 1-Nov

Financial Operation (Assumptions)
• Market price
– Half-shell market = consumed raw or steamed • $0.25 per oyster
– Shucked market = processed oysters• $0.063 per oyster

Continued
• Capital asset depreciation – straight-line
• All costs and expenses were inflated by 3%/yr
• Laborers are self-employed and paid $10/hr
• maintenance costs:– 2% for rack and cage materials– 10% for skiff, skiff motor, boat trailer, and truck

Continued
• Taxes were calculated for a sole proprietorship • Federal and state income & self-employment taxes
• Net return to owner:• Total Revenues – (Capital Costs + Production Costs + Taxes)
• Percent return on investment:• Total Revenues/ (Capital Costs + Production Costs + Taxes)

Results:(1) Investment Costs for All Scenarios
Initial SalinitySeason of Initiation Seed Size Regime yr 1 yr 2 yr 3 yr 4 yr 5
Spring 3 mm High (>25‰) $92,146 $0 $265 $6,644 $27,395Intermediate (10-25‰) 92,146 0 265 6,644 27,395
25 mm High 89,993 0 265 6,644 24,972Intermediate 89,993 0 265 6,644 24,972
Summer 3 mm High 92,896 773 1,061 7,463 28,239Intermediate 92,146 0 265 6,644 27,395
25 mm High 89,993 0 265 6,644 24,972Intermediate 89,993 0 265 6,644 24,972
Winter 3 mm High 92,146 0 265 6,644 27,395Intermediate 92,146 0 265 6,644 27,395
25 mm High 89,993 0 265 6,644 24,972Intermediate 89,993 0 265 6,644 24,972
Investment Costs

Investment Costs for the Most Profitable Scenario: Winter Culture at High Salinity with On-site Nursery
Grow-out
Acquisition Construct Total ConstructionUnit Price ($) Number (total hr) (hr/item) Time (hr) Years of Life 1 2 3 4 5
Nursery PhaseField nursery mesh size
Bags w/ clipsa 2 mm 3.57 50 0.17 0.03 1.83 4 $178.73 $201.179 mm 3.57 500 0.17 0.03 16.83 4 1,787.34 2,011.67
Labor $10/hr Total Time: 18.67 186.67 210.09
Grow-out Phase
Miscellaneousb 500.00 1 5 500.00Bags w/ clips 16 mm 3.57 3,333 0.17 0.03 111.28 4 11,915.60 13,411.11PVC racks 45.00 667 2.00 1.33 890.89 10 30,000.00Labor $10/hr Total Time: 1002.17 10,021.67 11,279.47
Equipment 1 Skiff 10,000.00 1 10 10,000.00 Motor 6,000.00 1 3 6,000.00 6,556.36 Trailer 2,000.00 1 5 2,000.00 Pick-up truck 10,000.00 1 5 10,000.00
Wet suit or waders 250.00 2 2 500.00 265.23 281.38
Cooling unit & shed 3,000.00 1 10 3,000.00# of acres cost per acre
Bottom lease 2.78 2,000.00 1 >10 5,555.56
Labor InvestmentSite/equipment selection 10.00 50.00 500.00 87.42
Total Investment $92,145.56 $0.00 $265.23 $6,643.78 $27,394.89
YEAR
Materials Labor

(2) Production Costs for All Scenarios
Initial SalinitySeason of Initiation Seed Size Regime yr 1 yr 2 yr 3 yr 4 yr 5
Spring 3 mm High (>25‰) $35,811 $36,885 $37,991 $39,131 $40,305Intermediate (10-25‰) 41,111 42,344 43,614 44,923 46,270
25 mm High 72,151 74,315 76,545 78,841 81,206Intermediate 77,451 79,774 82,167 84,632 87,171
Summer 3 mm High 32,311 33,280 34,278 35,307 36,366Intermediate 37,611 38,739 39,901 41,098 42,331
25 mm High 56,151 57,835 59,570 61,357 63,198Intermediate 61,451 63,294 65,193 67,149 69,163
Winter 3 mm High 35,844 36,919 38,027 39,168 40,343Intermediate 41,144 42,378 43,650 44,959 46,308
25 mm High 59,684 61,474 63,319 65,218 67,175Intermediate 64,984 66,933 68,941 71,010 73,140
Production Costs

Production Costs: Winter Culture, High Salinity, & On-site Nursery
Unit Timea Trips Transport Timea TOTALa
Unit Price ($) Number (hr/unit) (#) (hr/trip) (hr) 1 2 3 4 5$/seed # seed/yr
Seed $0.014 500,000 $7,000.00 $7,210.00 $7,426.30 $7,649.09 $7,878.56
Supplies/expendables 100.00 103.00 106.09 109.27 112.55(gloves, boxes, label tags, etc.)
Fuel/oil/electricity monthly fee # monthsSkiff/truck $100.00 8 800.00 824.00 848.72 874.18 900.41
Cooling unit $75.00 6 450.00 463.50 477.41 491.73 506.48
Maintenance unit price annual rate # units hr/itemSkiff/truck/cooling unit $28,000.00 10% 1 25.00 25 2,800.00 2,884.00 2,970.52 3,059.64 3,151.42Bags $3.57 2% 66.67 0.03 2 238.31 245.46 252.83 260.41 268.22Frames $45.00 2% 13.33 1.33 18 600.00 618.00 636.54 655.64 675.31Labor $10/hr Total Time: 45 450.00 463.50 477.41 491.73 506.48
Wages per tripNursery phase # racks hr/rack
Plant 8 0.50 1 1.50 6Clean 2-mm bags 8 0.25 2 0.33 5Mid transfer 83 0.50 1 1.50 43Clean 9-mm bags 83 0.25 2 0.33 42
Labor $10/hr Total Time: 96 960.00 988.80 1,018.46 1,049.02 1,080.49
per tripGrow-out phase # racks hr/rack
Plant seed 667 0.50 1 1.50 335Clean bags 667 0.25 6 0.06 1,000Harvest oysters 667 0.25 1 0.50 167Weigh and bag oysters 667 0.33 1 0.00 222
Labor $10/hr Total Time: 1,725 17,245.56 17,762.92 18,295.81 18,844.68 19,410.02
$/oyster # oysters
Disease testingb$20.00 60 1,200.00 1,236.00 1,273.08 1,311.27 1,350.61
Reversion testing $3.00 1,000 3,000.00 3,090.00 3,182.70 3,278.18 3,376.53
Overhead expenses annualInsurance/bookkeeping/accounting $1,000.00 1,000.00 1,030.00 1,060.90 1,092.73 1,125.51
Total $35,843.87 $36,919.18 $38,026.76 $39,167.56 $40,342.59
Materials Labor YEAR

(3) Ending Annual Cash Balance for All Scenarios
Initial SalinitySeason of Initiation Seed Size Regime yr 1 yr 2 yr 3 yr 4 yr 5
Spring 3 mm High (>25‰) ($81,521) ($73,349) ($66,809) ($66,300) ($81,365)Intermediate (10-25‰) (87,612) (84,687) (83,218) (87,791) (107,642)
25 mm High (114,761) (139,470) (164,238) (193,660) (235,312)Intermediate (120,868) (151,325) (181,505) (216,022) (262,472)
Summer 3 mm High (78,771) (68,554) (59,983) (57,259) (70,131)Intermediate (84,112) (78,078) (73,671) (75,291) (92,351)
25 mm High (98,761) (108,351) (118,832) (134,753) (163,648)Intermediate (104,868) (120,206) (136,099) (157,115) (190,808)
Winter 3 mm High (26,876) 10,160 43,666 71,506 88,379Intermediate (27,761) 8,601 41,419 68,554 84,632
25 mm High (46,500) (20,553) 2,379 19,498 25,918Intermediate (47,295) (21,986) 229 16,609 22,160
Ending Cash Balance (NPV)
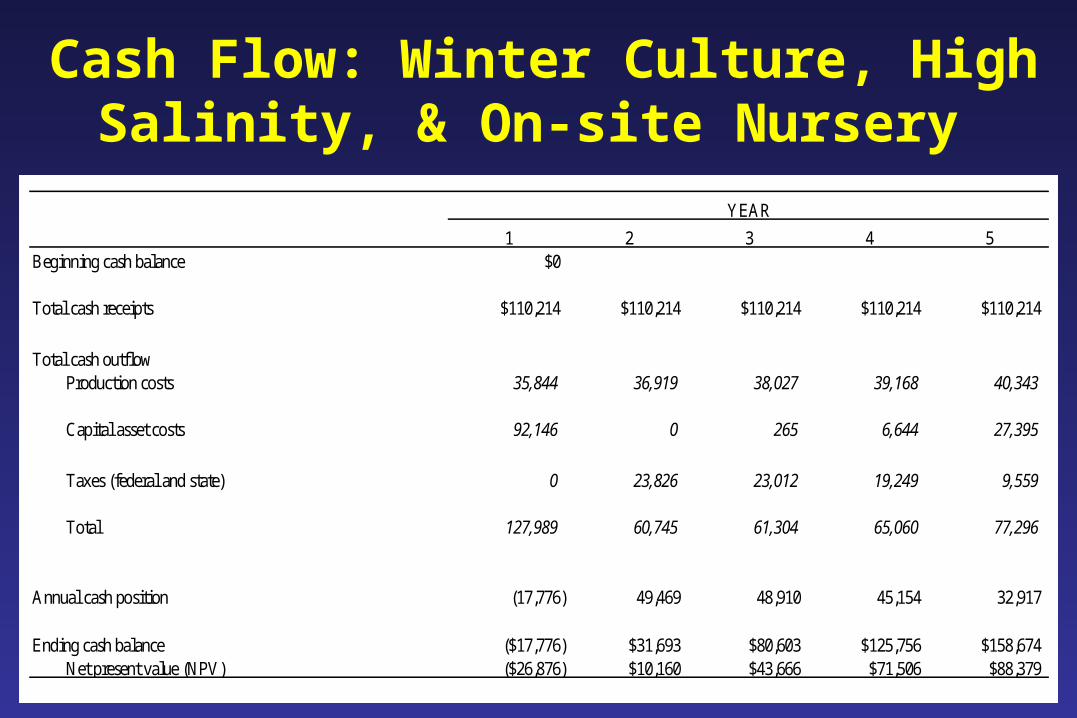
Cash Flow: Winter Culture, High Salinity, & On-site Nursery
1 2 3 4 5Beginning cash balance $0
Total cash receipts $110,214 $110,214 $110,214 $110,214 $110,214
Total cash outflowProduction costs 35,844 36,919 38,027 39,168 40,343
Capital asset costs 92,146 0 265 6,644 27,395
Taxes (federal and state) 0 23,826 23,012 19,249 9,559
Total 127,989 60,745 61,304 65,060 77,296
Annual cash position (17,776) 49,469 48,910 45,154 32,917
Ending cash balance ($17,776) $31,693 $80,603 $125,756 $158,674Net present value (NPV) ($26,876) $10,160 $43,666 $71,506 $88,379
YEAR

(4) Average Enterprise Budget:
Winter Culture,High Salinity, & On-site Nursery
Units Price/Unit Total Value/CostREVENUES survival
nursery phase mortality = 2% 98.0%C. ariakensis 88.2% 441,084
proportionHalf-shell market 99.9% 440,777 $0.25 $110,194Shucked market (mud blisters > 25%) 0.1% 306 $0.06 $19
VARIABLE COSTSSeed oysters 500,000 $0.01 $7,000Supplies $106Fuel/oil/electricity
Skiff/truck $849Cooling unit $485
MaintenanceSkiff/truck/cooling unit $2,973Bags $257Racks $646Wages (maintenance only) $10/Hr. $485
LaborPurchase seed & nursery phase $10/Hr. $1,019Grow-out phase $10/Hr. $18,312
Disease & reversion testing $4,460Overhead expenses $1,062Operating debt interest $0Total variable costs $37,654
FIXED COSTSOverhead expenses
Lease $1,111Insurance/bookkeeping/accounting $1,062
Interest on long-term debt interest $0Capital assets $13,634Depreciation $12,370Total fixed costs $28,178
Total Expenditures (excluding tax) $65,832
TAXSelf employment $6,790Income $8,436
Net return to owner $29,155
Percent return on investment 36%
Cost per oyster (break-even price) $0.18
Break-even survivorship rateHalf-shell market only 53%Adjusted to include shucked oysters 53%

Profitability of C. ariakensis culture for all scenarios
Season of Initial Salinity Net Return on % Return on Cost per Oyster Break-even
Initiation Seed Size Regime InvestmentaInvestment (Break-even Price)b Survivorshipc
Spring 3 mm High (>25‰) ($14,966) -23% $0.24 71%Intermediate (10-25‰) ($21,456) -30% $0.19 106%
25 mm High ($49,181) -49% $0.36 110%Intermediate ($55,688) -52% $0.28 158%
Summer 3 mm High ($11,466) -18% $0.23 68%Intermediate ($17,956) -27% $0.18 101%
25 mm High ($33,181) -39% $0.30 92%Intermediate ($39,688) -44% $0.24 134%
Winter 3 mm High $29,155 36% $0.18 53%Intermediate $28,725 33% $0.16 57%
25 mm High $17,041 18% $0.20 71%Intermediate $16,591 16% $0.20 75%

Net Return on % Return on Cost per Oyster Break-even
Variable Total Costsa InvestmentbInvestment (Break-even Price)b Survivorshipd
Seed price$0.008 $79,505 $30,708 38.6% $0.180 50.3%$0.011 $80,296 $29,918 37.3% $0.182 51.5%$0.014 $81,058 $29,155 36.0% $0.184 52.7%$0.017 $81,877 $28,337 34.6% $0.186 53.9%$0.020 $82,667 $27,546 33.3% $0.187 55.1%
No. oysters planted250,000 $46,739 $8,368 17.9% $0.212 71.3%500,000 $81,058 $29,155 36.0% $0.184 52.7%
1,000,000 $154,065 $66,363 43.1% $0.175 43.4%2,000,000 $296,798 $144,057 48.5% $0.168 38.8%
Market price (half-shell market)$0.15 $65,923 $213 0.3% $0.149 87.9%$0.20 $72,133 $16,042 22.2% $0.164 65.9%$0.25 $81,058 $29,155 36.0% $0.184 52.7%$0.30 $91,517 $40,736 44.5% $0.207 43.9%$0.35 $102,347 $51,944 50.8% $0.232 37.7%
Mud blister infestation rate0% $81,114 $29,157 35.9% $0.184 52.7%
25% $72,678 $16,957 23.3% $0.165 64.8%50% $66,361 $2,637 4.0% $0.150 84.2%75% $65,885 ($17,523) -26.6% $0.149 120.2%
100% $65,885 ($38,160) -57.9% $0.149 209.6%
Survival rate50% $65,885 ($4,667) -7.1% $0.26960% $67,166 $6,296 9.4% $0.22870% $71,212 $14,493 20.4% $0.20880% $75,779 $22,170 29.3% $0.19390% $81,077 $29,116 35.9% $0.184
(5)
Sen
siti
vity
An
alys
es:
Win
ter
Cu
ltu
re,
Hig
h S
alin
ity,
& O
n-s
ite
Nu
rser
y

Conclusions
• Triploid C. ariakensis culture could be profitable
• Need to consider salinity regime and especially seasonal timing of culture operation
• Assessment conducted with NC data– Needs to be conducted with info from Chesapeake

Importance of Timing
• Only operations initiated in winter were profitable– Annual profits ranged from 33-36% with on-site
nursery and 16-18% without– Purchasing larger seed results in more modest return
but removes risk of nursery phase mortality
• In summer, operations lost b/w 18 and 44%:– High-salinity sites experienced poor survivorship– Mud blistering was very high at intermediate salinities
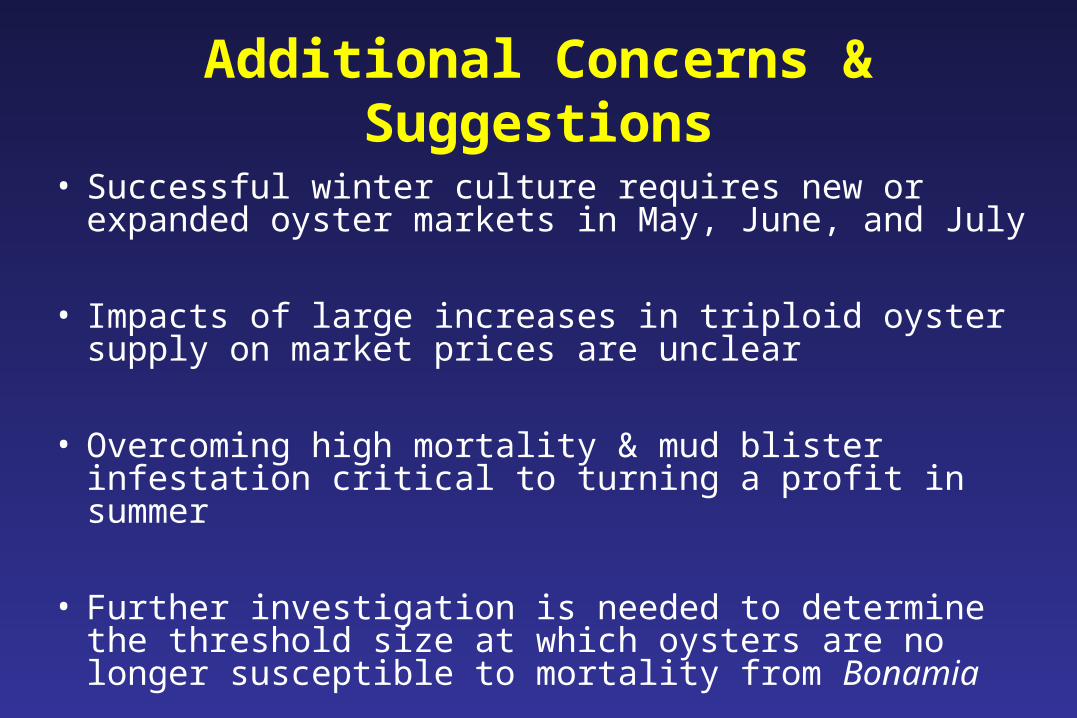
Additional Concerns & Suggestions
• Successful winter culture requires new or expanded oyster markets in May, June, and July
• Impacts of large increases in triploid oyster supply on market prices are unclear
• Overcoming high mortality & mud blister infestation critical to turning a profit in summer
• Further investigation is needed to determine the threshold size at which oysters are no longer susceptible to mortality from Bonamia

Additional Concerns & Suggestions
• Alternative solution: developing a triploid native oyster – Currently produced by one grower– Produces a marketable product during the off
season (i.e., not watery like diploid C. virginica in the spring and summer)
– Increased growth rates would potentially reduce risk of mortality from dermo
– Would avoid potential ecosystem risks associated with non-native species introductions

Acknowledgements
• Funding Sources: North Carolina Division of Marine Fisheries, NOAA, and the Golden Leaf Foundation.
• S. Allen, Jr., J. Braddy, R. Carnegie, R. Graham, M. Hooper, P. Hooper, M. Marshall, D. Newman, D. Schmidt, J. Swartzenberg, H. Summerson, and M. Ulery provided data on labor requirements, seed and market prices, and equipment costs associated with oyster culture.