the bridge effect: comparison of bridge pupils to peers at nearby
TRANSCRIPT

The Bridge Effect: Comparison of Bridge Pupils to Peers at Nearby Schools EGRA-EGMA Evaluation Programme
Fall 2013 Results, July 2011 Baseline

2
Table of Contents
Overview ....................................................................................................................................................................................... 3
Cohorts of the EGRA/EGMA Programme ..................................................................................................................................... 4
Follow-up with the July 2011 Cohort ............................................................................................................................................. 4
Pupil Backgrounds ........................................................................................................................................................................ 5
Subtasks and Scoring ................................................................................................................................................................... 9
2011 Baseline Test Scores ......................................................................................................................................................... 11
Analytical Framework .................................................................................................................................................................. 12
Results of the DiD Analyses ........................................................................................................................................................ 13
Repeated Cross Section DiD Analysis ................................................................................................................................... 13
Panel DiD Analysis, Controlling for Baseline Test Scores ...................................................................................................... 14
Comparison of Results to Other Educational Studies ................................................................................................................. 15
Effect Sizes of Other Educational Interventions ..................................................................................................................... 16
Presenting Results to Our Clients ............................................................................................................................................... 18
Equating Instrument Versions ................................................................................................................................................. 18
Translation of Results ............................................................................................................................................................. 18
Concluding Thoughts .................................................................................................................................................................. 19
References .................................................................................................................................................................................. 21
Appendix ..................................................................................................................................................................................... 22
A. Demographics and Home Life Differences, by Variable .................................................................................................... 22
B. Demographics and Home Life Differences, by Class Level .............................................................................................. 25
C. Pupil Counts by School and Class Level .......................................................................................................................... 27
D. Monitoring and Data Quality Systems ............................................................................................................................... 29
E. Repeated Cross-Sectional DiD Specification and Regression Results ............................................................................. 30
F. Panel DiD Specification Controlling for Baseline Scores and Regression Results ............................................................ 32
G. Comparison of Passage Fluency Across DiD Specifications ............................................................................................ 34

3
Overview
The mission of Bridge International Academies is to provide affordable, high-quality education to millions of primary school pupils around the world. To hold ourselves accountable to our goals, we conduct one of the most comprehensive and rigorous early grade reading and math assessment programmes in East Africa. Using the Early Grade Reading Assessment and Early Grade Math Assessment (EGRA/EGMA), we measure the foundational literacy and numeracy skills of our pupils and their academic peers in neighbouring schools to understand both absolute and relative pupil performance. These tools were developed by the Research Triangle Institute (RTI) in conjunction with USAID, and have been used by education ministries and multi-lateral agencies around the world.
Bridge’s EGRA/EGMA programme includes a multi-‐year, pupil-‐matched study. Working in partnership with a third-party company, each pupil is given a 30-minute, one-on-one oral assessment upon entry into the study by a trained external assessor. The study then aims to track the same pupils over time and measures their annual performance at each of the participating schools.
There are three cohorts of pupils: the first cohort was first assessed in July 2011 in the greater Nairobi area; the second cohort was first assessed in February 2012 in four major urban areas across Kenya (Nairobi, Nakuru, Eldoret, and Kisumu); and the third and latest cohort was first assessed in October 2013 and is a nationally representative sample.
In this report, we highlight the results from the 2013 administration of EGRA/EGMA. First, when comparing pupils in Pre-Unit to Class 2 in 2011 to pupils in Classes 2 through 4 in 2013 in the exact same schools, we found that attending Bridge had a significant effect on learning. Compared to their peers attending public schools, Bridge pupils on average gained an additional.32 standard deviations on reading fluency and comprehension over the course of 26 months. For reading fluency, this translates into a gain of 16 words per minute, above and beyond the growth experienced by their academic peers. Bridge’s average reading effect size of .32 translates into almost 252 additional days of learning. The Bridge effect size for maths is also significant – both on a practical and statistical level – at .51 standard deviations, which translates into over 288 additional days of learning.
Second, we also examined the sub-sample of pupils whom we were able to follow over the course of 26 months. Given these pupils’ incoming skill and ability levels, we found that Bridge pupils on average gained an additional .58 standard deviations on reading fluency and comprehension. This translates into a gain of over 20 words per minute for reading fluency. The Bridge effect size for more advanced maths using the tracked sub-sample is also significant at .47 and .48 standard deviations for subtraction and word problems, respectively.
While we acknowledge that our results are not part of a randomised controlled trial, we use rigourous, quasi-experimental methods to assess our efficacy. As Bridge has grown tremendously over the past few years, we have also expanded our measurement and evaluation programme in early grades to track effectiveness as we scale. We now follow and assess over 8,000 randomly sampled pupils, covering over 170 schools across 17 counties, investing over $100,000 annually in this study. Endline results for these pupils will be available in 2015.
In addition, we are in the early stages of working with a team of external researchers and field research implementation partners on a randomised evaluation of Bridge.
This report is organised as follows:
We first discuss the background of the pupils in our study – their assessment history, key demographic characteristics, and baseline test scores. We then discuss the details of our analytical framework, from our rationale for selecting each to our key findings. Finally, we contextualise our findings within the broader global education intervention landscape and examine how we can present our findings in a more accessible manner to our clients (parents of pupils).
4
Cohorts of the EGRA/EGMA Programme
There have been three rounds of test administration corresponding to three distinct cohorts in the EGRA/EGMA programme. The first cohort of pupils was assessed in July 2011 for the purposes of measuring incoming performance levels. Six months later in February 2012, a follow-up administration was conducted for this cohort, alongside an initial assessment for a second cohort of pupils. The latest administration was conducted in October 2013, 26 months from the baseline assessment for the first cohort, and 20 months from the baseline assessment of the second cohort. Given the rapid expansion of the number of schools, regions, and pupils at Bridge since July 2011, this latest administration was also used to increase the scope of the programme. First, it added a third cohort of pupils to study, expanding the sample size to over 8,000 pupils. Second, it incorporated a randomised sample of schools across all regions in Kenya now serviced by Bridge. Finally, the programme also added a pilot study of Nursery pupil performance (4 year olds)1, a grade level that had not been assessed in previous years. This pilot was conducted only at Bridge academies in the greater Nairobi area.2
For the purposes of this report, we discuss the details of the most recent round of data collection and focus on those pupils who were assessed starting in July 2011, whom we refer to as either the “first cohort” or “July 2011 cohort.”
Follow-up with the July 2011 Cohort
Each cohort is comprised of Bridge International Academies and public schools in the community. In July 2011, a third-party contractor visited 26 Bridge International Academies and 2 public schools. Then, in October 2013, the contractor revisited these schools and re-assessed these pupils from the July 2011 cohort. See Tables C1 and C2 in Appendix C for the list of schools visited and their corresponding pupil counts.
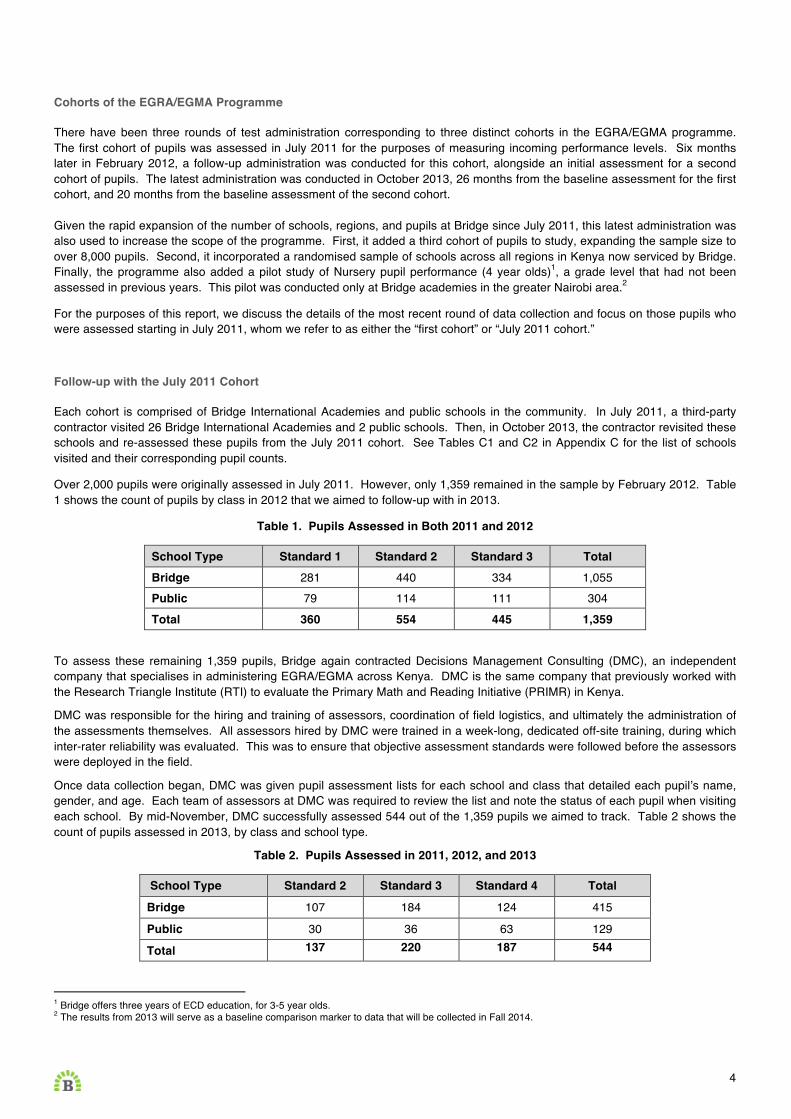
Over 2,000 pupils were originally assessed in July 2011. However, only 1,359 remained in the sample by February 2012. Table 1 shows the count of pupils by class in 2012 that we aimed to follow-up with in 2013.
Table 1. Pupils Assessed in Both 2011 and 2012
School Type Standard 1 Standard 2 Standard 3 Total Bridge 281 440 334 1,055 Public 79 114 111 304 Total 360 554 445 1,359
To assess these remaining 1,359 pupils, Bridge again contracted Decisions Management Consulting (DMC), an independent company that specialises in administering EGRA/EGMA across Kenya. DMC is the same company that previously worked with the Research Triangle Institute (RTI) to evaluate the Primary Math and Reading Initiative (PRIMR) in Kenya.
DMC was responsible for the hiring and training of assessors, coordination of field logistics, and ultimately the administration of the assessments themselves. All assessors hired by DMC were trained in a week-long, dedicated off-site training, during which inter-rater reliability was evaluated. This was to ensure that objective assessment standards were followed before the assessors were deployed in the field.
Once data collection began, DMC was given pupil assessment lists for each school and class that detailed each pupil’s name, gender, and age. Each team of assessors at DMC was required to review the list and note the status of each pupil when visiting each school. By mid-November, DMC successfully assessed 544 out of the 1,359 pupils we aimed to track. Table 2 shows the count of pupils assessed in 2013, by class and school type.
Table 2. Pupils Assessed in 2011, 2012, and 2013
School Type Standard 2 Standard 3 Standard 4 Total
Bridge 107 184 124 415
Public 30 36 63 129
Total 137 220 187 544
1 Bridge offers three years of ECD education, for 3-5 year olds. 2 The results from 2013 will serve as a baseline comparison marker to data that will be collected in Fall 2014.

5
To ensure data quality, the Measurement & Evaluation (M&E) team at Bridge established a number of processes to monitor DMC’s daily progress. For more details on these processes, see Appendix D. Our conversion to electronic data collection tremendously enabled these efforts. As completed assessments were uploaded on a daily basis, we could react to data in “real time” and communicate with DMC to address issues, usually within 1 to 3 days.
It is worth noting that we exerted extra effort to track as many pupils from the July 2011 cohort as possible. Each pupil assessment from this cohort was a product of past rounds of data collection, and provided a valuable data point over time. A loss of a single data point here meant the loss of previous rounds of data as well, from both 2012 and 2011.
Pupil Backgrounds
During the October 2013 administration of EGRA/EGMA, we included questions to capture basic demographic and home life information for each pupil. Examining these characteristics is essential to determining whether or not systematic differences exist among pupils attending Bridge academies and their peers at public schools. Ultimately, the detection of systematic differences informs our analytic framework and allows us to take such characteristics into account.
This section details our findings regarding differences in the demographic and home life characteristics of Bridge and public school pupils tracked from July 2011 through October 2013.3 Our key takeaway is that our pupils are systematically different from pupils attending public schools, particularly when it comes to average pupil age for younger grades, parental involvement in education, and baseline test scores.
Additional details, including statistically significant differences in pupil demographics and home life characteristics by class level and school type, are presented below:
• Age: Pupils attending public schools are older on average than pupils attending Bridge academies, suggesting repetition of grades or a higher initial age of entry into the formal education system. In other words, pupils attending Bridge are more likely to be at the target age for each grade.
• ECD: The vast majority of all pupils attained at least one year of pre-primary education. • Language: For all pupils, the language spoken at home is primarily Kiswahili or mother tongue. • Reading & Homework: Given that a pupil receives homework help, Bridge pupils are more likely to receive support
from a parent versus someone else. In Classes 3 and 4, if there is someone reading to the pupil at home, Bridge pupils are more likely to receive this support from a parent.
• Meals: There is no difference across school type in whether pupils consumed meals prior to and on the day of the EGRA/EGMA assessment.
• Assets: Bridge pupils are more likely to own radios than public school pupils. There is no difference in television ownership across school type.
• Electricity: There is no difference across school type in the proportion of households with electricity.
Summary statistics on demographics and home life for pupils in Classes 2, 3, and 4 can be found in Tables 3, 4, and 5, respectively. A more detailed review of our findings is located in Appendices A and B.
3 In the October 2013 round of EGRA/EGMA, we included demographic questions at the beginning and end of the survey instrument. We selected these questions based on RTI’s instrument, consultations with researchers, and piloting on Bridge pupils. The questions included could all be reasonably and accurately answered by young pupils.

6
Table 3. Class 2 Demographics in 2013
Indicator Bridge Public B vs. P Mean Count Mean Count Diff P-Value
Age Pupil Age 7.36 107 9.8 30 -2.44 0.00 Gender % Male 59.81% 64 60.00% 18 -0.19% 0.99 % Female 40.19% 43 40.00% 12 0.19% 0.99 ECD Schooling % Attended 1+ Year of ECD 94.39% 101 86.67% 26 7.73% 0.26 If Attended ECD, # of Years 2.10 101 1.9 26 0.20 0.36 Home Language % Speak English at Home 11.21% 12 20.00% 6 -8.79% 0.28 % Speak Kiswahili at Home 66.36% 71 53.33% 16 13.02% 0.21 % Speak Mother Tongue at Home 60.75% 65 80.00% 24 -19.25% 0.03 Meals % Ate Lunch Day Before 94.39% 101 96.67% 29 -2.27% 0.57 % Ate Dinner Day Before 97.20% 104 93.33% 28 3.86% 0.44 % Ate Breakfast Morning of Assessment 94.39% 101 83.33% 25 11.06% 0.14 Parental Involvement in Education % Someone Reads at Home 65.42% 70 53.33% 16 12.09% 0.37 If Someone Reads, % Mother or Father 55.71% 39 42.86% 6 12.86% 0.40 % Someone Helps with Homework 54.21% 58 50.00% 15 4.21% 0.69 If Someone Helps, % Mother or Father 67.24% 39 33.33% 5 33.91% 0.02 Assets and Time Use Indicators % Has Radio 71.03% 76 40.00% 12 31.03% 0.00 % Listens to Radio 67.29% 72 46.67% 14 20.62% 0.14 If Listens to Radio, % with Mother or Father 84.13% 53 63.64% 7 20.49% 0.22 % Has TV 85.05% 91 83.33% 25 1.71% 0.83 % Watches TV 88.79% 95 80.00% 24 8.79% 0.30 If Watches TV, % with Mother or Father 77.17% 71 58.33% 14 18.84% 0.10 % Has Electricity in Home 94.39% 101 90.00% 27 4.39% 0.47

7
Table 4. Class 3 Demographics in 2013
Indicator Bridge Public B vs. P Mean Count Mean Count Diff P-Value
Age Pupil Age 8.53 184 9.42 36 -0.89 0.00 Gender % Male 51.63% 95 58.33% 21 -6.70% 0.47 % Female 48.37% 89 41.67% 15 6.70% 0.47 ECD Schooling % Attended 1+ Year of ECD 91.21% 166 86.11% 31 5.10% 0.42 If Attended ECD, # of Years 2.19 166 2.11 31 0.08 0.71 Home Language % Speak English at Home 16.48% 30 5.56% 2 10.93% 0.02 % Speak Kiswahili at Home 67.03% 122 52.78% 19 14.26% 0.13 % Speak Mother Tongue at Home 59.89% 109 61.11% 22 -1.22% 0.89 Meals % Ate Lunch Day Before 97.28% 179 100.00% 36 -2.72% 0.02 % Ate Dinner Day Before 95.65% 176 97.22% 35 -1.57% 0.62 % Ate Breakfast Morning of Assessment 95.65% 176 94.44% 34 1.21% 0.77 Parental Involvement in Education % Someone Reads at Home 52.72% 97 72.22% 26 -19.50% 0.02 If Someone Reads, % Mother or Father 60.82% 59 34.62% 9 26.21% 0.02 % Someone Helps with Homework 40.22% 74 50.00% 18 -9.78% 0.29 If Someone Helps, % Mother or Father 71.62% 53 44.44% 8 27.18% 0.05 Assets and Time Use Indicators % Has Radio 75.54% 139 55.56% 20 19.99% 0.03 % Listens to Radio 64.67% 119 44.44% 16 20.23% 0.03 If Listens to Radio, % with Mother or Father 89.38% 101 87.50% 14 1.88% 0.84 % Has TV 79.35% 146 83.33% 30 -3.99% 0.57 % Watches TV 77.72% 143 80.56% 29 -2.84% 0.70 If Watches TV, % with Mother or Father 72.03% 103 51.72% 15 20.30% 0.05 % Has Electricity in Home 93.48% 172 94.44% 34 -0.97% 0.82

8
Table 5. Class 4 Demographics in 2013
Indicator Bridge Public B vs. P Mean Count Mean Count Diff P-Value
Age Pupil Age 9.83 124 10.60 63 -0.77 0.00 Gender % Male 50.81% 63 58.73% 37 -7.92% 0.31 % Female 49.19% 61 41.27% 26 7.92% 0.31 ECD Schooling % Attended 1+ Year of ECD 95.16% 118 79.03% 49 16.13% 0.01 If Attended ECD, # of Years 2.38 118 1.82 49 0.56 0.00 Home Language % Speak English at Home 4.84% 6 6.45% 4 -1.61% 0.66 % Speak Kiswahili at Home 64.52% 80 66.13% 41 -1.61% 0.83 % Speak Mother Tongue at Home 62.90% 78 62.90% 39 0.00% 1.00 Meals % Ate Lunch Day Before 100.00% 124 100.00% 63 0.00% . % Ate Dinner Day Before 98.39% 122 96.83% 61 1.56% 0.53 % Ate Breakfast Morning of Assessment 98.39% 122 100.00% 63 -1.61% 0.16 Parental Involvement in Education % Someone Reads at Home 68.55% 85 66.67% 42 1.88% 0.80 If Someone Reads, % Mother or Father 62.20% 51 42.86% 18 19.34% 0.04 % Someone Helps with Homework 52.42% 65 53.97% 34 -1.55% 0.85 If Someone Helps, % Mother or Father 64.52% 40 35.29% 12 29.22% 0.01 Assets and Time Use Indicators % Has Radio 74.19% 92 57.14% 36 17.05% 0.02 % Listens to Radio 51.61% 64 47.62% 30 3.99% 0.61 If Listens to Radio, % with Mother or Father 71.88% 46 63.33% 19 8.54% 0.42 % Has TV 82.26% 102 80.95% 51 1.31% 0.83 % Watches TV 81.45% 101 79.37% 50 2.09% 0.74 If Watches TV, % with Mother or Father 68.32% 69 64.00% 32 4.32% 0.60 % Has Electricity in Home 94.35% 117 95.24% 60 -0.88% 0.80

9
Subtasks and Scoring
There are various subtask options available for both EGRA and EGMA. Each subtask measures a different foundational literacy or numeracy skill. RTI has developed a core set of subtasks that it administers in every country, and on top of that, develops additional subtasks for particular contexts to assess other types of numeracy and literacy skills.
For any given subtask, there are different instrument versions that RTI and other parties make available to the public. Each instrument is tailored to the particular country that will utilise it.
In general, the subtasks are set at a Standard 2 level, though the difficulty of each subtask varies depending on progression in student learning. In 2011, 2012, and 2013, we chose to administer 3 EGRA subtasks and 6 EGMA subtasks, which are listed below in Table 6.
Table 6. Subtasks Administered in 2013 EGRA EGMA
Familiar Word Reading Quantity Discrimination Passage Fluency Addition Level I / Level II
Reading Comprehension Subtraction Level I / Level II Word Problems
The decisions about which subtasks to administer were made in consultation with members of the Bridge Academic Team, and took into consideration: 1) the appropriateness of subtasks to be assessed at certain grade levels (would bottoming or topping out occur?) and 2) the set of subtasks that would provide the most information on where Bridge pupils stand.
Detailed descriptions for each of the administered EGRA and EGMA subtasks are as follows:
1. Familiar Word Reading contains a series of 50 English words, all of which should be recognisable to a child in Standard 2. The child is asked to read as many of the words as he or she can within a 60-second time limit. The goal of this exercise is to develop an understanding of how many words a child is able to identify. This subtask provides a more accurate measure of a child’s decoding skills than reading a paragraph does, since all of the words are unrelated to each other. The child’s score for this subtask takes into account how many words he or she has read correctly, as well as how much time is left on the clock at the end of the exercise.
2. Passage Fluency contains a simple English reading exercise of around 50 to 60 words, of which the child is asked to read as much as he or she can within a 60-second time limit. This subtask measures a child’s overall reading skills and tests decoding, fluency, and vocabulary. The child’s score for this subtask takes into account how many words he or she has managed to read correctly, as well as how much time is left on the clock at the end of the exercise.
3. Reading Comprehension contains a series of 5 questions in English about the simple reading exercise that the child read during the Passage Fluency subtask. These include at least 4 fact-based questions as well as 1 inference question about the text. This subtask measures the child’s understanding of the passage he or she read. The child is only expected to answer those questions corresponding to the portion of the Passage Fluency reading exercise that he or she was able to read within the 60-second time allotment. This question may be scored one of two ways: as a percentage correct out of total questions, or as a percentage correct of questions asked.
4. Quantity Discrimination contains a series of 10 questions where the child is asked to choose which of two displayed numbers is larger. The instructions are read in both Kiswahili and English so as to prevent a child’s potential English limitations from affecting his or her performance on the subtask. This subtask gauges a child’s ability to make judgments about differences between numbers, which is a critical precursor to problem solving. The child’s score for this subtask is calculated as the percentage correct out of total questions.
5. Addition Level I contains a series of 20 questions where the child is asked to perform simple addition using quantities up to 10. The pupil has 60 seconds to complete this subtask, and the questions are asked in Kiswahili so as not to conflate the child's knowledge of English and mathematics. This subtask has been designed to gauge a child’s ability to solve basic addition problems. There are two possible ways to score this subtask. The first is calculated as the percentage correct out of total questions. The second takes into account time remaining on the clock.
6. Addition Level II contains a series of 5 questions where the child is asked to perform addition using double-digit quantities. The questions are asked in Kiswahili so as not to conflate the child's knowledge of English and mathematics. This subtask has been designed to gauge a child’s ability to solve more complex addition, and is untimed. This subtask is scored as the percentage correct out of total questions.
10
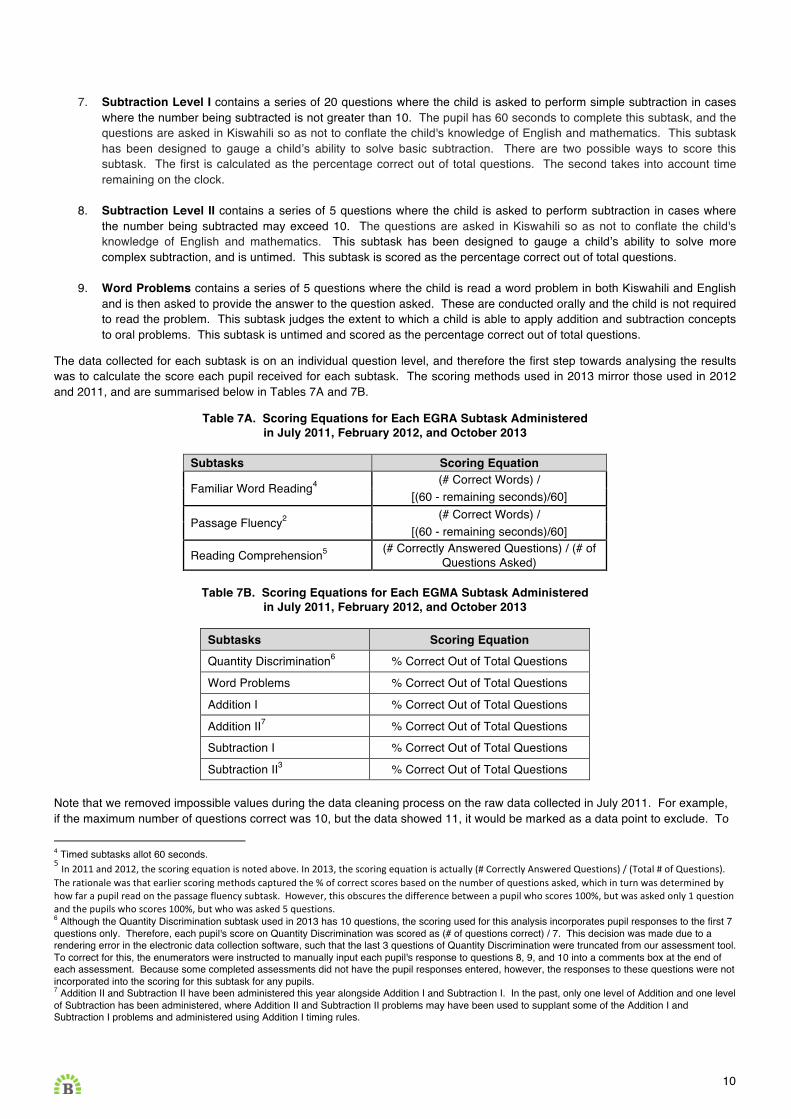
7. Subtraction Level I contains a series of 20 questions where the child is asked to perform simple subtraction in cases where the number being subtracted is not greater than 10. The pupil has 60 seconds to complete this subtask, and the questions are asked in Kiswahili so as not to conflate the child's knowledge of English and mathematics. This subtask has been designed to gauge a child’s ability to solve basic subtraction. There are two possible ways to score this subtask. The first is calculated as the percentage correct out of total questions. The second takes into account time remaining on the clock.
8. Subtraction Level II contains a series of 5 questions where the child is asked to perform subtraction in cases where the number being subtracted may exceed 10. The questions are asked in Kiswahili so as not to conflate the child's knowledge of English and mathematics. This subtask has been designed to gauge a child’s ability to solve more complex subtraction, and is untimed. This subtask is scored as the percentage correct out of total questions.
9. Word Problems contains a series of 5 questions where the child is read a word problem in both Kiswahili and English and is then asked to provide the answer to the question asked. These are conducted orally and the child is not required to read the problem. This subtask judges the extent to which a child is able to apply addition and subtraction concepts to oral problems. This subtask is untimed and scored as the percentage correct out of total questions.
The data collected for each subtask is on an individual question level, and therefore the first step towards analysing the results was to calculate the score each pupil received for each subtask. The scoring methods used in 2013 mirror those used in 2012 and 2011, and are summarised below in Tables 7A and 7B.
Table 7A. Scoring Equations for Each EGRA Subtask Administered in July 2011, February 2012, and October 2013
Subtasks Scoring Equation
Familiar Word Reading4 (# Correct Words) /
[(60 - remaining seconds)/60]
Passage Fluency2 (# Correct Words) /
[(60 - remaining seconds)/60]
Reading Comprehension5 (# Correctly Answered Questions) / (# of Questions Asked)
Table 7B. Scoring Equations for Each EGMA Subtask Administered
in July 2011, February 2012, and October 2013
Subtasks Scoring Equation
Quantity Discrimination6 % Correct Out of Total Questions
Word Problems % Correct Out of Total Questions
Addition I % Correct Out of Total Questions
Addition II7 % Correct Out of Total Questions
Subtraction I % Correct Out of Total Questions
Subtraction II3 % Correct Out of Total Questions Note that we removed impossible values during the data cleaning process on the raw data collected in July 2011. For example, if the maximum number of questions correct was 10, but the data showed 11, it would be marked as a data point to exclude. To
4 Timed subtasks allot 60 seconds. 5 In 2011 and 2012, the scoring equation is noted above. In 2013, the scoring equation is actually (# Correctly Answered Questions) / (Total # of Questions). The rationale was that earlier scoring methods captured the % of correct scores based on the number of questions asked, which in turn was determined by how far a pupil read on the passage fluency subtask. However, this obscures the difference between a pupil who scores 100%, but was asked only 1 question and the pupils who scores 100%, but who was asked 5 questions. 6 Although the Quantity Discrimination subtask used in 2013 has 10 questions, the scoring used for this analysis incorporates pupil responses to the first 7 questions only. Therefore, each pupil's score on Quantity Discrimination was scored as (# of questions correct) / 7. This decision was made due to a rendering error in the electronic data collection software, such that the last 3 questions of Quantity Discrimination were truncated from our assessment tool. To correct for this, the enumerators were instructed to manually input each pupil's response to questions 8, 9, and 10 into a comments box at the end of each assessment. Because some completed assessments did not have the pupil responses entered, however, the responses to these questions were not incorporated into the scoring for this subtask for any pupils. 7 Addition II and Subtraction II have been administered this year alongside Addition I and Subtraction I. In the past, only one level of Addition and one level of Subtraction has been administered, where Addition II and Subtraction II problems may have been used to supplant some of the Addition I and Subtraction I problems and administered using Addition I timing rules.

11
determine if exclusions were made due to impossible values in previous years, Bridge and DMC reviewed the raw data and hard-copy surveys as part of the data cleaning process. In October 2013, impossible values did not pose an issue for most fields, as electronic data collection software prevented the input of these values.8
2011 Baseline Test Scores
In addition to examining pupil demographics and home life information for those pupils we tracked from 2011 through 2013, we also examined their 2011 baseline test scores to see if our pupils, on average, came into the study with a different set of skills and ability level. Unlike demographics and home life information, baseline test scores are one of the few characteristics that we have data on from 2011.
We found that in cases where systematic differences did exist across school types, Bridge pupils started out with lower baseline scores than their academic peers attending neighbouring schools. Results were more mixed for pupils baselined in Class 2 and tracked through Class 4.
In Class 2, where average baseline scores were statistically different, Bridge pupils started out scoring lower on both EGRA and EGMA subtasks. Bridge pupils scored lower at baseline on 3 out of 7 subtasks when compared to their public school peers. For the remaining subtasks, there were no systematic differences. Details can be seen in Table 8 below.
Table 8. Class 2 Baseline Test Scores by School Type and Subtask
Subtask Bridge Public B vs. P
Mean Count Mean Count Diff P-Value
Familiar Word Reading 1.69 107 7.03 30 -5.34 0.02 Passage Fluency 1.78 107 4.33 30 -2.56 0.19 Reading Comprehension 21.67% 15 12.50% 12 9.17% 0.50 Quantity Discrimination 48.22% 107 50.67% 30 -2.44% 0.70 Addition I 4.25% 107 10.33% 30 -6.08% 0.01 Subtraction I 3.79% 107 4.83% 30 -1.05% 0.50
Word Problems 10.28% 107 22.50% 30 -
12.22% 0.02
The same is true in for pupils who were baselined in Class 1 and are currently in Class 3. Bridge pupils started out scoring lower on 4 out of 7 subtasks as compared to their public school peers. For the remaining subtasks, there were no systematic differences. Details can be seen in Table 9 below.
Table 9. Class 3 Baseline Test Scores by School Type and Subtask
Subtask Bridge Public B vs. P
Mean Count Mean Count Diff P-Value
Familiar Word Reading 17.78 184 26.72 36 -8.94 0.05 Passage Fluency 14.85 184 23.96 36 -9.12 0.07 Reading Comprehension 20.06% 139 16.55% 31 3.52% 0.56 Quantity Discrimination 76.41% 184 80.56% 36 -4.14% 0.35
Addition I 23.07% 184 41.81% 36 -
18.73% 0.00 Subtraction I 13.32% 184 21.94% 36 -8.63% 0.00
Word Problems 25.68% 184 38.89% 36 -
13.21% 0.02
8 All administrations were conducted by DMC, so change in data integrity cannot be attributed to change in administrative governance. We hypothesise that invalid data is due to invigilator error that was eliminated through data validation procedures in electronic data collection.

12
However, for pupils who were baselined in Class 2 and are currently in Class 4, the results were more mixed. Bridge pupils started out scoring higher than their peers at public schools on 2 out of 3 EGRA subtasks. However, on 1 out of 4 EGMA subtasks, Bridge pupils scored lower. Details can be seen in Table 10 below.
Table 10. Class 4 Baseline Test Scores by School Type and Subtask
Subtask Bridge Public B vs. P
Mean Count Mean Count Diff P-Value
Familiar Word Reading 43.13 124 34.79 63 8.34 0.05 Passage Fluency 41.67 124 33.17 63 8.51 0.03 Reading Comprehension 46.69% 120 42.87% 53 3.82% 0.52 Quantity Discrimination 92.26% 124 90.16% 63 2.10% 0.43 Addition I 46.17% 124 52.70% 63 -6.53% 0.06 Subtraction I 23.63% 124 30.16% 63 -6.53% 0.01 Word Problems 36.29% 124 38.49% 63 -2.20% 0.63
This highlights the importance of collecting baseline score data and using analytical frameworks that take into account the starting level of pupils. If we look simply at absolute test score differences across school types, the results may be biased and not serve as an accurate reflection of the “Bridge effect.”
Analytical Framework
Our study was designed to analyse performance levels of pupils who attend Bridge academies versus their peers at neighboring schools. To ensure an accurate and unbiased comparison, it is important to take into account the ability levels of pupils at baseline. This guards against any differences in the initial distribution of pupil ability levels at each school. In other words, it does not matter if one school starts with a greater or lesser number of high- or low-performing pupils. Schools with more low-performing pupils are not automatically penalised, and those with more high-performing pupils are not automatically rewarded.
To accomplish this, we utilise the quasi-experimental methodology of difference-in-differences using both a panel and cross-sectional dataset.
The function of a difference-in-differences (DiD) model is to measure the effect of a given treatment. For our purposes, this type of model is useful because it allows us to estimate the “Bridge effect” – in other words, the change in pupil EGRA/EGMA performance as a result of attending Bridge – without having conducted a randomised experiment.
A DiD model isolates treatment effects by comparing the difference in outcome measures at two points in time for the treatment and control groups against one another. In other words, a DiD model takes the outcome measure at the first point in time for each group and subtracts it from the outcome measure at the second point in time for the same group. It then compares the within-group difference across the two groups to parse out the effect of the treatment. Average treatment effects are calculated as follows:
treatment effect = (Tt2 – Tt1) – (Ct2 – Ct1)
, where
Tt2 = treatment group outcome at second point in time Tt1 = treatment group outcome at first point in time Ct2 = control group outcome at second point in time Ct1 = control group outcome at first point in time
The estimation of treatment effects using a DiD model can also be depicted graphically, as shown in Figure 1 below. The red points represent the control group and the blue points represent the treatment group:

13
Figure 1. Estimating Treatment Effects Using DiD Approach
We can estimate treatment effects using a DiD model via either a simple difference in within-group differences or a regression framework. As compared to calculating the simple difference in within-group differences, a regression framework provides the added benefit of including extra control variables in the model. Without control variables added into the framework, the estimation of treatment effects using either method is the same.9
By construct, all DiD models require data at least two points in time. Without it, we cannot calculate the within-group difference, since this relies on data captured at the first and second points in time. There are two major types of data that can serve this function: (1) panel, which means information on the same pupils over time and (2) repeated cross-sectional, which means two sets of pupil-level information over time, where a subset may be the same pupils over time.
For the analyses presented in this memo, we chose to implement a repeated cross-sectional DiD model and a panel DiD model that controls for pupil baseline achievement. A detailed description of each of our selected model variations can be found in Appendices E, F, and G.
Results of the DiD Analyses
Repeated Cross Section DiD Analysis
A repeated cross-sectional DiD approach is unique in that the data for each time point included in this type of model need not come from the same individuals. This means that to implement a repeated cross-sectional DiD model, the pupils assessed at the first point in time need not be the exact same pupils as those assessed at the second point in time.
The benefit of using a repeated cross-sectional DiD approach for estimating treatment effects is that it allows us to maintain a relatively large sample size, despite attrition over time from our sample. Because this type of model enables us to include all pupils tested at the first point in time regardless of whether they eventually attrited, as well as all pupils tested at the second point in time regardless of whether they were assessed in the past, we avoid having to exclude pupils who were either (a) previously assessed but departed from our sample; or (b) assessed for the first time at the second time point. It can be thought of as the average effect of Bridge across all pupils who have attended Bridge in our sample, regardless of whether or not they stayed at Bridge (i.e. regardless of whether or not they continued the “treatment”).
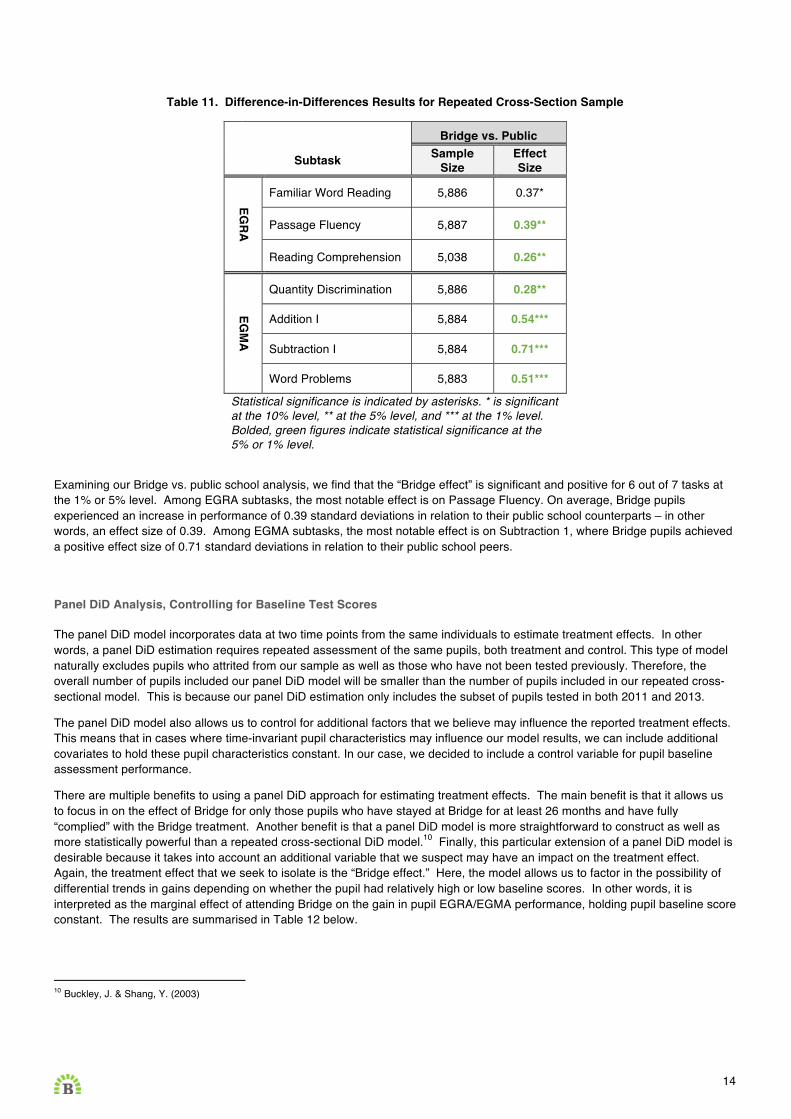
Results are summarised in Table 11 below.
9 DiD models ensure that any unobserved variables remaining constant over time that are associated with the outcome will not bias our estimation of treatment effects. However, it is important to note that in doing so, the model assumes that these unobserved variables would affect both the treatment and control groups equally. In other words, it assumes that if the treatment group had not received the treatment at all, its outcome would be the same as the outcome for the control group. Buckley, Jack & Yi Shang (2003). “Estimating policy and program effects with observational data: the ‘differences-in-differences’ estimator.” Practical Assessment, Research & Evaluation, 8(24). Retrieved from http://PAREonline.net/getvn.asp?v=8&n=24.
14
Table 11. Difference-in-Differences Results for Repeated Cross-Section Sample
Bridge vs. Public
Subtask Sample Size
Effect Size
EGRA
Familiar Word Reading 5,886 0.37*
Passage Fluency 5,887 0.39**
Reading Comprehension 5,038 0.26**
EGM
A
Quantity Discrimination 5,886 0.28**
Addition I 5,884 0.54***
Subtraction I 5,884 0.71***
Word Problems 5,883 0.51***
Statistical significance is indicated by asterisks. * is significant at the 10% level, ** at the 5% level, and *** at the 1% level. Bolded, green figures indicate statistical significance at the 5% or 1% level.
Examining our Bridge vs. public school analysis, we find that the “Bridge effect” is significant and positive for 6 out of 7 tasks at the 1% or 5% level. Among EGRA subtasks, the most notable effect is on Passage Fluency. On average, Bridge pupils experienced an increase in performance of 0.39 standard deviations in relation to their public school counterparts – in other words, an effect size of 0.39. Among EGMA subtasks, the most notable effect is on Subtraction 1, where Bridge pupils achieved a positive effect size of 0.71 standard deviations in relation to their public school peers.
Panel DiD Analysis, Controlling for Baseline Test Scores
The panel DiD model incorporates data at two time points from the same individuals to estimate treatment effects. In other words, a panel DiD estimation requires repeated assessment of the same pupils, both treatment and control. This type of model naturally excludes pupils who attrited from our sample as well as those who have not been tested previously. Therefore, the overall number of pupils included our panel DiD model will be smaller than the number of pupils included in our repeated cross-sectional model. This is because our panel DiD estimation only includes the subset of pupils tested in both 2011 and 2013.
The panel DiD model also allows us to control for additional factors that we believe may influence the reported treatment effects. This means that in cases where time-invariant pupil characteristics may influence our model results, we can include additional covariates to hold these pupil characteristics constant. In our case, we decided to include a control variable for pupil baseline assessment performance.
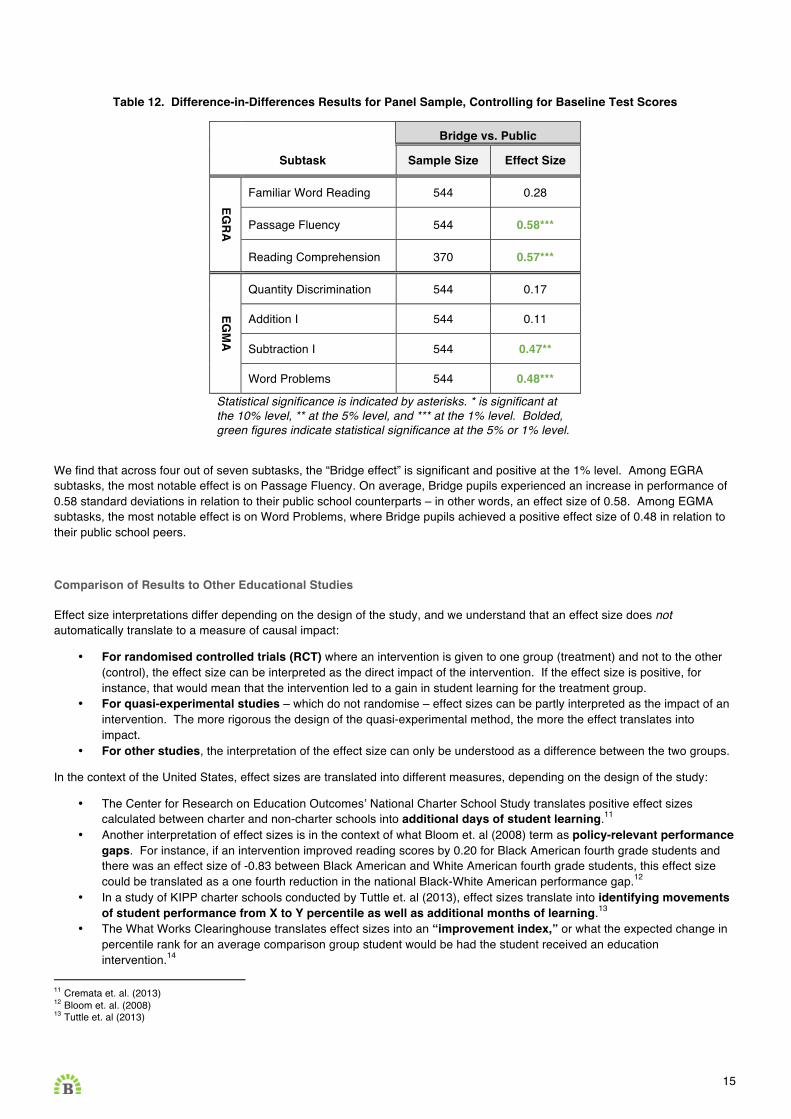
There are multiple benefits to using a panel DiD approach for estimating treatment effects. The main benefit is that it allows us to focus in on the effect of Bridge for only those pupils who have stayed at Bridge for at least 26 months and have fully “complied” with the Bridge treatment. Another benefit is that a panel DiD model is more straightforward to construct as well as more statistically powerful than a repeated cross-sectional DiD model.10 Finally, this particular extension of a panel DiD model is desirable because it takes into account an additional variable that we suspect may have an impact on the treatment effect. Again, the treatment effect that we seek to isolate is the “Bridge effect.” Here, the model allows us to factor in the possibility of differential trends in gains depending on whether the pupil had relatively high or low baseline scores. In other words, it is interpreted as the marginal effect of attending Bridge on the gain in pupil EGRA/EGMA performance, holding pupil baseline score constant. The results are summarised in Table 12 below.
10 Buckley, J. & Shang, Y. (2003)
15
Table 12. Difference-in-Differences Results for Panel Sample, Controlling for Baseline Test Scores
Bridge vs. Public
Subtask Sample Size Effect Size
EGRA
Familiar Word Reading 544 0.28
Passage Fluency 544 0.58***
Reading Comprehension 370 0.57***
EGM
A
Quantity Discrimination 544 0.17
Addition I 544 0.11
Subtraction I 544 0.47**
Word Problems 544 0.48***
Statistical significance is indicated by asterisks. * is significant at the 10% level, ** at the 5% level, and *** at the 1% level. Bolded, green figures indicate statistical significance at the 5% or 1% level.
We find that across four out of seven subtasks, the “Bridge effect” is significant and positive at the 1% level. Among EGRA subtasks, the most notable effect is on Passage Fluency. On average, Bridge pupils experienced an increase in performance of 0.58 standard deviations in relation to their public school counterparts – in other words, an effect size of 0.58. Among EGMA subtasks, the most notable effect is on Word Problems, where Bridge pupils achieved a positive effect size of 0.48 in relation to their public school peers.
Comparison of Results to Other Educational Studies
Effect size interpretations differ depending on the design of the study, and we understand that an effect size does not automatically translate to a measure of causal impact:
• For randomised controlled trials (RCT) where an intervention is given to one group (treatment) and not to the other (control), the effect size can be interpreted as the direct impact of the intervention. If the effect size is positive, for instance, that would mean that the intervention led to a gain in student learning for the treatment group.
• For quasi-experimental studies – which do not randomise – effect sizes can be partly interpreted as the impact of an intervention. The more rigorous the design of the quasi-experimental method, the more the effect translates into impact.
• For other studies, the interpretation of the effect size can only be understood as a difference between the two groups.
In the context of the United States, effect sizes are translated into different measures, depending on the design of the study:
• The Center for Research on Education Outcomes’ National Charter School Study translates positive effect sizes calculated between charter and non-charter schools into additional days of student learning.11
• Another interpretation of effect sizes is in the context of what Bloom et. al (2008) term as policy-relevant performance gaps. For instance, if an intervention improved reading scores by 0.20 for Black American fourth grade students and there was an effect size of -0.83 between Black American and White American fourth grade students, this effect size could be translated as a one fourth reduction in the national Black-White American performance gap.12
• In a study of KIPP charter schools conducted by Tuttle et. al (2013), effect sizes translate into identifying movements of student performance from X to Y percentile as well as additional months of learning.13
• The What Works Clearinghouse translates effect sizes into an “improvement index,” or what the expected change in percentile rank for an average comparison group student would be had the student received an education intervention.14
11 Cremata et. al. (2013) 12 Bloom et. al. (2008) 13 Tuttle et. al (2013)
16
Effect sizes in education are also often compared against an “industry benchmark.” In the U.S. context, an effect size of 0.25 standard deviations is used by the What Works Clearinghouse as the benchmark for an effective program with meaningful impacts.15
With multiple results showing an effect size greater than 0.25, it is clear that the Bridge is delivering meaningful impact.
Effect Sizes of Other Educational Interventions
We examine effect sizes from other educational interventions in Table 15 below. Despite each study’s operation in very different contexts, comparability is maintained with the common adoption of rigorous evaluation methods and the use of effect sizes for reporting results.
We find that other major educational interventions yield effect sizes ranging from 0.17 to 0.39. It is noteworthy that nearly all these interventions, with the exception of the KIPP Middle Schools study16, are randomised controlled trials. Therefore, their effect sizes can be interpreted as causal impact. Although the KIPP Middle Schools study was not an RCT, the evaluators were able to take advantage of a natural experiment that allowed them to separately validate their main results. Therefore, the study design is such that its effect sizes closely approach an impact estimate.17
14 What Works Clearinghouse (2008) 15 What Works Clearinghouse (2008). One of the most commonly cited benchmarks for gauging how large an effect size is comes from Cohen’s paper (1988), whereby he lays out 0.20 as a small effect size, 0.60 as a medium effect size, and 0.80 as a large effect size. Other researchers, however, have argued that these benchmarks are not based on specific empirical cases and that practical measures of effect size should be contextualised appropriately depending on the purpose of the intervention. See Bloom et. al. (2008). 16 Tuttle et. al. (2012) 17 In the absence of a cost-effective means of conducting an RCT, researchers will sometimes use a matched DiD approach to nonetheless improve the rigour of their study. A matched DiD approach entails identifying and using a comparison group that has similar (if not close to identical) traits to the treatment group (in the Bridge context, these would be Bridge pupils). Researchers use propensity score matching to identify students for the comparison group based on demographics information and baseline achievement that aligned with the treatment group’s students. In the KIPP Middle School study, the sample was approximately 30,000 pupils and required the collection of an extensive amount of demographic data. While this is a much more rigorous design, it also requires a much larger sample pool of pupils to go through and identify accurate matches for our pupils. We have considered this approach, but it is not appropriate or feasible given that we did not yet have available baseline demographic information, nor do we have a large enough sample to establish propensity score matches.

17
Table 15. Effect Sizes for Selected Education Interventions
Study (Country) Study Design & Intervention Time Period
Effect Size – Reading
Effect Size – Math
KIPP Middle Schools (U.S.A.) Tuttle et. al (2013)
Matched comparison study; enrolment in a KIPP charter school 3 years 0.21 0.36
Teacher Performance Pay (India) Muralidharan and Sundararaman (2011)
RCT; receipt of group bonus based on school performance or receipt of individual bonus based on teacher performance
2 years 0.17 0.27
Merit Scholarship Program for Girls (Kenya) Kremer et al. (2004)
RCT; receipt of scholarship covering school fees and cash grant for school supplies
2 years
0.2 to 0.3 (across multiple subjects, including English and Math)
Primary Math and Reading (PRIMR) Initiative, Midline Results (Kenya) Piper and Mugenda (2013)
RCT; provision of low-cost books to each pupil, targeted lesson plans, training on lesson delivery, and instructional support
9 months 0.23 (Class 1, English) 0.34 (Class 2, English)
Primary Math and Reading (PRIMR) Initiative18, Endline Results (Kenya) Piper and Mugenda (2014)
RCT; provision of low-cost books to each pupil, targeted lesson plans, training on lesson delivery, and instructional support
21 months 0.47 (Class 1, English) 0.49 (Class 2, English) 0.46 (Overall, English)
0.16 (Class 1, Math) 0.26 (Class 2, Math) 0.20 (Overall, Math)
Bridge International Academies (Kenya) 19
Quasi-experimental study (repeated cross-sectional difference-in-differences); enrolment in a participating Bridge International Academy or neighbouring school in the greater Nairobi area.
26 months (July 2011 cohort)
0.32 (Overall, English)
0.51 (Overall, Math)
19 Figures here are based on repeated cross-sectional difference-in-differences analyses. To get the effect size for Reading, we averaged effect sizes for 2 EGRA subtasks: Passage Fluency and Reading Comprehension. To get the effect size for Math, we averaged effect sizes for 4 EGMA subtasks: Quantity Discrimination, Addition I, Subtraction I, and Word Problems. We used a 5% level of statistical significance here.

18
Presenting Results to Our Clients
To present our findings to our parents and other stakeholders in a more accessible manner, we can translate our effect sizes back into scoring terms used for each subtask. However, there are three additional steps we must take. The first (1) is equating our assessment scores so that results are comparable across survey instrument versions. The second (2) is taking the Bridge effect size for each subtask and converting that result back into metrics that line up with the subtask’s scoring methods. The third (3) is translating our effect sizes into days of learning.
Equating Instrument Versions
When designing follow-up subtask instruments, RTI slightly increases the level of difficulty in order to reflect pupil learning that should have occurred during the time period between each administration period. This means that for any given set of instruments, the mid-line instrument is slightly harder than the baseline instrument, and the end-line instrument is slightly harder than the mid-line instrument in order to adjust for pupil learning over time.
To account for this differing level of difficulty in their subtask instruments, RTI equates each subtask to the baseline assessment so that the results are directly comparable to one another. The majority of the subtask instruments we used to evaluate pupils during this year's EGRA/EGMA administration come from RTI's PRIMR mid-line evaluation. In order to appropriately compare our 2013 results to those contained in the PRIMR reports, we should equate our results using RTI's equating measures.
In general, when using different subtask instruments from year to year (as is the case between our 2011 baseline and 2013 follow-up administrations), the follow-up instruments should be equated to the baseline in order to account for any changes in difficulty. The easiest way to circumvent having to conduct this process on our own is to either (a) use the same instruments from year to year; or (b) to use a set of baseline and follow-up instruments created and equated by RTI. The caveat to (b) is that we are only able to obtain a very limited number of equating figures (a few for EGRA but none for EGMA).20
Translation of Results
From the standpoint of comparing the magnitude of any potential "Bridge effect" across subtasks, reporting subtask results in terms of effect sizes is preferable. This is because doing so allows us to report all results in terms of the same unit – standard deviations – instead of by each subtask's individual scoring method. It also eases comparison of our results to other studies and is appropriate for academic audiences.
However, reporting our results only as effect sizes may not be the most intuitive approach, especially to our parents. To deal with this, we can convert our effect size results back into their typical unit of measurement – for example, the number of correct words per minute, or percentage correct out of total questions asked.
Consider the example of Passage Fluency. We can convert each of our effect size results back into non-standardised units by multiplying our effect size by the (non-standardised) pooled standard deviation. The results can then be read in the following way:
Using our repeated cross-sectional model, we found that Bridge pupils experience a gain in subtask performance of 16.36 words per minute above and beyond their public school peers when controlling for grade level and year of testing. Recall that this includes all pupils tested in 2011 regardless of whether they eventually attrited, as well as all pupils tested in 2013 regardless of whether they were assessed in the past. Using our panel data model that controls for baseline test score, we found that Bridge pupils experience a gain in subtask performance of over 20 words per minute above and beyond their public school peers when controlling for grade level and baseline test score. This model includes only those pupils who were baselined in 2011 and followed through 2013.
Unfortunately, we are only presently able to translate our results into such terms for a very limited number of subtasks. The reason for this is because not all subtasks have been equated by RTI.
20 Generally, equating subtasks is a costly endeavor that can be avoided by using the same instrument across both baseline and endline assessment rounds. Since assessment rounds are about one year apart and conducted by external assessors, we do not believe that learning from the test or cheating are significant concerns.

19
Another way to translate effect sizes into a more assessable figure is to convert the standard deviations in growth to days of learning. The Stanford CREDO study of charters schools published in 2013 offers the following conversion table21:
Table 16. Transformation of Average Learning Gains22
Based on this conversion table and our cross-sectional difference-in-differences methodology, our average reading effect size of .32 translates into almost 252 additional days of learning. Our average maths effect size of .51 translates into over 288 additional days of learning. If we examine our pupil-matched results from our panel difference-in-differences methodology, controlling for baseline test scores, our average effect size of 0.58 on reading fluency and comprehension translate into over 288 additional days of learning. Advanced maths at .47 and .48 for subtraction and word problems, respectively, translates into over 288 additional days of learning as well. While it is important to know that these transformations are based on data from the US, it is our best source of information to convert our findings into days of learning. Such research focused on developing a transformation table for only Kenya or other developing countries has not been conducted to the best of our knowledge.
Concluding Thoughts
EGRA/EGMA is one of the key external assessments used by Bridge International Academies to measure and support our pupils' academic performance. Performance on different EGRA/EGMA subtasks highlights areas in which our pupils excel when compared to their peers at neighboring schools, and areas in which we will continue to strive for excellence.
Comparing the cohort of pupils assessed in 2011 to their associated grade cohort in 2013 in the exact same schools, we found that attending Bridge had a significant effect on learning for pupils now in Classes 2 through 4. Compared to their peers attending public schools, Bridge pupils on average gained an additional .32 standard deviations on reading fluency and comprehension. For reading fluency, this translates into a gain of 16 words per minute, above and beyond the growth experienced by their academic peers. The Bridge effect size for maths is also significant – both on a practical and statistical level – at .51 standard deviations.
We also examined the sub-sample of pupils whom we tracked over the course of 26 months. In the 2013 administration of Bridge’s EGRA/EGMA programme, DMC successfully tracked and assessed 544 out of 1,359 pupils from the July 2011 cohort. Given these pupils’ incoming skill and ability levels, we found that Bridge pupils on average gained an additional .38 standard deviations on reading fluency and comprehension. The Bridge effect size for more advanced maths is also significant at .47 and .48 standard deviations for subtraction and word problems, respectively.
This study also yields a few additional takeaways:
21 Cremata, E. et al (2013). The authors note that the table “[…] shows a sample of standard deviations and their associated days of learning. Positive standard deviations are expressed as additional days of learning; negative standard deviations are associated with fewer days of learning. For those wanting to convert these larger counts into weeks or months: a school week consists of five days, a school month is 20 days, and a quarter or 9-weeks term is typically 45 days. While transforming the statistical results into days of learning provides a more accessible measure, the days of learning are only an estimate and should be used as general guide rather than as empirical transformations.” 22 See page 13. Cremata, E. et al (2013).

20
• The “Bridge effect” is pronounced against public schools. Using our DiD model, we found that Bridge pupils experience significant gains in EGRA/EGMA performance for a greater number of subtasks when compared to their public school peers. This is true regardless of pupil grade level, year of testing, or baseline test score.
• We found statistically significant effect sizes using the repeated cross-section DiD model. Bridge pupils experience a significant gain in subtask score as compared to their public school peers across 6 out of 7 subtasks when looking at the cross-sectional model. Sample size is undoubtedly a contributor.
• The magnitude of the effect tends to be largest for English when using the panel DiD controlling for baseline test scores. When looking strictly at the tracked sub-sample that has received the “full effect”, Bridge pupils experience a gain in subtask performance of over 20 words per minute above and beyond their public school peers when controlling for grade level and baseline test score. This is in contrast to the equivalent repeated cross-sectional specification, which shows a gain of 16 words per minute. This implies that for pupils we are able to track through time, the magnitude of the effect is larger. This is likely due to the fact that using the panel DiD estimation, we are following the same exact pupils through time. By contrast, with the repeated cross-sectional model, we use data from all pupils tested in 2011 and all pupils tested in 2013. Therefore, it is possible that when using our repeated cross-sectional model that our two time-based cohorts of pupils are not equal in in their makeup, with our entire cohort of pupils tested in 2013 performing lower as compared to the subset of pupils tested all three years.
We understand that the results presented here are not yet fully generalizable to our current network, and that with the expansion of any business, the ability to maintain product quality is a concern. The geographic spread for the July 2011 baseline sample was limited to the greater Nairobi area because this was the predominant Bridge market at the time. Now that Bridge has expanded beyond the greater Nairobi area, so has the EGRA/EGMA programme. We are now tracking over 8,000 pupils across 170 schools and 17 counties in Kenya.
The results presented in this study, combined with Bridge’s internal assessments such as unit tests and end-of-term exams, will be used to inform changes to curricula across classes. They help us move closer to our ultimate goal: to provide our pupils with the highest quality of education possible.

21
References
Bloom, H.S., et. al. (2008). “Performance Trajectories and Performance Gaps as Achievement Effect-Size Benchmarks for Educational Interventions” In Journal of Research on Educational Effectiveness 1: 289-328.
Cohen, J. (1988). Statistical power analysis for the behavioral sciences (2nd ed.). Hillsdale, NJ: Erlbaum. Cremata, E. et al (2013). National Charter School Study. Stanford: Center for Research on Education Outcomes.
Gong, E. (2009). Differences-in-differences [PowerPoint presentation]. Available at www.ocf.berkeley.edu/~garret/decal/dnd_slides09.pptx.
Buckley, J. & Shang, Y. (2003). “Estimating policy and program effects with observational data: the ‘differences-in-differences’ estimator.” Practical Assessment, Research & Evaluation, 8(24). Available at http://PAREonline.net/getvn.asp?v=8&n=24.
Kremer, M. et al. (2004). Incentives to Learn. Available at http://www.nber.org/papers/w10971
Muralidharan, K. and Sundararaman, V. (2011). “Teacher Performance Pay: Experimental Evidence from India” in Journal of Political Economy 119 (1): 39-77.
Piper, Benjamin and Abel Mugenda (2013). The Primary Math and Reading (PRIMR) Initiative: Midterm Impact Evaluation. Nairobi: Research Triangle Institute.
Schneider, A. et. al. (2010). “Linear Regression Analysis” In Dtsch Arztebl Int. 107(44): 776–782. Mainz: Johannes Gutenberg University. Available at http://www.ncbi.nlm.nih.gov/pmc/articles/PMC2992018/
Tuttle, C.C. et. al (2013). KIPP Middle Schools: Impacts on Achievement and Other Outcomes. Washington, D.C.: Mathematica Policy Research.
Valentine, J. C. and Cooper, H. (2003). Effect size substantive interpretation guidelines: Issues in the interpretation of effect sizes. Washington, DC: What Works Clearinghouse.
What Works Clearinghouse (2008). “Procedures and Standards Handbook (Version 2.0).” Washington, DC: What Works Clearinghouse.
22
Appendix
A. Demographics and Home Life Differences, by Variable
Age
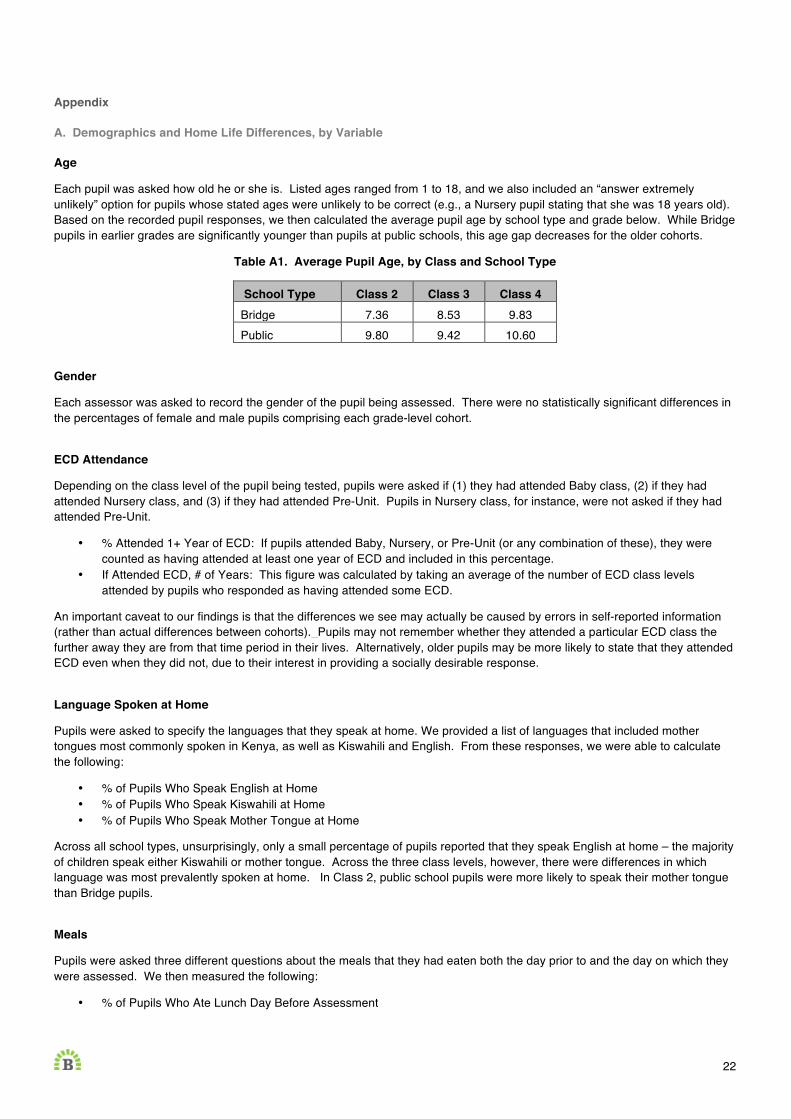
Each pupil was asked how old he or she is. Listed ages ranged from 1 to 18, and we also included an “answer extremely unlikely” option for pupils whose stated ages were unlikely to be correct (e.g., a Nursery pupil stating that she was 18 years old). Based on the recorded pupil responses, we then calculated the average pupil age by school type and grade below. While Bridge pupils in earlier grades are significantly younger than pupils at public schools, this age gap decreases for the older cohorts.
Table A1. Average Pupil Age, by Class and School Type
School Type Class 2 Class 3 Class 4 Bridge 7.36 8.53 9.83 Public 9.80 9.42 10.60
Gender
Each assessor was asked to record the gender of the pupil being assessed. There were no statistically significant differences in the percentages of female and male pupils comprising each grade-level cohort.
ECD Attendance
Depending on the class level of the pupil being tested, pupils were asked if (1) they had attended Baby class, (2) if they had attended Nursery class, and (3) if they had attended Pre-Unit. Pupils in Nursery class, for instance, were not asked if they had attended Pre-Unit.
• % Attended 1+ Year of ECD: If pupils attended Baby, Nursery, or Pre-Unit (or any combination of these), they were counted as having attended at least one year of ECD and included in this percentage.
• If Attended ECD, # of Years: This figure was calculated by taking an average of the number of ECD class levels attended by pupils who responded as having attended some ECD.
An important caveat to our findings is that the differences we see may actually be caused by errors in self-reported information (rather than actual differences between cohorts). Pupils may not remember whether they attended a particular ECD class the further away they are from that time period in their lives. Alternatively, older pupils may be more likely to state that they attended ECD even when they did not, due to their interest in providing a socially desirable response.
Language Spoken at Home
Pupils were asked to specify the languages that they speak at home. We provided a list of languages that included mother tongues most commonly spoken in Kenya, as well as Kiswahili and English. From these responses, we were able to calculate the following:
• % of Pupils Who Speak English at Home • % of Pupils Who Speak Kiswahili at Home • % of Pupils Who Speak Mother Tongue at Home
Across all school types, unsurprisingly, only a small percentage of pupils reported that they speak English at home – the majority of children speak either Kiswahili or mother tongue. Across the three class levels, however, there were differences in which language was most prevalently spoken at home. In Class 2, public school pupils were more likely to speak their mother tongue than Bridge pupils.
Meals
Pupils were asked three different questions about the meals that they had eaten both the day prior to and the day on which they were assessed. We then measured the following:
• % of Pupils Who Ate Lunch Day Before Assessment

23
• % of Pupils Who Ate Dinner Day Before Assessment • % of Pupils Who Ate Breakfast on Morning of Assessment
There was no difference in the proportion of pupils who had each type of meal (lunch the day before, dinner the day before, and breakfast the day of) across different school types. Only in Class 3 did we see a small difference: approximately 2.7% more public school pupils had lunch the day before than did Bridge pupils.
Reading at Home
Pupils were asked if someone reads with them at home, and if so, whom (e.g., mother, father, grandparent, etc.). We used pupil responses to calculate the following across cohorts:
• % of Pupils Who Reported Someone Reads to Them at Home • If Someone Reads, % of Pupils Who Reported Either Mother or Father
There were larger percentages of Bridge pupils in Classes 3 and 4 who had their parents read with them, as compared to public school pupils.
Homework Assistance
Pupils were asked if someone assists them with their homework, and if so, whom (e.g., mother, father, grandparent, etc.). We used pupil responses to calculate the following across cohorts:
• % of Pupils Who Reported Someone Helps Them with Homework • If Someone Helps, % of Pupils Who Reported Either Mother or Father
Across all three cohorts and three classes, Bridge pupils’ parents were more likely to be involved in helping their children with their homework.
Radio
Pupils were asked a series of questions about radios: (1) does the pupil have a radio in his or her home, (2) does the pupil listen to the radio, and (3) if so, who does the pupil listen to the radio with (e.g., mother, father, uncle, grandparent, and/or friend). We used pupil responses to calculate the following across cohorts:
• % of Pupils Who Have a Radio • % of Pupils Who Listen to the Radio • If Pupil Listens to the Radio, % of Pupils Who Reported Either with Mother or Father
Bridge pupils appeared more likely to own radios than public school kids. This information on radio ownership serves as a helpful proxy for measuring pupil income.
Television
Pupils were asked a series of questions about televisions, including the following: (1) does the pupil have a TV in his or her home, (2) does the pupil watch TV, and (3) if so, who does the pupil listen to the TV with (e.g., mother, father, uncle, grandparent, and/or friend). We used pupil responses to calculate the following across cohorts:
• % of Pupils Who Have a TV • % of Pupils Who Watch TV • If Pupil Watches TV, % of Pupils Who Reported Either with Mother or Father
Across all cohorts and classes, there was no difference in the percentage of pupils who have a television or the percentage of pupils who watch television. This absence of difference underscores the fact that television ownership is a sign of prestige and status, particularly in low-income communities, and therefore most families own one.
Electricity
Pupils were asked if they have electricity in their homes. We used pupil responses to calculate the following across cohorts:

24
• % of Pupils Who Have Electricity at Home
Across all three cohorts and classes, there was no difference in the percentage of pupils who reported having electricity in their homes. Furthermore, more than 90% of sampled pupils reported having electricity.

25
B. Demographics and Home Life Differences, by Class Level
Table B1. Comparison of Demographics by Class Level in 2013
Variable Class 2 Class 3 Class 4 Pupil Age Bridge pupils were, on average, 2.4 years younger than
their public school counterparts. Bridge pupils were, on average, nearly one year younger than their public school counterparts.
There was no difference in the average pupil age between cohorts.
Pupil Sex: Male %
There was no difference in the percentage of male pupils between cohorts.
There was no difference in the percentage of male pupils between cohorts.
There was no difference in the percentage of male pupils between cohorts.
Pupil Sex: Female %
There was no difference in the percentage of female pupils between cohorts.
There was no difference in the percentage of female pupils between cohorts.
There was no difference in the percentage of female pupils between cohorts.
ECD Attendance
There were no differences in ECD attainment between cohorts.
There were no differences in ECD attainment between cohorts.
Between Bridge and public school pupils, Bridge pupils were more likely to have attended ECD. Among pupils who attended ECD, Bridge pupils had an additional 0.6 years of ECD.
Language spoken at home
Between Bridge and public school pupils, more public school pupils spoke their mother tongue at home (we determined this from looking at the proportion of children who spoke their mother tongue in the sample).
A larger percentage of Bridge pupils spoke English at home than public school pupils.
There were no differences between the three cohorts in the percentage of pupils who spoke English, Kiswahili, and mother tongue at home.
Meals There were no differences between cohorts in percentages of pupils who ate lunch and dinner the day before the assessment and of pupils who ate breakfast the morning of the assessment.
Only in Class 3 did we see a small difference: approximately 2.7% more public school pupils had lunch the day before than did Bridge pupils.
There were no differences between cohorts in percentages of pupils who ate lunch and dinner the day before the assessment and of pupils who ate breakfast the morning of the assessment.
Reading at Home
There were no differences between cohorts in terms of pupils who had someone who read with them at home and in terms of pupils who indicated that their mothers and fathers read with them at home.
There was a higher percentage of public school pupils who had someone who read with them at home than for Bridge pupils. Among pupils who had someone who read with them at home, however, there was a larger percentage of Bridge pupils who had their mother or father read with them than for public school pupils.
Among pupils who had someone to read with them at home, there was a larger percentage of Bridge pupils who had their mother or father read with them than for public school pupils.
Homework Assistance
There were no differences between the percentages of pupils who had someone help them with their homework; however, among pupils who did have someone assist them with their homework, a larger percentage of Bridge pupils reported that their parents provided assistance than public school pupils did.
There were no differences between the percentages of pupils who had someone help them with their homework; however, among pupils who did have someone assist them with their homework, a larger percentage of Bridge pupils reported that their parents provided assistance than public school pupils did.
There were no differences between the percentages of pupils who had someone help them with their homework; however, among pupils who did have someone assist them with their homework, a larger percentage of Bridge pupils reported that their parents provided assistance than public school pupils did.
Radio There was a higher percentage (31%) of Bridge pupils who had a radio in their homes than did their public school pupils. Among pupils who listened to the radio, there was no difference in the percentage of parents who listened with their parents between the different types of schools.
There were higher percentages of Bridge pupils who had a radio (20%) in their homes and who listened to the radio (20%) than did their public school peers. However, among pupils who listened to the radio, there was no difference in the percentage of parents who listened with their parents between the different types of schools.
There was a higher percentage (17%) of Bridge pupils who had a radio in their homes than did their public school peers. However, there was no difference across the school types in the percentage of pupils who listened to the radio and those who listened to the radio with their parents.
Television There were no differences in the percentages of pupils who had a television, of pupils who watched television, and of pupils who watched television with their parents.
There was no difference in the percentages of pupils who had a television and of pupils who watched television.
There were no differences in the percentages of pupils who had a television, of pupils who watched television, and of pupils who watched television with their parents.
Electricity There was no difference between cohorts in the percentage of pupils who had electricity in their homes.
There was no difference between cohorts in the percentage of pupils who had electricity in their homes.
There was no difference between cohorts in the percentage of pupils who had electricity in their homes.

26
C. Pupil Counts by School and Class Level
Table C1. Pupils Baselined in 2011, Assessed in 2012, To Assess in 2013 (By Expected Grade Level in 2013)
# School Type Location Standard 2 Standard 3 Standard 4 Total 1 Bridge Baba Dogo 7 5 3 15 2 Bridge Kiambiu 12 9 15 36 3 Bridge Dandora 5 8 12 3 23 4 Bridge Dandora 4 5 2 5 12 5 Bridge Diamond 9 14 8 31 6 Bridge Gatina 11 12 6 29 7 Bridge Kingston 22 47 40 109 8 Bridge Kwa Njenga 6 4 1 11 9 Bridge Korogocho 20 26 20 66
10 Bridge Kwa Reuben 10 17 13 40 11 Bridge Kiserian 10 21 17 48 12 Bridge Kayole Corner 15 19 27 61 13 Bridge Kirathimo 13 12 10 35 14 Bridge Lunga Lunga 13 53 34 100 15 Bridge Kamirithu 5 24 15 44 16 Bridge Gumba 10 7 9 26 17 Bridge Machakos 9 6 3 18 18 Bridge Mosque 13 17 16 46 19 Bridge Maili Saba 5 12 5 22 20 Bridge Matopeni 11 5 6 22 21 Bridge Mwimuto 5 14 12 31 22 Bridge Satellite 10 17 13 40 23 Bridge Sinai 17 17 20 54 24 Bridge Kiandutu 17 42 13 72 25 Bridge Tassia 9 13 11 33 26 Bridge Uthiru 9 13 9 31 27 Public [Anonymised] 53 68 53 174 28 Public [Anonymised] 26 46 58 130
Total 360 554 445 1,359
27
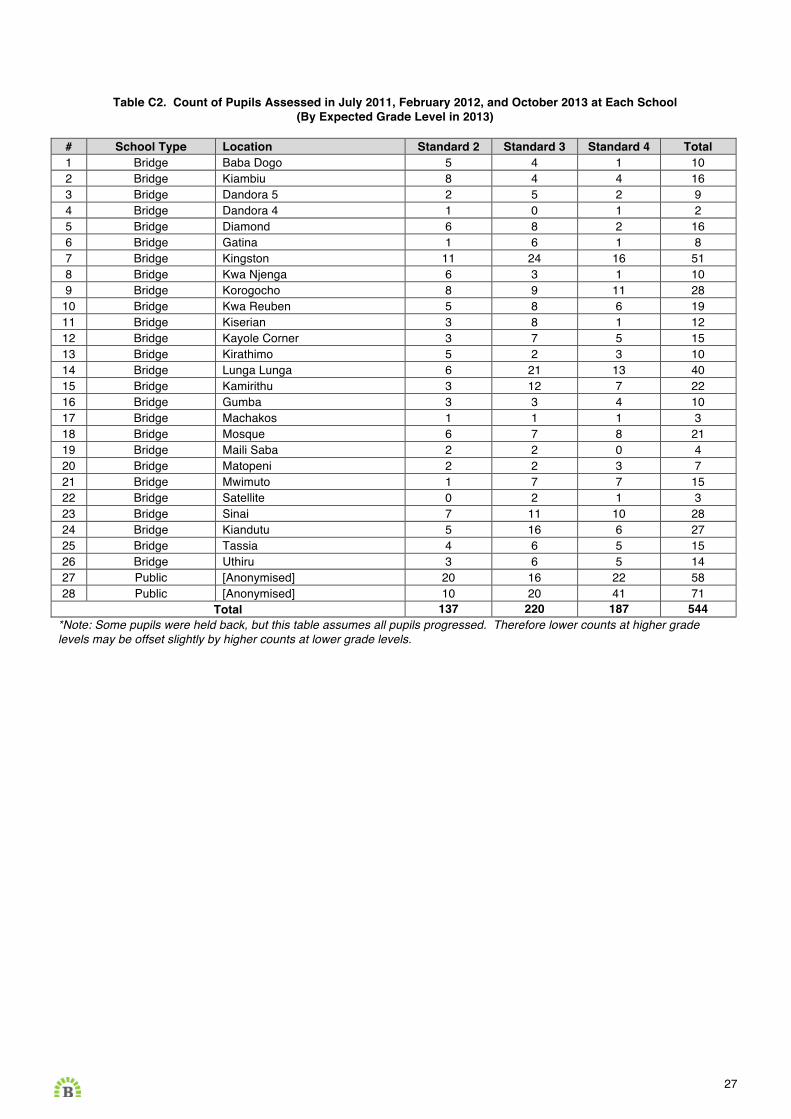
Table C2. Count of Pupils Assessed in July 2011, February 2012, and October 2013 at Each School (By Expected Grade Level in 2013)
# School Type Location Standard 2 Standard 3 Standard 4 Total 1 Bridge Baba Dogo 5 4 1 10 2 Bridge Kiambiu 8 4 4 16 3 Bridge Dandora 5 2 5 2 9 4 Bridge Dandora 4 1 0 1 2 5 Bridge Diamond 6 8 2 16 6 Bridge Gatina 1 6 1 8 7 Bridge Kingston 11 24 16 51 8 Bridge Kwa Njenga 6 3 1 10 9 Bridge Korogocho 8 9 11 28
10 Bridge Kwa Reuben 5 8 6 19 11 Bridge Kiserian 3 8 1 12 12 Bridge Kayole Corner 3 7 5 15 13 Bridge Kirathimo 5 2 3 10 14 Bridge Lunga Lunga 6 21 13 40 15 Bridge Kamirithu 3 12 7 22 16 Bridge Gumba 3 3 4 10 17 Bridge Machakos 1 1 1 3 18 Bridge Mosque 6 7 8 21 19 Bridge Maili Saba 2 2 0 4 20 Bridge Matopeni 2 2 3 7 21 Bridge Mwimuto 1 7 7 15 22 Bridge Satellite 0 2 1 3 23 Bridge Sinai 7 11 10 28 24 Bridge Kiandutu 5 16 6 27 25 Bridge Tassia 4 6 5 15 26 Bridge Uthiru 3 6 5 14 27 Public [Anonymised] 20 16 22 58 28 Public [Anonymised] 10 20 41 71
Total 137 220 187 544 *Note: Some pupils were held back, but this table assumes all pupils progressed. Therefore lower counts at higher grade levels may be offset slightly by higher counts at lower grade levels.

28
D. Monitoring and Data Quality Systems
To ensure that data collection occurred as scheduled and that the DMC team was conducting enough pupil assessments in each of the constituencies participating in the EGRA/EGMA assessment, the M&E team established a number of processes, detailed below, to monitor DMC’s daily progress.
1. Pupil Assessment Lists
The M&E team created pupil assessment lists for each of the different samples. DMC team leaders were responsible for completing these during their visits to each school in the sample groups, and completed lists served as one of the deliverables from DMC. The assessment lists aimed to capture the following information, which was then used to a) cross-check that data had not been falsified, b) match pupils, and c) identify schools that DMC needed to re-visit. This was particularly important for Follow-up pupils, where assessors also for the most part noted the reason for a pupil not being assessed (withdrawn, absent, etc.).
• Follow-up Pupils: Beginning and end times of assessment, unique randomly generated Tangerine ID, and assessor name.
• New Pupils: Pupil name, gender, unique randomly generated Tangerine ID, date and time assessment was completed, and assessor name.
2. Team Photo
Another deliverable for DMC was one photo of the team of DMC assessors with either the Academy Manager (at Bridge academies) or the head teacher (at comparison schools) on the first day of the team’s visit to a school. The purpose behind the photo was to serve as verification of DMC’s visit to schools (another check to ensure that data was not falsified). The photos were also used for the cover page of the EGRA/EGMA reports that all participating schools received.
3. Daily Data Downloads
The M&E team downloaded data from Tangerine twice a day during data collection: once at 3.00PM EAT / 8.00AM ET and once at 11.00PM EAT / 4.00PM ET. These downloads were also backed up to avoid data loss. Finally, the data was then sent to the DMC project manager for his own monitoring purposes to ensure that assessors were collecting and uploading data as scheduled. The M&E team used this data to check on which schools had or had not yet been visited.
4. Pupil Counts
Using the daily data downloads, the M&E team calculated the number of completed assessments at each school to determine pupil counts. Once these pupil counts had been tallied, short reports were sent to DMC to identify outstanding issues (i.e. missing data in Tangerine, schools scheduled to be visited had no assessments, etc.).
In addition to these monitoring systems, we also conducted re-assessments of pupils at over 30 different Bridge academies located in Nairobi, Nakuru, Bungoma, Eldoret, Kakamega, Kisii, Kisumu, and Nyamira. These re-assessments could only be conducted at Bridge academies as our staff would not be allowed to enter comparison schools for resurveys.
Re-assessments were conducted by members of the Bridge Academic Department, all of whom were trained on how to conduct EGRA/EGMA. The M&E team aimed to select a mix of academies and therefore took into consideration a mix of criteria, i.e. new versus existing academies (new = opened in Fall 2013).
Across the re-assessment sample, there was an approximately even distribution across classes and genders. The re-assessment data was then uploaded and compared to the original assessments completed by DMC assessors to flag issues of concern (e.g., shorter than average assessment times) to address with DMC.
29
E. Repeated Cross-Sectional DiD Specification and Regression Results
To conduct this analysis, we first had to prepare a different dataset:
• We created two data sets initially: one containing data for all pupils tested in 2011, and another containing data for all pupils tested in 2013.
• These were then appended into one larger dataset, where pupils who were tested in both years have two entries, one containing their 2011 score information and another containing their 2013 score information.
• From here, we standardised pupil score data within each subtask and year-based cohort. • Relevant variables required for running the cross-sectional analysis were then generated, including a treatment
variable, which contained a value of 1 for pupils attending Bridge and 0 otherwise; a time variable, which contained a value of 1 for 2013 test scores and 0 for 2011 test scores, and was multiplied by the treatment variable to generate an interaction term; and six (grade)*(time) dummy variables for parsing out individual treatment effects by grade level for a given test year.
After creating this separate dataset, we were prepared to run the actual analysis. The general linear equation used for estimating treatment effects with a repeated cross-sectional DiD model is:
outcome = β0 + β1(time) + β2(treatment) + β3(time*treatment) + ε
, where:
outcome = outcome measure for all units at both points in time β0 = constant term for all units β1 = adjustment for time β2 = adjustment for treatment group units, and β3 = effect of treatment
β1 and β2 can be interpreted as “holding all else constant.”23 In our case, our outcome measure is change in pupil performance on EGRA/EGMA, by subtask. As mentioned previously, the treatment effect that we seek to isolate is the “Bridge effect” – in other words, the marginal effect of attending Bridge on pupil performance, by subtask.
Our repeated cross-sectional DiD estimator is based on the above linear equation, with two key differences. The first difference is that our model specification incorporates interaction terms for each grade level and year of testing (see β3 through β9). These are used to parse out individual cohort effects for pupils in each grade level for each time point.24 The second difference is that our model specification drops out the constant term so that we are able to estimate the overall treatment effect and individual cohort effects, represented by each of our interaction terms, side-by-side.25 Our exact model specification is as follows26:
subtask score = β1(treatment) + β2(time*treatment) + β3(Pre-Unit_2011) + β4(Class 1_2011) + β5(Class 2_2011) + β6(Class 2_2013) + β7(Class 3_2011) + β8(Class 3_2013) + β9(Class 4_2013)+ ε
To run our model, we use STATA’s -reg- command, clustering at the school level and reporting robust standard errors. This method was selected for the following reasons:
• This is the most appropriate option given the structure of the data. Unfortunately, we did not implement a survey with an explicit sampling plan for pupils initially tested prior to 2013.27
• Clustering at the school level allows us to account for the fact that the EGRA/EGMA performance of pupils within a given school are more likely to be similar to one another than to the EGRA/EGMA performance of pupils at a different school.
23 Gong, E (2009) 24 Note that for the purposes of this analysis, pupil performance was analysed according to actual grade level, rather than their expected grade level. This means that for pupils who leapt ahead or repeated a grade, we are assuming that they have the same number of years of schooling as other pupils in their actual grade level. We know that this is not the case in reality, since pupils who leapt forward by one year would have one less year of schooling than their grade-level peers, and pupils who stayed back by one year would have one more year of schooling than their grade-level peers. However, for the purposes of parsing out the individual treatment effect of being in a particular grade at each time point, analysing the data according to actual grade level is the more accurate interpretation. 25 Regression models including dummy variables (i.e., binary variables coded as 0 or 1) will not run if all dummies are included alongside the constant term. By default, one of the dummies will be dropped. This is because the sum of the coefficients on the dummy variables is equal to the constant term. Therefore, to estimate both the overall treatment effect and the individual treatment effects for pupils in each grade level for each time point using the same model, we drop the constant term. 26 Given that the time variable has perfect collinearity with our interaction terms for each grade level and year of testing, we exclude it from our model specification. 27 Otherwise, we would have applied STATA’s -svy- command.

30
• Relatedly, using robust standard errors allows us to adjust our standard errors given the fact that our within-school performance data is correlated. This is important because otherwise, our standard errors could be off. In such a case, our significance tests would be invalid.28
We analysed the output generated from our repeated cross-sectional DiD model according to school type: Bridge vs. public schools. The results of our analyses for the variable of interest (the Bridge effect) are presented below. Note that for our study, the treatment is Bridge and time is post-treatment. Therefore, the general interaction term “Bridge*Post-Treatment” is the same as “Treatment*Time” in our model specification.
Table E1. Difference-in-Differences Results for Bridge vs. Public Schools, Repeated Cross-Sectional Sample
EGRA EGMA
Familiar Word
Reading Passage Fluency
Reading Comprehension
Quantity Discrimination
Addition I
Subtraction I
Word Problems
[A] [B] [C] [D] [E] [F] [G]
Sample Size 5,886 5,887 5,038 5,886 5,884 5,884 5,883 Bridge* 0.373* 0.393** 0.256** 0.283** 0.539*** 0.706*** 0.508***
Post-Treatment (0.205) (0.181) (0.100) (0.119) (0.126) (0.174) (0.075) Note: Standard errors in parentheses under the coefficients. Statistical significance is indicated by asterisks. * is significant at the 10% level, ** at the 5% level, and *** at the 1% level. The highlighted green rows represent the variable of interest, which in our case is the effect of Bridge, holding constant other factors.
28 Institute for Digital Research and Education: UCLA. “Analyzing Correlated (Clustered) Data.” Retrieved from: http://www.ats.ucla.edu/stat/stata/library/cpsu.htm.
31
F. Panel DiD Specification Controlling for Baseline Scores and Regression Results
For our panel DiD analysis controlling for baseline test scores, we used a dataset of pupils for whom we had scores from both 2011 and 2013. We then took the following steps to prepare the dataset for analysis:
• Standardised pupil score data within each subtask and year based-cohort. • Took the difference between each pupil’s standardised 2013 scores and standardised 2011 scores to generate his or
her score gain or loss for each individual subtask. • Generated relevant variables required for running the panel DiD analysis, including a treatment variable, which contains
a value of 1 for pupils attending Bridge and 0 otherwise; and 3 grade dummy variables for parsing out individual treatment effects by 2013 grade level.29
In general, the linear equation for estimating DiD using panel data with an additional covariate is:
outcomet2 – outcomet1 = β1(treatment) + β2(covariate) + ε
, where
outcomet2 = outcome measure for all units at second point in time outcomet1 = outcome measure for all units at first point in time, and β1 = effect of treatment, and β2 = effect of covariate on the outcome
Our outcome measure is change in pupil performance – gains – by subtask. Because RTI does not recommend reporting subtask scores according to any composite measure, each DiD estimation is carried out at the individual subtask level. The treatment effect that we seek to isolate is the marginal impact of attending Bridge on pupil EGRA/EGMA performance, by subtask – the “Bridge effect.”
Grade-level dummy variables were added, as this allows us to parse out grade level effects. We also add in an additional covariate for baseline test score. The rationale behind including this covariate is that it allows us to understand whether pupils with higher baseline scores achieve an additional increase in performance at follow-up as compared to all pupils included in the analysis. In other words, we want to control for differential trajectories in gains based on initial assessment scores. Our exact model specification is as follows:
test score gain = β1(treatment) + β2(Class 2) + β3(Class 3) + β4(Class 4) + β5(baseline test score) + ε
To run our model specification, we again used STATA’s -reg- command, clustering at the school level and reporting robust standard errors.
The results of the regressions on the variables of interest are detailed below. Note that for both comparisons, the coefficient on the baseline test score of the pupils is negative and significant for every subtask. This suggests that pupils starting out with lower baseline test scores have a different, more positive growth trajectory (rate-of-growth) relative to their peers starting out with higher baseline test scores.
29 EGRA/EGMA scores for pupils included in the panel data model were analysed according to actual grade level. Again, analysing the data using actual grade level is the appropriate choice for our purpose, which is to parse out the individual treatment effect of being in a particular grade. The other option is to analyse the data according to expected grade level, which does not record whether a pupil has been held back or skipped a grade.

32
Table F1. Difference-in-Differences Results for Bridge vs. Public Schools, Panel Sample with Control for Baseline Test Score
EGRA EGMA
Familiar Word
Reading Passage Fluency
Reading Comprehensio
n Quantity
Discrimination Addition
I Subtraction
I Word
Problems [A] [B] [C] [D] [E] [F] [G]
Sample Size 544 544 370 544 544 544 544
Baseline -0.477*** -0.523*** -0.887*** -0.924*** -0.67*** -0.646*** -0.87*** Test Score (0.065) (0.047) (0.049) (0.073) (0.034) (0.048) (0.055)
Bridge 0.281 0.583*** 0.568*** 0.172 0.107 0.471** 0.483***
(0.212) (0.166) (0.202) (0.176) (0.249) (0.194) (0.171)
Note: Standard errors in parentheses under the coefficients. Statistical significance is indicated by asterisks. * is significant at the 10% level, ** at the 5% level, and *** at the 1% level. The highlighted green rows represent the variable of interest, which in our case is the effect of Bridge, holding constant other factors.

33
G. Comparison of Passage Fluency Across DiD Specifications
Table G1. Comparison of Passage Fluency Results for Two Difference-in-Differences Specifications
Bridge vs. Public
RCS Panel w/ BTS [1] [2]
Sample Size 5887 544
Bridge Effect 0.393** 0.583***
(0.181) (0.166)
Note: RCS = Repeated Cross-Section, BTS = Baseline Test Score. Standard errors in parentheses under the coefficients. Statistical significance is indicated by asterisks. * is significant at the 10% level, ** at the 5% level, and *** at the 1% level. The highlighted green rows represent the variable of interest, which in our case is the effect of Bridge, holding constant other factors.
Table G2. Comparison of Passage Fluency Results for Two Difference-in-Differences Specifications
Bridge vs. Public
RCS Panel w/ BTS Bridge Effect on: [1] [2]
Passage Fluency 16.36** 20.503*** (Δ words per minute) (41.578) (35.154) Note: RCS = Repeated Cross-Section, BTS = Baseline Test Score. Pooled standard deviations are shown in parentheses below the Bridge effect converted to words per minute. Statistical significance is indicated by asterisks. * is significant at the 10% level, ** at the 5% level, and *** at the 1% level.