the bright side of patents 030216... · the bright side of patents joan farre-mensa, ... since 2001...
TRANSCRIPT
1
U.S. Patent and Trademark Office
OFFICE OF CHIEF ECONOMIST
Economic Working Paper Series
The Bright Side of Patents
Joan Farre-Mensa, Harvard Business School
Deepak Hegde, New York University
Alexander Ljungqvist, New York University and NBER
USPTO Economic Working Paper No. 2015-5
December 2015
The views expressed are those of the individual authors and do not necessarily reflect official positions of the Office of
Chief Economist or the U. S. Patent and Trademark Office. USPTO Economic Working Papers are preliminary research
being shared in a timely manner with the public in order to stimulate discussion, scholarly debate, and critical
comment.
For more information about the USPTO’s Office of Chief Economist, visit www.uspto.gov/economics.
The Bright Side of Patents* †
Joan Farre-Mensa Deepak Hegde
Harvard Business School Stern School of Business
New York University
Alexander Ljungqvist
Stern School of Business
New York University
and NBER
December 15, 2015
* We are grateful to Lauren Cohen, Lee Fleming, Zorina Khan, Alan Marco, Ramana Nanda, Bhaven Sampat, Ted
Sichelman, Rick Townsend, and seminar participants at the NBER/Productivity, Center for Protection of Intellectual
Property (George Mason University), University of Minnesota, University Carlos III (Madrid), Singapore
Management University, Nanyang Technological University, National University of Singapore, and Hong Kong
University for helpful comments. We also thank the Institute for Exceptional Growth Companies for granting access
to the NETS database. Hegde gratefully acknowledges the support of the United States Patent and Trademark
Office’s Thomas Alva Edison Visiting Scholars program. The views and comments expressed herein are solely the
opinion of the authors, do not reflect the performance of duties in the authors’ official capacities, and are not
endorsed by, nor should be construed as, any viewpoint official or unofficial of the United States Patent and
Trademark Office. The authors confirm to the best of their knowledge that no information contained herein is
privileged, confidential or classified. † Address for correspondence: Harvard Business School, Rock 218, Boston MA 02163. Phone 617-495-6963. e-mail
[email protected] (Farre-Mensa). New York University, Stern School of Business, Suite 722, 40 West Fourth
Street, New York NY 10012-1126. Phone 212-998-0674. e-mail [email protected] (Hegde). New York
University, Stern School of Business, Suite 9-160, 44 West Fourth Street, New York NY 10012-1126. Phone 212-
998-0304. e-mail [email protected] (Ljungqvist).

The Bright Side of Patents
Abstract
Motivated by concerns that the patent system is hindering innovation, particularly for small
inventors, this study investigates the bright side of patents. We examine whether patents
help startups grow and succeed using detailed micro data on all patent applications filed by
startups at the U.S. Patent and Trademark Office (USPTO) since 2001 and approved or
rejected before 2014. We leverage the fact that patent applications are assigned quasi-
randomly to USPTO examiners and instrument for the probability that an application is
approved with individual examiners’ historical approval rates. We find that patent
approvals help startups create jobs, grow their sales, innovate, and reward their investors.
Exogenous delays in the patent examination process significantly reduce firm growth, job
creation, and innovation, even when a firm’s patent application is eventually approved.
Our results suggest that patents act as a catalyst that sets startups on a growth path by
facilitating their access to capital. Proposals for patent reform should consider these
benefits of patents alongside their alleged costs.

1
Patents strike a delicate balance between the benefits of rewarding inventors and the costs of
blocking future inventions (Nordhaus 1969). Whether the U.S. patent system strikes the right
balance is currently the subject of much debate. Academic studies have emphasized the “dark
side” of patents, arguing that patent holders engage in frivolous litigation, demand excessive
payments from alleged infringers, and stifle innovation, particularly for small entrepreneurial
firms (Heller and Eisenberg 1998; Lemley and Shapiro 2007; Cohen, Gurun, and Kominers
2014; Tucker 2014). In a 2015 letter to the U.S. Congress, 51 economists and legal scholars urge
reform of the patent system, noting that “the preponderant economic picture these [academic]
studies present is that patent litigation now imposes substantial costs, particularly on small and
innovative firms, and that these costs have tended overall to reduce R&D, venture capital
investment, and firm startups” (Asay et al. 2015).1 Rising to the challenge, Congress is currently
considering no fewer than six patent reform bills.
Mounting evidence on the dark side of patents and the accompanying chorus of calls for
patent reform beg the question: do patents have a “bright side”? Economists agree that in theory,
patent rights benefit inventors. Yet, these benefits have been hard to establish empirically,
leading Boldrin and Levine (2013) to observe: “There is no empirical evidence that [patents]
serve to increase innovation and productivity.”
Our goal is to identify whether patents have a bright side and, if so, shed light on the
channels via which this bright side operates. Specifically, we investigate whether patents play a
causal role in innovative startups’ growth, follow-on innovation, and economic success. We
1 The letter is just one of several examples arguing the patent system is failing the needs of the U.S. economy.
Writing with Richard Posner, Gary Becker (2013) opined that “reforms of the [patent] system are needed that
greatly narrow the granting of patents in order to cut down … costly and unproductive litigation.” The Economist
joined the chorus of those calling for patent reform, asserting that “Patents are protected by governments because
they are held to promote innovation. But there is plenty of evidence that they do not.” (The Economist, Aug. 8,
2015).

2
focus on startups both because they are a key source of innovation, economic growth, and job
creation, and because the literature on the dark side of patents portrays small inventors as
suffering the most from the shortcomings of the patent system: they likely face the greatest
resource constraints when applying for patents, enforcing their patent rights, and defending
themselves when sued by larger rivals. An important contribution of our approach, which we
detail shortly, is that we exploit plausibly exogenous variation in the patent approval process.
This allows us to estimate the causal effects of patents on economic activity.
We find that patents indeed have a bright side. We focus on the 45,819 first-time patent
applications filed by U.S. startups at the U.S. Patent and Trademark Office (USPTO) since 2001
that received a preliminary decision by 2009 and a final decision by December 31, 2013. Our
analysis shows that patent approvals help startups create jobs, grow their sales, innovate, and
eventually succeed. Our causal estimates suggest that the approval of a startup’s first patent
application increases its employment growth over the next five years by 36 percentage points on
average. The effect on sales growth (a 51 percentage-point increase) is even larger. A first patent
grant also has a strong causal effect on a firm’s ability to continue innovating, increasing both
the number of subsequent patents the firm is granted (by 49%) and their quality (with the average
number of citations per subsequent patent increasing by 27%). In addition, patent grants more
than double the probability that a startup is eventually listed on a stock exchange—a commonly
used metric of startup success.
A chief criticism of the U.S. patent system is that it takes too long to approve or reject patent
applications, thus prolonging uncertainty about property rights and diminishing the value of
patents to their owners (Cohen and Merrill 2003; Jaffe and Lerner 2004).2 We find that
2 On average, it takes the USPTO 1.75 years to make a preliminary decision on the patent applications in our
sample, and a full 3.2 years to make a final decision—a lifetime for a startup.

3
processing delays indeed impair startups’ ability to create jobs, grow their sales, be innovative,
and gain a stock market listing. These negative effects are substantial: each year of delay in
reviewing a firm’s first patent application that is eventually approved causally reduces the firm’s
employment and sales growth over the five years following approval by 21 and 28 percentage
points, respectively. Delays also negatively affect subsequent patenting—with each year of delay
reducing the number of subsequent patents the firm is granted by 14% and the number of
citations-per-patent these patents receive by 7%. Delays even reduce the probability of going
public, by as much as a half for each year of delay. Economically, a two-year delay has the same
negative impact on a startup’s growth and success as outright rejection of the patent application.
What are the mechanisms through which early patenting conveys such large and persistent
benefits to startups? We find that first-time patent grants play a causal role in facilitating
startups’ access to external finance. Approval of a patent application increases a startup’s
probability of securing funding from professional investors (venture capitalists, or VCs) over the
next three years by 2.3 percentage points—a 53% increase over the unconditional probability.
The effect is strongest for startups that (i) raised little or no VC funding before the USPTO’s
decision, (ii) were founded by inexperienced entrepreneurs, and (iii) operate in the IT sector. We
interpret these findings as evidence that patents facilitate startups’ access to capital by mitigating
information frictions between entrepreneurs and potential investors. Access to capital in turn sets
startups on a growth path that transforms ideas into products and services which generate jobs,
revenues, and follow-on innovation.
One reason the effects of patent grants and processing delays on firm outcomes have not
previously been studied is that until recently researchers have not had access to data on rejected
patent applications. A unique feature of our study is that we have access to the USPTO’s internal
4
databases, which contain detailed information on the review histories of all patent applications,
whether eventually approved or rejected.3 Of course, comparing the outcomes for firms whose
patent applications are approved to those whose applications are rejected poses an obvious
identification challenge: higher quality firms are both more likely to produce patentable
innovations and to grow into successful companies. As a result, any observed correlation
between patent grants and firm outcomes could be spurious. Similarly, complex or marginal
applications may take longer to review, biasing estimates of the effect of processing delays on
firm outcomes. To overcome these identification challenges, our empirical strategy exploits two
key institutional features of the USPTO’s review process.
The first feature is that the USPTO assigns applications in a given technology area to patent
examiners based on their predetermined workloads. Thus, which examiner an application is
assigned to is effectively random with respect to application (or applicant) quality. Importantly,
examiners vary in their propensity to approve applications (Cockburn, Kortum, and Stern 2002;
Lemley and Sampat 2012). The quasi-random allocation of applications to examiners thus results
in the assignment of some applications to examiners who are more likely to grant patents and
others to examiners who are less likely to do so. We use this variation in individual examiners’
approval rates to instrument for the probability that a given startup’s first patent application is
approved, which allows us to isolate the effect of exogenously granted patent rights on startups’
subsequent growth and success.4
To identify the economic effects of patenting delays, we exploit a second feature of the
3 Another reason is that data on privately held firms are scarce in the U.S., making it difficult to observe firm
outcomes. We get around this obstacle by obtaining data from a variety of sources, including Dun & Bradstreet’s
National Establishment Time Series (NETS) database, which contains employment and sales data for a large cross-
section of business establishment in the U.S. 4 Sampat and Williams (2015) first proposed this instrument to measure the effect of gene patents on follow-on
innovation in the human genome field.

5
USPTO review process. The review process can be broken into two parts: the time it takes the
USPTO to assign an application to an examiner (which reflects quasi-random administrative
delays unrelated to the application’s quality or complexity) and the time the examiner takes to
make a preliminary decision on the application (which we instrument with the examiner’s
historical reviewing speed). We then use these two sources of exogenous variation in review lags
to identify the effect of patenting delays on firm outcomes.
We seek to contribute to the current debate about the state of the patent system in three ways.
First, we provide the first causal evidence that patents help startups grow, create jobs, and
generate follow-on innovations and that they do so by facilitating access to capital.5 These
findings on the real benefits of patents to startups are particularly surprising in light of criticism
that the U.S. patent office grants patents to almost anyone who applies and that firms’
expenditures on patents are wasteful, or at best useful only as defensive shields against
infringement charges (Quillen and Webster 2001; Boldrin and Levine 2013). We show that
patents—along with their well-documented dark side—offer a substantial bright side to startups.
Second, our paper illuminates the channels via which this bright side operates, thus
informing the design of reforms that address the shortcomings of the patent system while
maintaining its beneficial features. We find that patents help mitigate information frictions in the
market for entrepreneurial finance in at least four ways: they alleviate investors’ concerns
regarding startups’ ability to monetize inventions; they reduce information asymmetry by
making it easier for entrepreneurs to disclose details of their invention to investors without fear
of expropriation; they allow these details to be communicated more credibly; and they help
startups signal their quality to investors. Thus, reforms to either weaken patent rights, or do away
5 Prior work on the relation between patents and startup growth (Balasubramanian and Sivadasan 2011) or access to
capital (Hsu and Ziedonis 2013, Conti, Thursby, and Thursby 2013, Conti, Thursby, and Rothaermel 2013) stresses
the difficulty of overcoming the endogeneity of patent grants.

6
with them altogether, should consider if substitute mechanisms can address these information
frictions and help startups grow and succeed.
Third, we show that patent review delays can significantly hamper the success of innovative
startups by adversely affecting their ability to raise the capital necessary for their growth. These
findings highlight the importance of a quick patent review process, particularly for fast moving
industries, to resolve uncertainty surrounding applicants’ property rights and their ability to
produce patentable innovations.
We emphasize that our study does not imply that the U.S. patent system is optimal or even
net-welfare enhancing and so should not be reformed. But our findings do alter the balance of
evidence available to those considering a major revamp of the system by highlighting the real
benefits of patents, particularly for startups.
1. Institutional Setting and Data
1.1 The patent examination process
When an inventor applies for a patent at the USPTO, the Office of Initial Patent Examination
(OIPE) assigns the application to an “art unit” for review based on the application’s technology
field.6 Each art unit consists of several patent examiners who share a specialization in a narrowly
drawn technology field.7 Over our sample period, the USPTO employed some 13,000 examiners
in over 900 art units. The median art unit has 13 examiners; the largest more than 100.
Applications in each art unit’s holding queue are assigned by a supervisor to one of the unit’s
examiners, who is then responsible for assessing whether the claims in the application meet the
legal thresholds of novelty, usefulness, and non-obviousness. Art units do not follow any
6 The technology field is determined through automated textual analysis of the description of the invention. 7 To illustrate, the examiners in art unit 1641 are in charge of examining patent applications related to “peptide or
protein sequence,” examiners in art unit 2831 are in charge of applications related to “electrical connectors,”
examiners in art unit 3676 are in charge of applications related to “wells and earth boring,” and so on.

7
standardized assignment rule (Lemley and Sampat 2012; Sampat and Williams 2015). For
example, some units assign applications to examiners based on the last digits of the application
number assigned sequentially by the OIPE, while others automatically assign the oldest
application to the first available examiner.8 Despite these differences, Lemley and Sampat (2012)
and Sampat and Williams (2015) conclude that the assignment of applications to examiners
within a given art unit is effectively random with respect to the quality of the application or the
applicant. This conditional random assignment of applications to examiners plays a key role in
our identification strategies.
After receiving an assignment (on what is known as “docket date”), the examiner evaluates
the application and makes a preliminary ruling on the application. This ruling, called the “first-
action decision,” is communicated to the applicant via an official first-action letter signed by the
examiner. On average, applications in our sample take 0.7 years to be assigned to an examiner,
and examiners take an additional year to make a first-action decision. The final decision on the
application is then made on average 1.5 years later—a full 3.2 years after the application date.
Carley, Hegde, and Marco (2015) show that the first-action decision resolves substantial
uncertainty about the application’s ultimate fate.9 Consequently, we take the first-action date
(rather than the final decision date) as our starting point for estimating how patent decisions
affect firm outcomes. The data support this modeling choice: in Section 4, we find that
successful applications help facilitate a startup’s access to VC funding within a few months of
8 Each examiner has a review quota and can have a maximum number of pending applications in her docket at any
point in time. Both the quota and the maximum vary by art unit and in part depend on the examiner’s seniority. 9 Strictly speaking, patent applications are never irrevocably rejected by the USPTO; they are abandoned by
applicants following what technically are appealable rejections issued by examiners (Lemley and Sampat 2008). For
expositional clarity, we follow Sampat and Williams (2015) and refer to abandoned applications (i.e., the
complement of those applications that are approved) as “rejected.”

8
the first-action decision, well before the final decision is made.10
Our data do not include the content of the first-action letter (only its date). Instead, we use
the final outcome of the application (i.e., approval or rejection) as a noisy proxy for the first-
action decision. Doing so gives rise to a simultaneity problem in our empirical analysis. As we
explain in Section 2.2, the identification strategy we use to address the endogeneity induced by
the likely presence of unobservable differences between successful and unsuccessful patent
applicants also addresses the endogeneity arising from this simultaneity problem.
1.2 Patent data and sample selection
Our patent data are drawn from the USPTO’s internal databases. A key advantage of these
internal databases is that they include information on the review histories of every U.S. patent
application—both approved and rejected.11 Until recently, publicly available datasets on U.S.
patents, such as those maintained by the National Bureau of Economic Research or Harvard
Business School, only covered approved patents.12 As a result, most prior studies that analyze the
relation between patenting activity and firm-level outcomes have measured the former as stocks
of granted patents.13 A challenge of using data on only granted patents is that the counterfactual
for firms with patent rights then includes both firms that applied for patents but were not granted
patent rights and firms that never applied for patents (either because they did not engage in
innovative activities or because they pursued alternative mechanisms to protect their intellectual
10 Measuring firm outcomes from the first-action date instead of the final decision date has an additional advantage:
the final decision date for rejected applications is highly endogenous, as unsuccessful applicants effectively choose
their final decision date by choosing when to abandon their applications. 11 Carley, Hegde, and Marco (2015) provide a detailed description of these data. 12 Sampat and Williams (2015) and other recent working papers use publicly available data from the USPTO’s
Patent Application Information Retrieval (PAIR) system. Unlike the NBER or HBS datasets, PAIR covers both
approved and rejected applications filed after 2000. A drawback of PAIR compared to the internal databases we use
is that PAIR provides no data on applications that are abandoned prior to public disclosure (approximately 15% of
all unsuccessful applications) and no data on rejected applications before 2001. 13 A prominent example is Balasubramanian and Sivadasan (2011), who match the NBER patent data to Census
microdata for U.S. manufacturers and show that increases in a firm’s patent stock are associated with increases in
the firm’s size, scope, skill intensity, and capital intensity.

9
property). With publicly available data, it is thus impossible to separate the effects of innovative
activity (which increases both the probability of applying for and receiving patents) from the
economic effects of patent rights.
We use data from the USPTO’s internal databases covering all patent applications, whether
approved or rejected, filed from 1991 onwards that had received a final decision by the end of
2013 (access to the USPTO’s internal databases was granted through the agency’s Thomas Alva
Edison Scholars program).14 Our goal is to identify the real effects of early patent grants on
startup success. The USPTO does not tag whether an applicant is a startup, so we code as a
startup those applicants that satisfy the following two filters: (1) the firm is a U.S.-based for-
profit company that is not listed on a stock market at the time of its first patent application; and
(2) it has filed at least one application on or after January 1, 2001 and no applications from 1991
through 2000. The first filter screens out the bulk of established filers (such as research labs and
listed companies). The second filter ensures that we capture first-time patent applicants, which
are likely to be young entrepreneurial firms.
Throughout the paper, our analysis focuses on how the outcome of a firm’s first patent
application affects its growth, subsequent innovation, raise funding, and eventually go public.15
To ensure that we can study the long-term effects of patents, we require firms to receive the
first-action decision on their first application by December 31, 2009.
Our final sample consists of 45,819 first-time patent applicants (called startups from here
on). Of these applications, 65.7% are successful and result in a patent grant while the rest are
14 Aggregate data on approved and rejected patent applications are available through Marco, et al, (2015). 15 Occasionally, the first patent decision a firm receives is not for the first application it ever filed, but for a later
application. This occurs 8% of the time in our data. Our focus throughout is on a firm’s first application that the
USPTO rules on. For brevity, albeit somewhat inaccurately, we refer to this as the firm’s “first application.”
Identifying each firm’s first application requires standardizing the assignee names in the USPTO data, to ensure that
we can accurately capture each firm’s patenting history. Our standardization process follows Bernstein, Giroud, and
Townsend (2015) .

10
unsuccessful. The industry distribution of our sample firms is as follows: 32.7% operate in the
electronics, computers, and communications industries (henceforth, IT); 18.7% are active in the
pharmaceutical and bio-chemical industries (henceforth, biochemistry); and the remaining 48.6%
operate in other industries.
1.3 Data on firm outcomes
We obtain data on firm outcomes from three sources. First, we extract employment and sales
data from Dun and Bradstreet’s National Establishment Time Series (NETS) database, which
covers a large cross-section of business establishments in the U.S. going back to 1989.16 We are
able to match 65.4% of our sample firms by name to firms in NETS. For 25.9% of the matched
firms, NETS reports no data for the year of the first-action decision on the first patent
application, typically because NETS coverage does not begin until later. This leaves 22,214
startups with data on employment and sales as of the first-action date. These are the firms that
form the basis of our analysis of the effects of patents on employment growth and sales growth.
Second, we use VentureXpert to identify which of our sample firms go on to raise VC
funding at some point after the first-action date. Third, we use data from Thomson Reuter’s
Securities Data Company (SDC) database to identify firms that go public or are acquired after
the first-action date. The algorithm used to match our sample firms to NETS, VentureXpert, and
SDC follows Bernstein, Giroud, and Townsend (2015).
Table 1 reports summary statistics of firm outcomes separately for startups whose first patent
application is approved or rejected. Panel A shows that startups whose first application is
approved have slightly higher sales and employment growth prior to the application. The
difference widens in the years after the USPTO’s preliminary decision. Panel B shows that
startups with an approved patent produce more, and higher quality, inventions. Panel C shows
16 Being privately held, the startups in our sample are not covered in standard financial databases such as Compustat.

11
that startups with approved patents are more likely than those whose applications are rejected to
raise venture capital and to eventually go public or be acquired.
In sum, Table 1 shows that startups that receive patents are associated with superior
outcomes, but of course no causal inferences can be drawn from these descriptive statistics.
2. The Real Effects of Patent Grants
2.1 Empirical setup and identification challenge
In order to identify how the approval of a firm’s first patent application affects subsequent
outcomes at the firm, we estimate the following equation:
itja itja itja itjaFirm outcome First patent application approved X , (1)
where i indexes applicants, t application years, j examiners to whom applications are assigned for
review, and a art units. We consider four outcomes: (i) changes in the applicant firm’s
employment, (ii) changes in its sales, (iii) its subsequent innovative activity (as measured by the
quantity and quality of its subsequent patents), and (iv) whether the firm eventually lists on a
stock market or is acquired by another company. We consider various windows for these
outcomes to occur, starting in each case from the first-action date.
The vector X controls for time-varying differences in firm outcomes across technology fields
by including a full set of art-unit-by-application-year fixed effects. (We discuss the importance
of including these fixed effects below.) We also control for geographical differences in outcomes
by including firm-headquarter-state fixed effects. Heteroskedasticity robust standard errors are
clustered at the art unit level to allow for arbitrary correlation of the errors within each art unit.
Ideally, First patent application approved would capture the content of the first-action letter:
is the application likely eventually to be approved or to be rejected? However, as we do not
observe the content of the letter, we instead set First patent application approved equal to one if

12
the application is actually eventually approved, and zero otherwise. This may give rise to an
endogeneity problem, to the extent that differences between the first-action and the final decision
are simultaneously determined with the dependent variable in equation (1).
This simultaneity problem is in addition to the omitted-variables problem noted earlier. To
illustrate the difference between the two, consider first a firm of higher unobserved quality at the
time of filing is both more likely to have produced a “novel, useful, and non-obvious” invention
worthy of a patent and to perform better going forward. This source of endogeneity is unrelated
to the fact that we do not observe the content of the first-action letter. Next consider a firm
receiving a first-action letter raising various concerns might decide to hire a new chief scientific
officer. This hire could both increase the likelihood that the application is eventually approved
(relative to the expectation at first-action) and boost the firm’s post first-action growth.
Endogeneity of these sorts imply that the OLS estimate of β will be biased upwards, as it will
capture both the average treatment effect of patent grants on firm outcomes and the bias induced
by not controlling for either ex ante firm quality or post-first action changes in quality.
The ideal experiment to identify the causal contribution of a patent to a firm’s success would
randomize patent approvals, thus ensuring that the ex ante characteristics of successful applicants
do not differ systematically from those of unsuccessful ones. Of course, the USPTO does not
grant patents randomly. However, we can get close to this ideal experiment by exploiting
features of the review process that induce quasi-random variation in patent approvals, following
an instrumental variables (IV) approach. Given that our IV is determined before the first-action
decision, it also allows us to address the simultaneity problem.
2.2 Identification strategy: Patent examiners’ approval rates as IV
We leverage the conditional random assignment of patent applications to examiners within

13
the USPTO’s art units and exogenous variation in the propensity of examiners to approve patents
to identify the causal effect of patent grants on firm outcomes. For examiner j belonging to art
unit a assigned to review firm i’s first patent application submitted at time t, we calculate the
examiner’s approval rate as follows:
granted
reviewed
Examiner approval ratejta
jta
ijta
n
n , (2)
where reviewed jta
n and granted jta
n are the numbers of patents reviewed and granted, respectively, by
examiner j prior to date t.17 We then use the examiner’s approval rate as an instrument for
whether the focal application is approved and estimate equation (1) using two-stage least squares
(2SLS). This instrument was first proposed by Sampat and Williams (2015), who use it to
analyze the effect of patent rights on follow-on innovation in the human genome industry.
2.2.1 Instrument relevance
Since patent applications are assigned to examiners quasi-randomly within an art unit, we
include art-unit-by-application year fixed effects in all of our regressions (as in Sampat and
Williams 2015).18 Thus, for our IV to predict whether a patent application is approved, there
needs to be sufficient variation within an art unit and year in the propensity of different
examiners to approve patent applications. Previous research suggests that the patent review
process leaves enough discretion in the hands of examiners for this to be the case (Lichtman
2004; Sampat and Lemley 2010; Lemley and Sampat 2012; Sampat and Williams 2015). This
discretion is perhaps best illustrated by Cockburn, Kortum, and Stern (2003), who note that
“there may be as many patent offices as there are patent examiners.”
17 Neither the numerator nor the denominator in (2) includes patent application i, as it had not been reviewed prior to
date t. Also, to ensure that we measure each examiner’s approval rate accurately, we exclude all firms whose first
patent application is assigned to an examiner who has reviewed fewer than 10 previous applications. All results are
robust to using alternative cutoffs. 18 Applications belonging to art-unit-by-year singletons do not contribute to identification and are excluded.

14
The existence of meaningful variation in the propensity of examiners to approve patent
applications is confirmed by our data. The top graph in Figure 1 shows the distribution of
examiner approval rates, defined as in equation (2), in our sample. The median examiner
approves 62.2% of applications, and the interquartile range is 32.7%. Part of this variation is
driven by variation in approval rates across art units and time. The bottom graph in Figure 1
shows the distribution of residual approval rates (obtained from a regression of approval rates on
a full set of art-unit-by-application-year fixed effects). As expected, the fixed effects account for
a sizable fraction of the raw variation in approval rates (the R2 is 56.3%), but we are still left with
substantial variation in residual approval rates, with an interquartile range of 17.7%.
Our approval rate estimates are based on a large number of reviewed applications: the
average (median) examiner had reviewed 771 (418) applications by the time we measure her
approval rate (the 10th percentile is 52). This suggests that the variation shown in Figure 1
reflects persistent inherent differences in examiners’ propensity to approve applications and not
random differences in the quality distribution of the applications they review.
Table 2 reports the first stage of our 2SLS models, that is, the results of regressing patent
approval on the instrument using the following linear-probability model:
itja itja itja itjaFirst patent application approved Examiner approval rate X u (3)
As required for identification, the instrument is a strong predictor of whether an application is
approved. The coefficient estimate in column 1 implies that each percentage-point increase in an
examiner’s approval rate leads to a 0.67 percentage-point increase in the probability that a patent
she reviews is approved (p<0.001). Thus, moving from an examiner in the 25th percentile to one
in the 75th percentile would increase the approval probability by 11.9 percentage points (=0.67 ×
17.7), all else equal. Controlling for firm size using the log number of employees (column 2) or

15
log sales (column 3) has next to no bearing on the point estimate, even though these variables are
only available for just under 50% of our sample firms.
The effect of an examiner’s approval rate on the probability of receiving a patent is not only
large economically, it is also strong statistically, with F statistics that consistently exceed the
critical value of 10 (Stock and Yogo 2005). This is important because weak instruments can do
more harm than good.
2.2.2 Exclusion restriction
In order to satisfy the exclusion restriction, the IV must only affect firm outcomes, following
the examiner’s first-action decision, through its effect on the likelihood that the examiner’s first-
action letter indicates that the application will be approved. As noted by Angrist and Pischke
(2009, p. 117), for the exclusion restriction to be satisfied, the instrument must be “as good as
randomly assigned conditional on covariates.” Since applications are assigned to examiners
within an art unit randomly with respect to quality, once we include art-unit-by-application-year
fixed effects, the IV has a plausible claim to satisfying the exclusion restriction.
While conditional random assignment of patent applications to examiners is necessary for
our IV to satisfy the exclusion restriction, it is not sufficient. To see why, consider the following
scenario. If a startup were to learn the approval rate of its randomly assigned examiner at the
time of application, it could try to predict the examiner’s first-action decision based on her past
review record. This prediction could then affect the startup’s effort and hence firm outcomes
before the first-action decision on the application. In this scenario, even a randomly assigned
instrument would violate the exclusion restriction, as it would affect firm outcomes via a
channel—effort before the application is decided—other than the first stage. In practice,
applicants do not learn the identity of their patent examiner until they receive the USPTO first-

16
action letter. As a result, by the time applicants learn who the examiner is, it is too late to use the
examiner’s review record to predict her first-action decision.
In sum, the institutional features of the USPTO review process are consistent with the
identifying assumption that any effect that the examiner’s approval rate has on firm outcomes
operates via the first stage—i.e., via the effect that the examiner’s leniency has on the
application’s likelihood of approval.
2.3 Results
2.3.1 Employment growth and sales growth
Table 3, Panel A examines how the outcome of a firm’s patent application affects its
employment growth over the five years following the USPTO’s first-action decision. We first
discuss the results of naïve OLS regressions which ignore the endogeneity of patent approval.
Column 1 shows that firms that are granted a patent grow their employment by 7.3 percentage
points more on average in the year following the patent decision than those whose first
application is rejected. The difference continues to widen over time: successful applicants’
employment growth is 15.4 percentage points higher after three years (column 3) and 25
percentage points higher after five years (column 5).19 These differences are not only large
economically but also highly statistically significant (p<0.001 in all three cases).20
These OLS estimates ignore the endogeneity of patent grants and so cannot be interpreted
causally. Instrumenting patent grants using examiner approval rates subtly changes the inference.
The 2SLS results in column 2 show that a favorable patent decision has no significant effect on
the firm’s employment growth in the first year after the decision. Economically, this seems more
plausible than the large OLS estimate shown in column 1: surely it takes time for patent grants to
19 We omit the two- and four-year growth results to conserve space; they are in line with those shown in the table. 20 In addition to including art-unit-by-year and headquarter-state fixed effects, we also control for the log number of
employees that the firm has at first-action. As expected, larger firms tend to grow more slowly, all else equal.

17
boost employment growth. It is only after a while that the patent approval effect becomes
significant, leading to employment growth that is 20.1 percentage points higher over three years
(p=0.021, column 4) and 35.6 percentage points higher over five years (p= 0.019, column 6). To
illustrate the economic significance, consider the median startup, which in our sample has eight
employees at first-action. Approval leads to faster growth that translates into the firm having 2.9
(=8 × 0.356) more employees on average five years later than if the application had been rejected
as a result of being assigned to a stricter examiner.
Panel B reports analogous results for sales growth. The OLS estimates show that successful
applicants grow their sales by 7.8, 15.7, and 29.1 percentage points more on average over the
one, three, and five years following the patent decision than their unsuccessful counterparts
(p<0.001 in all three cases). Once we instrument patent grants, the one-year growth effect in
column 2 again becomes insignificant (p=0.283). But over three and five years, we find that
patent approvals lead to sales growth that is 21.9 and 51.4 percentage points higher, respectively
(p=0.022 and 0.008 in columns 4 and 6, respectively).
Figure 2 helps visualize these increases by plotting the estimated patent approval effect on
the growth in employment (Panel A) and sales (Panel B) over the five years following first-
action. The figure leaves little doubt that patent approvals play an important causal role in
fostering startup growth as evidenced by sizeable gains in employment and sales.
2.3.2 Subsequent patenting
We next model how the outcome of a firm’s first patent application affects the firm’s ability
to continue innovating and patenting. We capture a firm’s subsequent innovative activities using
the log number of patent applications filed by the firm after the first-action decision on its first
patent application; the log number of such subsequent applications that are approved; the

18
approval rate of these subsequent applications; the log number of citations received by all
subsequent applications combined; and the log average number of citations-per-patent received
by those subsequent applications that are approved.21 See Table 1 for descriptive statistics.
Table 4 reports the IV results.22 (Readers interested in the naïve OLS results are referred to
Table IA.1 in the Internet Appendix.) Columns 1 and 2 show that approval of the first patent
application leads to a 66.9% (=e0.512−1) increase in the number of patents the firm subsequently
applies for and a 48.8% increase in the number of patents it subsequently obtains (p<0.001 in
each case). This may not be surprising; after all, Table 3 shows that successful applicants enjoy
faster growth. But it is not just the volume of subsequent patent applications and grants that
increases. Column 3 shows that success in the first patent application leads to a 17.7 percentage-
point increase in the approval rate of a startup’s subsequent applications (p<0.001), suggesting
that these subsequent applications are of higher quality.
Consistent with the notion that early patenting success increases subsequent innovation
quality, column 4 shows that the approval of a firm’s first application leads to a 69% increase in
the number of citations received by the combined stock of its subsequent applications (p<0.001).
Even more remarkably, when we remove any quantity effect both in the number of subsequent
applications and granted patents, we still find that early approvals boost the quality of subsequent
innovations, increasing the average citation-per-patent count by 26.6% (p=0.002, column 5).23
We emphasize that the IV estimates in Table 4 are not contaminated by potentially
21 There is no mechanical relation between the outcome of a firm’s first patent application and our subsequent
patenting measures, as these only include patent applications filed after the first application is decided. 22 The analysis in Table 4 is fundamentally different from that in Sampat and Williams (2015). Their unit of analysis
is a technology field, rather than a firm. They examine how patents on a particular gene affect follow-on scientific
research in that same gene, regardless of who produces the research. Our analysis is at the firm level, asking how
approval of a firm’s first patent application affects the quantity and quality of that firm’s subsequent patents. We do
not require subsequent patents to be in the same field of the first application, although, naturally, they often are. 23 In untabulated results, we find that the effects in columns 4 and 5 are even stronger when we measure citations
over seven or ten years.

19
unobserved ex ante quality differences between successful and unsuccessful first-time applicants.
Therefore, our results indicate that the approval of a firm’s first patent application leads to
changes in the firm’s resources and environment in which it develops its innovative activities
that increase both the quantity and quality of its subsequent innovations.
2.3.3 IPOs and acquisitions
We next test whether approval of a startup’s first patent application affects success measured
as the probability that the firm subsequently goes public or is acquired. Column 6 reveals that a
successful application boosts the probability of an IPO by 0.9 percentage points (p=0.006). This
represents a sizable 153% increase over the unconditional sample probability of 0.59%.24 We
find similar results in column 7, where we include acquisitions: a successful application
increases the probability of going public or being acquired by 2.1 percentage points (p=0.001),
an 84% increase over the unconditional sample probability of 2.5%.
On average, successful first-time applicants are acquired 3.3 years or go public 4.9 years
after the USPTO takes first-action. These long lags underscore the notion that the causal link
between the approval of a firm’s first patent application and the likelihood that the firm is
eventually sold is unlikely to direct, in that potential IPO investors or acquirers are unlikely to
use the outcome of the application in their investment decision. Rather, our findings suggest that
early patent grants act as catalysts that set startups on a path to success. We defer an analysis of
the channels through which patents affect startups’ long-term growth and success to Section 4.
3. The Real Effects of Patent Review Delays
Section 2 shows that patent grants have real effects for startups that translate into faster
growth, more and higher-quality subsequent innovations, and a higher likelihood of eventually
24 We observe IPOs through the end of 2014. Firms that remain private by then may yet go public in the future. The
art-unit-by-application-year fixed effects control for the fact that firms that applied for their first patent in the last
few years of our sample have had less time to go public than earlier applicants.

20
going public or being acquired. Motivated by concerns that delays in the patent review process
create uncertainty and diminish the value of patents to their owners, this section investigates
whether, conditional on a startup’s first patent being approved, exogenous delays in the patent
review process have a causal effect on firm outcomes.
3.1 Empirical setup and identification challenge
To identify how the time the USPTO takes to review a startup’s first patent application
affects firm outcomes, we estimate the following regression:
itja itja itja itjaFirm outcome First patent review lag X , (4)
restricting the sample to startups whose first application is approved. First patent review lag is
the number of years between the date the firm’s first patent application is filed at the USPTO and
the first-action date and averages 1.6 years. Throughout this section, we focus on the same firm-
level outcomes we analyze in Section 2 and continue to include art-unit-by-application-year and
headquarter-state fixed effects in the vector X.
The identification challenge is that review delays may be related to unobservable innovation
quality or application complexity and thus are potentially endogenous. Estimating equation (3)
consistently thus requires an instrument.
3.2 Identification strategy: Decomposing and instrumenting review lags
The time it takes to receive a decision on a patent application can be decomposed into two
parts: the time from filing to the application being assigned to the examiner’s docket and the time
from docket to first-action. The former reflects quasi-random administrative delays at the
USPTO that are unrelated to invention quality or application complexity. The extent of such
delays depends on factors such as the workload of the OIPE or the different art units, staffing
issues (sickness, maternity leaves, etc.), and the USPTO’s budget situation. Delays at this stage

21
are thus orthogonal to the application’s characteristics and so plausibly exogenous.
The time from docket to first-action, by contrast, could be influenced by the characteristics of
the application and so is potentially endogenous. To address this endogeneity, we use only that
part of the variation in time from docket to first-action that is orthogonal to application
characteristics. We obtain this by regressing time from docket to first-action on the examiner’s
average time to process applications from docket to first-action in the past.
Our instrument for a patent application’s review lag is the sum of time-to-docket and the
average time the examiner has taken in the past from docket to first-action.
The exclusion restriction requires the IV to affect firm outcomes only via the first stage and
not directly. Since time-to-docket is exogenous, it can enter the IV directly. Using examiners’
review speed to instrument the time from docket to first-action is analogous to using examiners’
approval rates to instrument for the likelihood of patent approval. In both cases, the key
institutional features that motivate the exclusion restriction are that the assignment of
applications to examiners within art units is quasi-random and that applicants only learn the
identity of their examiners at the time of first-action. These features suggest that idiosyncratic
examiner characteristics can only affect firm outcomes via the first stage—i.e., in this case, via
the effect that the examiner’s review speed has on an application’s review lag.
The top graph in Figure 3 shows evidence of substantial variation in our review-lag IV. The
interquartile range is one year, with each of the two components of the IV driving half of this
variation. In part, this variation reflects differences across art units and time. The bottom graph in
Figure 3 shows the distribution of the residuals obtained after regressing the IV on a full set of
art-unit-by-year fixed effects (the R2 of this regression is 60.4%). This gives an interquartile
range of just over half a year, which suggests that after controlling for art-unit-by-application-

22
year fixed effects we continue to have meaningful variation in the IV to drive our first stage.
Column 1 in Table 5 shows the results of estimating the first-stage regression
itja itja itja itjaFirst patent review lag Review lag IV X u . (5)
The results leave little doubt that the review-lag IV is strong: the estimate of θ is large (̂ =0.54)
and highly significant, with an F statistic over 1,000. We obtain similar estimates in columns 2
and 3 when we control for firm size using the log of the number of employees or sales.
3.3 Results
3.3.1 Employment growth and sales growth
Table 6 examines how the time it takes the USPTO to make a first-action decision on a
startup’s first patent application affects employment growth (Panel A) and sales growth (Panel
B) over the five years following the decision.
The naïve OLS estimates show that longer reviews are associated with slower growth once
the USPTO finally grants the patent. For example, for each year of delay, employment growth
declines by 2.4 percentage points in the first year after a patent grant, and by a cumulative 12.7
and 19.3 percentage points over three and five years, respectively. Sales growth exhibits a
similar negative post-decision trend.
The instrumented estimates show that each year of delay causes employment growth to
decline by an insignificant 2.5 percentage points one year after the patent is granted (p=0.111),
by 8.4 percentage points over three years (p=0.033), and by 20.9 percentage points over five
years (p=0.015). For the median startup with eight employees at first-action, each year of delay
thus implies 1.7 (=8 × 0.209) fewer jobs five years later, all else equal. The instrumented effects
on sales growth are even larger. Each year of delay causes sales growth to slump by 3.6, 12.8,
and 28.4 percentage points over the one, three, and five years following the patent first-action

23
decision (p=0.033, 0.007, and 0.009), respectively. Figure 4 illustrates these effects graphically.
3.3.2 Subsequent patenting
Review lags similarly hamper subsequent innovative activity. Columns 1 through 5 in Table
7 report the instrumented effects of review lags on the quantity and quality of the applications a
startup files after receiving approval on its first patent application. (Table IA.2 in the Internet
Appendix reports OLS estimates.) Each year of delay causes the number of subsequent patent
applications to decline by 14% (column 1). The number of patents granted falls in lockstep, by
13.6% (column 2), partly as a result of fewer applications and partly because the firm’s approval
rate falls by 4.1 percentage points (column 3). The quality of the firm’s subsequent applications
also deteriorates: each year of delay is followed by an 18.6% decline in the firm’s total number
of citations (column 4) and a 7.4% decline in the average number of citations-per-patent(column
5). Each of these estimates is not only economically large but also highly statistically significant.
3.3.3 IPOs and acquisitions
Not surprisingly, slower growth and less innovation as a result of delays at the USPTO hurt a
startup’s chances of eventually going public or being acquired. Column 6 in Table 7 shows that
each additional year the USPTO takes to review an application that is ultimately approved
reduces a startup’s subsequent probability of going public by 0.39 percentage points (p=0.025)—
a 58% reduction from the unconditional 0.67% IPO probability among successful first-time
patent applicants. The combined probability of going public or being acquired in column 7 falls
by 0.62 percentage points (p=0.071).
Collectively, the findings in this Section highlight that it is not simply the outcome of a
startup’s first patent application that affects its future growth: even conditioning on approval, the
speed with which the USPTO reviews application has lasting consequences for the applicant.

24
4. What Drives the Real Effects of Patents?
Sections 2 and 3 show that first-time patent grants appear to act as catalysts that help startups
grow, innovate, and eventually go public or be acquired. Our goal in this section is to understand
how they do so. Our search for a mechanism focuses on the role patents play in alleviating
informational frictions in the market for entrepreneurial capital.
4.1 Patents and frictions in the entrepreneurial finance market
The entrepreneurial finance market is plagued by information frictions (Leroy and Singell
1987; Evans and Jovanovic 1989; Gompers 1995; Black and Gilson 1998; Kortum and Lerner
2000; Kaplan and Strömberg 2003; Sorensen 2007). Startups, by definition, have few assets they
can pledge as collateral for loans and have little or no track record to help an equity investor
assess their upside potential and their risk. The resulting financing frictions are particularly
severe for innovative startups such as those in our study, which by definition aim to
commercialize new ideas for which precedents are likely limited. It is thus often challenging to
ascertain whether their ideas will work as claimed, will result in sufficient demand, or can easily
be imitated by competitors.
Patents can help alleviate these information frictions in four key ways. First, by securing a
startup’s property rights on its invention, a patent can alleviate investors’ concerns regarding the
firm’s ability to monetize the invention. Second, a patent reduces information asymmetry by
making it easier for an entrepreneur to share details of her invention with investors without fear
of expropriation (Arrow 1962; Anton and Yao 1994; Biais and Perotti 2008). Third, the patent
itself helps communicate these details credibly. Fourth, a patent can help the startup signal its
quality to investors. Long (2002), for example, notes that “if an easily measurable firm attribute
such as patent counts is positively correlated with other less readily measurable firm attributes

25
such as knowledge capital, then patent counts can be used as a means of conveying information
about these other attributes” (p. 627).25
4.2 Empirical strategy
In examining whether patents indeed alleviate information frictions in the entrepreneurial
finance market, we focus on access to VC funding. VCs have been shown to be critical to the
success of innovative startups (Hellmann and Puri 2000; Gompers and Lerner 2001), not only by
offering funding, but also by providing monitoring and advice (Bernstein, Giroud, and Townsend
2015), access to networks of potential customers, suppliers, and strategic partners (Hochberg,
Ljungqvist, and Lu 2007), and help recruiting talented individuals (Gorman and Sahlman, 1989).
This is not to say that patents may not also facilitate access to funding from angel investors
(Sudek 2006), strategic alliance partners, or debt (Hochberg, Serrano, and Ziedonis 2014; Mann
2015). But data on these funding sources are not systematically available.
To identify how patents affect access to VC funding, we estimate the following regression:
itja itja itja itjaFirm raises VC funding First patent application approved X . (6)
The dependent variable is an indicator set equal to one if the firm raises VC funding at some
point in the n=1 to 5 years following the USPTO’s first-action decision on the firm’s first patent
application. Of the startups in our sample, 92.5% have raised no venture capital prior to the first-
action date. For these, equation (6) identifies the effect of patent approval on a firm’s ability to
raise its first VC round. For firms with at least one prior VC round, equation (6) identifies the
effect on their ability to raise a follow-on round.26 In addition to including art-unit-by-year and
headquarter-state fixed effects, we control for the log number of prior VC rounds. We also
25 To the extent that the entrepreneur is unsure about the quality of her invention, the signal provided by a patent can
also be valuable to the entrepreneur herself, increasing her motivation and effort once a patent has been secured. 26 Specifically, 2.4% of our sample firms have raised one VC round at the time of their first-action; 1.9% have raised
two VC rounds; 1.4% have raised three rounds; and the rest have raised four or more rounds.

26
consider sample splits based on the number of prior VC rounds.
Estimating equation (6) requires an instrument, as firms of higher unobservable quality are
both more likely to be granted patents and to raise VC funding. We thus again use the examiner’s
prior approval rate to instrument for the likelihood that the application is approved.27 For
completeness, we report the naïve OLS results in the Internet Appendix.
4.3 Baseline results
Table 8 reports the results. Approval of a firm’s first patent application causes a startup’s
chances of raising VC funding in the following year to increase by 1.2 percentage points
(p=0.047 in column 1). Extending the window increases the effect to 2.1, 2.3, 2.7, and 2.8
percentage points over two, three, four, and five years, respectively (p<0.01 in columns 2 to 5).
These effects are economically large. To illustrate, the 2.3 percentage-point increase in column 3
represents a 53% increase relative to the 4.3% unconditional probability our sample firms have
of raising VC funding in the three years following a first-action decision.
Importantly, even when we measure VC funding over a five-year window, the median
successful applicant that raises venture capital does so a mere 10.3 months after first-action. This
proximity between the USPTO’s preliminary patent approval and the VC investment is
consistent with our hypothesis that patent decisions play a direct causal role in facilitating
startups access to capital by alleviating informational frictions between them and their investors.
4.4 Heterogeneous effects of patents
If patents facilitate access to funding by addressing informational frictions, we expect the
effect to be most beneficial to firms surrounded by the greatest frictions. Frictions are likely
greatest among firms (i) trying to raise their first or second VC round, (ii) led by inexperienced
27 Recall from Section 2.2 that instrumenting patent approval also addresses the simultaneity problem induced by the
fact that we use the final outcome of the patent application as a noisy proxy for the first-action decision outcome.

27
founders, and (iii) operating in industries in which the quality of ideas and entrepreneurs is
difficult to evaluate and where patents are most effective at mitigating the risk of expropriation.
Throughout this section, we focus on how patent grants affect firms’ ability to raise VC in the
three years following first-action. Our conclusions are robust to using alternative time windows.
4.4.1 Variation in funding round
Table 9, Panel A splits startups by the number of VC rounds raised before first-action. If
early-stage startups face the greatest frictions, we expect patent approval to be most beneficial to
them. The data support this prediction. Approval increases the likelihood of subsequently raising
the first VC round (often called the seed round) by one percentage point (p=0.044 in column 1).
Conditional on having raised a first round, patent approval increases the chances of raising a
second round by as much as 46.7 percentage points (p=0.004 in column 2). These are large
effects economically, given that the unconditional probability of raising a first round is only
1.2% and the probability of raising a second round, conditional on having raised a first, is 39.5%.
Beyond the second round, the effect of patent approval on access to VC funding all but
disappears. The effect is insignificant in column 3, which focuses on mature startups with two
prior VC rounds by the time of first-action (p=0.354), and in column 4, which pools all firms that
have raised three or more VC rounds before their first application is decided (p=0.302).28
These patterns are what we would expect if patents alleviate informational frictions by
serving as easy-to-acquire signals of startup quality or by allowing early-stage entrepreneurs to
credibly communicate their ideas to investors without the fear of expropriation. Indeed, by the
time a startup is trying to raise a third (or subsequent) funding round, VC investors—who
typically sit on the firm’s board and monitor it closely—already have a wealth of information
28 These insignificant effects do not appear to be the result of our IV being weak in these relatively small
subsamples: in both columns 3 and 4, the first-stage F statistic is over 10 and the standard errors of the patent
approval effect are similar to the error of the highly significant patent effect we estimate in column 2.

28
about the firm. As a result, the incremental information content of a patent decision should be
much smaller than when VCs evaluate a firm for the first or second time.
4.4.2 Variation in prior entrepreneurial experience
An alternative proxy for the uncertainty surrounding a startup is the experience of its
founders. Table 9, Panel B splits startups by prior experience, using data obtained from Capital
IQ that are only available for startups that raise VC funding at some point in their lives. The
sample is thus restricted to firms with at least one prior VC round before first-action. Of these
firms, 57% have a founding team with at least one founder who has prior entrepreneurial
experience, while the rest are run by teams made up exclusively of first-time entrepreneurs.
The results confirm that patent approval facilitates access to capital the most among
inexperienced founders. Patent approval increases a startup’s likelihood of raising VC funding in
the next three years by 53.5 percentage points for inexperienced founders (p=0.069 in column 1);
for experienced founder teams, the effect is virtually zero (p=0.801 in column 2). Column 3
pools startups with experienced and inexperienced founders and allows the patent approval effect
to vary with the founder’s experience. As predicted, the patent approval effect is significantly
smaller for firms with experienced founders (p=0.021).29
4.4.3 Variation across industries
IT (electronics, computers, and communications) and biochemistry (pharmaceuticals and
biochemicals) have, for a long time, been the main focus of VCs in the U.S. There are reasons to
expect the signaling value of a patent to be different in these two industries.
IT startups tend to be founded by younger entrepreneurs (Ewens, Nanda, and Rhodes-Kropf
2015) and their inventions often face substantial demand uncertainty and imitation risk. Thus, a
29 The sample of startups with inexperienced founders in column 1 is small, which results in a weak first stage
(F=7.4). Pooling startups with inexperienced and experienced founders in column 3 allows us to work with a larger
sample, resulting in a stronger first stage (F=27.2).

29
favorable decision on an IT startup’s first patent application can provide a particularly valuable
early signal about the quality of its technology and its founders, while also allowing the founders
to more freely discuss their idea with VCs without the fear of expropriation. Evidence from field
interviews of semiconductor firms suggests that the primary function of a patent in that industry
is “securing capital from private investors [for firms] in the startup phase” (Hall and Ziedonis
2001). In addition, recent evidence by Galasso and Schankerman (2015) indicates that patents
are particularly effective in blocking downstream innovation and imitation in the IT sector.30
Biochemistry startups, in contrast, tend to be founded by experienced scientists, the quality of
whose research can be evaluated using a variety of sources such as academic publications and
National Institutes of Health (NIH) grants (Li and Agha 2015). Biochemistry startups face
relatively little demand uncertainty or risk of imitation, with the greatest uncertainty coming
from the probability of technical success and the regulatory process (DiMasi 2003). As a result,
early patent decisions reveal little information about the quality of the founders or the potential
commercial success of their inventions.
Table 9, Panel C shows that the approval of an IT firm’s first patent application increases its
probability of raising VC funding in the next three years by 4.2 percentage points (p=0.010). In
biochemistry, on the other hand, patent approval has essentially no effect on VC funding
(p=0.693), consistent with our prior.
4.5 External validity
Any instrument identifies the “local average treatment effect” of the endogenous variable on
the compliant subpopulation (Angrist and Pischke 2009; Imbens and Wooldridge 2009).
Economically, this means, for example, that our 2SLS estimates identify how early patent grants
30 Hochberg, Serrano, and Ziedonis (2014) and Mann (2015) document the existence of a well-developed secondary
market for IT patents, which alleviates investors’ downside risk if the technology ends up not being viable.

30
affect the likelihood of raising VC funding only for the subpopulation of startups whose first
patent application is affected by their examiner’s leniency. These are likely to be marginal
applicants, for which being assigned a lenient or strict examiner can be the difference between
approval and rejection. For non-marginal applicants, the examiner’s type is unlikely to affect the
outcome of the patent review: obviously good applications will be granted and obviously poor
ones will be rejected.31
By the same token, patents likely matter little when deciding whether to invest in a startup of
obviously high or obviously low quality. Thus, a patent grant should alleviate information
frictions between the startup and potential investors (and thereby facilitate access to external
finance) the most for marginal patent applicants. This argument may explain why the 2SLS
estimates of the local average treatment effects of patent grants on VC funding tend to be greater
than the naïve coefficients estimated using OLS.
At the same time, our findings highlight the fact that the uncertainty and information
asymmetry surrounding innovative startups is so large that even what appear to be ex ante
marginal firms have the potential of turning into successful public companies.
5. Conclusions
We estimate the causal effect of a firm’s first patent on its growth, follow-on innovation, and
success. We use plausibly exogenous variation in patent approvals generated by the quasi-
random allocation of patent applications to examiners with varying propensity to approve
applications at the USPTO. Our analysis shows that patent approvals have a substantial and long-
lasting impact on startups: firms that receive their first patent create more jobs, enjoy higher sales
growth, innovate more, and are more likely to go public or be acquired. These positive effects of
31 In the case of our review-lag instrument, by contrast, the compliant subpopulation is likely the entire population:
all applicants’ review lag should be affected by exogenous administrative delays in the patent review process.

31
patent rights appear to be due to their role in facilitating startups’ access to capital which helps
them turn ideas into products and products into revenues. Our findings further suggest that the
facilitating role of patents is strongest for early-stage firms, for startups founded by
inexperienced entrepreneurs, and for firms in the IT sector. Thus, we conclude that patent rights
help overcome information frictions between startups and financiers.
We also estimate the effects of delays in patents being granted. Here, we combine exogenous
variation arising from two sources: the time it takes to assign patent applications to examiners
and individual examiners’ historical review speeds. We find that delays adversely affect startups’
employment and sales growth, subsequent innovation, and probability of going public or being
acquired. Together with our evidence showing that patents facilitate access to venture capital,
these findings suggest that the negative effects of review delays are transmitted via the reduced
chances of securing growth funding. When delays are substantial, their effects on startups can be
as adverse as those of outright patent denials.
Our findings speak to at least two related aspects of patent reform proposals currently before
Congress. First, calls for reforms frequently invoke the negative effects of patents on startups and
small firms. According to critics of the current patent system, startups and small firms are forced
to bear patent related costs (associated either with enforcing their patents or defending
themselves in patent infringement suits) without compensating benefits. Some of these critics
recommend either weakening the patent system or even doing away with it entirely (e.g., Boldrin
and Levine 2013), leading The Economist to editorialize on August 8, 2015 that “a top-to-bottom
reexamination of whether patents … actually do their job, and even whether they deserve to
exist, is long overdue.” Our results show that patents convey economically substantial benefits to
startups by facilitating contracting between them and their investors. While these findings on the

32
bright side of patents do not negate the presence of a dark side, they provide a note of caution
that there may be negative unintended consequences if the patent system were to be weakened.
Second, the adverse effects of review delays for startups should help inform reform proposals
targeted at accelerating the review process at the patent office. The USPTO has historically faced
budgetary constraints that limit its ability to allocate more resources to patent review. The
constraints force the agency to make choices among various priorities, including speeding up
reviews and improving review quality. Our findings suggest that the benefits of speeding up
reviews can be immediate and substantial, particularly for small inventors whom the patent
system is intended to protect.
The modern patent system is complex. In theory, it delivers private benefits and costs to
patentees but also generates positive and negative spillovers through many distinct channels, thus
making it impossible for any single empirical study to definitively establish the overall welfare
consequences of the patent system. Despite the abundance of evidence highlighting the spillover
effects of patent rights (e.g., Grilliches 1984; Jaffe 1986; Heller and Eisenberg 1998; Moser
2005; Williams 2013; Galasso and Schankerman 2015; Sampat and Williams 2015), empirical
evidence of the direct private benefits of patents to its owners remains scarce.
Our study helps fill this gap by providing the first causal evidence of the direct benefits of
patent rights in a large sample of startups. We find that patents offer a substantial bright side to
entrepreneurs and small inventors, especially if processed in a timely manner. In particular,
patents appear to play an important role in reducing uncertainty and alleviating information
asymmetries in the market for entrepreneurial capital. Reforms of the patent system that do not
take this role of patents into account run the risk of negatively impacting the availability of
capital for innovative startups.

33
References
Angrist, Joshua D. and Jörn-Steffen Pischke, Mostly Harmless Econometrics: An Empiricist’s
Companion (Princeton, NJ: Princeton University Press, 2009).
Anton, James J., and Dennis A. Yao, “Expropriation and Inventions: Appropriable Rents in the
Absence of Property Rights,” American Economic Review, 84 (1994), 190–209.
Arrow, Kenneth, “Economic Welfare and the Allocation of Resources for Invention,” in The
Rate and Direction of Inventive Activity: Economic and Social Factors, Harold M. Groves,
ed. (Princeton, NJ: Princeton University Press, 1962).
Asay, Clark D., et al., Letter to Congress dated March 02, 2015, available at:
http://www.utdallas.edu/~ugg041000/IPScholarsLettertoCongress_March_2_2015.pdf.
Balasubramanian, Natarajan, and Jagadeesh Sivadasan, “What Happens When Firms Patent?
New Evidence from US Economic Census Data,” Review of Economics and Statistics, 93
(2011), 126–146.
Becker, Gary, “On Reforming the Patent System,” post dated July 21, 2013, available at
http://www.becker-posner-blog.com/2013/07/on-reforming-the-patent-system-becker.html.
Bernstein, Shai, Xavier Giroud, and Richard Townsend, “The Impact of Venture Capital
Monitoring,” Journal of Finance, forthcoming, 2015.
Biais, Bruno, and Enrico Perotti, “Entrepreneurs and new ideas,” RAND Journal of
Economics, 39 (2008), 1105–1125.
Black, Bernard S., and Ronald J. Gilson, “Venture Capital and the Structure of Capital Markets:
Banks Versus Stock Markets.” Journal of Financial Economics, 47 (1998), 243–277.
Boldrin, Michele, and David K. Levine, “The Case Against Patents,” Journal of Economic
Perspectives, 27 (2013), 3–22.
Carley, Michael, Deepak Hegde, and Alan Marco, “What is the Probability of Receiving a U.S.
Patent?,” Yale Journal of Law and Technology, 17 (2015), 204–223.
Cockburn, Iain M., Samuel Kortum, and Scott Stern, “Are All Patent Examiners Equal?
Examiners, Patent Characteristics, and Litigation Outcomes,” in Patents in the Knowledge-
Based Economy, Wesley M. Cohen and Stephen A. Merrill, ed. (Washington, D.C.: National
Academies Press, 2003).
Cohen, Lauren, Unit Gurun, and Scott D. Kominers, “Patent Trolls: Evidence from Targeted
Firms,” NBER Working Paper No. w20322, 2014.
Cohen, Wesley M., and Stephen A. Merrill, ed., Patents in the Knowledge-Based Economy
(Washington, DC: National Academies Press, 2003).
Conti, Annamaria, Marie Thursby, and Frank T. Rothaermel, “Show Me the Right Stuff: Signals
for High–Tech Startups,” Journal of Economics and Management Strategy, 22 (2013), 341–
364.
Conti, Annamaria, Jerry Thursby, and Marie Thursby, “Patents as Signals for Startup
Financing,” Journal of Industrial Economics, 61 (2013), 592–622.
34
DiMasi, Joseph A., Ronald W. Hansen, and Henry G. Grabowski, “The Price of Innovation: New
Estimates of Drug Development Costs,” Journal of Health Economics, 22 (2003), 151–185.
Evans, David S., and Boyan Jovanovic, “An Estimated Model of Entrepreneurial Choice Under
Liquidity Constraints,” Journal of Political Economy, 97 (1989), 808–827.
Ewens, Michael, Ramana Nanda, and Matthew Rhodes-Kropf, “Entrepreneurship and the Cost of
Experimentation,” Working Paper, 2015.
Frakes, Michael and Melissa F. Wasserman, “Patent Office Cohorts,” Working Paper, 2015.
Galasso, Alberto, and Mark Schankerman, “Patents and Cumulative Innovation: Causal
Evidence from the Courts,” Quarterly Journal of Economics, 130 (2015), 317–369.
Gompers, Paul A., “Optimal Investment, Monitoring, and the Staging of Venture
Capital,” Journal of Finance, 50 (1995), 1461–1489.
Gompers, Paul, and Josh Lerner, “The Venture Capital Revolution,” Journal of Economic
Perspectives, 15 (2001), 145–168.
Gorman, Michael, and William A. Sahlman, “What Do Venture Capitalists Do?,” Journal of
Business Venturing, 4 (1989), 231–248.
Griliches, Zvi, R&D, Patents and Productivity (Chicago, IL: University of Chicago Press, 1984).
Hall, Bronwyn H., and Rosemarie H. Ziedonis, “The Patent Paradox Revisited: An Empirical
Study of Patenting in the U.S. Semiconductor Industry, 1979-1995,” RAND Journal of
Economics, 32 (2001), 101–128.
Heller, Michael A., and Rebecca S. Eisenberg, “Can Patents Deter Innovation? The
Anticommons in Biomedical Research,” Science, 280 (1998), 698–701.
Hellman, Thomas, and Manju Puri, “The Interaction Between Product Market and Financing
Strategy: The Role of Venture Capital,” Review of Financial Studies, 134 (2000), 959–984.
Hochberg, Yael V., Alexander Ljungqvist, and Yang Lu, “Whom You Know Matters: Venture
Capital Networks and Investment Performance,” Journal of Finance, 62 (2007), 251–301.
Hochberg, Yael V., Carlos J. Serrano, and Rosemarie H. Ziedonis, “Patent Collateral, Investor
Commitment, and the Market for Venture Lending,” NBER Working Paper No. 20587, 2014.
Hsu, David H., and Rosemarie H. Ziedonis, “Resources as Dual Sources of Advantage:
Implications for Valuing Entrepreneurial Firm Patents,” Strategic Management Journal 34
(2013): 761–781.
Imbens, Guido W. and Jeffrey M. Wooldridge, “Recent Developments in the Econometrics of
Program Evaluation,” Journal of Economic Literature, 47 (2009), 5–86.
Jaffe, Adam, “Technological Opportunity and Spillovers of R&D: Evidence from Firms' Patents,
Profits and Market Value,” American Economic Review, 76 (1986), 984–1001.
Jaffe, Adam B., and Josh Lerner, Innovation and Its Discontents: How Our Broken Patent
System Is Endangering Innovation and Progress, and What to Do About It, (Princeton, NJ:
Princeton University Press, 2011).
Kaplan, Steven N., and Per Stromberg, “Financial Contracting Theory Meets the Real World: An
Empirical Analysis of Venture Capital Contracts,” Review of Economic Studies, 70 (2003),
281–315.

35
Kortum, Samuel, and Josh Lerner, “Assessing the Contribution of Venture Capital to
Innovation,” RAND Journal of Economics, 31 (2000), 674–692.
Lemley, Mark A., and Bhaven N. Sampat, “Is the Patent Office a Rubber Stamp?,” Emory Law
Journal, 58 (2008), 181–209.
Lemley, Mark A., and Bhaven N. Sampat, “Examiner Characteristics and Patent Office
Outcomes,” Review of Economics and Statistics, 94 (2012), 817–827.
Lemley, Mark A., and Carl Shapiro, “Patent Holdup and Royalty Stacking,” Texas Law Review,
85 (2007), 1991–2049.
LeRoy, Stephen F., and Larry D. Singell, “Knight on Risk and Uncertainty,” Journal of Political
Economy, 95 (1987), 394–406.
Li, Danielle, and Leila Agha, “Big Names or Big ideas: Do Peer-Review Panels Select the Best
Science Proposals?,” Science, 348 (2015), 434–438.
Lichtman, Douglas, “Rethinking Prosecution History Estoppel,” University of Chicago Law
Review, 71 (2004), 151–182.
Long, Clarisa, “Patent Signals,” University of Chicago Law Review, 69 (2002), 625–679.
Marco, Alan, Michael Carley, Steven Jackson, Amanda Myers, “The USPTO Historical Patent
Data Files,” US Patent and Trademark Office Working Paper No. 2015-1, 2015.
Mann, William, “Creditor Rights and Innovation: Evidence from Patent Collateral,” Working
Paper, 2015.
Nordhaus, William D., “An Economic Theory of Technological Change,” American Economic
Review, 59 (1969), 18–28.
Moser, Petra, “How Do Patent Laws Influence Innovation? Evidence from Nineteenth-Century
World’s Fairs,” American Economic Review, 95 (2005), 1214–1236.
Quillen, Cecil D., and Odgen H. Webster, “Continuing Patent Applications and Performance of
the US Patent and Trademark Office,” Federal Circuit Bar Journal, 11 (2001), 1–21.
Sampat, Bhaven N., and Mark A. Lemley, “Examining Patent Examination,” Stanford
Technology Law Review, 2010 (2010).
Sampat, B., and Heidi L. Williams, “How Do Patents Affect Follow-On Innovation? Evidence
from the Human Genome,” NBER Working Paper No. w21666, 2015.
Sørensen, Jesper B, “Bureaucracy and Entrepreneurship: Workplace Effects on Entrepreneurial
Entry,” Administrative Science Quarterly, 52 (2007), 387–412.
Stock, James H., and Motohiro Yogo, “Testing for Weak Instruments in Linear IV Regression,”
in Identification and Inference for Econometric Models, Donald W.K. Andrews and James H.
Stock, ed. (New York, NY: Cambridge University Press, 2005).
Sudek, Richard, “Angel Investment Criteria,” Journal of Small Business Strategy, 17 (2006), 89–
103.
Tucker, Catherine, “Patent Trolls and Technology Diffusion: The Case of Medical Imaging,”
Working Paper, 2014.
Williams, Heidi, “Intellectual Property Rights and Innovation: Evidence from the Human
Genome,” Journal of Political Economy, 121 (2013), 1–27.

36
Appendix A. Variable Definitions.
Employment growth after the first-action decision on a firm’s first patent application is employmentt+j / employmentt
−1, where t is the first-action year and j =1…5. If a firm dies and thus does not appear in NETS in year t+j, we set
employmentt+j = 0.
Sales growth after the first-action decision on a firm’s first patent application is defined analogously as employment
growth.
Pre-patent-filing employment growth is employmentt /employmentt-1 −1, where t is the year that a firm’s first patent
application is filed.
Pre-patent-filing sales growth is defined analogously as pre-patent-filing employment growth.
No. subsequent patent applications is the number of applications with a filing date greater than the first-action date
of a firm’s first application.
No. subsequent approved patents is the number of approved applications with a filing date greater than the first-
action date of a firm’s first application.
Approval rate of subsequent patent applications is defined as no. subsequent approved patents / no. subsequent
patent applications. It is only defined for firms with at least one subsequent patent application.
Total citations to all subsequent patent applications is the number of citations received by all subsequent patent
applications combined (this number is zero for firms with no subsequent applications). We measure citations over
the five years following each patent application’s public disclosure date, which is typically 18 months after the
application’s filing date.
Average citations-per-patent to subsequent approved patents is the average number of citations received by those
subsequent patent applications that are approved. It is only defined for firms with at least one subsequent approved
patent.
Experienced founder is an indicator set equal to one if at least one of the up to five key executives of the startup
listed on Standard & Poor’s Capital IQ database previously founded a different firm according to the professional
background provided by Capital IQ.
Industry classification. IT startups are those whose first patent application is reviewed by an examiner belonging to
art unit in one of the following USPTO technology centers: 21 (computer architecture, software, and information
security); 24 (computer networks, multiplex communication, video distribution, and security); 26 (communications);
or 28 (semiconductors, electrical and optical systems and components). Biochemistry startups are those whose first
patent application is reviewed by one of the following technology centers: 16 (biotechnology and organic
chemistry); 17 (chemical and materials engineering). Startups belonging to other industries are those whose first
patent application is reviewed by one of the following technology centers: 36 (transportation, construction,
electronic commerce, agriculture, national security and license & review); 37 (mechanical engineering,
manufacturing, products).

37
Figure 1. Distribution of Patent Examiners’ Approval Rates. Panel A shows the sample distribution of patent examiner approval rates, defined as in equation (2). Panel B shows
the distribution of residual approval rates, obtained from a regression of approval rates on a full set of art-unit-by-
application-year fixed effects.
Panel A. Raw approval rates.
0
.05
.1.1
5
Fra
ctio
n
0 .2 .4 .6 .8 1
Examiner approval rate (raw)
Panel B. Residual approval rates.
0
.05
.1.1
5.2
Fra
ctio
n
-1 -.5 0 .5
Examiner approval rate (residual)
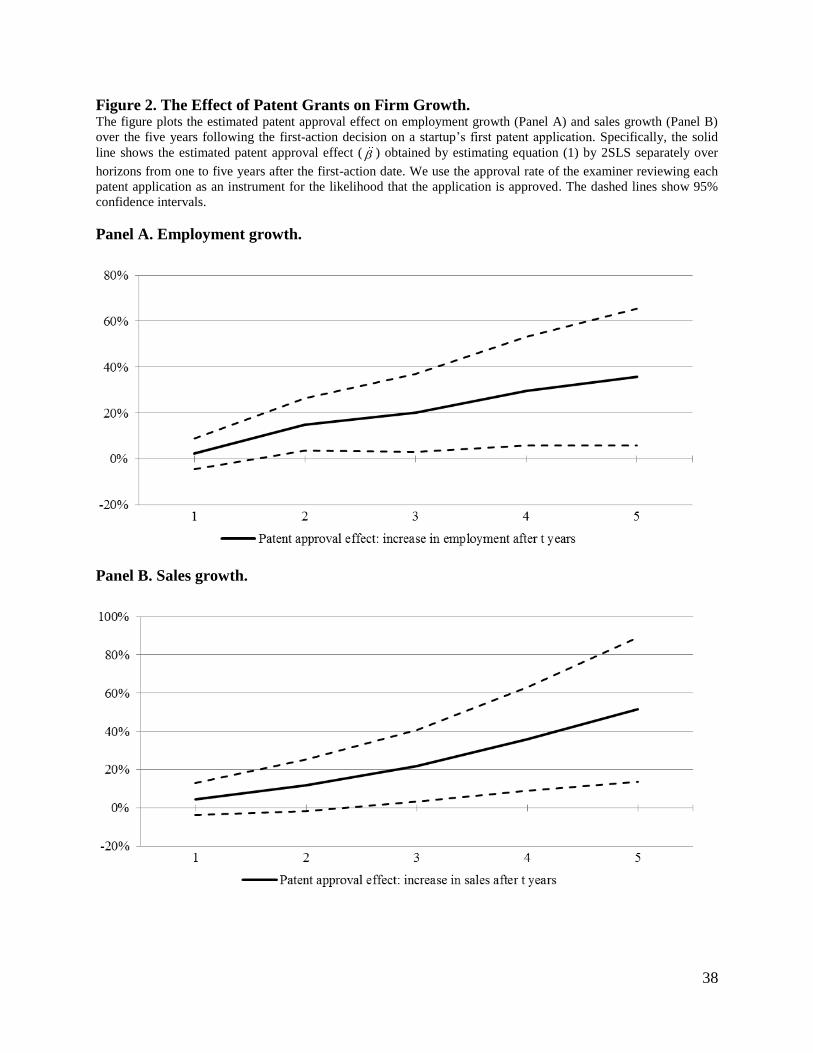
38
Figure 2. The Effect of Patent Grants on Firm Growth. The figure plots the estimated patent approval effect on employment growth (Panel A) and sales growth (Panel B)
over the five years following the first-action decision on a startup’s first patent application. Specifically, the solid
line shows the estimated patent approval effect ( ) obtained by estimating equation (1) by 2SLS separately over
horizons from one to five years after the first-action date. We use the approval rate of the examiner reviewing each
patent application as an instrument for the likelihood that the application is approved. The dashed lines show 95%
confidence intervals.
Panel A. Employment growth.
Panel B. Sales growth.

39
Figure 3. Distribution of our IV for Patent Review Lags. Panel A shows the sample distribution of the review-lag instrument, defined as the sum of the years a patent
application takes from the filing date to the date it is assigned to an examiner’s docket and the average number of
years that examiner has taken in the past to process application from docket to first-action. Panel B shows the
distribution of the residuals obtained after regressing the instrument on a full set of art-unit-by-application-year fixed
effects.
Panel A. Raw IV. 0
.05
.1.1
5.2
Fra
ctio
n
0 2 4 6 8
Years from application to docket +average years examiner has taken from docket to first-action
in the past (raw)
Panel B. Residual IV.
0.1
.2.3
Fra
ctio
n
-4 -2 0 2 4
Years from application to docket +average years the examiner has taken in the past
from docket to first-action (residual)

40
Figure 4. The Effect of Patent Review Delays on Firm Growth. The figure plots the estimated effect of a year’s delay in reviewing a startup’s first patent application on the startup’s
employment growth (Panel A) and sales growth (Panel B) over the five years following the first-action decision on
the application. Specifically, the solid line shows the estimated review lag effect ( ) obtained by estimating
equation (4) by 2SLS separately over horizons from one to five years after the first-action date. We use the sum of
the time a patent application takes from the filing date to the date it is assigned to an examiner’s docket and the
average time that examiner has taken in the past from docket to first-action to instrument the application’s review
lag. The dashed lines show 95% confidence intervals.
Panel A. Employment growth.
Panel B. Sales growth.

41
Table 1. Summary Statistics. The table reports summary statistics for the firms in our sample of first-time patent applicants (or “startups”) whose
first application is approved or rejected. The employment and sales data used in Panel A are only available for those
startups that can be matched to the National Establishment Times Series (NETS) database. For variable definitions
and details of their construction see Appendix A.
Startups whose first patent
application is …
approved rejected
No. startups 30,121 15,698
% of startups 65.7% 34.3%
Panel A. Employment and sales
Employees at first-action date mean 28.7 27.9
median 8.0 8.0
st.dev. 47.9 47.2
Sales at first-action date ($ million) mean 4.4 4.3
median 1.0 0.8
st.dev. 8.0 8.2
Pre-patent-filing employment growth mean 17.6% 16.0%
st.dev. 75.7% 70.6%
Pre-patent-filing sales growth mean 19.2% 17.0%
st.dev. 78.8% 73.8%
Employment growth after first-action decision on the startup’s first application, measured over the following …
… 1 year mean 5.4% -1.5%
st.dev. 52.7% 48.2%
… 3 years mean 15.4% -1.0%
st.dev. 121.6% 111.7%
… 5 years mean 20.5% -4.2%
st.dev. 159.4% 133.2%
Sales growth after first-action decision on the startup’s first application, measured over the following …
… 1 year mean 7.5% -0.2%
st.dev. 62.6% 56.9%
… 3 years mean 22.7% 5.2%
st.dev. 144.4% 135.7%
… 5 years mean 37.1% 7.5%
st.dev. 210.2% 176.6%
Panel B. Subsequent patenting: Patent applications filed after first-action on startup’s first application
No. subsequent patent applications mean 3.3 1.2
st.dev. 16.8 5.9
No. subsequent approved patents mean 1.8 0.5
st.dev. 9.6 2.8
Approval rate of subsequent patent applications 57.1% 36.4%
Total citations to all subsequent patent applications mean 7.5 1.9
st.dev. 72.4 23.9
Average citations-per-patent to subsequent approved patents mean 1.9 1.5
st.dev. 3.8 3.0
Panel C. IPOs, acquisitions, and VC funding after first-action on the startup's first application
% of startups that go public 0.68% 0.43%
% of startups that go public or are acquired 2.7% 2.0%
% of startups that raise VC funding over following 3 years 4.8% 3.4%

42
Table 2. Patent Examiner Approval Rate as IV: First-stage Results. The table reports the results of estimating the first-stage equation (3) of our 2SLS analysis of the real effects of
patent grants. Specifically, we use the approval rate of the patent examiner in charge of reviewing a startup’s first
patent application to predict whether the application will be approved. In column 1, equation (3) is estimated in the
full sample. In columns 2 and 3, we control for firm size using the log number of employees or log sales, which are
only available for startups that can be matched to NETS. All specifications are estimated using OLS.
Heteroskedasticity consistent standard errors clustered at the art unit level are shown in italics underneath the
coefficient estimates. We use ***, **, and * to denote significance at the 1%, 5%, and 10% level (two-sided),
respectively.
First patent application approved?
(1) (2) (3)
IV: Patent examiner approval rate 0.670*** 0.658*** 0.660*** 0.017 0.022 0.022
Log (number of employees at first-action) 0.001 0.002
Log (sales at first-action) 0.002 0.002
Art unit × year fixed effects Yes Yes Yes
HQ state fixed effects Yes Yes Yes
Diagnostics
R2 23.9% 27.3% 27.4%
F test: IV (examiner approval rate) = 0 1,608.0*** 928.7*** 921.0***
No. of observations (startups) 45,819 21,870 21,830

43
Table 3. How Do Patent Grants Affect Employment and Sales Growth? The table reports the results of estimating equation (1) to examine how the approval of a startup’s first patent application affects the startup’s subsequent growth
in employment (Panel A) and sales (Panel B). Odd-numbered columns report OLS results while even-numbered columns report 2SLS results using the approval
rate of the examiner reviewing the patent application as an instrument for the likelihood that the application is approved. Employment and sales data come from
NETS; thus, startups that cannot be matched to NETS are excluded. NETS data are available through 2011, resulting in reduced sample sizes when we consider
three-year and five-year outcomes. For variable definitions and details of their construction see Appendix A. Heteroskedasticity consistent standard errors
clustered at the art unit level are shown in italics underneath the coefficient estimates. We use ***, **, and * to denote significance at the 1%, 5%, and 10% level
(two-sided), respectively.
Employment or sales growth after first-action decision on the startup’s first patent application,
measured over the following …
1 year 3 years 5 years
OLS 2SLS OLS 2SLS OLS 2SLS
(1) (2) (3) (4) (5) (6)
Panel A. Employment growth
First patent application approved 0.073*** 0.023 0.154*** 0.201** 0.250*** 0.356** 0.009 0.035 0.022 0.087 0.037 0.152
Log (employees at first-action) -0.021*** -0.020*** -0.067*** -0.067*** -0.097*** -0.097*** 0.002 0.002 0.006 0.006 0.009 0.009
Diagnostics
R2 12.6% n.a. 13.2% n.a. 14.3% n.a.
Mean of dep. variable 3.1% 3.1% 10.2% 10.2% 13.6% 13.6%
F test from 1st stage: IV (examiner approval rate) = 0 928.7*** 794.4*** 468.9***
No. of observations (startups) 21,870 21,870 19,010 19,010 12,799 12,799
Panel B. Sales growth
First patent application approved 0.078*** 0.046 0.157*** 0.219** 0.291*** 0.514*** 0.010 0.042 0.027 0.096 0.051 0.193
Log (sales at first-action) -0.019*** -0.019*** -0.064*** -0.064*** -0.116*** -0.116*** 0.002 0.002 0.007 0.006 0.012 0.012
Diagnostics
R2 12.7% n.a. 13.0% n.a. 25.9% n.a.
Mean of dep. variable 5.0% 5.0% 17.2% 17.2% 28.9% 28.9%
F test from 1st stage: IV (examiner approval rate) = 0 921.0*** 788.6*** 471.4***
No. of observations (startups) 21,830 21,830 18,979 18,979 12,782 12,782

44
Table 4. How Do Patent Grants Affect Subsequent Innovation, Future IPOs, and Future Acquisitions? The table reports the results of estimating equation (1) to examine how the approval of a startup’s first patent application affects the startup’s subsequent
innovation (columns 1-5) and the likelihood that the startup lists on a stock market or is acquired by another company after the first-action decision (columns 6-
7). Data on subsequent applications come from the USPTO internal databases and include all applications that receive a final decision through December 31,
2013. Column 3 includes only startups filing at least one patent application after the first-action decision on the startup’s first patent application and for which we
can measure the approval rate of subsequent applications. Column 5 includes only those startups with at least one subsequent patent approval and for which we
can measure the average number of citations-per-patent to subsequently approved patents. We measure citations over the five years following each patent
application’s public disclosure date, which is typically 18 months after the application’s filing date. (Citation information is missing for one startup.) For variable
definitions and further details of their construction see Appendix A. All specifications are estimated by 2SLS using the approval rate of the examiner reviewing
each patent application as an instrument for the likelihood that the application is approved. Heteroskedasticity consistent standard errors clustered at the art unit
level are shown in italics underneath the coefficient estimates. We use ***, **, and * to denote significance at the 1%, 5%, and 10% level (two-sided),
respectively.
Subsequent innovation Future exits
Log (1 +
subsequent
patent
applications)
Log (1 +
subsequent
approved
patents)
Approval rate
of subsequent
patent
applications
Log (1 + total
citations to all
subsequent
patent
applications)
Log (1 +
average
citations-per-
patent to
subsequent
approved
patents)
Startup goes
public?
Startup goes
public or
is acquired?
(1) (2) (3) (4) (5) (6) (7)
First patent appl. approved 0.512*** 0.398*** 0.177*** 0.524*** 0.236*** 0.0090*** 0.0210*** 0.036 0.029 0.036 0.045 0.075 0.0033 0.0062
Diagnostics
Mean of non-logged dep. var. 2.7 1.5 54.3% 6.1 1.9 0.59% 2.50%
F test from 1st stage:
IV (examiner approval rate) = 0 1,608.0*** 1,608.0*** 735.4*** 1,608.1*** 359.8***
1,606.6*** 1,606.6***
No. of observations (startups) 45,819 45,819 18,555 45,818 13,711 45,819 45,819

45
Table 5. Instrumenting Patent Review Delays: First-stage Results. The table reports the results of estimating the first-stage equation (5) of our 2SLS analysis of the real effects of
patent review delays. Specifically, we use the sum of the time a patent application takes from filing to the date it is
assigned to an examiner’s docket and the average time that examiner has taken in the past from docket to first-action
to predict the application’s review lag (i.e., the number of years between the application’s filing date and the date of
the examiner’s first-action decision on the application). Column 1 estimates equation (5) in the full sample. Columns
2 and 3 control for firm size using the log number of employees or log sales, which are only available for those
startups that can be matched to NETS. All specifications are estimated using OLS. Heteroskedasticity consistent
standard errors clustered at the art unit level are shown in italics underneath the coefficient estimates. We use ***,
**, and * to denote significance at the 1%, 5%, and 10% level (two-sided), respectively.
First patent review lag
(1) (2) (3)
IV: Years from filing to docket + average years examiner
has taken from docket to first-action in the past 0.538*** 0.549*** 0.550*** 0.014 0.016 0.016
Log (number of employees at first-action) -0.012*** 0.003
Log (sales at first-action) -0.009*** 0.003
Art unit × year fixed effects Yes Yes Yes
HQ state fixed effects Yes Yes Yes
Diagnostics
R2 61.4% 64.2% 64.2%
F test: IV = 0 1,534.6*** 1,120.4*** 1,120.3***
No. of observations (startups) 29,831 14,231 14,209

46
Table 6. How Do Patent Review Delays Affect Employment and Sales Growth? The table reports the results of estimating equation (4) in the subsample of successful first-time patent applicants to examine how the review lag of a startup’s
first patent application (i.e., the number of years from filing to first-action) affects the startup’s growth in employment (Panel A) and sales (Panel B). Odd-
numbered columns report OLS results. Even-numbered columns report 2SLS results. We instrument review lags using the sum of the time a patent application
takes from the filing date to the date it is assigned to an examiner’s docket and the average time that examiner has taken in the past from docket to first-action.
Employment and sales data come from NETS; thus, startups that cannot be matched to NETS are excluded. NETS data are available through 2011, resulting in
reduced sample sizes when we consider three-year and five-year outcomes. For variable definitions and details of their construction see Appendix A.
Heteroskedasticity consistent standard errors clustered at the art unit level are shown in italics underneath the coefficient estimates. We use ***, **, and * to
denote significance at the 1%, 5%, and 10% level (two-sided), respectively.
Employment or sales growth after first-action decision on the startup’s first patent application,
measured over the following …
1 year 3 years 5 years
OLS 2SLS OLS 2SLS OLS 2SLS
(1) (2) (3) (4) (5) (6)
Panel A. Employment growth
First patent review lag -0.024*** -0.025 -0.127*** -0.084** -0.193*** -0.209** 0.008 0.016 0.024 0.039 0.042 0.086
Log (employees at first-action) -0.026*** -0.026*** -0.078*** -0.077*** -0.120*** -0.120*** 0.003 0.003 0.008 0.007 0.012 0.011
Diagnostics
R2 16.2% n.a. 17.1% n.a. 17.8% n.a.
Mean of dep. variable 5.2% 5.2% 15.5% 15.5% 20.1% 20.1%
F test from 1st stage: IV = 0 1,120.4*** 1,053.4*** 668.2***
No. of observations (startups) 14,231 14,231 12,650 12,650 9,184 9,184
Panel B. Sales growth
First patent review lag -0.021** -0.036** -0.134*** -0.128*** -0.233*** -0.284*** 0.009 0.017 0.026 0.047 0.051 0.109
Log (sales at first-action) -0.023*** -0.023*** -0.072*** -0.072*** -0.139*** -0.139*** 0.003 0.003 0.009 0.008 0.016 0.015
Diagnostics
R2 15.7% n.a. 16.9% n.a. 17.8% n.a.
Mean of dep. variable 7.4% 7.4% 23.0% 23.0% 36.4% 36.4%
F test from 1st stage: IV = 0 1,120.3*** 1,049.3*** 666.7***
No. of observations (startups) 14,209 14,209 12,634 12,634 9,175 9,175

47
Table 7. How Do Patent Review Delays Affect Subsequent Innovation, Future IPOs, and Future Acquisitions? The table reports the results of estimating equation (4) in the subsample of successful first-time patent applicants to examine how the review lag of a startup’s
first patent application (i.e., the number of years from filing to first-action) affects the startup’s subsequent innovation (columns 1-5) and the likelihood that the
startup eventually lists on a stock market or is acquired by another company (columns 6-7). For details on the sample used in each column, see Table 4. For
variable definitions and further details of their construction see Appendix A. All specifications are estimated by 2SLS. We instrument review lags using the sum
of the time a patent application takes from the filing date to the date it is assigned to an examiner’s docket and the average time that examiner has taken in the
past from docket to first-action. Heteroskedasticity consistent standard errors clustered at the art unit level are shown in italics underneath the coefficient
estimates. We use ***, **, and * to denote significance at the 1%, 5%, and 10% level (two-sided), respectively.
Subsequent innovation Future exits
Log (1 +
subsequent
patent
applications)
Log (1 +
subsequent
approved
patents)
Approval rate
of subsequent
patent
applications
Log (1 + total
citations to all
subsequent
patent
applications)
Log (1 +
average
citations-per-
patent to
subsequent
approved
patents)
Startup goes
public?
Startup goes
public or
is acquired?
(1) (2) (3) (4) (5) (6) (7)
First patent review lag -0.140*** -0.136*** -0.041*** -0.186*** -0.074*** -0.0039** -0.0062* 0.019 0.016 0.011 0.024 0.024 0.0018 0.0034
Diagnostics
Mean of non-logged dep. var. 3.4 2.0 58.7% 8.1 2.0 0.7% 2.7%
F test from 1st stage: IV = 0 1,534.6*** 1,534.6*** 1,302.0*** 1,534.6*** 860.1*** 1,534.4*** 1,534.4***
No. of observations (startups) 29,831 29,831 14,407 29,831 11,291 29,831 29,831

48
Table 8. Do Patents Affect Access to VC Funding? The table reports the results of estimating equation (6) to examine how the approval of a startup’s first patent application affects the startup’s ability to raise VC
funding. The dependent variable in columns 1-5 is an indicator set equal to one if the startup raises VC funding at some point in the 1…5 years following the
first-action decision, respectively. Startups that do not raise VC funding but instead go public in the 1…5 years after first-action are excluded. We also exclude
rare instances of startups that have raised five or more VC rounds by the first-action date. (Results are robust to using alternative cutoffs or to not excluding these
startups.) All specifications are estimated by 2SLS using the approval rate of the examiner reviewing each patent application as an instrument for the likelihood
that the application is approved. Heteroskedasticity consistent standard errors clustered at the art unit level are shown in italics underneath the coefficient
estimates. We use ***, **, and * to denote significance at the 1%, 5%, and 10% level (two-sided), respectively.
Following the first-action decision on its first patent application,
does the startup raise VC funding in the next …
… 1 year? … 2 years? … 3 years? … 4 years? … 5 years?
(1) (2) (3) (4) (5)
First patent application approved 0.012*** 0.021*** 0.023*** 0.027*** 0.028*** 0.006 0.008 0.008 0.008 0.008
Log(1 + # prior VC rounds) 0.272*** 0.382*** 0.408*** 0.418*** 0.421*** 0.010 0.011 0.011 0.011 0.011
Diagnostics
Mean of dep. variable 2.6% 3.8% 4.3% 4.6% 4.7%
Median no. months from first-action to VC
round for successful applicants 5.1 8.0 9.2 10.0 10.3
F test from 1st stage:
IV (examiner approval rate) = 0 1,566.1*** 1,561.2*** 1,558.6*** 1,557.5*** 1,558.2***
No. of observations (startups) 45,299 45,286 45,275 45,256 45,251

49
Table 9. How Do Patents Affect Access to VC Funding? Subsample Analyses. The table examines how the effect of patent grants on facilitating access to VC funding varies across different
subsamples. The dependent variable in all panels is an indicator set equal to one if the startup raises VC funding at
some point in the 3 years following the first-action decision on its first patent application. (Startups that do not raise
VC funding but instead go public in the 3 years following first-action are excluded.) Panel A splits startups by the
number of VC rounds raised before the first-action date as follows: column 1 models startups without prior VC
funding; columns 2 and 3 model startups with one or two prior rounds, respectively; and column 4 models startups
with three or more prior rounds. Panel B splits startups by their founders’ prior entrepreneurial experience as
follows: column 1 models startups whose founding team includes no founder with prior startup experience; column
2 models startups with at least one experienced founder; and column 3 allows the patent approval effect to vary with
experience in a pooled sample of startups with experienced and inexperienced founders. (Column 3 has more
observations than columns 1 and 2 combined because there are fewer art-unit-by-year singletons in column 3 than in
columns 1 and 2.) Data on founder experience come from Capital IQ and are only available for startups that raise
VC funding at some point in their lives. As a result, the sample in Panel B includes only startups that have raised at
least one prior VC round. We cannot analyze how patents affect the likelihood of raising the first VC round within
the subsample of startups for which experience data are available: by construction, all startups for which we observe
experience that have not raised VC funding by the first-action date go on to raise at least a first VC round. Panel C
splits startups by industry. Panels B and C exclude rare instances of startups that have raised five or more VC rounds
by the first-action date. (Results are robust to using alternative cutoffs or to not excluding these startups.) For
variable definitions and details of their construction see Appendix A. All specifications are estimated by 2SLS using
the approval rate of the examiner reviewing each patent application as an instrument for the likelihood that the
application is approved. Heteroskedasticity consistent standard errors clustered at the art unit level are shown in
italics underneath the coefficient estimates. We use ***, **, and * to denote significance at the 1%, 5%, and 10%
level (two-sided), respectively.
Panel A. Variation in funding round.
In the 3 years following the first-action decision on its first patent
application, does the startup raise …
its first VC
round?
its second VC
round?
its third VC
round?
its fourth or
higher VC
round?
(1) (2) (3) (4)
First patent application approved 0.010** 0.467*** 0.218 0.169 0.005 0.155 0.235 0.163
Log(1 + # prior VC rounds) -0.164* 0.095
Diagnostics
Mean of dep. variable 1.2% 39.5% 51.1% 53.1%
F test from 1st stage:
IV (examiner approval rate) = 0 1,384.4*** 14.5*** 11.4*** 13.3***
No. of observations (startups) 42,254 501 350 892
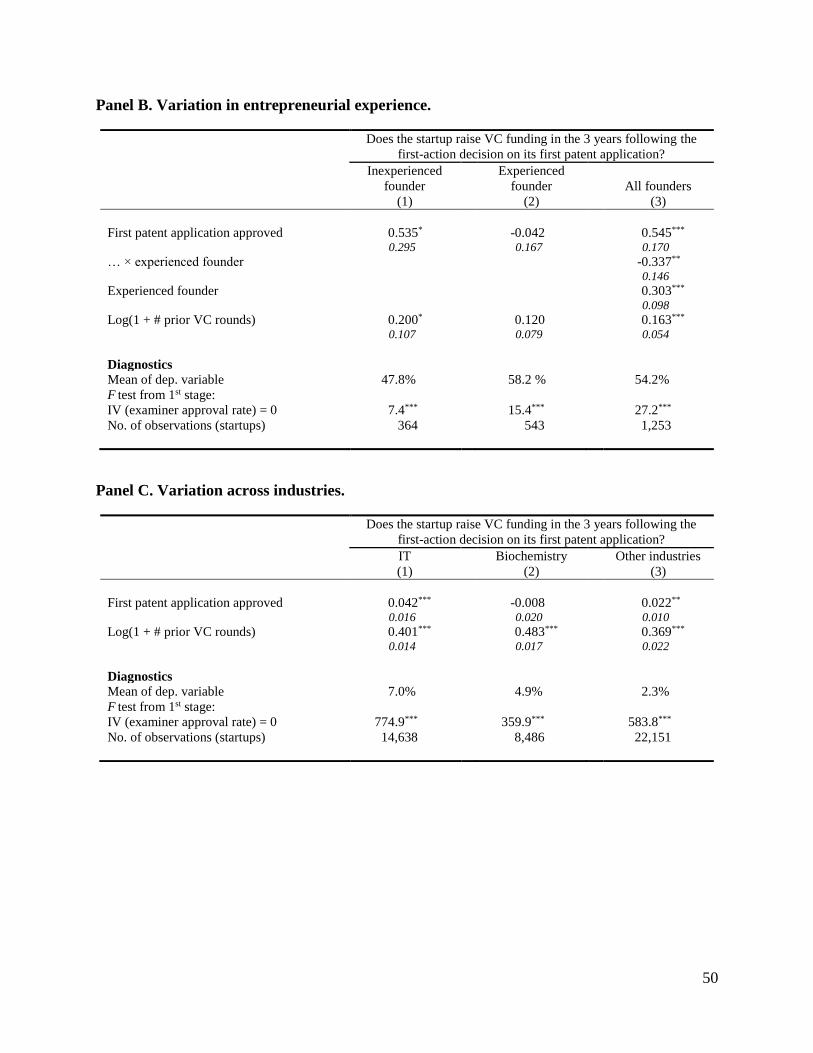
50
Panel B. Variation in entrepreneurial experience.
Does the startup raise VC funding in the 3 years following the
first-action decision on its first patent application?
Inexperienced
founder
Experienced
founder
All founders
(1) (2) (3)
First patent application approved 0.535* -0.042 0.545*** 0.295 0.167 0.170
… × experienced founder -0.337** 0.146
Experienced founder 0.303*** 0.098
Log(1 + # prior VC rounds) 0.200* 0.120 0.163*** 0.107 0.079 0.054
Diagnostics
Mean of dep. variable 47.8% 58.2 % 54.2%
F test from 1st stage:
IV (examiner approval rate) = 0 7.4***
15.4***
27.2***
No. of observations (startups) 364 543 1,253
Panel C. Variation across industries.
Does the startup raise VC funding in the 3 years following the
first-action decision on its first patent application?
IT Biochemistry Other industries
(1) (2) (3)
First patent application approved 0.042*** -0.008 0.022** 0.016 0.020 0.010
Log(1 + # prior VC rounds) 0.401*** 0.483*** 0.369*** 0.014 0.017 0.022
Diagnostics
Mean of dep. variable 7.0% 4.9% 2.3%
F test from 1st stage:
IV (examiner approval rate) = 0 774.9***
359.9***
583.8***
No. of observations (startups) 14,638 8,486 22,151

INTERNET APPENDIX
(NOT INTENDED FOR PUBLICATION)

1
Table IA.1. How Do Patent Grants Affect Subsequent Innovation, Future IPOs, and Future Acquisitions? OLS Results. The table reports the results of estimating equation (1) to examine how the approval of a startup’s first patent application affects the startup’s subsequent
innovation (columns 1-5) and the likelihood that the startup lists on a stock market or is acquired by another company after the first-action decision (columns 6-
7). The analysis here is analogous to Table 4, with the only difference being that we use OLS instead of 2SLS. Heteroskedasticity consistent standard errors
clustered at the art unit level are shown in italics underneath the coefficient estimates. We use ***, **, and * to denote significance at the 1%, 5%, and 10% level
(two-sided), respectively.
Subsequent innovation Future exits
Log (1 +
subsequent
patent
applications)
Log (1 +
subsequent
approved
patents)
Approval rate
of subsequent
patent
applications
Log (1 + total
citations to all
subsequent
patent
applications)
Log (1 +
average
citations-per-
patent to
subsequent
approved
patents)
Startup goes
public?
Startup goes
public or
is acquired?
(1) (2) (3) (4) (5) (6) (7)
First patent appl. approved 0.351*** 0.290*** 0.159*** 0.333*** 0.059*** 0.0031*** 0.0097*** 0.012 0.009 0.008 0.015 0.016 0.0009 0.0018
Diagnostics
R2 17.1% 16.8% 19.8% 17.3% 26.1% 10.2% 11.7%
Mean of non-logged dep. var. 2.7 1.5 54.3% 6.1 1.9 0.59% 2.50%
No. of observations (startups) 45,819 45,819 18,555 45,818 13,711 45,819 45,819

2
Table IA.2. How Do Patent Review Delays Affect Subsequent Innovation, Future IPOs, and Future Acquisitions? OLS Results. The table reports the results of estimating equation (4) within the subsample of successful first-time patent applicants to examine how the review lag of a
startup’s first patent application (i.e., the number of years from filing to first-action) affects the startup’s subsequent innovation (columns 1-5) and the likelihood
that the startup eventually lists on a stock market or is acquired by another company (columns 6-7). The analysis here is analogous to Table 7, with the only
difference being that we use OLS instead of 2SLS. Heteroskedasticity consistent standard errors clustered at the art unit level are shown in italics underneath the
coefficient estimates. We use ***, **, and * to denote significance at the 1%, 5%, and 10% level (two-sided), respectively.
Subsequent innovation Future exits
Log (1 +
subsequent
patent
applications)
Log (1 +
subsequent
approved
patents)
Approval rate
of subsequent
patent
applications
Log (1 + total
citations to all
subsequent
patent
applications)
Log (1 +
average
citations-per-
patent to
subsequent
approved
patents)
Startup goes
public?
Startup goes
public or
is acquired?
(1) (2) (3) (4) (5) (6) (7)
First patent review lag -0.178*** -0.154*** -0.025*** -0.236*** -0.108*** -0.0035*** -0.0110*** 0.011 0.009 0.006 0.015 0.013 0.0008 0.0019
Diagnostics
R2 17.1% 16.8% 18.6% 19.3% 27.9% 14.2% 15.9%
Mean of non-logged dep. var. 3.4 2.0 58.7% 8.1 2.0 0.7% 2.7%
No. of observations (startups) 29,831 29,831 14,407 29,831 11,291 29,831 29,831

3
Table IA.3. Do Patents Affect Access to VC Funding? OLS Results. The table reports the results of estimating equation (6) to examine how the approval of a startup’s first patent application affects the startup’s ability to raise VC
funding. The analysis here is analogous to Table 8, with the only difference being that we use OLS instead of 2SLS. Heteroskedasticity consistent standard errors
clustered at the art unit level are shown in italics underneath the coefficient estimates. We use ***, **, and * to denote significance at the 1%, 5%, and 10% level
(two-sided), respectively.
Following the first-action decision on its first patent application,
does the startup raise VC funding in the next …
… 1 year? … 2 years? … 3 years? … 4 years? … 5 years?
(1) (2) (3) (4) (5)
First patent application approved 0.008*** 0.012*** 0.014*** 0.015*** 0.015*** 0.002 0.002 0.002 0.002 0.002
Log(1 + # prior VC rounds) 0.272*** 0.382*** 0.408*** 0.418*** 0.421*** 0.010 0.011 0.011 0.011 0.011
Diagnostics
R2 31.6% 39.6% 40.7% 40.4% 40.1%
Mean of dep. variable 2.6% 3.8% 4.3% 4.6% 4.7%
Median no. months from first-action to VC
round for successful applicants 5.1 8.0 9.2 10.0 10.3
No. of observations (startups) 45,299 45,286 45,275 45,256 45,251

4
Table IA.4. How Do Patents Affect Access to VC Funding? OLS Subsample Analyses. The table examines how the effect of patent grants on facilitating access to VC funding varies across different
subsamples. The analysis here is analogous to Table 9, with the only difference being that we use OLS instead of
2SLS. Heteroskedasticity consistent standard errors clustered at the art unit level are shown in italics underneath the
coefficient estimates. We use ***, **, and * to denote significance at the 1%, 5%, and 10% level (two-sided),
respectively.
Panel A. Variation in funding round.
In the 3 years following the first-action decision on its first patent
application, does the startup raise …
its first VC
round?
its second VC
round?
its third VC
round?
its fourth or
higher VC
round?
(1) (2) (3) (4)
First patent application approved 0.005*** 0.201** 0.203** 0.156*** 0.001 0.077 0.101 0.053
Log(1 + # prior VC rounds) -0.165 0.123
Diagnostics
R2 9.9% 56.0% 58.4% 46.2%
Mean of dep. variable 1.2% 39.5% 51.1% 53.1%
No. of observations (startups) 42,254 501 350 892
Panel B. Variation in entrepreneurial experience.
Does the startup raise VC funding in the 3 years following the
first-action decision on its first patent application?
Inexperienced
founder
Experienced
founder
All founders
(1) (2) (3)
First patent application approved 0.033 0.086 0.179** 0.120 0.093 0.071
… × experienced founder -0.059 0.091
Experienced founder 0.127* 0.066
Log(1 + # prior VC rounds) 0.125 0.126 0.136** 0.144 0.110 0.062
Diagnostics
R2 63.8% 56.6% 52.4%
Mean of dep. variable 47.8% 58.2 % 54.2%
No. of observations (startups) 364 543 1,253
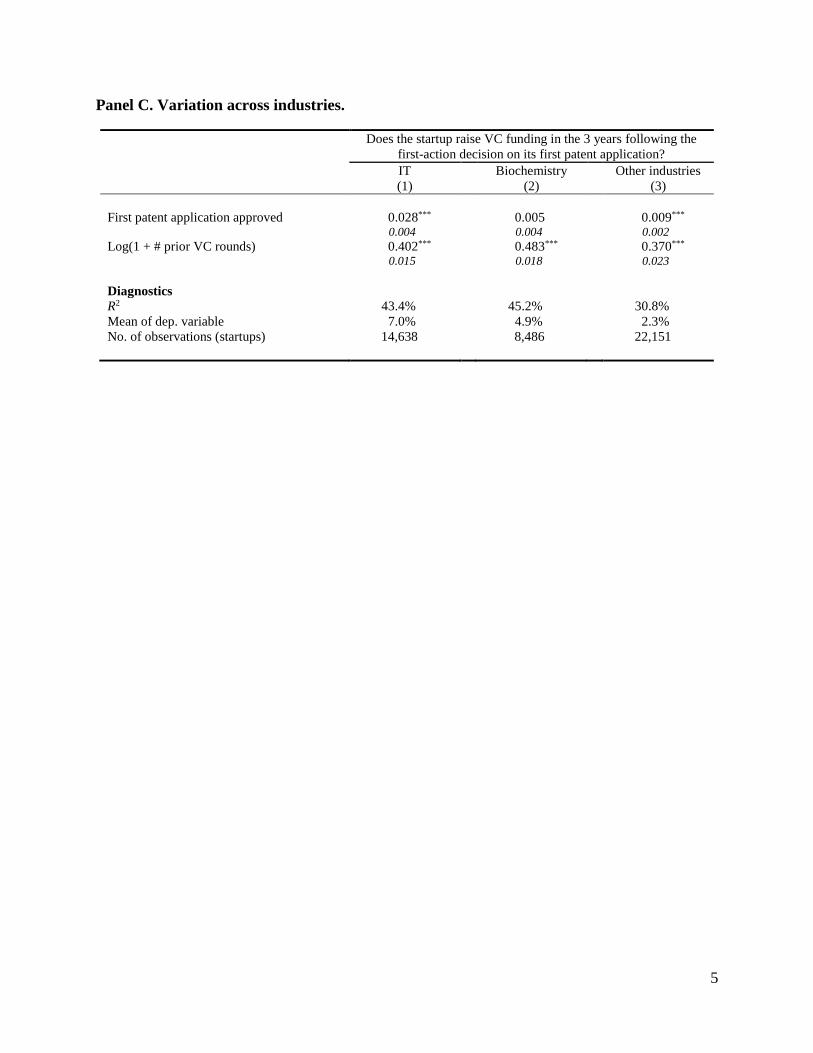
5
Panel C. Variation across industries.
Does the startup raise VC funding in the 3 years following the
first-action decision on its first patent application?
IT Biochemistry Other industries
(1) (2) (3)
First patent application approved 0.028*** 0.005 0.009*** 0.004 0.004 0.002
Log(1 + # prior VC rounds) 0.402*** 0.483*** 0.370*** 0.015 0.018 0.023
Diagnostics
R2 43.4% 45.2% 30.8%
Mean of dep. variable 7.0% 4.9% 2.3%
No. of observations (startups) 14,638 8,486 22,151