the broad-dream gene essentiality prediction challenge: motivation, data, scoring, and results...
TRANSCRIPT

The Broad-DREAM Gene EssentialityPrediction Challenge: Motivation, Data,
Scoring, and Results
Mehmet GönenDepartment of Biomedical Engineering
Oregon Health & Science University

Mutational analysis
Copy number
Pathway Activation
Gene expression
Dependencies
Genome-wide RNAi screens in a large number of cell lines
Extensive molecular characterization of cell lines
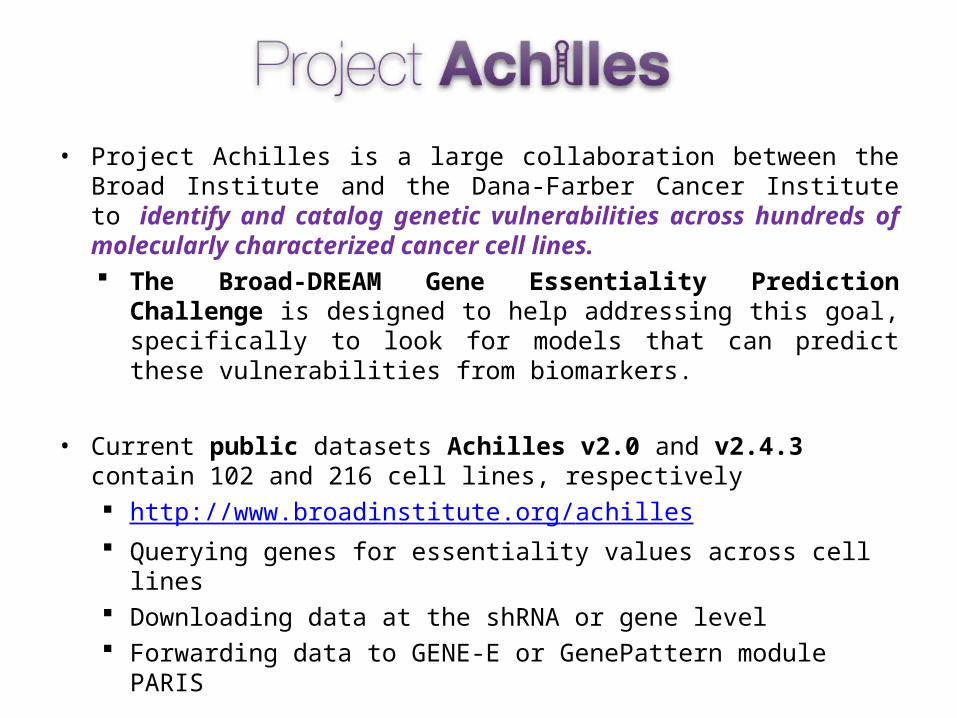
• Project Achilles is a large collaboration between the Broad Institute and the Dana-Farber Cancer Institute to identify and catalog genetic vulnerabilities across hundreds of molecularly characterized cancer cell lines. The Broad-DREAM Gene Essentiality Prediction Challenge
is designed to help addressing this goal, specifically to look for models that can predict these vulnerabilities from biomarkers.
• Current public datasets Achilles v2.0 and v2.4.3 contain 102 and 216 cell lines, respectively http://www.broadinstitute.org/achilles Querying genes for essentiality values across cell lines Downloading data at the shRNA or gene level Forwarding data to GENE-E or GenePattern module PARIS

shRNA Loss of Function Screens Overview
Measure Essentiality based on proportion of shRNAs present at the end of the experiment compared to the start
shRNA Library Cancer Cell Line:Each cell in the population gets one single shRNA
Infect a cell line with the shRNA library
Readout is Next Generation Sequencing (previously array-based hybridization) of shRNA barcode sequences to get counts per shRNA, per cell line
Red and Green in this example are depleted during the experiment and therefore have a negative effect on viability (are ‘essential’ to viability). Orange is neutral to viability. Blue and YellowYellow are enriched during the experiment and therefore have a positive effect on viability.
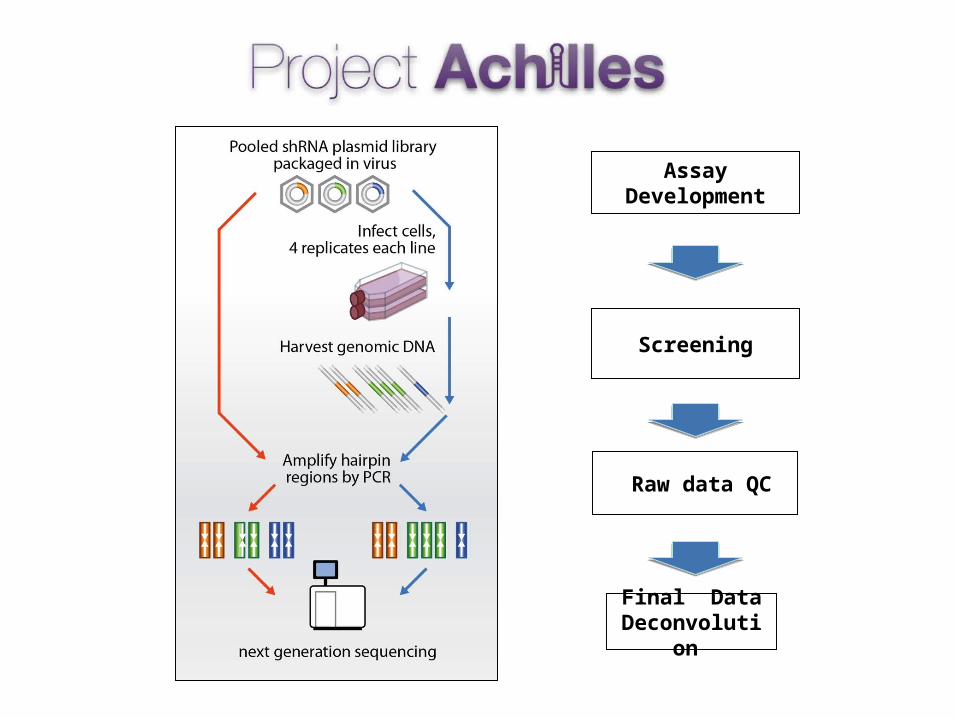
Assay Development
Screening
Raw data QC
Final Data Deconvolution

FilterLowshRNAs
NormLines
shRNAfoldChange
shRNAcollapseReps
.gct file of shRNA scores per cell line
shRNAmapGenes
shRNAremoveOverlap
removeSamples
Removes undesirable shRNAs and cell line replicates:• Those shRNAs low in initial DNA pool or that overlap in sequence. • Replicate samples that fail QCReplicatesQC
• Calculates fold change values between initial DNA pool values and final cell line values. • Normalizes cell lines to the same scale (quantile, ZMAD, PMAD)• Collapses replicate cell line samples to a single values per shRNA• Maps shRNAs to gene symbols based on a mapping file
FPmatching
Quality control GenePattern modules
Data processing GenePattern modules
.gct file of gene scores per cell line
ATARiS or Demeter
http://genepattern.broadinstitute.org/gp/
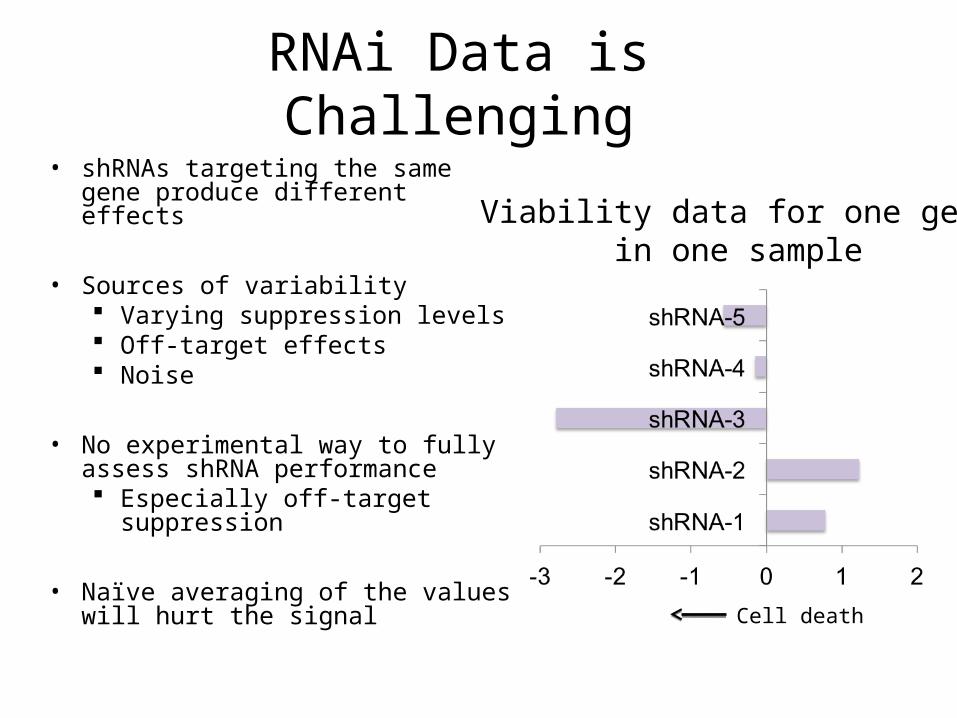
• shRNAs targeting the same gene produce different effects
• Sources of variability Varying suppression levels Off-target effects Noise
• No experimental way to fully assess shRNA performance Especially off-target suppression
• Naïve averaging of the values will hurt the signal
RNAi Data is Challenging
Viability data for one genein one sample
Cell death
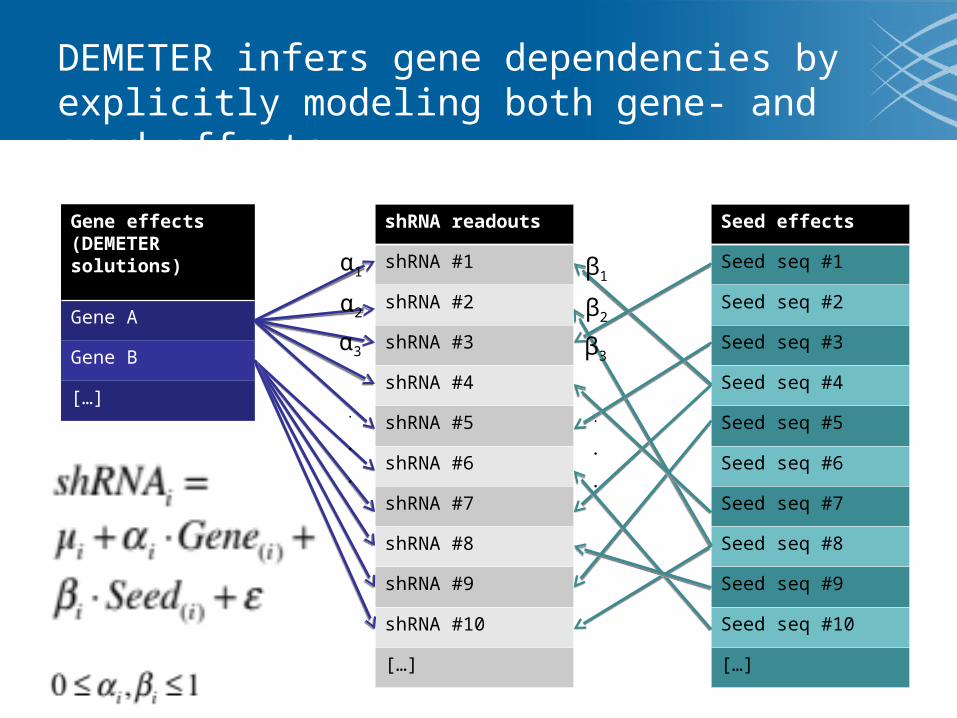
DEMETER infers gene dependencies by explicitly modeling both gene- and seed-effects
shRNA readouts
shRNA #1
shRNA #2
shRNA #3
shRNA #4
shRNA #5
shRNA #6
shRNA #7
shRNA #8
shRNA #9
shRNA #10
[…]
Gene effects(DEMETER solutions)
Gene A
Gene B
[…]
Seed effects
Seed seq #1
Seed seq #2
Seed seq #3
Seed seq #4
Seed seq #5
Seed seq #6
Seed seq #7
Seed seq #8
Seed seq #9
Seed seq #10
[…]
α1
α2
α3
.
.
.
β1
β2
β3
.
.
.
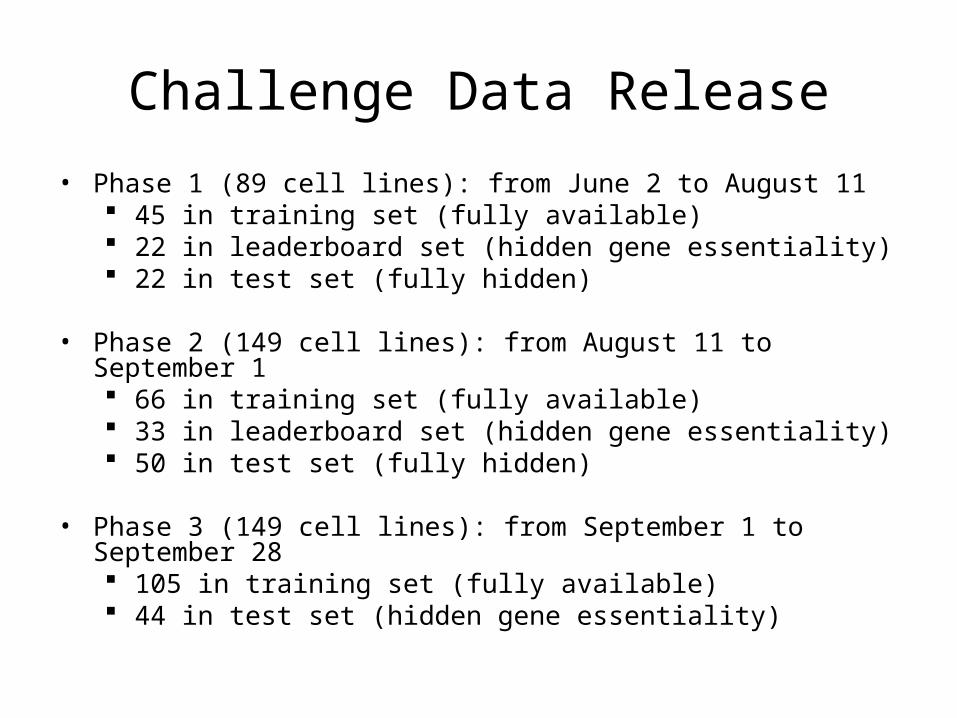
Challenge Data Release
• Phase 1 (89 cell lines): from June 2 to August 11 45 in training set (fully available) 22 in leaderboard set (hidden gene essentiality) 22 in test set (fully hidden)
• Phase 2 (149 cell lines): from August 11 to September 1 66 in training set (fully available) 33 in leaderboard set (hidden gene essentiality) 50 in test set (fully hidden)
• Phase 3 (149 cell lines): from September 1 to September 28 105 in training set (fully available) 44 in test set (hidden gene essentiality)
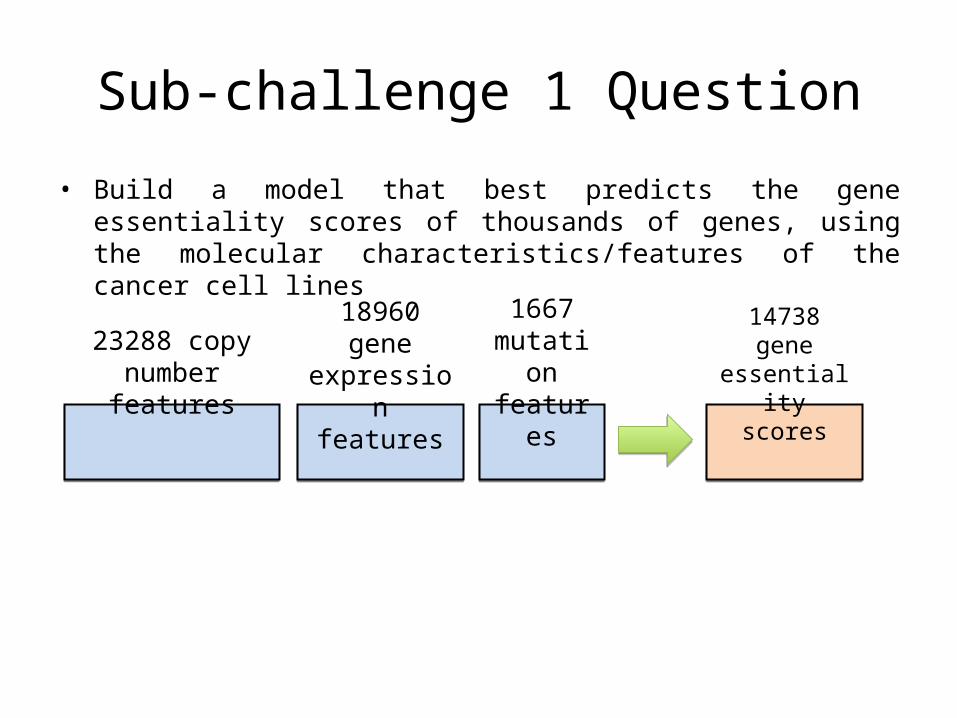
Sub-challenge 1 Question
• Build a model that best predicts the gene essentiality scores of thousands of genes, using the molecular characteristics/features of the cancer cell lines
23288 copy number features
18960 gene expression
features
14738 gene essentiality
scores
1667 mutation features

Sub-challenge 1 Scoring
• We use Spearman’s rank correlation coefficient to evaluate the performance
• Overall score is the mean of 14738 correlation values
measured geneessentiality scores
predicted geneessentiality scores
ρ1 ρ14738ρi
… ………. … ……….

Sub-challenge 2 Question
• Identify the most predictive features for each gene essentiality score of a prioritized list of 2647 genes
23288 copy number features
18960 gene expression
features
single gene essentiality
score
1667 mutation features
K1 features K2 features K3 features
K1 + K2 + K3 ≤ 10

Sub-challenge 3 Question
• Identify the most predictive features for all gene essentialities of a prioritized list of 2647 genes
23288 copy number features
18960 gene expression
features
2647 gene essentiality
scores
1667 mutation features
K1 features K2 features K3 features
K1 + K2 + K3 ≤ 100

Sub-challenges 2 & 3 Scoring
• We use Spearman’s rank correlation coefficient to evaluate the performance
• Overall score is the mean of 2647 correlation values
measured geneessentiality scores
predicted geneessentiality scores
ρ1 ρ2647ρi
… ………. … ……….

Challenge Overview
• 300 registered participants• 2896 leaderboard submissions
– 1621 in sub-challenge 1– 585 in sub-challenge 2– 690 in sub-challenge 3
• 48 teams with final submissions– 21 in sub-challenge 3 – 13 in sub-challenge 2– 14 in sub-challenge 3
• 22 unique teams with final submissions• 52 topics in the discussion forum• 233 posts in the discussion forum
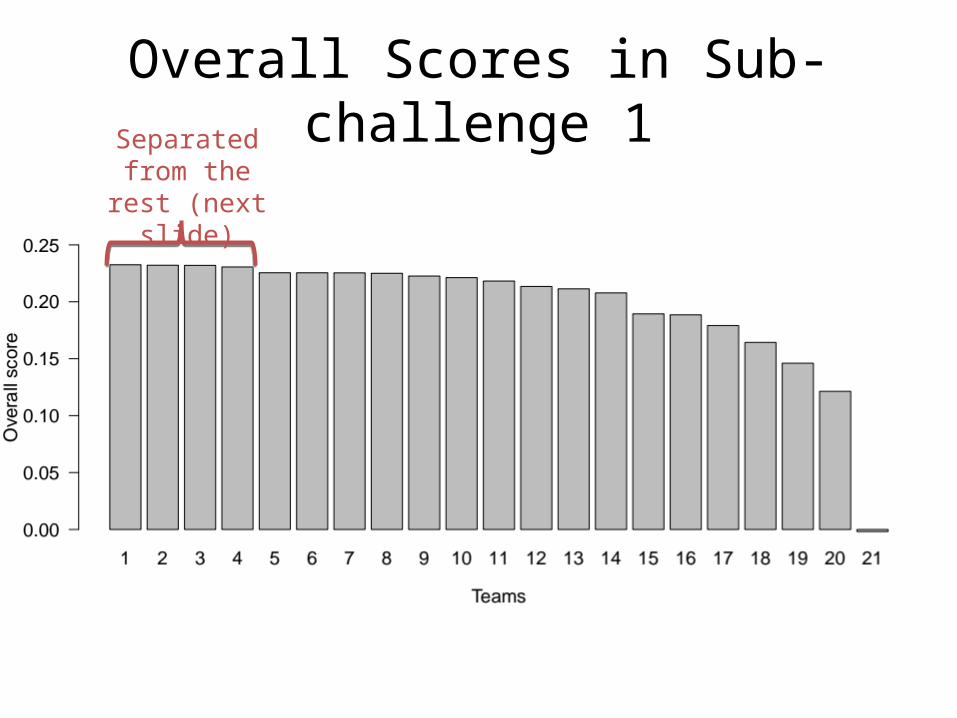
Overall Scores in Sub-challenge 1Separated
from the rest (next slide)
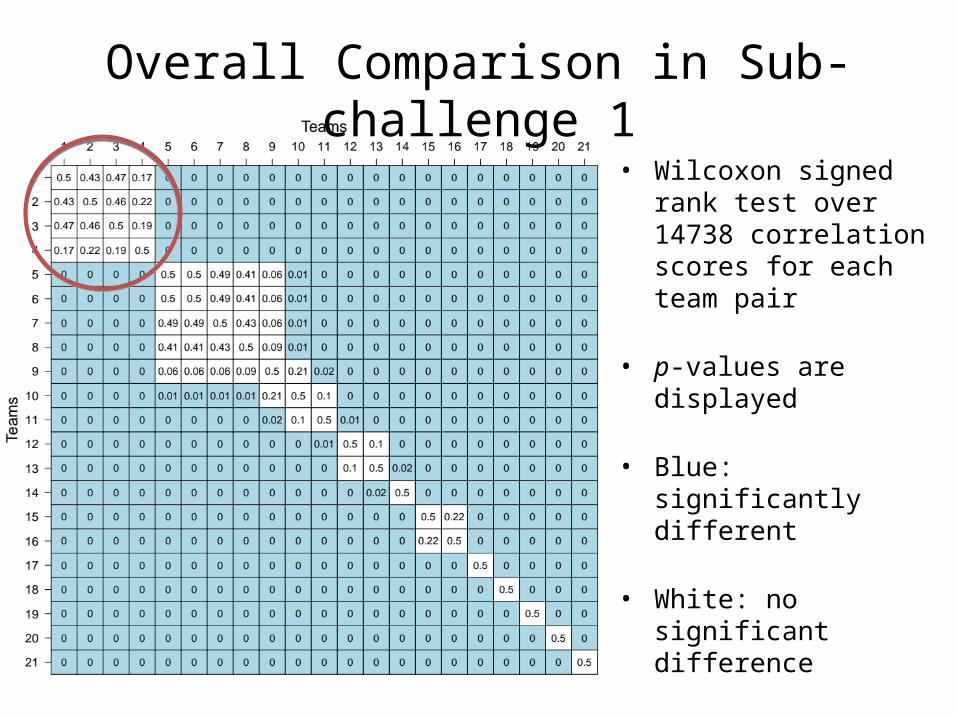
Overall Comparison in Sub-challenge 1
• Wilcoxon signed rank test over 14738 correlation scores for each team pair
• p-values are displayed
• Blue: significantly different
• White: no significant difference

Nonparametric Friedman’s Test
M1
M2
M3
M4
G1
0.5
0.3
0.2
0.6
G2
0.2
0.5
0.5
0.4
G3
0.1
0.3
0.2
0.4
G4
0.3
0.2
0.1
0.4
G5
0.4
0.1
0.4
0.3
G6
0.2
0.4
0.3
0.1
M1 M2 M3 M4
G1
2 3 4 1
G2
4 1.5 1.5 3
G3
4 2 3 1
G4
2 3 4 1
G5
1.5 4 1.5 3
G6
3 1 2 4
used to detect differences in treatments across multiple blocks
Score matrix (sij) Rank matrix (rij)
If the p-value is significant, appropriate post-hoc multiple comparisons tests would be performed
2.75
2.42
2.67
2.17
2.50

Detailed Comparison of Top 4 Teams• Nonparametric
Friedman’s test on rankings over 14738 correlation scores of top four teams
• Methods are different with a p-value = 3e-4
• Tukey’s honestly significant difference criterion as the post-hoc test
• Top three teams could not be separated from each other

Wisdom of Crowds in Sub-challenge 1
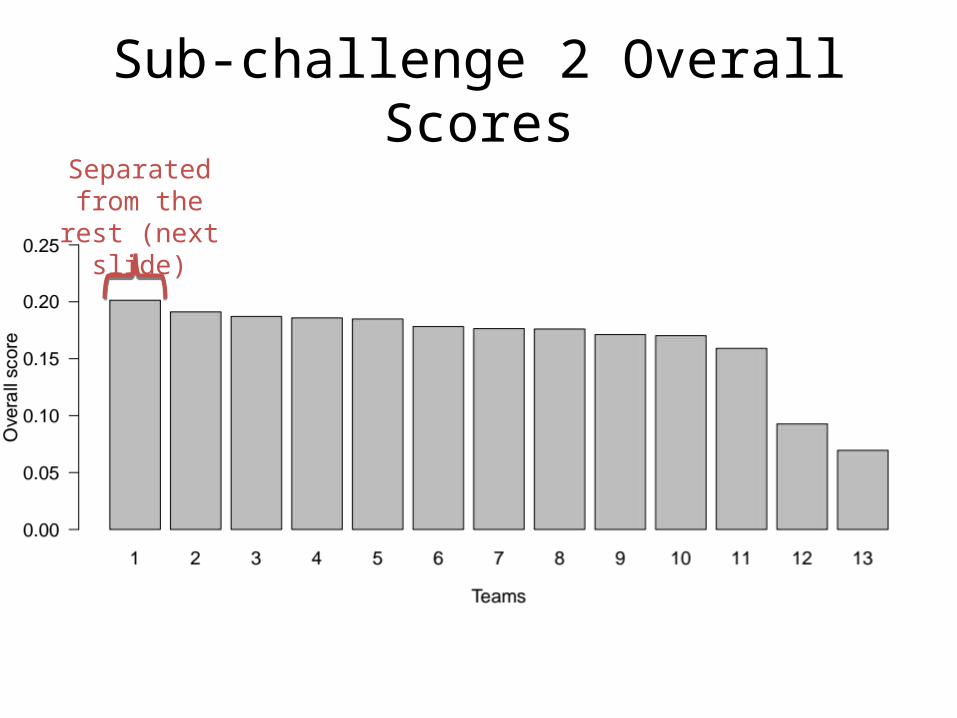
Sub-challenge 2 Overall ScoresSeparated
from the rest (next slide)

Overall Comparison in Sub-challenge 2
• Wilcoxon signed rank test over 2647 correlation scores for each team pair
• p-values are displayed
• Blue: significantly different
• White: no significant difference

Wisdom of Crowds in Sub-challenge 2

Overall Scores in Sub-challenge 3Separated
from the rest (next slide)

Overall Comparison in Sub-challenge 3
• Wilcoxon signed rank test over 2647 correlation scores for each team pair
• p-values are displayed
• Blue: significantly different
• White: no significant difference

Wisdom of Crowds in Sub-challenge 3

Further Analysis for Feature Selection in Sub-challenge 2

Further Analysis for Feature Selection in Sub-challenge 3
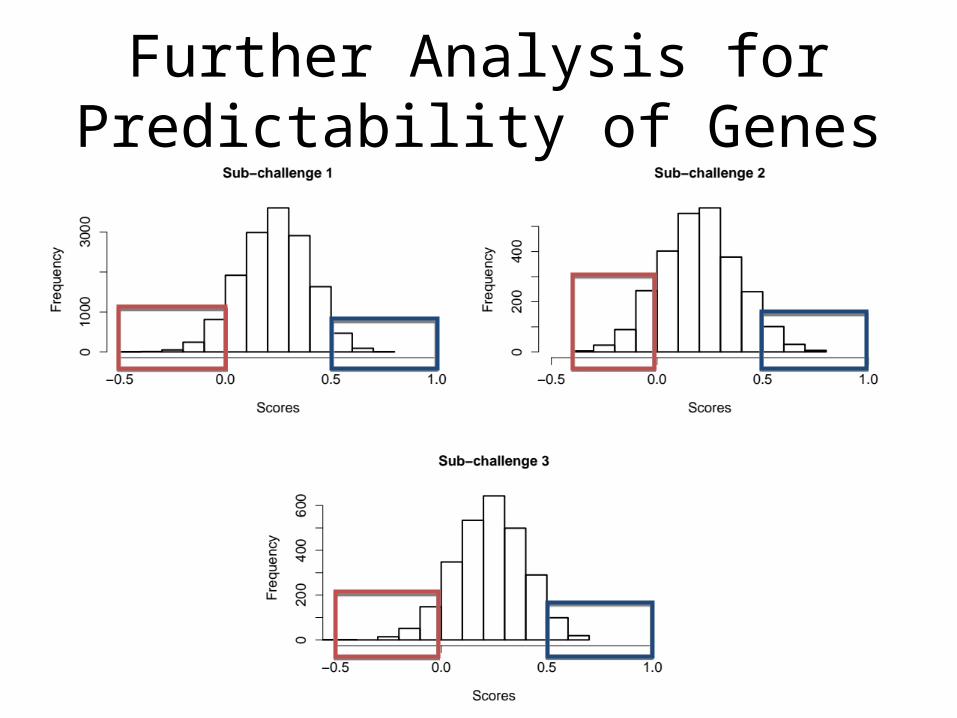
Further Analysis for Predictability of Genes
Acknowledgments
• Organizers Mehmet Gönen, Adam Margolin (OHSU) Barbara Weir, Aviad Tsherniak, Sara Howell (Broad Institute) Daniel Marbach (EPFL) Bruce Hoff, Thea Norman (Sage Bionetworks) Gustavo Stolovitzky (IBM Computational Biology Center)
• Funding Broad Institute (Projects Achilles and CCLE) and Dana-Farber
Cancer Institute NCI Cancer Target Discovery and Development Network (CTDD) NCI Integrative Cancer Biology Program (ICBP)
• Journal Partner Nature Biotechnology (Craig Mak and Andy Marshall)

Best Performing Teams
• Sub-challenge 1 BERL (Masayuki Karasuyama and Hiroshi Mamitsuka) UPS (Vladislav Uzunangelov, Sahil Chopra, Kiley Graim, Daniel
Carlin, Yulia Newton, Alden Deran, Adrian Bivol, Sam Ng, Kyle Ellrott, Evan Paull, Artem Sokolov, and Joshua M. Stuart)
wtwt5237 (Tao Wang, Xiaowei Zhan, Hao Tang, Yang Xie, and Guanghua Xiao)
• Sub-challenge 2 Guanlab_UMich (Fan Zhu and Yuanfang Guan)
• Sub-challenge 3 Team FAT (Peddinti Gopalacharyulu, Alok Jaiswal, Kerstin Bunte,
Suleiman Khan, Jing Tang, Antti Airola, Krister Wennerberg, Tapio Pahikkala, Samuel Kaski, and Tero Aittokallio)