the brooklyn report 2017 - terracrg201 brooklyn market report page 3 the brooklyn market is...
TRANSCRIPT

The BrooklynMarketReport2017
January 2018

2017 B R O O K L Y N M A R K E T R E P O R T
Page 2
Industrial/Office Building Transactions
19
Residential Development Site Transactions
13
Mixed-Use Building Transactions
10
Table of Contents
Multifamily Building Transactions
7
Retail Building Transactions
16
Other/SpecialAsset Transactions
22
Welcome Letter3
Summary6
Introduction4

2017 B R O O K L Y N M A R K E T R E P O R T
Page 3
The Brooklyn market is continuing to show strength, even as we enda two-year dollar volume decline. While total dollar volume showed a 40%decrease from the 2015 peak, the Brooklyn investment sales transactionalmarket is showing resiliency. 2017 was truly a strong year where many assetclasses saw price increases, and total transactional volume remained steady. We believe the resiliency of the Brooklyn market stems from the depthand diversity of asset classes and neighborhoods. This is one of the mostbuilding-rich counties in America, and many of these communities withinBrooklyn are continuing to transform and reinvent themselves. Whileinstitutional investors have reduced their activity in the broader marketin the last two years, family offices and wealthy individuals continue tobelieve in the Brooklyn trajectory going forward. As a Brooklyn-only firm, TerraCRG has followed the market trajectory andexperienced an extraordinary evolution in the past decade as we’ve pursuedour mission to be Brooklyn market leaders. Our ever-growing commitment tomarket knowledge and expertise are exemplified in this report. Our BrooklynMarket Report presents the most up-to-date information, resources andnews on what is happening year-over-year throughout the various regions,neighborhoods and asset classes. Brooklyn continues to be one of the mostfascinating places in the world to practice commercial real estate brokerage. We hope you will find the data informative and useful for forecasting andplanning business models and investments for the upcoming year.
– Ofer COhen fOunder & CeO
Welcome to Brooklyn
2017 was truly a strong year where many assetclasses saw price increases, and total transactional volume remained steady.
“
”

2017 B R O O K L Y N M A R K E T R E P O R T
Page 4
In 2017, our team verified a total of 1,359 commercial transactions in Brooklyn with a total consideration of approximately $6.4B, an approximate 18% decrease in dollar volume from 2016.
Although the total dollar volume of
transactions dropped in 2017 compared to 2016, the average price per SF increased in four of the five asset categories, primarily due to the lack of available inventory and continued investment in the Brooklyn market.
The total number of transactions in
Brooklyn has had a 10% decrease since 2016 and a 33% decrease since 2015.
In a time when there is widespread speculation of a national decline in brick and mortar retail, Brooklyn’s retail market continues to demonstrate strength with a 23% increase in dollar volume and 48% increase in total number of transactions since 2016.
Industrial/Office dollar volume increased by 63% from $787,408,097 to $1,287,123,830.
The Greater Downtown Brooklyn
region had the highest dollar volume, with transactions totaling over $2.5B from 148 transactions, down from $2.8B in 2016.
Commercial Transactions in the Brooklyn Market 2017 Year-End Report
Brooklyn Commercial Property Transactions Dollar VolumeBy Asset Type* (2012-2017)
$1.000.000
$1.500.000
$500.000
20172012 2013 2014 2015 2016
$2.000.000
$2.500.000
$3.000.000
$3.500.000
$4.000.000
$6.4B
$4.4B
$5B
$6.85B
$9.5B
$7.8B
Multifamily RetailMixed Use Industrial/OfficeDevelopment Other

2017 B R O O K L Y N M A R K E T R E P O R T
Page 5
“The Greater Downtown Brooklyn region saw the highest dollar volume in total transactions.” Dan Marks- Partner
“The West Brooklyn region experienced a 37% dollar volume increase with $639M in transactions.” Peter Matheos,Senior Vice President
“The South Brooklyn region recorded the second highest number of retail transactions.” David Algarin, Associate Vice President
“The North Brooklyn region had the second highest dollar volume in development and industrial/office transactions.”Mike Hernandez-Associate Vice President
“The Bed-Stuy/Bushwick/Crown Heights region recorded 323 transactions, the highest number of transactions recorded in any region in 2017.”Matthew Cosentino -Partner
“The East Brooklyn region saw a 22% increase in total dollar volume from 2016 to 2017.” Fred Bijou- Senior Associate
“The Central Brooklyn region had the highest number of total transactions and highest dollar volume in both mixed-use and retail trades.”Adam Hess-Partner
Boerum HillBrooklyn HeightsCarroll GardensClinton HillCobble HillColumbia WaterfrontDowntown BrooklynDUMBOFort GreeneGowanusPark SlopeProspect HeightsRed Hook
148 Transactions/~$2.5B
Bedford-StuyvesantBushwickCrown HeightsCrown Heights SouthOcean Hill
323 Transactions/~$847M
Borough ParkEast FlatbushFlatbushFlatlandsKensingtonLefferts GardensMidwoodProspect Park South
263 Transactions/~$775M
Bergen BeachBrighton BeachConey IslandGerritsen BeachGravesendManhattan BeachMarine ParkMill BasinSea GateSheepshead Bay
131 Transactions/~$332M
Bath BeachBay RidgeBensonhurstDyker HeightsFort HamiltonGreenwood HeightsSunset ParkWindsor Terrace
189 Transactions/~$639M
BrownsvilleCanarsieCypress HillsEast New York
170 Transactions/~$367M
East WilliamsburgGreenpointWilliamsburg
136 Transactions/~ $945M
TerraCRG analyzed Brooklyn commercial transactions categorized into seven regions, color coded throughout the report. Each abbreviated region name includes the below listed neighborhoods.

2017 B R O O K L Y N M A R K E T R E P O R T
Page 6
SummaryDollar and Transaction Volume by Asset Class and Region TerraCRG analyzed Brooklyn commercial transactions categorized into seven regions, color coded throughout the report.
Dollar Volume Year Over Year By RegionBy region* (2016-2017)
1.1B 847M 1B 775M 294M 367M 2.8B 2.5B 1.65B 945M 497M 332M 439M 635M
-25%-26%
22%
-54%
-40%37%
-11%
2016
2017
Bed Stuy/Bushwick/Crown Hts
Central Brooklyn East Brooklyn Greater Downtown Brooklyn
North Brooklyn South Brooklyn West Brooklyn
$392,044,419 120 $175,768,426 103 $210,523,302 77 $21,674,707 6 $20,800,000 5 $26,049,000 12 $846,859,854 323
Central Brooklyn $211,377,075 44 $192,024,638 108 $116,711,200 47 $101,799,230 25 $55,040,000 17 $97,673,155 22 $774,625,298 263
East Brooklyn $62,274,486 36 $42,326,205 48 $32,469,682 35 $24,795,000 16 $53,111,568 13 $152,376,718 22 $367,353,659 170
$414,552,214 44 $159,627,435 43 $309,620,625 20 $4,775,000 2 $984,842,262 18 $636,575,000 21 $2,509,992,536 148
North Brooklyn $229,837,000 46 $115,741,112 35 $241,880,350 29 $42,715,000 6 $100,945,000 14 $213,400,000 6 $944,518,462 136
South Brooklyn $91,127,337 13 $47,669,500 35 $63,287,728 35 $52,439,287 22 $2,940,000 3 $74,726,394 23 $332,190,246 131
West Brooklyn $228,279,500 51 $167,346,198 84 $35,614,750 15 $100,330,000 19 $69,445,000 10 $34,024,971 9 $635,040,419 188
2017 Dollar Volume $1,629,492,031 354 $900,503,514 456 $1,010,107,637 258 $348,528,224 96 $1,287,123,830 80 $1,234,825,238 115 $6,410,580,474 1359
2016 Dollar Volume $2,690,284,125 454 $1,135,887,420 523 $1,617,504,361 214 $282,690,942 65 $787,408,097 99 $1,246,488,697 152 $7,760,263,642 1507
Y/Y Dollar Volume -39% -21% -38% +23% +63% -1% -17%
-22% -13% +21% +48% -18% -24% -10%
Region Multifamily Mixed-Use Development Retail Industrial/Office Other Total
# of transactions
Bed Stuy/Bushwick/Crown Heights
Greater DowntownBrooklyn
Y/Y # of Transactions
# of transactions# of transactions# of transactions# of transactions# of transactions# of transactions

2017 B R O O K L Y N M A R K E T R E P O R T
Page 7
The highest priced multifamily transaction was 7 Dekalb Avenue in Downtown Brooklyn, which sold for
in December. The Bed Stuy/Bushwick/Crown Heights region had
transactions, recorded as the region with the highest number of multifamily transactions. The highest dollar volume was approximately
recorded in the Greater Downtown Brooklyn Region.
$4.6M.
$96M
120
In the multifamily category, we have verified
transactions with a total of
units totaling to approximately
The total dollar volume was approximately
a 39% decrease from 2016. The average transaction was approximately
3545,215
$1.63B
4.9M SF.
Multifamily Building Transactions“While we continued to see a decline in total dollar volume of trades in the multifamily asset class in 2017, especially from the peak of the market in 2015, pricing generally remained the same. We noticed a significant uptick in investor interest towards the end of 2017 and anticipate that dollar volume and number of trades will increase appreciably in the first half of 2018.”
The multifamily transaction with the highest price per SF was 50 Orange Street in Brooklyn Heights, a 20 unit building which sold for approximately $1,333 per SF.
The largest multifamily transaction in 2017 was 7 Dekalb Avenue, which was purchased by The Brodsky Organization for $96M. The 251-unit tower includes rent stabilized units which sit atop City Point, the newly opened retail center in Downtown Brooklyn comprised of national retailers including Trader Joe’s, Target, and Century 21.
Adam HessPartner
$415MThis study shows Brooklyn commercial multifamily building transactions for 2017, broken down into region and neighborhood. Considered data points include: total dollar volume, total number of transactions, average transaction price, total number of units, total square footage sold and average price per SF.

2017 B R O O K L Y N M A R K E T R E P O R T
Page 8
Bed Stuy/Bushwick/Crown Hts Bedford-Stuyvesant $133,024,496 36 $3,695,125 437 $323,290 458,161 $366
Bushwick $129,550,349 43 $3,012,799 433 $266,218 364,411 $316
Crown Heights $80,555,000 21 $3,835,952 282 $292,276 234,010 $352
Crown Heights South $5,735,000 3 $1,911,667 22 $258,056 21,242 $286
Ocean Hill $43,179,574 17 $2,539,975 212 $198,942 228,938 $222
Total/Average $392,044,419 120 $3,267,037 1386 $278,165 1,306,762 $323
South Brooklyn Brighton Beach $54,472,337 2 $27,236,169 128 $360,192 144,959 $327
Coney Island $3,935,000 5 $787,000 26 $151,067 20,896 $202
Gravesend $15,730,000 2 $7,865,000 54 $290,000 59,253 $294
Sheepshead Bay $16,990,000 4 $4,247,500 64 $258,875 68,880 $264
Total/Average $91,127,337 13 $7,009,795 272 $237,786 293,988 $254
West Brooklyn Bay Ridge $23,039,175 8 $2,879,897 98 $240,695 78,344 $298
Bensonhurst $10,601,325 7 $1,514,475 40 $266,627 33,876 $332
Dyker Heights $4,384,000 3 $1,461,333 18 $243,556 13,800 $297
Greenwood Heights $67,812,000 16 $4,238,250 174 $380,021 151,268 $517
Sunset Park $122,443,000 17 $7,202,529 502 $233,620 431,620 $311
Total/Average $228,279,500 51 $4,476,069 832 $285,774 708,908 $376
East Brooklyn Brownsville $14,038,000 7 $2,005,429 84 $160,423 65,260 $193
Canarsie $4,000,000 1 $4,000,000 21 $190,476 18,366 $218
Cypress Hills $1,303,000 2 $651,500 11 $122,300 8,973 $151
East New York $42,933,486 26 $1,651,288 340 $152,060 352,748 $195
Total/Average $62,274,486 36 $1,729,847 456 $153,100 445,347 $193
Brooklyn Wide $1,629,492,031 354 $4,603,085 5,215 $303,533 4,865,444 $371
North Brooklyn East Williamsburg $52,902,000 19 $2,784,316 149 $351,442 101,574 $533
Greenpoint $82,710,000 19 $4,353,158 191 $402,809 197,332 $411
Williamsburg $94,225,000 8 $11,778,125 163 $587,334 223,195 $551
Total/Average $229,837,000 46 $4,996,457 503 $413,684 522,101 $486
Central Brooklyn Borough Park $4,120,000 3 $1,373,333 18 $228,889 14,002 $275
East Flatbush $75,039,575 17 $4,414,093 372 $178,336 333,142 $226
Flatbush $18,077,500 10 $1,807,750 97 $193,924 85,498 $207
Kensington $36,490,000 4 $9,122,500 140 $213,040 164,276 $232
Lefferts Gardens $38,250,000 4 $9,562,500 114 $390,488 102,475 $451
Midwood $22,875,000 3 $7,625,000 89 $345,120 84,300 $349
Prospect Park South $16,525,000 3 $5,508,333 72 $225,104 75,751 $244
Total/Average $211,377,075 44 $4,804,024 902 $222,327 859,444 $256
Greater Downtown Brooklyn Boerum Hill $16,600,000 3 $5,533,333 42 $390,278 30,872 $542
Brooklyn Heights $107,042,350 8 $13,380,294 139 $633,445 152,684 $739
Carroll Gardens $10,550,000 2 $5,275,000 10 $1,055,000 10,520 $1,001
Clinton Hill $57,735,000 6 $9,622,500 143 $379,210 100,968 $490
Downtown Brooklyn $96,000,000 1 $96,000,000 251 $382,470 251,109 $382
Fort Greene $14,170,000 4 $3,542,500 28 $530,759 16,718 $847
Gowanus $4,000,000 1 $4,000,000 6 $666,667 4,025 $994
Park Slope $82,699,864 11 $7,518,169 177 $483,241 109,217 $759
Prospect Heights $20,605,000 6 $3,434,167 54 $374,583 43,781 $457
Red Hook $5,150,000 2 $2,575,000 14 $361,458 9,000 $565
Total/Average $414,552,214 44 $9,421,641 864 $501,861 728,894 $670
* Price per Square Foot / ** Price per Unit
Region Neighborhood Dollar VolumeTotal
TransactionsAvg.
Transaction Total Units Avg. P/Unit** Total SF Avg. PPSF*
Multifamily

2017 B R O O K L Y N M A R K E T R E P O R T
Page 9
Multifamily
The average price per SF of multifamily buildings in 2017 in Brooklyn was $371, up slightly from 2016’s average of $361. The average price per unit was approximately
$303K, up 6% from approximately $285K in 2016.
The Greater Downtown region achieved the highest average price per SF at $670.
Price per SF and Price per Unit
Transaction and Dollar Volume
East Brooklyn$193/sf$153k/unit
SouthBrooklyn$254/sf$238k/unit
CentralBrooklyn$256/sf$222k/unitWest
Brooklyn$376/sf$286k/unit
NorthBrooklyn$486/sf$414k/unit
Bed Stuy/Bushwick/Crown Hts$323/sf$278k/unit
Greater Downtown Brooklyn$670/sf$502k/unit
WestBrooklyn51 $228m
Bed Stuy/Bushwick/Crown Hts120 $392m
CentralBrooklyn44 $211m
SouthBrooklyn13 $91m
NorthBrooklyn46 $230m
Greater Downtown Brooklyn44 $415m
East Brooklyn36 $62m
In 2017, there was a total of 354 multifamily transactions in Brooklyn, representing 5,125 units and totaling approximately $1.63B. In 2016, there was a total of 454 transactions totaling approximately $2.7B.
The Bed-Stuy/Bushwick/Crown Heights region had the highest number of multifamily transactions with 120 transactions. The Greater Downtown Region had the highest dollar volume totaling approximately $415M.

2017 B R O O K L Y N M A R K E T R E P O R T
Page 10
The highest priced mixed-use transaction was 309 Atlantic Avenue in Boerum Hill, which sold for
in September.With
transactions for a total consideration of
the Central Brooklyn region had both the highest number of mixed-use transactions and the highest dollar volume recorded.
$1.97M.
$19M
$192M,
In the mixed-use category, we have verified
transactions totaling approximately
The total dollar volume was approximately
a 21% decrease from 2016. The average mixed-use transaction was approximately
456
$901M
2.2MSF.
Mixed-Use Building Transactions“Most Brooklyn neighborhoods experienced an increase in the average price per square foot for mixed-use assets as investors anticipate the potential for strong retail rent growth; specifically in emerging neighborhoods where retail rents are reacting to the significant residential rent growth that has occurred.”
The mixed-use transaction with the highest price per SF was 5824 8th Avenue in Sunset Park, which sold for approximately $1,662 per SF.
The largest mixed-use transaction in 2017 was 309 Atlantic Avenue, which sold to Twining Properties for $19M. Also known as the Atlantic Stamp Building, the 28-unit property is eight stories high and located in Boerum Hill.
Matt CosentinoPartner
108
This study shows Brooklyn commercial mixed-use building transactions for 2017, broken down into region and neighborhood. Considered data points include: total dollar volume, total number of transactions, average transaction price, total square footage sold and average price per SF.

2017 B R O O K L Y N M A R K E T R E P O R T
Page 11
Bed Stuy/Bushwick/Crown Hts Bedford-Stuyvesant $67,575,441 32 $2,111,733 184 160,501 $441
Bushwick $38,510,520 22 $1,750,478 109 96,382 $403
Crown Heights $39,294,990 19 $2,068,157 110 111,743 $359
Crown Heights South $5,655,475 4 $1,413,869 12 15,178 $440
Ocean Hill $24,732,000 26 $951,231 96 96,480 $265
Total/Average $175,768,426 103 $1,706,490 511 480,284 $373
South Brooklyn Brighton Beach $9,889,000 8 $1,236,125 38 31,829 $312
Gravesend $16,591,000 11 $1,508,273 32 36,440 $460
Marine Park $3,895,000 4 $973,750 8 11,354 $336
Mill Basin $830,000 1 $830,000 2 1,800 $461
Sheepshead Bay $16,464,500 11 $1,496,773 53 47,365 $380
Total/Average $47,669,500 35 $1,361,986 133 128,788 $387
West Brooklyn Bath Beach $15,397,500 7 $2,199,643 19 27,054 $574
Bay Ridge $42,149,000 21 $2,007,095 117 102,707 $464
Bensonhurst $35,029,500 19 $1,843,658 59 71,085 $505
Dyker Heights $16,211,200 13 $1,247,015 41 42,042 $403
Greenwood Heights $14,325,998 9 $1,591,778 36 28,540 $550
Sunset Park $44,233,000 15 $2,948,867 87 85,514 $629
Total/Average $167,346,198 84 $1,992,217 359 356,942 $512
East Brooklyn Brownsville $9,025,190 10 $902,519 46 36,394 $249
Canarsie $3,440,000 7 $491,429 13 15,768 $233
Cypress Hills $4,137,500 5 $827,500 24 21,426 $195
East New York $25,723,515 26 $989,366 142 122,305 $214
Total/Average $42,326,205 48 $881,796 225 195,893 $222
Brooklyn Wide $900,503,514 456 $1,974,788 2,345 2,230,384 $434
North Brooklyn East Williamsburg $43,131,112 15 $2,875,407 111 95,463 $491
Greenpoint $29,585,000 9 $3,287,222 48 45,138 $779
Williamsburg $43,025,000 11 $3,911,364 93 72,115 $791
Total/Average $115,741,112 35 $3,306,889 252 212,716 $659
Central Brooklyn Borough Park $45,040,103 25 $1,801,604 120 129,777 $376
East Flatbush $23,886,448 23 $1,038,541 92 88,843 $280
Flatbush $34,496,087 18 $1,916,449 155 136,398 $298
Flatlands $3,655,000 5 $731,000 11 14,226 $268
Kensington $11,475,000 6 $1,912,500 23 24,760 $425
Lefferts Gardens $32,130,000 14 $2,295,000 115 101,382 $359
Midwood $37,647,000 14 $2,689,071 109 133,625 $354
Prospect Park South $3,695,000 3 $1,231,667 7 7,304 $492
Total/Average $192,024,638 108 $1,778,006 632 636,315 $338
Greater Downtown Brooklyn Boerum Hill $49,048,000 9 $5,449,778 65 57,742 $957
Brooklyn Heights $23,550,000 5 $4,710,000 37 33,090 $732
Carroll Gardens $8,800,000 4 $2,200,000 14 13,139 $656
Clinton Hill $2,240,000 1 $2,240,000 3 3,200 $700
Cobble Hill $6,700,000 2 $3,350,000 8 7,680 $872
Columbia Waterfront $5,000,000 2 $2,500,000 6 5,488 $910
Downtown Brooklyn $11,000,000 1 $11,000,000 7 6,900 $1,594
Gowanus $5,850,000 3 $1,950,000 15 16,204 $433
Park Slope $40,959,500 12 $3,413,292 66 62,043 $725
Red Hook $6,479,935 4 $1,619,984 12 13,960 $501
Total/Average $159,627,435 43 $3,712,266 233 219,446 $762
* Price per Square Foot
Region Neighborhood Dollar VolumeTotal
TransactionsAvg.
Transaction Total Units Total SF Avg. PPSF*
Mixed-Use

2017 B R O O K L Y N M A R K E T R E P O R T
Page 12
The average price per SF of mixed-use buildings in 2017 in Brooklyn was $434, up slightly from 2016’s average of $419.
The Greater Downtown region achieved the highest average price per SF at $762.
Price per SF
Transaction and Dollar Volume
East Brooklyn$222/sf
SouthBrooklyn$387/sf
CentralBrooklyn$338/sf
WestBrooklyn$512/sf
NorthBrooklyn$659/sf
Bed Stuy/Bushwick/Crown Hts$373/sf
Greater Downtown Brooklyn$762/sf
WestBrooklyn84 $167m
Bed Stuy/Bushwick/Crown Hts103$176m
CentralBrooklyn108 $192mSouth
Brooklyn35 $48m
NorthBrooklyn35$116m
Greater Downtown Brooklyn43 $160m
East Brooklyn48 $42m
Mixed-Use
In 2017, there was a total of 456 mixed-use transactions in Brooklyn totaling approximately $901M, down from total of 523 mixed-use transactions totaling approximately $1.1B in 2016.
The Central Brooklyn region had the highest number of mixed-use
transactions with 108 transactions and had the highest dollar volume totaling approximately $192M. In 2016, the Central Brooklyn region also had the highest number of mixed-use transactions but was surpassed by the Greater Downtown for highest dollar volume.

2017 B R O O K L Y N M A R K E T R E P O R T
Page 13
Residential Development Transactions
Ofer CohenFounder & CEO
The highest priced residential development transaction was 633 Fulton Street in Fort Greene which sold in May for
The Bed Stuy/Bushwick/Crown Heights region had
transactions, making it the region with the highest number of residential development transactions.The highest dollar volume was recorded in the Greater Downtown Brooklyn Region at approximately
for a total of 20 transactions.$3.92M.
$68M.
77
In the residential development category, we have verified
transactions totaling approximately
buildable square feet at an average
The total dollar volume was approximately
a 38% decrease from 2016, and 52% since 2015.The average residential development transaction was approximately
2584.1M
$1.01B
$224/BSF.
“The residential development market showed continued resiliency in 2017, edging towards a volume recovery. While total dollar volume continued to decline slightly, there was still a robust $1 billion market of total development site sale transactions with both a slight increase in price per buildable SF, as well as an increase in total number of transactions.”
The second largest residential development transaction in 2017 was 74 Adams Street in DUMBO, which sold for $60M.
The largest residential development transaction in 2017 was 633 Fulton Street, which sold for $68M. It was also the transaction with the highest price per buildable SF, priced at $548/SF. The 124,150/BSF property was purchased by Rabsky as an addition to their 625 Fulton Street project. The current plans propose an over 880,000 square foot skyscraper with 150,000 SF of retail.
$310MThis study shows Brooklyn residential development site transactions for 2017, broken down into region and neighborhood. Considered data points include: total dollar volume, total number of transactions, average transaction price, total buildable square footage sold and average price per buildable SF.

2017 B R O O K L Y N M A R K E T R E P O R T
Page 14
Bed Stuy/Bushwick/Crown Hts Bedford-Stuyvesant $83,085,501 34 $2,443,691 363,110 $193
Bushwick $64,116,000 22 $2,914,364 295,163 $187
Crown Heights $13,514,100 7 $1,930,586 63,616 $147
Crown Heights South $40,475,000 3 $13,491,667 460,112 $177
Ocean Hill $9,332,701 11 $848,427 89,013 $105
Total/Average $210,523,302 77 $2,734,069 1,271,013 $174
South Brooklyn Brighton Beach $766,000 2 $383,000 7,480 $105
Coney Island $13,500,000 1 $13,500,000 65,160 $98
Gerritsen Beach $1,469,000 4 $367,250 11,025 $165
Gravesend $20,234,828 12 $1,686,236 77,098 $310
Marine Park $1,050,000 1 $1,050,000 5,400 $194
Mill Basin $1,000,000 1 $1,000,000 5,850 $171
Sea Gate $2,174,900 3 $724,967 12,778 $178
Sheepshead Bay $23,093,000 11 $2,099,364 144,582 $217
Total/Average $63,287,728 35 $1,808,221 329,373 $228
West Brooklyn Bay Ridge $3,654,750 3 $1,218,250 22,907 $209
Bensonhurst $7,255,000 3 $2,418,333 28,765 $299
Dyker Heights $1,650,000 1 $1,650,000 4,725 $349
Greenwood Heights $14,505,000 5 $2,901,000 64,771 $258
Sunset Park $7,950,000 2 $3,975,000 30,340 $384
Windsor Terrace $600,000 1 $600,000 2,344 $256
Total/Average $35,614,750 15 $2,374,317 153,852 $279
East Brooklyn Brownsville $2,025,000 4 $506,250 38,224 $54
Canarsie $11,250,000 6 $1,875,000 73,348 $168
Cypress Hills $3,284,125 3 $1,094,708 12,565 $248
East New York $15,910,557 22 $723,207 190,205 $95
Total/Average $32,469,682 35 $927,705 314,342 $116
Brooklyn Wide $1,010,107,637 258 $3,915,146 4,062,052 $224
North Brooklyn East Williamsburg $52,391,000 9 $5,821,222 147,415 $318
Greenpoint $48,005,000 11 $4,364,091 140,007 $376
Williamsburg $141,484,350 9 $15,720,483 255,751 $486
Total/Average $241,880,350 29 $8,340,702 543,172 $392
Central Brooklyn Borough Park $55,577,500 13 $4,275,192 245,970 $230
East Flatbush $34,990,000 16 $2,186,875 217,909 $160
Flatbush $3,185,000 2 $1,592,500 40,050 $121
Flatlands $2,266,700 6 $377,783 17,179 $161
Kensington $6,350,000 2 $3,175,000 38,716 $162
Midwood $14,342,000 8 $1,792,750 85,544 $243
Total/Average $116,711,200 47 $2,483,217 645,367 $192
Greater Downtown Brooklyn Boerum Hill $61,000,000 2 $30,500,000 128,611 $470
Carroll Gardens $10,250,000 3 $3,416,667 20,980 $519
Clinton Hill $3,200,000 1 $3,200,000 7,126 $449
Downtown Brooklyn $1,950,000 1 $1,950,000 5,000 $390
DUMBO $60,000,000 1 $60,000,000 140,916 $426
Fort Greene $75,400,000 2 $37,700,000 144,150 $459
Gowanus $25,350,000 4 $6,337,500 74,198 $317
Park Slope $49,380,625 2 $24,690,313 222,024 $263
Prospect Heights $15,000,000 1 $15,000,000 29,475 $509
Red Hook $8,090,000 3 $2,696,667 32,453 $252
Total/Average $309,620,625 20 $15,481,031 804,933 $387
* Price per Buildable Square Foot
Region Neighborhood Dollar VolumeTotal
TransactionsAvg.
Transaction Total BSF Avg. PPBSF*
Residential Development

2017 B R O O K L Y N M A R K E T R E P O R T
Page 15
The average price per buildable SF of development sites in 2017 in Brooklyn was $224, up slightly from 2016’s average of $206.
The North Brooklyn region achieved the highest average price per buildable SF at $392.
Price per Buildable SF
Transaction and Dollar Volume
East Brooklyn$116/bsf
SouthBrooklyn$228/bsf
CentralBrooklyn$192/bsf
WestBrooklyn$279/bsf
NorthBrooklyn$392/bsf
Bed Stuy/Bushwick/Crown Hts$174/bsf
Greater Downtown Brooklyn$387/bsf
WestBrooklyn15$36m
Bed Stuy/Bushwick/Crown Hts77 $211m
CentralBrooklyn47 $117m
SouthBrooklyn35$63m
NorthBrooklyn29 $242m
Greater Downtown Brooklyn20 $310m
East Brooklyn35 $32m
Residential Development
In 2017, there was a total of 258 development transactions in Brooklyn, totaling approximately $1B.
The Bed-Stuy/Bushwick/Crown Heights region had the highest number of development transactions in 2017 with 77 transactions.and also had the highest number of development transactions in 2016.

2017 B R O O K L Y N M A R K E T R E P O R T
Page 16
The largest retail transaction in 2017 was 60 North 6th Street - a 10,000 SF building in the North Brooklyn region. The property sold for $19.8M.
The highest priced retail transaction was 60 North 6th Street which sold for
in December. The Central Brooklyn region had the highest number of retail transactions, as well as, the highest dollar volume with
transactions for a total consideration of approximately
$19.8M
$102M.
25
In the retail category, we have verified
transactions totaling to approximately
at approximately
The total dollar volume was approximately
a 23% increase from 2016. The average retail transaction was approximately
96
$349M
Retail Building Transactions“Brooklyn’s retail market continues to show strength in 2017 with a 36% uptick in sales volume, while the total number of transactions decreased market-wide. As the residential market continues to level-off, the retail market is beginning to pick up, experiencing a 17% increase since 2016 due largely to the increased investment and growth in emerging neighborhoods.”
The retail transaction with the highest price per SF was 99 North 6th Street in the North Brooklyn region, which sold for approximately $5,480 per SF.
Peter MatheosSenior Vice President, Investment Sales
$605/SF.
683KSF
$3.63M.This study shows Brooklyn commercial retail building transactions for 2017, broken down into region and neighborhood. Considered data points include: total dollar volume, total number of transactions, average sale price, total square footage sold and average price per SF.

2017 B R O O K L Y N M A R K E T R E P O R T
Page 17
Bed Stuy/Bushwick/Crown Hts Bedford-Stuyvesant $2,292,189 2 $1,146,095 5,650 $569
Bushwick $19,382,518 4 $4,845,630 34,752 $561
Total/Average $21,674,707 6 $3,612,451 40,402 $564
South Brooklyn Brighton Beach $2,500,000 1 $2,500,000 3,276 $763
Coney Island $3,800,000 2 $1,900,000 4,264 $794
Gerritsen Beach $680,000 1 $680,000 1,880 $362
Gravesend $14,835,750 5 $2,967,150 37,188 $398
Marine Park $7,267,000 6 $1,211,167 14,905 $461
Sheepshead Bay $23,356,537 7 $3,336,648 35,064 $548
Total/Average $52,439,287 22 $2,383,604 96,577 $514
West Brooklyn Bath Beach $1,700,000 1 $1,700,000 3,800 $447
Bay Ridge $58,100,000 10 $5,810,000 64,249 $857
Bensonhurst $36,800,000 6 $6,133,333 61,242 $817
Sunset Park $3,730,000 2 $1,865,000 8,590 $402
Total/Average $100,330,000 19 $5,280,526 137,881 $775
East Brooklyn Brownsville $14,935,000 7 $2,133,571 40,730 $437
Canarsie $3,260,000 2 $1,630,000 14,675 $208
East New York $6,600,000 7 $942,857 44,820 $252
Total/Average $24,795,000 16 $1,549,688 100,225 $328
Brooklyn Wide $348,528,224 96 $3,630,502 683,192 $605
North Brooklyn East Williamsburg $2,025,000 1 $2,025,000 10,500 $193
Williamsburg $40,690,000 5 $8,138,000 28,360 $2,013
Total/Average $42,715,000 6 $7,119,167 38,860 $1,710
Central Brooklyn Borough Park $25,855,000 6 $4,309,167 61,239 $458
East Flatbush $10,948,000 7 $1,564,000 36,760 $326
Flatbush $11,766,875 4 $2,941,719 27,530 $556
Flatlands $1,615,000 1 $1,615,000 9,850 $164
Kensington $4,450,000 1 $4,450,000 7,660 $581
Midwood $47,164,355 6 $7,860,726 117,433 $674
Total/Average $101,799,230 25 $4,071,969 260,472 $482
Greater Downtown Brooklyn Columbia Waterfront $3,100,000 1 $3,100,000 5,850 $530
Fort Greene $1,675,000 1 $1,675,000 2,925 $573
Total/Average $4,775,000 2 $2,387,500 8,775 $551
* Price per Square Foot
Region Neighborhood Dollar VolumeTotal
TransactionsAvg.
Transaction Total SF Avg. PPSF*
Retail

2017 B R O O K L Y N M A R K E T R E P O R T
Page 18
The average price per SF of retail building transactions in 2017 in Brooklyn was $605, down 13% from 2016’s average of $694.
The North Brooklyn region achieved the highest average price per SF at $1710.
Price per SF
Transaction and Dollar Volume
East Brooklyn$328/sf
SouthBrooklyn$514/sf
CentralBrooklyn$482/sf
WestBrooklyn$775/sf
NorthBrooklyn$1710/sf
Bed Stuy/Bushwick/Crown Hts$564/sf
Greater Downtown Brooklyn$551/sf
WestBrooklyn19$100m
Bed Stuy/Bushwick/Crown Hts6 $22m
CentralBrooklyn25 $102m
SouthBrooklyn22 $52m
NorthBrooklyn6$43m
Greater Downtown Brooklyn2$5m
East Brooklyn16$25m
Retail
In 2017, there was a total of 96 retail transactions in Brooklyn, totaling approximately $349M.
The Central Brooklyn region had the highest number of retail transactions with 25 transactions compared with 20in 2016.

2017 B R O O K L Y N M A R K E T R E P O R T
Page 19
industrial/office transaction was a four building portfolio in DUMBO whichsold for
in March.The Central Brooklyn and the Greater Downtown Brooklyn region had the hightest number of industrial/office transactions with
transactions.The highest dollar volume was recorded in the Greater Downtown Brooklyn Region at approximately
$15.8M.
$408M
18
In the industrial/office category, we have verified
transactions totaling for approximately
gross square feet at an average
The total dollar volume was approximately
a 52% increase from 2016.The average industrial/office transaction was approximately
The highest priced
802.8M
$1.2B
$409/SF.
Industrial/Office Building Transactions“The market saw continued demand for Industrial/Office properties in 2017. With the office market still growing and a renewed interest in industrial by distribution companies, both dollar volume and price per square foot increased significantly from 2016.”
The industrial/office transaction with the highest price per SF was 131 8th Street in Gowanus, which sold for approximately $1,685 per SF.
The highest priced industrial/office transaction was a four building portfolio in DUMBO which sold for $408M in March. The portfolio includes four buildings totaling approximately 644,000 gross SF.
Dan MarksPartner
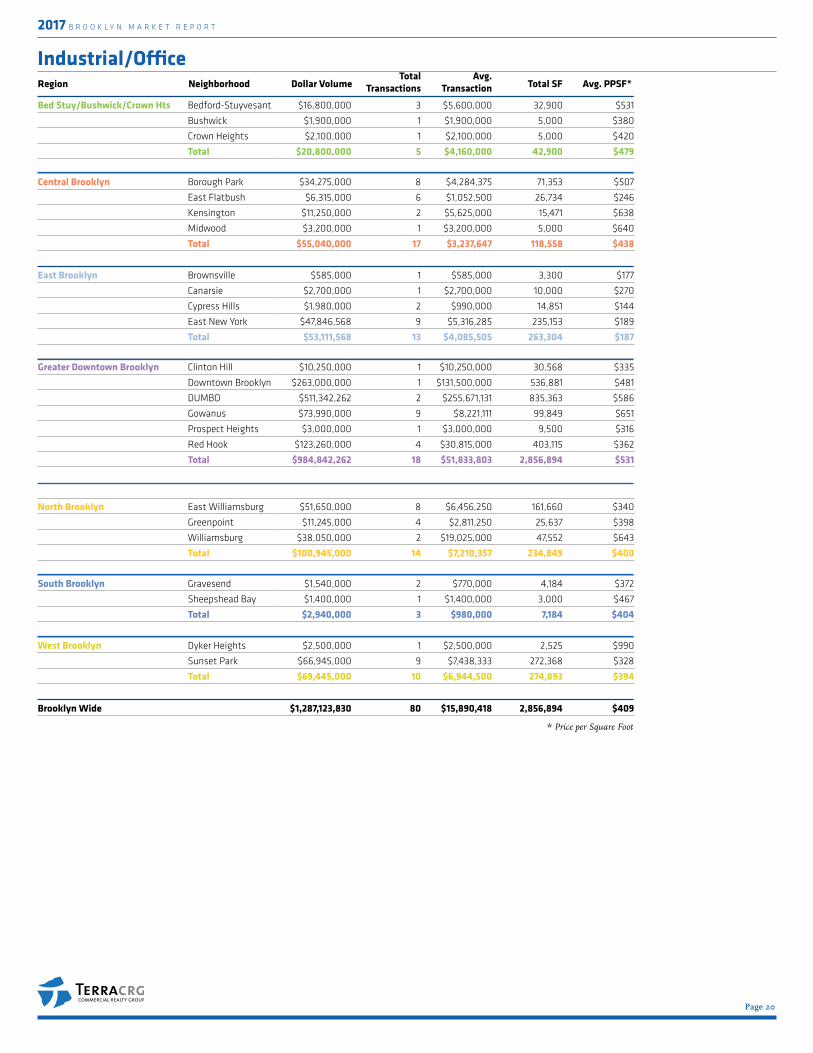
$984M.This study shows Brooklyn commercial industrial/office building transactions for 2017, broken down into region and neighborhood. Considered data points include: total dollar volume, total number of transactions, average sale price, total square footage sold and average price per SF.
2017 B R O O K L Y N M A R K E T R E P O R T
Page 20
Bed Stuy/Bushwick/Crown Hts Bedford-Stuyvesant $16,800,000 3 $5,600,000 32,900 $531
Bushwick $1,900,000 1 $1,900,000 5,000 $380
Crown Heights $2,100,000 1 $2,100,000 5,000 $420
Total $20,800,000 5 $4,160,000 42,900 $479
South Brooklyn Gravesend $1,540,000 2 $770,000 4,184 $372
Sheepshead Bay $1,400,000 1 $1,400,000 3,000 $467
Total $2,940,000 3 $980,000 7,184 $404
West Brooklyn Dyker Heights $2,500,000 1 $2,500,000 2,525 $990
Sunset Park $66,945,000 9 $7,438,333 272,368 $328
Total $69,445,000 10 $6,944,500 274,893 $394
East Brooklyn Brownsville $585,000 1 $585,000 3,300 $177
Canarsie $2,700,000 1 $2,700,000 10,000 $270
Cypress Hills $1,980,000 2 $990,000 14,851 $144
East New York $47,846,568 9 $5,316,285 235,153 $189
Total $53,111,568 13 $4,085,505 263,304 $187
Brooklyn Wide $1,287,123,830 80 $15,890,418 2,856,894 $409
North Brooklyn East Williamsburg $51,650,000 8 $6,456,250 161,660 $340
Greenpoint $11,245,000 4 $2,811,250 25,637 $398
Williamsburg $38,050,000 2 $19,025,000 47,552 $643
Total $100,945,000 14 $7,210,357 234,849 $400
Central Brooklyn Borough Park $34,275,000 8 $4,284,375 71,353 $507
East Flatbush $6,315,000 6 $1,052,500 26,734 $246
Kensington $11,250,000 2 $5,625,000 15,471 $638
Midwood $3,200,000 1 $3,200,000 5,000 $640
Total $55,040,000 17 $3,237,647 118,558 $438
Greater Downtown Brooklyn Clinton Hill $10,250,000 1 $10,250,000 30,568 $335
Downtown Brooklyn $263,000,000 1 $131,500,000 536,881 $481
DUMBO $511,342,262 2 $255,671,131 835,363 $586
Gowanus $73,990,000 9 $8,221,111 99,849 $651
Prospect Heights $3,000,000 1 $3,000,000 9,500 $316
Red Hook $123,260,000 4 $30,815,000 403,115 $362
Total $984,842,262 18 $51,833,803 2,856,894 $531
* Price per Square Foot
Region Neighborhood Dollar VolumeTotal
TransactionsAvg.
Transaction Total SF Avg. PPSF*
Industrial/Office

2017 B R O O K L Y N M A R K E T R E P O R T
Page 21
The average price per SF of industrial/office buildings in 2017 in Brooklyn was $409, up 20% from 2016’s average of $341.
The Greater Downtown region achieved the highest average price per SF at $531.
Price per SF
Transaction and Dollar Volume
East Brooklyn$187/sf
SouthBrooklyn$404/sf
CentralBrooklyn$438/sf
WestBrooklyn$394/sf
NorthBrooklyn$400/sf
Bed Stuy/Bushwick/Crown Hts$479/sf
Greater Downtown Brooklyn$531/sf
WestBrooklyn10$69m
Bed Stuy/Bushwick/Crown Hts5$21m
CentralBrooklyn17 $55m
SouthBrooklyn3$2.9m
NorthBrooklyn14$101m
Greater Downtown Brooklyn18$984m
East Brooklyn13 $53m
Industrial/Office
In 2017, there was a total of 80 industrial/office transactions in Brooklyn, totaling approximately $1.2B. In 2016, there was a total of 98 industrial/office transactions totaling approximately $790M.
The Greater Downtown region had the highest number of industrial/office transactions with 18 transactions, as where in 2016, the North Brooklyn region had the highest number of industrial/office transactions.

2017 B R O O K L Y N M A R K E T R E P O R T
Page 22
The second highest priced sale borough-wide in 2017 was the $200M sale of 21 Clark Street in Brooklyn Heights. The property was a student housing/medical facility owned by the Jehovah’s Witness.
Ofer CohenFounder & CEO
In 2017, there were a total of 115 other/special asset transactions in Brooklyn with a total dollar volume of $1.23B.
Some of these assets include 21 Clark Street, 20 North 12th Street and 90-160 Sands Street.
Other/Special Assets
Sold for $135M, 90-160 Sands Street in Downtown Brooklyn is a 30-story vacant hotel purchased from the Watchtower Society. It is part of a complex that includes five other buildings sold to Kushner Companies, along with RFR Realty and LIVWRK.
20 North 12th Street, an approximately 309,643 SF lot of the City Storage site was sold to the City of New York for $160M in the North Brooklyn Region for the creation of the Maker Park.
East Brooklyn22$152
SouthBrooklyn23$75
CentralBrooklyn22$98
WestBrooklyn9$34
NorthBrooklyn6$213
Bed Stuy/Bushwick/Crown Hts12$26
Greater Downtown Brooklyn21$637
Transaction and Dollar Volume
“Although there were no specific trades in 2017 that compared to the $855M Watchtower trade in 2016, there was only a 17% decrease in dollar volume for other/special assets, proving that the market and interest for these special properties is still sturdy.”

2017 B R O O K L Y N M A R K E T R E P O R T
Page 23
Report Methodology TerraCRG’s 2017 Brooklyn Market Report includes commercial property transactions recorded in January 1st 2017 through December 31st 2017. Asset types analyzed in the report include Multifam-ily, Mixed-Use, Retail, Development, Office & Industrial transactions. Recorded transaction sources include NYC.gov Rolling transactions data in conjunction with transactions data from PropertyShark, most have been fact checked by our TerraCRG team. Trans-actions under $200,000
have been omitted from the report. Property types include only commercial properties. Multifamily transactions include NYC Class C & D buildings five units and up; condomini-um transactions are not included. Mixed-Use trans-actions include NYC Class S, C7 and K4 buildings; condominium transac-tions and co-op transac-tions are not included. Retail transactions include NYC Class K buildings. Development transactions include NYC Class V, Z G6 & G7 proporties, only Brooklyn residential land transactions have been
included. Office & Indus-trial transactions include NYC Class O, E, F, G & L buildings; only commer-cially-zoned buildings (M or C zoning) are accounted for. The Other category includes industrial land and buildings plus land transactions, Commercial-ly-zoned Residential Land, Hotel Buildings, Church-es and all other Special Use type transactions. If neighborhoods are not included in the individual product type transactions breakdown, there were no recorded transactions that fit our study criteria in that neighborhood.
TerraCRGTerraCRG is the only com-mercial real estate broker-age firm focused exclusive-ly on the Brooklyn market. In a decade, TerraCRG has established itself as a true market leader, averaging over 70 completed trans-actions annually. Over the past five years, TerraCRG has handled over two billion dollars’ worth of commercial property in Brooklyn, including some of the largest development sites, multifamily assets and retail buildings in Brooklyn’s most sought after neighborhoods.
To date, the TerraCRG team has handled more development transactions in Brooklyn than any other company, totaling over three million buildable square feet. For more information about Terra-CRG, please visit terracrg.com.
For more Brooklyn market information or a complimentary evaluation of an asset, please contact Ofer Cohen, Founder & CEO @ 718-768-6888 or [email protected].

Multifamily - Mixed Use - Development - Retail - Industrial - Other/Special Asset Only Brooklyn
For more Brooklyn market information or to discuss specific opportunities, please contact:
Ofer CohenFounder & [email protected]
Adam [email protected]
terracrg.com
Matt CosentinoPartner [email protected]
Peter MatheosSenior Vice [email protected]
Antonina AgrusaDirector of [email protected]
Steffen GonzalezData Analyst, [email protected]
718-768-6888
Follow us: