the buildinggreen report tm
TRANSCRIPT

The BuildingGreen Report • November 2017 Copyright ©2017 BuildingGreen, Inc. All rights reserved.
The Cost of Comfort: Climate Change and Refrigerants Refrigerants with very high global warming potential can negate the energy-efficiency benefits of many HVAC systems, including popular heat pumps.
by Brent Ehrlich
What is the number-one action we can take to reverse anthropogenic global warming? Eliminate coal-fired power plants? Drive electric cars? Install solar panels? Paul Hawken’s new book, Drawdown, calculates and rates the environmental and financial impacts of addressing carbon output across various sectors. According to Drawdown, the number one action we can take to fix our greenhouse gas problem is…to reduce the impact of high-global-warming-potential (GWP) refrigerants.
Reducing those impacts won’t be easy. Refrigerants are the lifeblood of modern society. Refrigerators, freezers, and displays use them to keep our food at a safe temperature. Commercial chillers, air conditioners, mini- and multi-split heat pumps, and variable-refrigerant-flow (VRF) systems use refrigerants for space cooling and heating. They’re even used in vending machines, water coolers, ice machines, dehumidifiers, residential clothes dryers, and water heaters.
It’s not just that refrigerants are everywhere. Many systems use refrigerants with thousands of times the impact on global warming of carbon dioxide. These refrigerants can escape during installation, servicing, accidents, and disposal. For HVAC systems, the energy and carbon savings from their use usually
outweighs the potential greenhouse gas emissions of the refrigerants over the equipment’s lifespan, but not if these systems are improperly installed, commissioned, or disposed of.
As we try to minimize energy use and move away from consuming fossil fuels toward more energy- efficient equipment, we are using more electricity for heating and cooling—and that means using more refrigerants than ever. Heat pumps and VRF systems (heat pumps that serve multiple rooms and can provide
cooling to one part of a building while heating another), for instance, have become the go-to heating and cooling method for high- performance homes and many commercial spaces. These systems often use long lines of refrigerant that both increase the volume of refrigerant used, and expose it to the risk of release.
In this article, we’ll explore:
• how refrigerants work
• data comparing the carbon foot-print of mini-split heat pumps and standard high-performance HVAC systems
• ways of reducing refrigerant leaks throughout the appliance life cycle
• alternative refrigerants and their limitations
Formerly Environmental Building News www.BuildingGreen.com Volume 26, Number 11 · November 2017
The Leading Source for Environmentally Responsible Design & Construction
TMThe BuildingGreen Report
Photo: Rapid RecoveryRefrigerant recovery from HVAC equipment.

p. 2The BuildingGreen Report • November 2017
• some steps we can take to minimize the environmental impact of these important fluids
What Are Refrigerants?We feel the effect of refrigerants every time we sweat. As water evaporates off our skin, turning from a liquid to a vapor, it expands, pulling heat from our bodies. Commercial chillers, heat pumps, and refrigerators use this same principle but in a closed loop called a vapor-compression cycle (see image), where the following steps occur:
1. A liquid refrigerant flows through an expansion valve or similar device, where it turns into a vapor in an evaporator.
2. Heat moves from the room or refrigerator through the walls of the evaporator piping/tubes to the va-por, cooling the room and warming the vapor.
3. The superheated vapor flows to a compressor, where it is compressed, adding some additional heat from mechanical action in the process.
4. The compressed, superheated vapor flows to a condenser where the heat is removed by either air or water (such as radiators on air conditioners), cooling the vapor and transforming it back into a liquid. The heat energy is either vented or in some cases captured for reuse.
5. The cooled, liquid refrigerant is pumped back through the system and the loop repeats.
With many HVAC systems, ducts connect to a central air- conditioning unit to provide cooling and are hooked into a fresh air supply, but split-system heat pumps are usually ductless and do not provide fresh air. Instead, an outdoor compressor pumps refrigerant via tubing to indoor units that can heat or cool rooms, depending on the direc-tion of refrigerant flow. VRF systems have long tubing runs that require addition refrigerant.
HVAC systems use different types of compressors, ranging from old piston- driven, reciprocating models
to centrifugal units that spin and use magnetic levitation instead of bearings (see Magnetic-Bearing Chillers: Cooling without Friction). These systems typically use different amounts and types of refrigerant.
Short- vs. Long-Term Carbon EmissionsTo get a better idea of the impact refrigerants have on carbon emissions and energy use, Robin Neri and Marc Zuluaga, mechanical engineers at Steven Winter Associates, recently presented some theoretical calculations. They calculated the carbon output of two theoretical residential HVAC systems: a single- room mini-split air-source heat pump versus a best-in-class efficient gas hydronic baseboard system.
“We looked at heating use and carbon emissions per square foot of floor area based on the typical size system to serve that floor area apartment (500 square feet),” says Neri. The calculations are based on energy and climate data specific to New York City and assumed an annual heating coefficient of performance (COP) of 2.5 (2.5 kilowatt hours of heat energy are produced for every 1 kWh consumed) for a 12,000 Btu/hour (1 ton) heat pump.
They estimated the amount of refrigerant in the system, or “charge,” to be about 2.9 pounds of refrigerant, including that contained in the tubing connecting the indoor and outdoor units.
And, importantly, they also incorporated refrigerant leakage in their calculations, which changes the environmental impact of the system.
Neri and Zuluaga reported the following key findings:
• The heat pump’s electricity consumption equals annual CO2 equivalent (CO2e) emissions of approximately 1.0 pound per square foot (1.0 lb/sf/yr), based on the New York City electrical grid.
The BuildingGreen Report Founding Editor · Alex Wilson
President, Editorial Director · Nadav Malin Managing Editor · Nancy Eve Cohen
Products & Materials Specialist · Brent EhrlichResearch Analyst · Paula Melton
Designer & Proofreader · Bets GreerProduction Assistant · Fran Bellin
Vice President, Technical Services · Peter YostChief Strategy Officer · Tristan Roberts
Design Director · Andrea LemonOutreach Director · Jerelyn Wilson
Operations Director · Angela BattistoAccounting & HR Director · Sarah Rice
Customer Support Manager · Charlotte SnyderWeb Developer · Ben Hewitt
Project Coordinator · Kelly Pope
Advisory BoardSteve Baczek, R.A., Reading, MA
Bob Berkebile, FAIA, Kansas City, MOArlene Blum, Ph.D., Berkeley, CAJohn Boecker, AIA, Harrisburg, PA
Terry Brennan, Rome, NYBill Browning, Hon. AIA, Washington, DC
Nancy Clanton, P.E., Boulder, CORaymond Cole, Ph.D., Vancouver, BC
David Eisenberg, Tucson, AZDrew George, P.E., San Diego, CA
Harry Gordon, FAIA, Washington, DCBruce King, P.E., San Rafael, CAJohn L. Knott, Jr., Charleston, SC
Sandra Mendler, AIA, San Francisco, CAGreg Norris, Ph.D., N. Berwick, ME
Russell Perry, FAIA, Washington, DCPeter Pfeiffer, FAIA, Austin, TXBill Reed, AIA, Arlington, MAJonathan Rose, Katonah, NY
Marc Rosenbaum, P.E., W. Tisbury, MAJohn Straube, Ph.D., P.Eng., Waterloo, ON
Michael Totten, Denver, COGail Vittori, Austin, TX
The BuildingGreen Report (ISSN 1062-3957), formerly Environmental Building News, is published monthly by BuildingGreen, Inc. TBGR does not accept advertising.
Copyright ©2017, BuildingGreen, Inc. All rights reserved. No material in this publication may be photocopied, electronically transmitted, or otherwise reproduced by any means without written permission from the Publisher. However, license to photocopy items for internal use or by institutions of higher education as part of collective works is granted.
DisclaimerEvery effort has been made to ensure that the information presented in TBGR is accurate and that design and construction details meet generally accepted standards. However, the information presented in TBGR, by itself, should not be relied on for final design, engineering, or building decisions.
Editorial & Subscription Office122 Birge St., Suite 30, Brattleboro, VT 05301
802-257-7300 · 802-257-7304 (fax) [email protected] · www.BuildingGreen.com

p. 3The BuildingGreen Report • November 2017
• The hydronic system would generate CO2e emissions twice that: about 2.0 lb/sf/yr.
• If all of the refrigerant (R410a) were to escape from the heat pump, it would result in approximately 12 lb/sf of CO2e emissions, or 6,000 pounds CO2e. For reference, burning a ton of coal releases 3,740 pounds of CO2, according to the U.S. Energy Information Admin-istration, so 6,000 pounds of CO2e equates to burning 1.6 tons of coal.
The table provides a detailed summa-ry of the team’s data.
Zuluaga says that they were looking at refrigerants from the application side within the context of the electrification of larger buildings in New York City. “We wanted to raise industry awareness around the (leakage) issue. We can’t realize 80 x 50 carbon reduction goals (80% 2005 greenhouse gas emission levels by 2050) without figuring out how to responsibly scale up heat pumps.” But the leakage rate problem could be extrapolated to larger heat pumps. “There are a lot of reasons to do VRFs,” he says, “but if a primary reason to retrofit a building with VRF is carbon, then you really can’t ignore leakage.” According to Neri and Zuluaga, at 10% leakage per year, the carbon benefit of a small residential heat pump disappears compared to a top-tier gas-fired hydronic system. In commercial applications, VRF systems require approximately four to six pounds of refrigerant for every ton of cooling to account for longer tubing runs and larger equipment. In these cases, the
leakage and long-term carbon emis-sions become even more important.
How much do these systems actually leak? Clearly, that’s critical to understanding their actual CO2e impact. We’ll get into that later in the article.
How Concerned Should We Be?Reducing the greenhouse gas emissions from our homes and businesses is a priority, and Drawdown puts a surprising focus on refrigerants. But only about 35% of hydro-fluorocarbon (HFC) refrigerants are used for HVAC. This is a significant percentage, but far more refrigerants (including hydrochlorofluorocarbons, or HCFCs, found in grandfathered systems) are used in commercial food preparation and storage, supermarket displays, industrial and petroleum refining, and cars, and all have worse records in terms of accidental leakage. So, looking across various industries, HVAC in homes and offices isn’t the most critical sector. However, data like Neri and Zuluaga’s show that refrigerant use in HVAC has to be considered.
According to the U.S. Department of Energy (DOE), globally, air- conditioning accounts for 700 million
metric tons of CO2e annually. Direct emissions of refrigerants from comfort cooling accounts for about 21% of this output. The majority comes from indirect emissions generated by power plants and other sources that provide energy to the system. Though not a panacea, using low-GWP refrigerants would reduce CO2e emissions from HVAC significantly.
These reductions will be particularly important since the number of air- conditioners (mostly heat pumps) is growing worldwide and is expanding rapidly in developing countries. The International Energy Agency projects that by 2050, developing countries will use 4.5 times more air-conditioning than in 2010. Data from the National Sample Survey Organization bears this out. Of those surveyed, air- conditioner ownership in urban China went from almost 0% in 1990s to 100% in 15 years.
To reduce climate impacts of our HVAC systems we will have to move toward low-GWP refrigerants, along with other measures. Drawdown calculates that in 30 years, capturing 87% of refrigerants from equipment leaks and at the end of equipment life would avoid emissions equivalent to 89.7 gigatons (89.7 billion tons) of CO2. Getting there will be the challenge.
Refrigerant leakage rate per year
Pounds CO2e per square foot per year due to building emissions and refrigerant leakage
0% 1.0
1% 1.2
5% 1.6
10% 2.2 (comparable to a gas hydronic system = approximately 2.0)
25% 3.8 (comparable to a median electric baseboard = approximately 4.2)
40% 5.8 (comparable to a median steam building = approximately 6.2)
Impact of Refrigerant Leakage per Year on Heating CO2 Intensity
Source: BuildingGreen, Inc., based on data supplied by Robin Neri and Marc Zuluaga, Steven Winter Associates
Photo: Rapid Recovery
Tanks like these are used to capture high global warming potential refrigerants during equipment maintenance and at the end of service life, which is critical for keeping greenhouses gases in check.

p. 4The BuildingGreen Report • November 2017
Refrigerant BasicsThe various refrigerants that run through comfort cooling systems are not one-size-fits-all. A window- mounted air-conditioner has a few ounces of refrigerant, whereas a supermarket refrigeration system can contain more than 40,000 pounds. Each system typically requires different refrigerants. That’s because refrigerants store heat at different rates, become a vapor at different temperatures, require different pressures in the compressor, and work in tandem with different lubricants. Cooling systems (and heating in the case of heat pumps and VRF systems) are optimized to take advantage of the mechanical properties of the fluids and compressors to operate as efficiently, and inexpensively, as possible.
The evolution of refrigerants
Early refrigerants—such as methyl chloride or sulfur dioxide—were often toxic, flammable, or both. (Ammonia, propane, and CO2 were also used—and still are—but are not ideal for all
applications; more on this later.) So in the 1920s, the industry turned to safer and more stable compounds based on chlorine, fluorine, and carbon chemistries.
The first generation of refrigerants were known as chlorofluorocarbons (CFCs). They became the refrigerant standard and ushered in the modern era of air conditioning. There was a heavy price to pay for our newfound comfort, however. CFCs destroy the ozone layer that protects the planet from ultraviolet radiation (see the Primer article on the Montreal Protocol). They also have a very high global warming potential—the major CFC refrigerant R-12 has a GWP 10,000 times that of CO2.
The international community adopted the Montreal Protocol on Substances that Deplete the Ozone Layer in 1989 to stop the use of these ozone- depleting substances worldwide. Seven years later the U.S. banned CFCs under the Clean Air Act.
The second generation of refrigerants, hydrochlorofluorcarbons (HCFCs), have lower ozone-depletion potential
(ODP), but still have very high GWP. They are scheduled to be phased out by the Montreal Protocol, and Clean Air Act as well, with 99.5% gone by 2020 and 100% by 2030. This phase out includes the HCFC R-22, one of the most versatile and widely used refrigerants.
Concern over ozone depletion led to the adoption of the third generation of refrigerants: chlorine-free HFCs. But there has been an environmental price to be paid for these as well. As research piled up over the decades, scientists found that HFCs have a high global warming potential. The Kigali Amendment to the Montreal Protocol, ratified in 2016, is intended to begin the phaseout of these refrigerants worldwide, but its adoption has stalled in the U.S.
The fourth generation of refrigerants, hydrofluoroolefins (HFOs), do not contain chlorine or carbon. They offer zero ODP and very low GWP. Natural refrigerants such as CO2, propane, and ammonia also have a niche in refrigeration and cooling, and are exempt from Montreal-related regulations due to their low OWP and GWP.
The GWP of HFCs and other refrigerants can be difficult to calculate. That’s because of the way different refrigerants react with the atmosphere. Some linger for years yet do little damage, while others react quickly and dissipate. The Intergovernmental Panel on Climate Change (IPCC) provides GWP in 20-, 100-, and 500-year intervals. The 100-year interval is most often used for comparisons and policy decisions, and will be used here. The IPCC updates its 100-year GWP of refrigerants periodically based on improved data, so it is common to see different values provided in literature. R-410a, for example, was once considered to have a GWP of 1,725, but was updated to 1,975, and is now considered to have a value of 2,088. Whichever number you pick, it’s high!
Image courtesy of Home Power Magazine, homepower.com
This schematic shows how an air-source heat pump functions.

p. 5The BuildingGreen Report • November 2017
Life-cycle impacts
The GWP of a refrigerant is a snapshot of its potential impacts and only tells part of the story. To try and gain a clearer picture of impacts over time, some experts are turning to life- cycle models that measure both direct and indirect emissions of equipment, and can give a more complete carbon accounting.
Total equivalent warming impact (TEWI), for instance, looks at the refrigerant GWP, the annual leakage rate, equipment run-time, system efficiency, and other metrics, with local utility fuel sources complicating the carbon calculation. Life-cycle climate performance (LCCP) takes TEWI one step further, adding the emissions from refrigerant production and transportation.
These tools are intended to provide more accurate pictures of refrigerant impacts and are useful for comparing theoretical data. In the real world,
fuels used by local utilities have different carbon impacts whether using coal or more renewables. Equipment is also application-specific, with different leakage rates that vary from system to system.
For instance, some models run using TEWI as their metric show that CO2 as a refrigerant can have a greater overall carbon impact than R-410a, mostly due to CO2 refrigerant system inefficiencies and system type. But end uses of CO2 systems are usually different than those using R-410a, and CO2 is an effective refrigerant in the right applications.
The lack of reliable leakage-rate data adds to the complexity of gathering life-cycle data, so some have chosen to omit their use. Patrick Phelan, professor of mechanical and aerospace engineering at Arizona State University and manager of the Emerging Technologies program at the DOE’s building technology office from 2012 through 2016, worked with
international research experts to judge the impact of refrigerants. “The key part is estimating the leakage rates of refrigerants over their lifetime,” he says. “That is the part that is difficult to agree on.” In the end, their group chose to use standard refrigerant GWP numbers to avoid ambiguity.
Leakage and DisposalKarim Amrane, vice president of regulatory and research at the Air-Conditioning, Heating, and Refrigeration Institute (AHRI), estimates that for commercial chillers, almost 95% of the emissions come from creating the energy that powers them. “If you do the math using life-cycle climate performance, the greatest contribution to the climate is not coming from the refrigerant; it comes from the indirect emissions.” But extrapolating from the Steven Winter calculations, leakage rates that exceed 10% from VRF systems could potentially result in a system with more direct emissions than indirect.
Type ASHRAE Number IUPAC Chemical Name Atmospheric
Lifetime (years) ODP GWP 100-yr
ASHRAE 34 Safety Group
CFC R-11 Trichlorofluoromethane 45 1.0 4,750 A1
CFC R-12 Dichlorodiflouromethane 100 1.0 10,900 A1
HCFC R-22 Chlorodifluoromethane 12.0 0.05 1,810 A1
HFC R-32 Difluoromethane 4.9 0 675 A2L
HCFC R-123 2,2-dichloro-1,1,1- trifluoroethane 1.3 0.02 77 B1
HFC R-134a 1,1,1,2- tetrafluoroethane 14 0 1,430 A1
HCFC R-141b 1,1-dichloro-1- fluoroethane 9.3 0.12 725 A2
HC R-290 Propane 12 0 3.3 A3
HFC R-410a R-32/125 (50+.5, –1.5/50+1.5,–.5) 16.95 0 2,088 A1
HFO R-1234yf 2,3,3,3- tetrafluoropropene 0.03 0 4 A2L
Refrigerants and Their Ozone-Depleting and Global-Warming Potentials
Source: BuildingGreen, Inc. Data: Wikipedia. License: CC BY-SA 3.0
CFCs: chlorofluorocarbons; HCFC: hydrochloroflourocarbons; HFC hydrofluorocarbons; HC: hydrocarbons; HFO: hydrofluoroolefins

p. 6The BuildingGreen Report • November 2017
Leakage
Amrane states, “if it (a refrigerant) doesn’t leak, there is no direct impact.” But when there are leaks, they are no laughing matter. Leaks reduce system efficiency, capacity, and reliability, as well as add costs for replacement refrigerant, parts, and labor. Refrigerant leaks can come from initial charging (adding refrigerant), defective equipment, installation (even when done well), repairs, corrosion, damage, recharging, and improper disposal.
Refrigerant emissions have gained a lot of attention because of the number and volume of leaks from super market and large commercial refrigeration. These systems have had reported leakage rates of 35% annually and can use 3,500 pounds or more of refrigerant, according to the U.S. Environmental Protection Agency (EPA). With long piping runs and connections that are subjected to vibration, long hours, and generally rough conditions, large refrigeration systems like these have more opportunities for leaks. The same is true for cars, where vibration, corrosion, and DIY repairs lead to more accidental releases.
Experts are less concerned about leaks from residential and commercial HVAC systems, because they are often factory-built to tighter tolerances and have fewer connections that can leak or fail. Even so, the International Institute of Refrigeration estimates that commercial chillers have leakage rates of up to 15% and residential and light commercial systems up to 10%, and higher for complicated split systems. Of course, the more connections, the more chance of leakage, so special attention should be paid when installing larger commercial systems such as VRF systems with long refrigerant lines.
For small leaks from residential and light commercial systems, there’s not much we can do, according to Keilly Witman, owner of KW Refrigerant Management Strategy and co-chair of the North American Sustainable Refrigeration Council, who says “AC
units have very little refrigerant in them, and by the time you find out you have a leak, it is too late to save the refrigerant inside of it. It doesn’t take very long for five pounds of refrigerant to leak out.” Witman, who used to run the GreenChill Partnership at the EPA covering supermarket refrigerant emissions, said occupants rarely know there is a leak until they notice the system isn’t working properly, and by then it is often too late.
End of life
To truly minimize the impact of refrigerants as put forth in Drawdown, we need to address the elephant in the room: managing refrigerants at the end of equipment’s service life. We can’t assume refrigerants will be captured before disposal, and many life-cycle models assume 100% emissions at the end of life.
As with leakage rates, there is little solid data to assess all the losses due to equipment failure or improper disposal of equipment. Witman notes that most equipment is replaced or repaired when it stops working, and that often means it has lost most, if not all, of its refrigerant.
Refrigerant recovery realities
Collecting refrigerant from aging equipment is not a simple matter. Under Section 608 of the Clean Air Act, “You are required to evacuate any piece of equipment that contains an ozone-depleting refrigerant before that equipment is disposed of,” according to Witman. “It doesn’t matter if it is a home air-conditioner or a supermarket refrigeration rack.” You have to account for leakage, and building owners can be fined for not complying. The refrigerant also has to be captured in the case of service calls, where repairing or removing a
part would result in a leak, such as replacing a compressor.
But do people comply? They should. Refrigerants are nearly 100% recyclable, and can be used over and over for years with little loss in performance. Because of this, there are economic and regulatory incentives for recovering refrigerant from large commercial systems, so approximately 80% of those refrigerants are captured at end of service life, according to a report from the California Air Resources Board (CARB). This refrigerant can potentially be reclaimed and recycled, depending on the type and its quality, further lowering costs and the overall carbon footprint. Glenn Rose, vice president of sales and network operations at Rapid Recovery, a national refrigerant recovery company, says recovering 500 pounds of refrigerant at a market rate of $4.80 a pound (for R-22) can more than pay for the cost of recovery.
For smaller equipment, there is little or no economic incentive to collect the amount of refrigerant in these systems. It is cheaper and easier for a service technician to simply vent the refrigerant rather than take the time to set up equipment and capture both the liquid and vapor, said Rose. In fact, if a service technician charges for new refrigerant, then recovering and reusing old refrigerant costs them money and becomes a financial disincentive.
Photo: Rapid Recovery
Improved end-of-life refrigerant recovery is key to lowering greenhouse gas emissions. These appliances are tagged, showing they have had their refrigerant removed before being salvaged.

p. 7The BuildingGreen Report • November 2017
At the end of equipment’s life, recovery can be just as much of a challenge. Scrapyards get money for steel and copper from appliances, and can stack those materials, but recovering six ounces of refrigerant from an air conditioner, storing it in a canister, and then selling it is not nearly as easy.
Accidental losses during equipment removal and transport are also common. The end result? CARB estimates that only 2% or less of refrigerant is recovered from smaller air-conditioning units—and this is in California, which has the best recovery and enforcement in the country. In the rest of the U.S. and other areas with lax enforcement, refrigerant recovery is probably far less.
Enforcement, motivation, and carbon credits
The amount of refrigerant a system is allowed to leak before requiring service under the Clean Air Act is an astounding 35% for com-mercial refrigeration and 15% for heating and cooling, well beyond the point where optimum performance is compromised. So the environmental bar is not very high, and those who release refrigerants into the atmosphere are unlikely to be caught—or punished. That’s because the EPA is in charge of enforcing the entire Clean Air Act, including refrigerant releases, but there are far too few EPA offices and staff throughout the country for effective
refrigerant enforcement. “Even when they do decide to enforce them, they go after companies that will really make an impression (such as large food warehouse chains),” Witman says. “It is very unlikely they will go after any kind of air-conditioning.”
In California, refrigerant regulations are taken more seriously under CARB’s Refrigerant Management Program (RMP), which requires
both refrigerant recovery and record keeping. California’s RMP is intended for systems using more than 50 pounds of refrigerant. But those who recover and process refrigerants also have to comply with the regulations. And this is important because these are the companies handling the refrigerants. According to Rose, you can do every part of the process (recovery and processing), but you still need to document it. And to enforce the regulations, the state inspects companies for compliance, including paperwork.
Still, Rose says, “When you look at enforcement, the spirit of the law is right but compliance is minimal.” The economic disincentives for recover-ing substances that evaporate out of site and out of mind are powerful for smaller HVAC systems. Many people who work in the industry still don’t fully understand the impact of venting high-GWP refrigerants, he says. But that is starting to change. He claims, “Just by educating people and talking with them, they will do the right thing.” He notes that some companies are now touting their refrigerant recovery as part their sustainability message.
Rose’s Rapid Recovery is one of those companies. He says he “evangelizes” about refrigerant recovery because recovery is the right thing to do. He also recognizes the need for others to make it worth their while. He claims his company uses equipment that recovers refrigerant faster than
standard systems, and provides them with support and documentation help, among other services. They also work with scrap dealers and others to educated them and increase their incentive to recover refrigerants. “We are going to go out there and make it as easy as possible for people to make the right choice, he said. “If we can save a third to a half, we’ve done a great job.”
In 2016, Rapid Recovery recovered 7 billion pounds of CO2e in refrigerants and is up to over 14 billion in 2017, and climbing.
The only way refrigerant recovery becomes viable is if there is a financial motivation, and California is using carbon credits as incentive. Under the state’s Global Warming Solutions Act of 2006 (AB32), the state created a cap-and-trade program that establishes a market for CO2e. Though cap-and-trade has its challenges, such as opposition from industry, in a system like this, high-GWP refrigerants become a potentially valuable commodity. As of September 2017, a metric ton of CO2e was worth nearly $13.00, according to the California Carbon Dashboard, and was more than $20.00/metric ton in 2011.
Regulatory ShenanigansUnder President Obama, the U.S. amended the Clean Air Act to include high-GWP HFCs. These updated requirements would have gone into effect in 2019, decreasing annual greenhouse gas emissions by an estimated 7.3 million metric tons. That’s the equivalent of annual emissions of 1.5 million cars, according to the EPA.
U.S. refrigerant manufacturers Honeywell and DuPont, as well as Daikin and others, were in favor of the new regulations, but two refrigerant manufacturers—Arkema from France and Mexichem Fluor from Mexico—sued the EPA, contending that the Clean Air Act only covered ozone- depleting chemicals. In August 2017, the courts sided with Arkema and Mexichem, throwing regulation of HFC refrigerants in the U.S. into
Photo: Rapid Recovery
Simplifying the recovery of refrigerants decreases the chance of “accidental” refrigerant releases during service calls, decommissioning, and disposal of equipment.

p. 8The BuildingGreen Report • November 2017
question. According to Witman, if the ruling stands, more than refrigerants are at risk, and the EPA’s Stratospheric Protection Division will no longer address global warming.
Low-GWP AlternativesDespite the current regulatory setback in the U.S., replacing high-GWP refrigerants with low-GWP alternatives is a key component for maximizing the environmental performance of heat pumps and other energy-saving HVAC. And there is ongoing research into replacements for high-GWP refrigerants. Phelan says that viable new refrigerants fall into two categories, HFOs and natural refrigerants, such as ammonia, CO2, and propane.
The AHRI Low-GWP Alternate Refrigerant Evaluation Program began testing these alternatives in 2011, taking into account GWP, toxicity, flammability, stability, performance, temperature changes from liquid to vapor (critical temperature), and other factors. AHRI is independent and only tests refrigerants and does not endorse one over another (refrigerants are often patented, branded, and sold at a profit), but according to Amrane, two of the most promising drop-in replacements are the low-GWP HFCs R-32 (GWP 675 ) and R-452b (GWP 676) for residential and light commercial; CO2, propane, and some HFO blends for refrigeration; and blends of HFOs for chillers.
Natural refrigerants
As mentioned, propane is an old refrigerant good for a variety of end uses if flammability concerns can be addressed, and ammonia is also useful in larger industrial and commercial applications, where toxicity can be managed. CO2 as a refrigerant has had a lot of interest because of its low toxicity, low cost, and low GWP. BuildingGreen has kept an eye on CO2-based heat pumps over the years, including a commercial system from Mayekawa and Sanden’s residential split heat-pump water heater, a 2016 BuildingGreen Top 10 product.
Systems using CO2 do not use vapor compression. They operate at high temperatures and require cooling instead of compression to change from liquid to vapor, known as a transcritical process. These systems require more robust components and piping to handle higher pressures, but they work well in cold temperatures, and they can generate much higher temperatures than standard heat pumps, so they are well suited for water heating and larger systems. Mayekawa, for instance, is used as a boiler replacement in commercial applications, and CO2 systems are being adopted for supermarket use.
John Miles, general manager at Sanden, says, “We went to CO2 in the early 2000s. We looked at the opportunity to use a natural refrigerant that wasn’t flammable or toxic.” Though Mayekawa offers heat pumps in Japan that provide cool-ing as well, CO2 is not considered an ideal refrigerant for smaller comfort cooling applications, according to Miles. “It is not very efficient at that format from a thermodynamic point of view, and certain refrigerants (such as R-410a) are really good at doing that.” Instead, Sanden’s systems are solely for heating water. But he notes, “CO2 is also good at pulling heat away from food. That’s why supermarket chains are beginning to adopt it,” he says.
Coming to appliances in the not-so-distant future
So when can we see these low-GWP refrigerants in products? You’ll have to be patient, because it is going to take some time. To achieve the right combination of performance and low GWP, “refrigerants are going to be flammable one way or the other,” Amrane says. “There is always a tradeoff.”
On the performance side, one refrigerant cannot just be substituted for another without it usually requiring changes to the equipment. Amrane says R-452b will require minimal changes to equipment, but other refrigerants, such as R-32, require higher-pressures and higher discharge temperatures, so you have to redesign the product for that refrigerant. But redesigning equipment could turn out be a positive thing. According to David Calabrese, senior vice president, government affairs at Daikin U.S., “Studies we’ve done show it (using R-32) can improve efficiency by about 10%.”
Daikin has been promoting the use of R-32 for years, and has sold millions of air-conditioning products using R-32 in Europe and Asia, he says. The company manufactures both R-32 and air-conditioning units that use
Refrigerant Application Current Refrigerant
Alternate Refrigerant
Water-Cooled Chiller R-123 R-1233zd(E) and R-514a
Air-Cooled, Evaporatively Cooled R-134a R-513A and R-1234ze
Residential/Commercial Comfort Cooling R-410a R-32, R-452b (drop-in replacement)
Commercial Refrigeration
R-404a R-407a, R-407f, R-448a, R-449a, R-449b
R-134a
R-450a, R-513a; R-744/CO2 (supermarkets and other applications);
R-290/propane (for charge limited systems as permitted by codes in
different regions)
Current Refrigerants and Low-GWP Alternatives
Source: Karim Amrane

p. 9The BuildingGreen Report • November 2017
it, but Daikin has released its patents on equipment to encourage wider adoption of the refrigerant.
Both R-32 and R452b are considered mildly flammable, and that is a problem. Refrigerants are classified based on flammability, from A1 being least flammable to A3 being most flammable (toxicity is rated B1–B3). Most new refrigerants are classified as mildly flammable at class A2 (the exception is Honeywell’s HFO R1233zd). The most viable low-GWP alternatives, such as R-32 and R-452b, are classified at the even less flammable A2L classification. Getting the lowest flammability and best performance out of these refrigerants is critical for making the transition away from high-GWP options.
Safety is a major concern with refrigerants, and flammability standards are written into codes. ASHRAE 15 limits the use of A2 (HFOs) and A3 refrigerants. “That is what is holding up manufacturers,” says Amrane. For highly flammable refrigerants like propane, there are also restrictions on how much you can use, limiting their availability for larger applications.
According to Amrane, ASHRAE is catching up, and has two addenda out for review that would allow the use of these class A2L refrigerants. The IEC is planning to increase the amount of propane allowed in refrigeration systems from 150 to 500 grams. And the International Code Council will likely adopt the requirements in
ASHRAE 15 when finalized.
It takes time for reg-ulations to be ap-proved, adopted, and implemented, and equipment manufactur-ers are waiting to see how it shakes out. Once approved, they have to optimize equipment to take advantage of the new refrigerants. And then testing and UL ap-proval will be required for some products. It is
going to take some time, and Amrane does not expect to see widespread use of new refrigerants for a few years. Of course, early adopters can petition local officials to use new equipment if they can find it and install it safely. When new products do come out, they will likely be far more advanced and efficient than today’s products, further reducing the overall environmental impact of these systems.
In the MeantimeWhile we wait for technology and codes to catch up, there are a number of common-sense steps that can be taken to lower the GWP of current comfort cooling products. Reducing the cooling load and working with mechanical engineers to “right-size” HVAC systems is critical. John Weale, Engineer Fellow at Integral Group, reaffirms that power consumption is the primary engine of carbon emissions. He recommends the usual steps. “If you use smaller windows and less glass and use more insulation, you can install less refrigerant of any type. Once we get the system size reduced as much as possible, we go for the most efficient unit,” Weale says.
Weale acknowledges that HVAC is a challenging field for design teams and engineers. There are only a few options for equipment and refrigerants. And “there is no monetary assessment to get global warming potential down,” he says. “Efficiency is what shows up in the
monthly pocketbook and reaches beyond preaching to the choir.”
Zuluaga also focuses on efficiency and reducing indirect impacts. To bring the overall GWP down, he recommends addressing both energy efficiency and behavioral opportunities. “While more data is needed on the actual field leakage of heat pump systems,” he says, “there are some practical things we can do now to minimize impacts, such as proper system commissioning and retro-commissioning. And where possible, packaged equipment that has fewer field joints and less refrigerants per ton should be evaluated.”
Finally, in water heating applications, Zuluaga says that heat pumps utilizing CO2 as a refrigerant are particularly promising from build-ing performance and emissions standpoints.
Reaching the goals set forth in Drawdown will require a larger commitment:
1. Strengthen national regulations to include HFCs.
2. Reduce leaks through improved equipment, monitoring, better fittings that can be used with flammable refrigerants, commissioning, and training.
3. Focus on end-of-life refrigerant management, potentially charging end users for refrigerant management costs up front so there is less incentive to ignore regulations.
4. Use reclaimed HFCs to encourage reclamation and recycling.
5. Select future low-GWP refrigerants based on system efficiency and impacts.
6. Promote education and training programs to improve compliance with regulation.
7. Work with regulators to enforce those regulations.
Photo: Daikin Industries
Millions of air-source heat pumps using the low-GWP refrigerant R-32 have been sold in Europe and Asia, and have been operating safely for years. The use of R-32 is not allowed in the U.S. due to flammability concerns.

p. 10The BuildingGreen Report • November 2017
NEWS ANALYSIS
Energy Use, Carbon Emissions Down in NYC Buildings New York’s benchmarking law has created a treasure trove of data on energy and water use in large buildings. Researchers are unpacking it and discovering noteworthy trends.
by Nadav Malin
Surprisingly few people realize that they can look up the actual energy use of almost any large building in New York City, but it’s true. The City’s Local Law 84 has required owners of buildings over 50,000 square feet to report on their energy use since 2010. It has expanded the program in various ways since then, and it makes all the data available in a slick online tool. For those who want to do their own number-crunching, the City also posts all the data in spreadsheets.
Using these data, individuals can check up on the buildings where they live and work, designers can see how their buildings are actually performing, and real estate professionals can check on properties they’re interested in buying or leasing. The most active users of these data are policy-makers however, such as those responsible for implementing the City’s “80 x 50” goal of reducing greenhouse gas emissions 80% by 2050.
Urban Green Council released a detailed report in October analyzing the data of actual energy use through 2015. “New York City’s Energy and Water Use 2014 and 2015 Report” was produced by Urban Green with the Mayor’s Office of Sustainability and New York University’s Center for Urban Science and Progress (NYU CUSP).
The data set has grown dramatically over the years: it began with municipal buildings, then expanded to private-sector buildings bigger than 50,000 square feet. Along the
way, water data was added. The number of buildings reporting has also increased; compliance rates for 2015 data reporting exceeded 90% for the first time, thanks in part to technical support available to owners via a City-funded Benchmarking Help Center.
More data to come
Starting with 2017 data (which will be reported in 2018), the number of buildings that are required to report will grow dramatically, as the size threshold drops to 25,000 square feet. With that expansion, the data from private-sector and municipal buildings combined will cover an impressive 60% of NYC’s total square footage.
The data don’t become available to the public in real time. Data from 2016 haven’t been posted yet, and the new report only covers actual energy and water use through 2015.
Deeper, not just broader
For the new report, the research team combined, for the first time, data from municipally-owned buildings with those from the private sector. They also integrated a new data stream from energy audits that the city of New York began mandating in 2013 on a rolling basis. (Local Law 87 requires 10% of benchmarked buildings to complete audits each year.) These audit data allowed them to explore not only how much energy the buildings are using but also how they’re using it.
Here are a few highlights:
• Surprising: Buildings with window air conditioners and other distributed cooling systems use almost 30% less energy for cooling than those with central systems such as chillers and cooling towers. This flies in the face of conventional wisdom that central systems are much more efficient than distributed systems, and highlights the importance of occupant behavior.
• Unsurprising: When tenants don’t pay their own electric bills,
electricity use is about 20% higher than when they do.
• Encouraging: Source energy use—including the energy used to generate and deliver the “site” energy used in the buildings—has declined by 10% over the six years. This figure is “weather- normalized,” or adjusted for changes in weather patterns. (Site energy use was down 7% in 2012, but then bounced back up in 2013, and leveled off to a 4.8% reduction from 2010 by 2015.)
• Even more encouraging: Estimated carbon emissions have declined even more, or 14% of 2010 emissions, putting the building sector on track with its contribution to the 80 x 50 goal. This reduction exceeds the drop in energy use thanks to the phase-out of inefficient bunker fuel for heating, increased efficiency of distributed steam, and a shift to natural gas. (This figure may be
Charts: New York City’s Energy and Water Use 2014 and 2015 Report
Water use in residential buildings (blue line in the upper chart) has been relatively stable since 2012. In office buildings on the other hand (green line), water use is driven by cooling towers so it fluctuates with the demand for cooling, as seen in the lower chart.

p. 11The BuildingGreen Report • November 2017
overly optimistic, given recent data showing that leaks from gas wells and distribution make carbon- equivalent performance much worse than is typically assumed, but the report doesn’t get into that.)
As is so often the case, the more we learn, the more there is to learn! But this new report gives us plenty to chew on as we unpack the important role of the building sector in achieving carbon emissions targets.
More on energy benchmarking
Energy Reporting: It’s the Law
New Energy Data Is Changing How We Judge Efficiency—and LEED
Benchmarking Savings Add Up Quickly, Says EPA
For more information
Urban Green Council www.urbangreencouncil.org
The report: http://urbangreencouncil.org/content/projects/new-york-city-energy-and-water-use-2017-report
Housing and Transit: A Match Made in Carbon Cutting Heaven California’s cap-and-trade program funds affordable housing that helps residents get where they need to go without getting in a car.
by Nancy Eve Cohen
California has just announced a third round of funding, of $255 million, for a program that tackles two critical situations at once: the state’s affordable housing crisis and the dangers of global warming. The funding comes from the state’s carbon cap-and-trade auction revenues.
Affordable housing developers are used to thinking about energy efficiency and renewable energy as ways to reduce housing costs and reliance on fossil fuels, but the
California funding program puts transportation and cutting greenhouse gas emissions at the top of the list.
California’s Affordable Housing Sustainable Communities Program (AHSC) funds affordable, multi-family housing that is built in locations where there is some existing transit service—and which augments it by paying for improvements, such as bike lanes, sidewalks, or bus service. It won’t pay for the bus driver, but it could pay for a bus.
“We often joke this program is an arranged marriage of the housing and transportation worlds,” said Monica Palmeira, the outreach coordinator of the California Strategic Growth Council, which administers AHSC.
Housing that reduces the use of cars
The idea is to cut greenhouse gas emissions—the primary goal of the cap-and-trade program —by reducing the number of miles residents travel in cars. It is based on the idea that there is more to a sustainable community than just housing. “We fund big affordable housing projects near BART
[public transit] stations in the Bay area,” said Palmeira, who points out the state is flexible in its definition of transportation, “but we also fund housing developments in farm worker communities that incorporate a van pool service.”
Providing myriad transportation options makes it less costly for those from low- and middle-income house-holds to travel to jobs, schools, and medical services.
The most competitive projects have a combination of affordable housing and transportation components.
It wasn’t love at first sight
At first there was skepticism from both sides. “All the housing people were like, ‘Why are you making us do transportation? What is greenhouse gas reduction?’” said Palmeira. And transit agencies also didn’t understand. Palmeira recalls transportation officials asking, “Why do you want to buy me a bus?”
Proposals can include things that make getting around without a car more enjoyable, such as planting street trees or building a bus stop. It also
Photo: For Jamboree by juantallo.com
West Gateway Place in West Sacramento, California, is the first affordable housing project built using funding from California’s carbon cap-and-trade program. It has 77 units, nearly one mile of sidewalks, seven crosswalks, and new bikeways. It was co-developed by West Sacramento Housing Development Corporation and Jamboree.

p. 12The BuildingGreen Report • November 2017
pays for educational programs that encourage a shift away from cars, like bike safety classes or organizing a walking school bus.
Addressing global warming and the high cost of housing
All applicants must submit data on the amount of greenhouse gases that would be avoided as a result of their proposal for transit- oriented development. The California Air Resources Board (CARB) developed tools for estimating greenhouse gas emission reductions—and for tracking reductions after a project is funded.
California’s carbon cap-and-trade auction program, which allots 18% of its revenues to AHSC, is the largest in the country. So far, the legislature has appropriated $3.4 billion raised at the carbon auctions for Climate Investments programs, including AHSC.
Along with affordable housing, California invests cap-and-trade revenues in other programs that reduce carbon emissions such as the Low-Income Weatherization Program (LIWP) which installs solar photo-voltaics (PV), solar hot water heaters,
and other energy saving measures in low-income housing.
Besides reducing greenhouse gas emissions, the AHSC program is also driven by the skyrocketing cost of housing in a state where the median cost of a new home is twice the cost nationally. The expensive housing market means more people are home-less in California than in any other state.
In communities that already have strong transit infrastructure in place, the program requires the addition of affordable housing.
Since 2014, AHSC has awarded more than $411 million to 53 projects that include 4,129 units of affordable housing. The funding is typically a small, but critical, piece of the entire funding package for an affordable housing project.
So far, one project that has received cap-and-trade funds has been completed: West Gateway Place, 76 affordable units in West Sacramento. “People who live there, who work downtown, can jump on transit or ride their bikes or walk across the Tower Bridge,” said Craig Shields, the section chief for AHSC at California’s
Department of Housing and Community Development. According to the state, this project has avoided more than 29,000 metric tons of green-house gas emissions. To put that in context, California companies have to comply with the cap-and-trade program if they emit more than 25,000 metric tons of carbon per year.
Highly competitive
Getting the funding isn’t easy. For example, 135 projects applied in the 2015–2016 round of applications, but only 25 were awarded funding.
In order to qualify, a housing project must set aside at least 20% of the residential units as affordable. But the state incentivizes projects to have a much larger percentage of affordable units.
Projects also have a greater chance of receiving funding if they go beyond state mandatory green building requirements by using LEED, Energy Star, and other green building programs. They’ll also have a better chance if a third of the building’s energy is generated from renewables or if it is a net-zero-energy project.
The funding pays for new affordable housing, acquiring and rehabbing existing housing, or converting an existing structure into housing. The affordable projects must be located near places that are important to residents, such as a school, medical clinic, or grocery store. “If there’s a licensed childcare a couple of blocks away, but there’s no sidewalk, the program would fund a new side-walk to get to that facility,” explained Shields.
The tale of one city, one developer, and 135 affordable apartments
The North San Pedro Apartments in San Jose, one of the successful proposals in the last round of funding, will serve formerly homeless veterans, people with disabilities, and others eligible for affordable housing. “They simply could not afford to live in San Jose without this,” said Geoffrey Morgan, president and CEO of First
Image: OJK Architecture
The North San Pedro Apartments has received $13 million in funding from California’s Affordable Housing and Sustainable Communities program. Besides 135 units of housing for formerly homeless veterans and people with disabilities, it includes free bus and train passes, and curb cuts to make it easier for people in wheelchairs to access the nearby train station.

p. 13The BuildingGreen Report • November 2017
Community Housing, the nonprofit developing North San Pedro. “Many of the folks will literally be pulled right off the streets.”
First Community Housing partnered with the City of San Jose on the project. The $13 million in funding helps pay for 135 units of new housing, as well as free access to buses and the city’s light rail system, along with new curb cuts to give people who get around in wheelchairs easier access to the train station. “This kind of thing keeps them independent,” said Morgan.
Getting funding for affordable housing is not new for First Community Housing. But this project was different. Instead of focusing on how many units can be built at the lowest cost, now “we’re thinking about how the greenhouse gases are going to be reduced,” said Morgan.
The San Jose project, which is designed to be certified as LEED Platinum, will be built in a former industrial area where market-rate housing is also being developed. The funding from cap-and-trade revenues will improve a long “linear” park on a former road to “create a walk space that’s going to make it easier for pedestrians to move through what used to be a very industrial, auto- oriented place,” said Morgan.
Morgan said the funding application is the most complex the nonprofit has ever submitted, but well worth it. “It was the best example of community development we have ever done,” he said. “We’ve never had the opportunity to go to a city and say, look, we can get you money to make the improvements you’ve always wanted to make this neighborhood more transit oriented. And they got excited about it, but it also involved some risks.” He means legal risks. First Community Housing and the City of San Jose are jointly liable for completing the improvements they’ve proposed.
Joint liability; one of the challenges
Palmeira from California’s Strategic Growth Council says the fear of joint liability is one of the biggest hurdles the state has had to overcome. Many applicants have been wary of it. She says the challenge has been to find that “sweet spot on the legal side of insuring the project is completed in its entirety,” without scaring joint applicants away.
“We don’t achieve our greenhouse gas reduction goals without all those components,” Palmeira said, “and we have to hold everybody liable to that.”
In the latest round of funding, the new guidelines provide some flexibility on legal arrangements. Although applicants are held jointly liable, they can also indemnify each other and enter into agreements specifying which aspect of a project each is liable for.
Despite the challenges, these collaborations can bring positive change. Morgan of First Community Housing said partnering with the City of San Jose meant building a new level of trust. “This is an opportunity to not only make it much better for our residents by improving the outside area, but make it better for the whole community.”
For more information
California Climate Investments http://www.caclimateinvestments.ca.gov/
Affordable Housing and Sustainable Communities Program (AHSC) http://www.hcd.ca.gov/grants-funding/active-funding/ahsc.shtml
California Department of Housing and Community Development http://www.hcd.ca.gov/
Affordable Housing and Sustainable Communities Program Guidelines http://sgc.ca.gov/Grant-Programs/AHSCResources/AHSC16-17GuidelinesPost-Errata.pdf
California Strategic Growth Council http://www.sgc.ca.gov/
California Air Resources Board https://ww2.arb.ca.gov/
First Community Housing http://www.firsthousing.com/
The U.S. Department of Housing and Urban Development: The 2016 Annual Homeless Assessment Report to Congress https://www.hudexchange.info/resources/documents/2016-AHAR-Part-1.pdf
Mogavero Architects, designer of West Gateway Place in West Sacramento http://mogaveroarchitects.com/west-gateway-place-featured-success-cap-trade-housing-funds-video/
Certified “Green” Parking; on the Road to Sustainable Mobility Parksmart recognizes facilities that not only reduce their impact but support a transition to sustainable forms of transportation.
by James Wilson
Green parking? Isn’t that an oxymoron? What would make a parking garage sustainable? The Parksmart rating system seeks to answer these questions by describing the industry’s most advanced strategies for reducing environmental impact and supporting adoption of more sustainable modes of transport. So far, nearly 80 projects in 19 states and 5 countries have either registered for or earned the certification.
The idea of sustainable parking has generally been criticized by green building professionals as a contradiction in terms. That’s because parking garages are designed for single occupancy vehicles, which significantly contribute to greenhouse gas emissions. Even so, the sustainable design industry has largely neglected parking garages. Most green building

p. 14The BuildingGreen Report • November 2017
rating systems, like LEED, don’t apply to them.
However, worldwide trends indicate that the ownership and use of automobiles continue to rise. While there may be significant efforts in many parts of the developed world to move away from cars, for the foreseeable future they will continue to be a big part of the picture, especially in rapidly developing regions.
Initiatives like Parksmart promote the idea that parking structures could be used to help facilitate the transition towards more sustainable forms of mobility. Paul Wessel, director of market development at the U.S. Green Building Council (USGBC), told BuildingGreen that the goal of Parksmart is to “reposition parking as part of the solution, rather than the poster child for the problem.”
How to be smart about parking
Originally known as Green Garage Certification before being acquired from the US Green Parking Council by Green Business Certification, Inc. (GBCI), Parksmart recognizes new and existing projects that mitigate the negative effects of their construction and operation while also including features that encourage and support progressive practices like car- sharing, car-pooling, and the use of electric vehicles.
Projects earn points toward certification by implementing up to 48 measures in three categories: Construction, Management, and Programs. Measures in the Construction and Management
categories are similar to credits in the LEED rating systems, and are intended to increase energy and water efficiency and reduce material use and waste. (See GBCI’s Parksmart and LEED Synergies guidance document outlining the LEED credits that project teams can also apply toward Parksmart certification.) The Programs category includes features that expand the use of the facility, like the Placemaking measure, and that promote more sustainable forms of mobility, like the Access to Mass Transit and Bicycle Sharing/Rental measures.
These measures were developed with the help of a wide range of experts. For example, life-cycle analysis experts suggested a particular approach that could be taken in evaluating parking structures, and a number of bicycle consultants shared information about how a parking structure could encourage bicycle use by connecting to
bike routes and providing features like secure bike parking.
The development team also looked to high performers in the industry to determine which practices should be integrated into the Parksmart criteria. This process highlighted the fact that not all parking structures are exactly alike in the accommodations they provide. Wessel explains that, “Nobody is doing all the 48 things that are measures of the best practices in Parksmart because they don’t apply to every single structure in every single situation.” For example, the needs of a hospital parking structure are different from the needs of an office parking structure, which are different from that of a parking facility at an airport.
Committing to improvement
One of the industry’s longtime high performers is the Garage at Post Office Square in Boston, which has been certified as a “Parksmart Pioneer”—the certification type for existing projects. The 26-year-old underground facility is covered by a 1.7-acre public park and includes, among other features, a program to capture and use rainwater runoff, an energy-efficient lighting system, and an electric vehicle charging station. The garage also recently entered into a solar power purchase agreement with MIT and Boston Medical Center to offset 100% of its energy use.
Pam Messenger, general manager at the Post Office Square facility for the past ten years, told BuildingGreen that sustainability has always been a part of her agenda, even before a formal certification like Parksmart existed. She’s worked continuously to improve the performance of her facility both because she believes it’s the right thing to do, but also because it just makes sense from an economic perspective. “If I were operating any kind of a real estate facility I would have done what I did here,” she says, noting that it’s about reducing both impact and operating costs.
Messenger says that a commitment to making improvements is essential and she doubts very many will pursue
Top photo: U.S. Green Building Council; Bottom photo: Pam Messenger
The Garage at Post Office Square in Boston is situated below the Norman B. Leventhal Park. The facility includes an energy-efficient lighting system and variable drive fans for ventilation. Clear navigational signage facilitates rapid entry and exit, and reduces traffic congestion and idling time.

p. 15The BuildingGreen Report • November 2017
Parksmart certification simply for the recognition. “I honestly don’t think it’s going to work unless there is already a mindset amongst the building owner or asset manager to put some money into a different way of operating,” she says.
But Messenger sees value in the way the program promotes the sharing of knowledge about best practices. It’s important to her that her facility demonstrates to others that it’s possible to be more sustainable. “I’m constantly cheerleading for this stuff and I’m hoping that one or two people I meet a year will come around and say, ‘Well I know the ROI (return on investment) isn’t really there but they did it, maybe I can figure out a way to do it,’” she says.
How to remain competitive in a rapidly changing world
For the rest of the industry, the Parksmart standard can be used as a tool for remaining competitive as advances in technology and shifts in culture change mobility practices.
Wessel explained that the design and management of parking structures is rapidly evolving. He likens the way advanced parking facilities operate to the way a smart phone works. “It’s becoming a platform for different ways of providing people access—whether you’re a football stadium or shopping mall or office building. And
one of the values of Parksmart for parking asset owners is it helps them stay at the front edge of where that evolution is going,” he said. More than a certification standard, Parksmart is meant to serve as a framework to help projects keep track of and evaluate the changes happening in the industry.
Wessel went on to say that, in this way, the program also addresses economic sustainability. “It’s my sense that
while parking is often a major revenue source for commercial office buildings and airports, that the people who are managing those facilities just don’t know that much about what those changes are and what are good ways to embrace those changes that help build their triple bottom line value for their organizations,” he said.
He said that Parksmart, by bringing parking facilities fully into the sustainable design discussion, demonstrates that they, too, can contribute to a more sustainable world. Messenger agrees. “We’re a parking garage, that’s where we make our money, but that doesn’t mean we’re exempt from caring about trying to make our property’s footprint as small as possible,” she says. And as Wessel puts it, “Frankly, if you can do it in the parking industry you can do it anywhere.”
For more information
Green Business Certification, Inc. (GBCI) parksmart.gbci.org
California Law Uses Environmental Product Declarations to Drive Low-Carbon Procurement Buy Clean California is the first law in the nation to address embodied carbon in construction materials.
by Nadav Malin
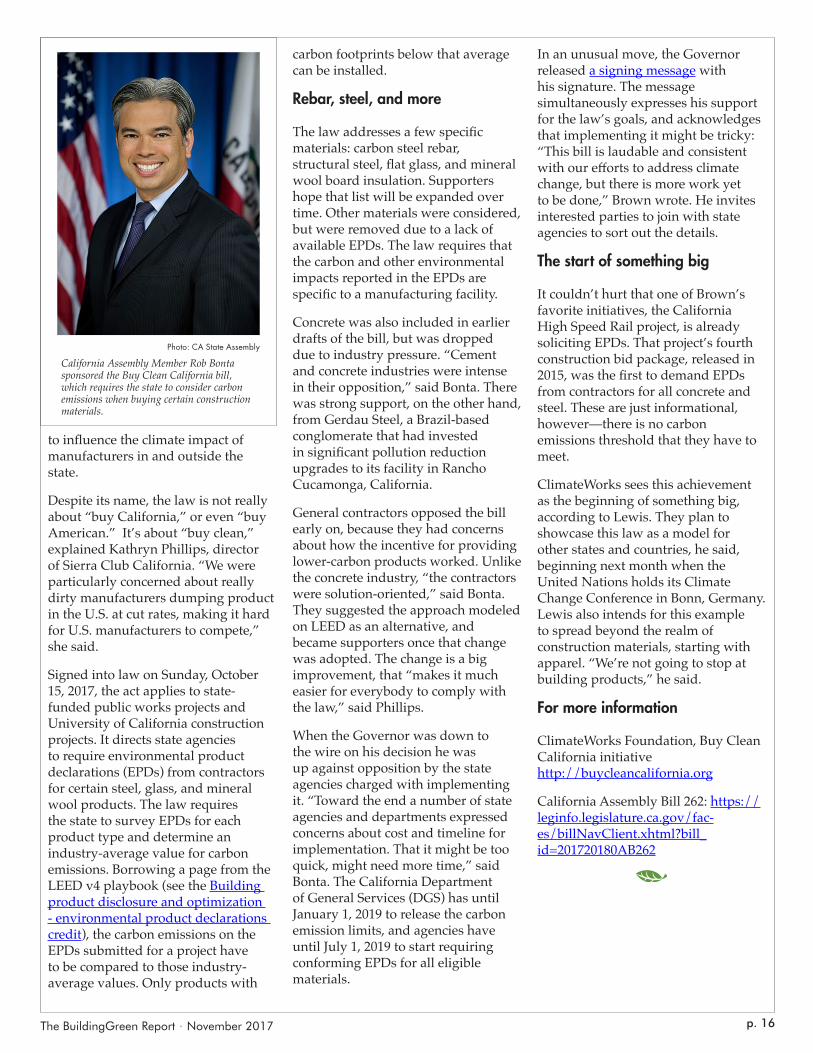
“The Governor made us wait,” said California Assembly Member Rob Bonta about the Buy Clean California bill that he had sponsored.
Governor Jerry Brown had until midnight on Sunday to sign or veto the bill. “It was touch-and-go until the very end, given some of the governor’s office’s concerns,” Bonta reports. He was on a plane returning home from visiting his daughter on the east coast when the good news finally arrived in the form of a group text from his staff: AB 262 signed!!
“I congratulated my team,” Bonta said. “This was not an easy lift at all.”
Addressing the carbon loophole
Buy Clean California seeks to address the “carbon loophole” that happens when manufacturing gets outsourced from a place with strict pollution controls to a more lax jurisdiction. California’s rules don’t do much good if California-based suppliers are underbid by more polluting manufacturers located elsewhere, be it in Arizona, or in China. “Between 20 and 25 percent of all carbon emissions are embedded in products that are bound for export,” explained Matthew Lewis, a consultant to ClimateWorks Foundation, which spearheaded the bill.
A broad-based coalition of environmental, labor, and manufacturing groups championed the legislation, including the BlueGreen Alliance, Sierra Club California, and labor unions. They saw California’s $10 billion annual expenditures on infrastructure and public facilities as an opportunity
Graphic: Courtesy of Cal Poly Pomona
Cal Poly Pomona’s “Parking Structure 2” has earned a Bronze Parksmart certification. The $41-million facility includes solar panels that generate an estimated 8% of the campus’s electricity.
p. 16The BuildingGreen Report • November 2017
to influence the climate impact of manufacturers in and outside the state.
Despite its name, the law is not really about “buy California,” or even “buy American.” It’s about “buy clean,” explained Kathryn Phillips, director of Sierra Club California. “We were particularly concerned about really dirty manufacturers dumping product in the U.S. at cut rates, making it hard for U.S. manufacturers to compete,” she said.
Signed into law on Sunday, October 15, 2017, the act applies to state- funded public works projects and University of California construction projects. It directs state agencies to require environmental product declarations (EPDs) from contractors for certain steel, glass, and mineral wool products. The law requires the state to survey EPDs for each product type and determine an industry- average value for carbon emissions. Borrowing a page from the LEED v4 playbook (see the Building product disclosure and optimization - environmental product declarations credit), the carbon emissions on the EPDs submitted for a project have to be compared to those industry- average values. Only products with
carbon footprints below that average can be installed.
Rebar, steel, and more
The law addresses a few specific materials: carbon steel rebar, structural steel, flat glass, and mineral wool board insulation. Supporters hope that list will be expanded over time. Other materials were considered, but were removed due to a lack of available EPDs. The law requires that the carbon and other environmental impacts reported in the EPDs are specific to a manufacturing facility.
Concrete was also included in earlier drafts of the bill, but was dropped due to industry pressure. “Cement and concrete industries were intense in their opposition,” said Bonta. There was strong support, on the other hand, from Gerdau Steel, a Brazil-based conglomerate that had invested in significant pollution reduction upgrades to its facility in Rancho Cucamonga, California.
General contractors opposed the bill early on, because they had concerns about how the incentive for providing lower-carbon products worked. Unlike the concrete industry, “the contractors were solution-oriented,” said Bonta. They suggested the approach modeled on LEED as an alternative, and became supporters once that change was adopted. The change is a big improvement, that “makes it much easier for everybody to comply with the law,” said Phillips.
When the Governor was down to the wire on his decision he was up against opposition by the state agencies charged with implementing it. “Toward the end a number of state agencies and departments expressed concerns about cost and timeline for implementation. That it might be too quick, might need more time,” said Bonta. The California Department of General Services (DGS) has until January 1, 2019 to release the carbon emission limits, and agencies have until July 1, 2019 to start requiring conforming EPDs for all eligible materials.
In an unusual move, the Governor released a signing message with his signature. The message simultaneously expresses his support for the law’s goals, and acknowledges that implementing it might be tricky: “This bill is laudable and consistent with our efforts to address climate change, but there is more work yet to be done,” Brown wrote. He invites interested parties to join with state agencies to sort out the details.
The start of something big
It couldn’t hurt that one of Brown’s favorite initiatives, the California High Speed Rail project, is already soliciting EPDs. That project’s fourth construction bid package, released in 2015, was the first to demand EPDs from contractors for all concrete and steel. These are just informational, however—there is no carbon emissions threshold that they have to meet.
ClimateWorks sees this achievement as the beginning of something big, according to Lewis. They plan to showcase this law as a model for other states and countries, he said, beginning next month when the United Nations holds its Climate Change Conference in Bonn, Germany. Lewis also intends for this example to spread beyond the realm of construction materials, starting with apparel. “We’re not going to stop at building products,” he said.
For more information
ClimateWorks Foundation, Buy Clean California initiative http://buycleancalifornia.org
California Assembly Bill 262: https://leginfo.legislature.ca.gov/fac-es/billNavClient.xhtml?bill_id=201720180AB262
Photo: CA State Assembly
California Assembly Member Rob Bonta sponsored the Buy Clean California bill, which requires the state to consider carbon emissions when buying certain construction materials.

p. 17The BuildingGreen Report • November 2017
NEWSBRIEFS
When Health and Real Estate Come TogetherFitwel and GRESB are partnering to make health part of investment decisions.
by Nancy Eve Cohen
It isn’t easy fitting fitness and healthy habits into a busy workday.
But now two groups are working together to encourage investment in commercial building design and operations that make it easier for employees to adopt healthy habits such as walking more, sitting less, and eating fresh food.
The Center for Active Design (CfAD), which operates Fitwel, and the Global Real Estate Sustainability Benchmark (GRESB) have formed a partnership to help commercial real estate investors efficiently assess the health- promoting aspects of a real estate portfolio. The goal is to optimize design and operational strategies in commercial real estate so that people who work in these buildings are likely to engage in activities that promote physical and mental health.
GRESB is also working closely with Delos, creator and leading consultant for WELL Building certification, which competes with Fitwel in some applications. WELL certification is also
linked to the Health and Well-being module in GRESB.
Making health a priority in real estate portfolios
GRESB assesses real estate portfolios based on their environmental, social, and governance (ESG) performance. Institutional investors use GRESB’s benchmark analyses to compare the environmental impacts of investments. For example, GRESB helps investors analyze greenhouse gas emissions, energy consumption, and energy use intensities. Now GRESB is working with CfAD to help participants improve their ESG performance within the Health and Well-being module.
“We are very happy to be partnering up with Center for Active Design, who has initiated Fitwel, because we do believe that health and well- being is something that more and more investors care about, and, more predominantly tenants care about and employers care about,” said Roxana Isaiu, director of ESG and real estate at GRESB.
Buildings that nudge us to adopt healthier habits
CfAD certifies buildings under Fitwel that encourage healthier activities such as using the stairs rather than an elevator, taking public transportation instead of driving, and spending time outside.
Fitwel was created by the U.S. Centers for Disease Control and Prevention (CDC) and the General Services Administration (GSA). It promotes design strategies that are based on evidence-based public health research. Since CfAD took over the operation of Fitwel, more than 600 commercial projects have committed to earning certification.
Through its work with GRESB, Fitwel will help companies make health a priority in their portfolios. An investor can use Fitwel’s online tools to benchmark and certify their portfolio of buildings and use that to comply with the GRESB rating system. “Compliance with Fitwel across your portfolio can be recognized as a way to comply with the GRESB rating,” said Joanna Frank, president and CEO of the Center for Active Design. According to GRESB, the reporting burden on asset owners and fund managers should be reduced as a result of this partnership.
For more information
Fitwel https://fitwel.org/
Center for Active Design https://centerforactivedesign.org/
Global Real Estate Sustainability Benchmark https://gresb.com/
Green Building Remains Strong in Commercial SectorA recent survey indicates that, though the value of sustainability is widely recognized in corporate real estate, many cite cost as the primary obstacle.
by James Wilson
Findings from a recent survey of corporate real estate and facilities management professionals show that sustainable building practices are firmly established in the industry, with none considering it a fad.
The survey, administered annually by Structure Tone, a construction management firm, aims to identify and track trends in sustainable building.
Jennifer Taranto, director of sustainability at Structure Tone said the firm wanted to assess green building trends in the construction industry. “There weren’t any good
Photo: Kilroy Realty Corporation
The outdoor plaza at 100 First Street in San Francisco. This is a Kilroy Realty building which was awarded a Fitwel 2 Star Rating. Kilroy Realty is a Fitwel Champion and also the 2017 North American office leader in sustainability recognized by GRESB.

p. 18The BuildingGreen Report • November 2017
metrics out there,” Taranto told BuildingGreen. She added that 37% of her company’s annual revenue is from projects that are registered for a third-party sustainability certification, but even internally there wasn’t the realization that such a large percentage of revenue came from sustainable projects. “So we owed it to ourselves to try to figure out what our clients were going to be asking for,” she said.
Wellness up, resilience down
Eighty percent of respondents agreed that employee wellness is an essential part of their companies’ retention and recruitment programs, and more than half of the respondents report plans to consult with external experts to incorporate wellness features into their buildings. A quarter of the respondents also report a goal of doing a WELL-certified project in the coming year.
The findings also show that a growing number of companies see LEED certification as a preferred tool for pursuing sustainable building goals, with 62% of respondents—a 9% increase from the previous year—considering it a valuable market differentiator.
In fact, Taranto says that one of the most interesting things the survey results reveal relates to what their clients think about LEED v4. “It’s like they’re falling in love with LEED all over again now that it’s become more challenging,” she says. “We saw a lot of our clients walk away from
LEED when it wasn’t getting projects beyond code and it wasn’t pushing the envelope.”
But although the findings show the private sector has a growing interest in wellness and green building goals associated with LEED, they also indicate a declining interest in incorporating resilience measures. Seventeen percent fewer respondents report plans to seek resilient design expertise on projects. (It should be noted that the survey was completed before this year’s unprecedented hurricane season began.)
The report also asked about barriers to green building goals. The number-one issue? Cost.
For more information
Structure Tone structuretone.com/green-building-survey
California Law Closes Carpet Recycling Loophole, But Problems RemainThe new law no longer allows incineration, but health advocates say the carpet industry needs radical change before recycling can work.
by Paula Melton
The Healthy Building Network (HBN) contends in a new report that most of today’s carpet is not only difficult to recycle but also too toxic to keep around. HBN released the report just days after California approved new legislation that encourages a significant jump in carpet recycling rates.
The law requires manufacturers, by 2020, to take back and recycle 24% of carpet. It also closes a loophole in an earlier law that allowed incineration to count as landfill diversion. Good, right?
Not so fast, says HBN. In the report, Eliminating Toxics in Carpet: Lessons for the Future of Recycling, the advocacy
group offers alternatives for the industry to consider.
Carpet is a complex product whose basic components are contaminated with adhesives, plasticizers, and other substances that make it hard to recycle. Some chemicals do not hinder recycling, but they can pose other problems. For example, the report says, surface treatments like fluorinated stain repellants don’t make it difficult to melt down and reuse parts of the carpet. But exposure to these hazardous chemicals can occur during recycling (for workers in recycling factories) and after (for building occupants where the recycled-content carpet is installed).
In order to start treating waste carpet responsibly, according to the report authors, the industry needs to redesign both the recycling process and the manufacture of new carpet. The report identifies 44 toxic compounds that HBN believes should be permanently removed from carpet products. These include backing materials, antimicrobials, fillers, stain repellants, flame retardants, and more.
The carpet industry “was one of the first to address emerging concerns” about toxic chemicals in building products, said Tom Lent, policy director at HBN, in a webinar announcing the report’s release. These were primarily VOCs commonly used in carpet manufacture through the 1990s and 2000s. But “that’s just one pathway of exposure of many that can impact human health,” Lent continued. He pointed out that leading manufacturers are already moving away from other chemicals of concern,
Image: Structure Tone
Structure Tone, a construction management company, surveys its clients each year to understand how goals and priorities in the green building industry are changing.
Image: Healthy Building Network
A new report contends that carpet recycling is more complicated than it should be due to toxic chemicals in these products.

p. 19The BuildingGreen Report • November 2017
such as stain-resistance treatments, fly ash, and toxic plasticizers—proving that it’s possible.
In addition to changes in the design of new carpet, the report encourages increased ingredient transparency, better screening for toxic chemicals during recycling, and consumer advocacy for cleaner chemistries in carpets.
Learn more about carpets and toxicity
The Chemicals on Our Carpets and Textiles
Carpets with No Added Stain or Dirt Repellants?
Recycled Content in Carpet Pads Brings Hazardous Chemicals
For more information
Healthy Building Network healthybuilding.net
PRODUCT REVIEW
An Adjustable Desk That Stands Up for the EnvironmentThe Float table features seamless sit/stand performance and comes with a unique sustainability profile.
by Paula Melton
There’s growing evidence that sitting all day is bad for you. Yet standing too long can cause fatigue, pain, and other problems—which is why adjustable “sit/stand” desks are becoming more popular in office environments. Furniture manufacturers seem to constantly come out with new designs meant to help users shift positions with ease.
One such design, the Float table by Humanscale, has been around for years. But it’s getting a lot of new attention and interest in the sustainable design community due to
its recent Living Product Challenge certification.
How Float rises above the rest
“We have been using them in our office for at least three years,” said Amy Running, associate principal, interior design at Bora Architects. She has also specified Float tables for projects, particularly in educational settings.There are many ways to adjust the height of most sit/stand desks, the most common being crank handles and electric motors. There are also desktop systems that use levers and springs to lift and lower part of the workstation. But Float has unusual technology: a system of interior counterweights that allows for a smooth, seamless transition from one height to another.
A big selling point for Running is the desk’s quiet transitions. “We work in a very open and collaborative office,” she told BuildingGreen, so motorized desks were out of the question. “It
really is intrusive in our workspace. There is also limited power access.” Other points in Float’s favor: the stability of the base and the fact that the entire work surface moves at once.
The only problem Running has experienced with the desk arises from the fact that the Float tables are in rotation around the office, with different users taking turns. Because it is a counterbalance system, tensioning is required. “We have learned that adjusting the tension for the person and what they actually have on their desk is really important. It’s gotten stuck in the ‘up’ position because there was not enough weight on it.” This is less likely to be an issue, she noted, for users who don’t pass the desks around the office.
The price tag can also be a bit of an problem with specs, Running mentioned. At around $1,500 retail, the table costs a bit more than comparable high-end desks with electric motors, according to Running.
Photo: Humanscale
Humanscale’s flagship sit/stand desk is sustainable for human health as well as for the planet.

p. 20The BuildingGreen Report • November 2017
Jim Kidd, product director, sit/stand at Humanscale, is proud of Float’s performance. “We have spent three years in development and continuous research” to make the desk perform as well as it does, he told BuildingGreen. “The average height-adjustable table takes 16 seconds to adjust.” Kidd says Float is almost instantaneous to adjust and compares it to turning a door-knob. “You don’t notice you’re using it.”
For this reason, Kidd said, people are more likely to shift from sitting to standing rather than doing one or the other all day. It also improves ergonomics because dialing in the exact right height takes very little effort.
“There is a handful of people who have really created a culture around it,” Running said. “If I ask a question, they bring their desk up, and we have a standing meeting.” If it takes longer to adjust a desk, that kind of culture would be unlikely to develop.
And it’s Red List-free
Although the table is designed for comfort, ergonomics is about more than supporting people’s wrists or backs in a certain way, contends Kidd. It extends even to the chemistry of the product.
“Ergonomics really ties into human factors,” Kidd said, connecting ergonomics to the broader issue of sustainability. “What does a human being need to be healthy for the rest of their life doing the things they are required to do? That means reducing the risk of any kind of contact stress,” including exposure to formaldehyde—a ubiquitous chemical additive in office furniture and a forbidden substance on the Living Product Challenge (LPC) Red List. As part of its LPC certification, Float is free of formaldehyde and all other Red List chemicals.
There’s a lot more to LPC than reducing the risk of exposure to harmful substances, though. Overall, the Float table is supposed to have a positive impact on the environment
and society rather than a negative one. For example, in order to achieve the certification, Humanscale had to demonstrate that the product produces more water and energy than it consumes during manufacturing. The company accomplished this by capturing rainwater and by adding photovoltaics to the factory. Products also have to be affordable for Humanscale employees, and a portion of sales must be donated to habitat restoration (among other imperatives).
In addition to its LPC certification, Float has a score of 2 in the Business & Institutional Furniture Manufacturers Association “level” program and can contribute to both LEED (under various credits, including the Ergonomics pilot credit) and WELL (under the Active Furnishings optimization).
For more information
Humanscale humanscale.com
PRIMER
From Ozone Depletion to Global Warming: The Kigali AmendmentThe amendment builds on the Montreal Protocol’s legacy, aiming to reduce greenhouse gas emissions worldwide.
by Brent Ehrlich
The Montreal Protocol was one of the most successful treaties ever signed. Ratified by 197 countries and the European Union in 1987, it went into effect in 1989, limiting the use of chemicals that destroy the ozone layer that protects Earth from harmful ultraviolet radiation.
Under the treaty, nations began phasing out the use of substances with high ozone depletion potentials (ODPs), primarily chlorofluorocarbons (CFCs) and hydrochlorofluorocarbons (HCFCs) that are used in the building industry as refrigerants and foam
insulation blowing agents. CFCs have the highest ODP and were banned in the U.S. in 1996. HCFCs have lower ODP and are being phased out over time, with 99.5% scheduled to be removed from the market by 2020 and 100% by 2030. These phaseouts are expected to bring the levels of ODP back to 1980 levels as soon as 2050.
Hydrofluorocarbons (HFCs) that have almost no ODP replaced CFCs and HCFCs, but all three substances share another environmental time bomb: many of them have extremely high global warming potentials (GWPs). CFC R-12, for example, has a GWP 10,900 times greater than CO2; HCFC R-22 has a GWP of 1,810; and HFC R-410a has a GPW of 2,088.
The Montreal Protocol did not address the issue of global warming, however. With concern over climate change growing, representatives from across the globe reconvened last year, this time in Kigali, the capital of Rwanda, to address the problem of HFCs.
On October 15, 2016, the Kigali Amendment was signed. Its aim is to reduce the use of HFCs by 80%–85% by 2047 and would avoid the production of 80 billion tons of equivalent CO2. The Kigali Amendment does not eliminate the use of HFCs, but phases them out over time. The schedule is complicated and depends on each country’s level of development. Wealthier, industrialized “group 1” countries, like the U.S., would phase out 80% of HFCs by 2045; “group 2” countries, like India and Saudi Arabia, would phase out 85% by 2047. The Russian Federation and a few other countries have a slightly different schedule.
The Kigali Amendment is a legally binding document, and trade will be banned with parties that do not ratify the document by 2033. It will go into effect in January 2019, but only if it is ratified by 20 parties. Fewer than ten have signed on so far.
The U.S. was instrumental in the development of the Kigali Amendment under the Obama administration, but its future now
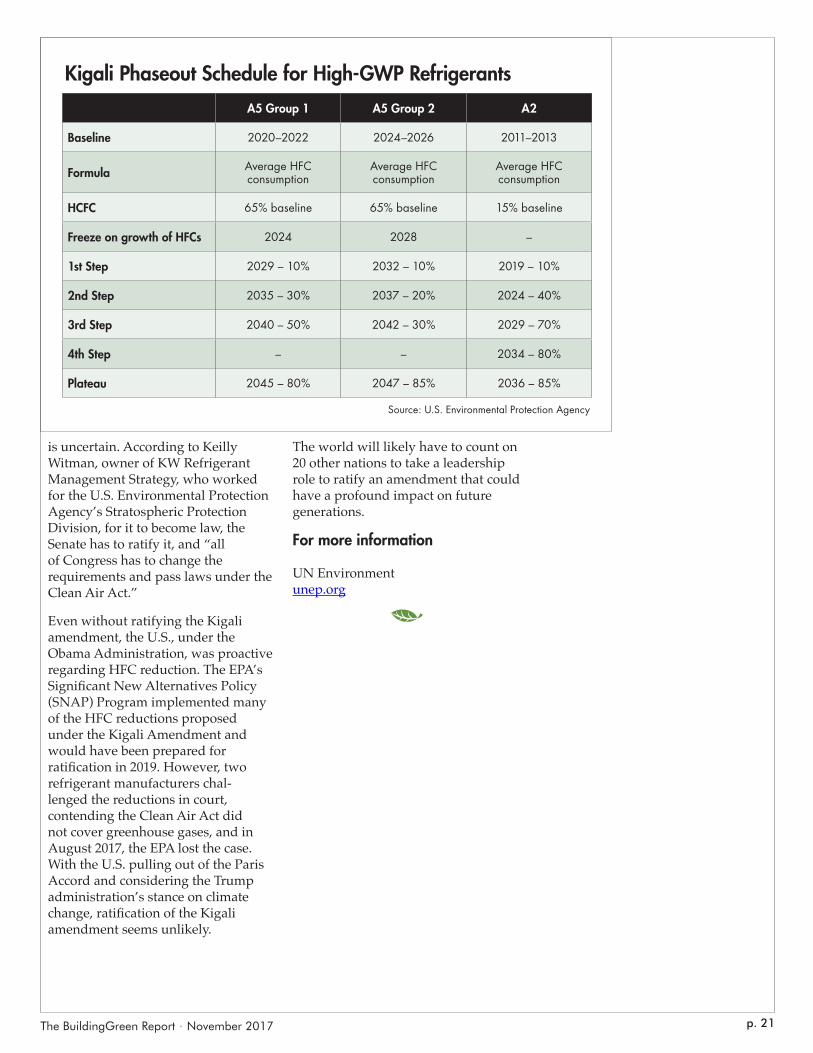
p. 21The BuildingGreen Report • November 2017
is uncertain. According to Keilly Witman, owner of KW Refrigerant Management Strategy, who worked for the U.S. Environmental Protection Agency’s Stratospheric Protection Division, for it to become law, the Senate has to ratify it, and “all of Congress has to change the requirements and pass laws under the Clean Air Act.”
Even without ratifying the Kigali amendment, the U.S., under the Obama Administration, was proactive regarding HFC reduction. The EPA’s Significant New Alternatives Policy (SNAP) Program implemented many of the HFC reductions proposed under the Kigali Amendment and would have been prepared for ratification in 2019. However, two refrigerant manufacturers chal-lenged the reductions in court, contending the Clean Air Act did not cover greenhouse gases, and in August 2017, the EPA lost the case. With the U.S. pulling out of the Paris Accord and considering the Trump administration’s stance on climate change, ratification of the Kigali amendment seems unlikely.
The world will likely have to count on 20 other nations to take a leadership role to ratify an amendment that could have a profound impact on future generations.
For more information
UN Environment unep.org
A5 Group 1 A5 Group 2 A2
Baseline 2020–2022 2024–2026 2011–2013
Formula Average HFC consumption
Average HFC consumption
Average HFC consumption
HCFC 65% baseline 65% baseline 15% baseline
Freeze on growth of HFCs 2024 2028 –
1st Step 2029 – 10% 2032 – 10% 2019 – 10%
2nd Step 2035 – 30% 2037 – 20% 2024 – 40%
3rd Step 2040 – 50% 2042 – 30% 2029 – 70%
4th Step – – 2034 – 80%
Plateau 2045 – 80% 2047 – 85% 2036 – 85%
Kigali Phaseout Schedule for High-GWP Refrigerants
Source: U.S. Environmental Protection Agency