the business case for systems engineering study: assessing project performance … · ·...
TRANSCRIPT

The Business Case for Systems Engineering Study: Assessing Project Performance from Sparse Data
Joseph P. Elm
December 2012
SPECIAL REPORT CMU/SEI-2012-SR-010
Research, Technology, and System Solutions Program
http://www.sei.cmu.edu

SEI markings v3.2 / 30 August 2011
Copyright 2012 Carnegie Mellon University.
This material is based upon work funded and supported by the Department of Defense under Contract No. FA8721-05-C-
0003 with Carnegie Mellon University for the operation of the Software Engineering Institute, a federally funded re-
search and development center.
Any opinions, findings and conclusions or recommendations expressed in this material are those of the author(s) and do
not necessarily reflect the views of the United States Department of Defense.
This report was prepared for the
SEI Administrative Agent
AFLCMC/PZE
20 Schilling Circle, Bldg 1305, 3rd floor
Hanscom AFB, MA 01731-2125
NO WARRANTY. THIS CARNEGIE MELLON UNIVERSITY AND SOFTWARE ENGINEERING INSTITUTE
MATERIAL IS FURNISHED ON AN “AS-IS” BASIS. CARNEGIE MELLON UNIVERSITY MAKES NO
WARRANTIES OF ANY KIND, EITHER EXPRESSED OR IMPLIED, AS TO ANY MATTER INCLUDING, BUT
NOT LIMITED TO, WARRANTY OF FITNESS FOR PURPOSE OR MERCHANTABILITY, EXCLUSIVITY, OR
RESULTS OBTAINED FROM USE OF THE MATERIAL. CARNEGIE MELLON UNIVERSITY DOES NOT MAKE
ANY WARRANTY OF ANY KIND WITH RESPECT TO FREEDOM FROM PATENT, TRADEMARK, OR
COPYRIGHT INFRINGEMENT.
This material has been approved for public release and unlimited distribution except as restricted below.
The Government of the United States has a royalty-free government-purpose license to use, duplicate, or disclose the
work, in whole or in part and in any manner, and to have or permit others to do so, for government purposes pursuant to
the copyright license under the clause at 252.227-7013 and 252.227-7013 Alternate I.
Internal use:* Permission to reproduce this material and to prepare derivative works from this material for internal use is
granted, provided the copyright and “No Warranty” statements are included with all reproductions and derivative works.
External use:* This material may be reproduced in its entirety, without modification, and freely distributed in written or
electronic form without requesting formal permission. Permission is required for any other external and/or commercial
use. Requests for permission should be directed to the Software Engineering Institute at [email protected].
* These restrictions do not apply to U.S. government entities.
® Carnegie Mellon, and CERT are registered in the U.S. Patent and Trademark Office by Carnegie Mellon University.

CMU/SEI-2012-SR-010 | i
Table of Contents
Acknowledgments vii
Executive Summary ix
Abstract xi
1 Introduction 1
2 Challenges 2 2.1 What Is Project Performance? 2 2.2 Questionnaire Limitations 3
3 Project Performance Assessment 4
4 Project Cost Performance Assessment 5 4.1 Project Cost Questions 5 4.2 Project Cost Analysis 6
4.2.1 CPI Analysis 8 4.2.2 Cost Data Analysis 10 4.2.3 Customer Cost Data Analysis 12 4.2.4 Cost Reconciliation 13
5 Project Schedule Performance 15 5.1 Project Schedule Questions 15 5.2 Project Schedule Analysis 16
5.2.1 SPI Analysis 18 5.2.2 Schedule Data Analysis 20 5.2.3 Customer Schedule Data Analysis 22 5.2.4 Integrated Master Schedule Data Analysis 23 5.2.5 Schedule Reconciliation 25
6 Project Technical Performance 27
7 Conclusion 29
References 31

CMU/SEI-2012-SR-010 | ii

CMU/SEI-2012-SR-010 | iii
List of Figures
Figure 1: Performance Analysis Calculation 4
Figure 2: Project Cost Performance Analysis 7
Figure 3: CPI Analysis 9
Figure 4: Project Cost Data Analysis 11
Figure 5: Customer Cost Data Analysis 13
Figure 6: Project Cost Performance Reconciliation 14
Figure 7: Project Schedule Performance Analysis 17
Figure 8: SPI Analysis 19
Figure 9: Project Schedule Data Analysis 21
Figure 10: Customer Schedule Data Analysis 23
Figure 11: IMS Data Analysis 24
Figure 12: Project Schedule Performance Reconciliation 26
Figure 13: Technical Performance Analysis 28

CMU/SEI-2012-SR-010 | iv

CMU/SEI-2012-SR-010 | v
List of Tables
Table 1: Cost Performance Assessment Questions 5
Table 2: Schedule Performance Assessment Questions 15
Table 3: Technical Performance Assessment Questions 27

CMU/SEI-2012-SR-010 | vi

CMU/SEI-2012-SR-010 | vii
Acknowledgments
Thanks to the following people for their contributions to and review of this report:
• members of the Institute of Electrical and Electronic Engineers (IEEE) Aerospace and Elec-tronic Systems Society and the National Defense Industrial Association (NDIA) Systems Engineering Division who participated on the Systems Engineering Effectiveness Commit-tee
• members of the International Council on Systems Engineering (INCOSE) Systems Engineer-ing Effectiveness Working Group (SEEWG)
• Julie Cohen
• Joan Nolan
• Sandy Shrum

CMU/SEI-2012-SR-010 | viii

CMU/SEI-2012-SR-010 | ix
Executive Summary
The Software Engineering Institute (SEI) is currently collaborating with the National Defense Industrial Association (NDIA) Systems Engineering Division and the Institute of Electrical and Electronic Engineers (IEEE) Aerospace and Electronic Systems Society to conduct a systems en-gineering effectiveness study. The purpose of this study is to identify and quantify relationships between the application of systems engineering (SE) activities on development projects and the performance of those projects. This study is a follow-on to and an enhancement of the systems engineering effectiveness study conducted by the NDIA-SED and the SEI, which was published in 2007 and 2008 [Elm 2008].
Like the previous study, the current study uses anonymous and confidential survey techniques to assess
• characteristics of individual projects (e.g., project size, industry, technology)
• SE activities deployed on these projects
• project performance
This report describes the process we used to assess project performance, which is defined as the satisfaction of
• project budget
• project schedule
• project technical specifications
Challenges arise when obtaining the information needed to assess performance through the use of a survey questionnaire. First, the questionnaire must be kept brief enough to encourage potential respondents to participate. Second, the questionnaire must be autonomous because when present-ing questions, there is no means of supplemental communication. The survey questions must be concise, clear, and unambiguous. Under these constraints, the ability to collect data to enable the
assessment of a complex parameter like project performance is limited.
In the SE effectiveness survey, project cost performance is assessed by asking 10 questions. These questions take a tri-partite approach to assessing cost performance by examining
1. the difference between the initial budget and the current estimated cost at completion
2. Cost Performance Index (CPI) from an Earned Value Management System (EVMS)
3. the respondent’s impression of the degree of customer satisfaction with project cost
We recognized that not all projects would be capable of responding in all three of these areas. Hence, we established a means for accepting and using whatever information was provided.
Project schedule performance is assessed by asking 12 questions. These questions take a four-part approach to assessing schedule performance by examining
1. the difference between the initial completion date and the current estimated completion date
2. Schedule Performance Index (SPI) from an EVMS
3. variance from the approved integrated master schedule (IMS)
4. the respondent’s impression of the degree of customer satisfaction with project cost

CMU/SEI-2012-SR-010 | x
Again, we recognized that not all projects would be capable of responding in all four of these are-
as. Hence, we established a means for accepting and using whatever information was provided.
Project technical performance is assessed by asking two questions. These questions assess tech-nical performance by examining
1. satisfaction of technical requirement specifications
2. the respondent’s impression of the degree of customer satisfaction with project technical per-formance
The results of these assessments are combined into a measure of overall project performance. A level of confidence in that measure is also calculated based on the amount of data available for the
calculations and the level of agreement across data sources.

CMU/SEI-2012-SR-010 | xi
Abstract
This report describes the data collection and analysis process used to support the assessment of project performance for the systems engineering (SE) effectiveness study being conducted by the Software Engineering Institute (SEI), the National Defense Industrial Association (NDIA) Sys-tems Engineering Division, and the Institute of Electrical and Electronic Engineers (IEEE) Aero-space and Electronic Systems Society. This study seeks to identify relationships between the ap-plication of specific systems engineering practices on development projects, and the performance of those projects, as measured by their satisfaction of budget, schedule, and technical require-ments.

CMU/SEI-2012-SR-010 | xii

CMU/SEI-2012-SR-010 | 1
1 Introduction
The Software Engineering Institute (SEI) is currently collaborating with the National Defense Industrial Association (NDIA) Systems Engineering Division and the Institute of Electrical and Electronic Engineers (IEEE) Aerospace and Electronic Systems Society to conduct a systems en-gineering effectiveness study. The purpose of this study is to identify and quantify relationships between the application of systems engineering (SE) activities in development projects and the performance of those projects. This study is a follow-on to and an enhancement of the systems engineering effectiveness study conducted by the NDIA-SED and the SEI, which was published in 2007 and 2008 [Elm 2008].
Like the previous study, the current study uses anonymous and confidential survey techniques to assess
• characteristics of individual projects (e.g., project size, industry, technology)
• SE activities deployed on these projects
• project performance
Assessment of SE activities on the participating projects is accomplished by inquiring about the presence and the characteristics of various artifacts resulting from SE activities such as product architecture documentation, system requirements traceability matrices, and lists of project risks. Project performance is assessed by exploring information regarding project costs, project sched-ule, and satisfaction of technical requirements.
Survey responses are analyzed to identify statistical relationships between the application of SE activities and project performance.

CMU/SEI-2012-SR-010 | 2
2 Challenges
The objective of this study is to use an anonymous and confidential questionnaire to obtain suffi-cient information regarding both the application of SE activities to a development project and the resulting performance of that project. These data will enable us to identify statistical relationships between the two. Collecting this information using an online questionnaire poses a number of challenges, particularly when attempting to assess project performance.
2.1 What Is Project Performance?
Project success may be defined as a project that is completed
• on time
• on budget
• within specifications
In theory, evaluating project performance should be simple. Each of these three attributes can be evaluated as a binary value (e.g., true, false). Successful projects produce “true” values for all three attributes. However, the reality is somewhat more complicated. None of these attributes is
truly binary; each is actually a continuum. Furthermore, all three attributes are interrelated.
A project can often satisfy more of its specifications at an increase in cost. A project can often be completed more quickly if relief is granted on some of the specifications. These interrelationships
raise questions such as the following:
• Is a project that is 10% over budget, but is completed six months early, more or less success-ful than a project that is completed on budget but six months late?
• Is a project that is completed on time and on budget and meets 95% of its specifications more or less successful than a project that meets all of its specifications but is 20% over budget and three months late?
Often the answers to these questions are specific to the project itself. For some projects, on-time performance is more important than other factors (e.g., an upgrade to a weapons system needed on the battlefield immediately). For some projects, compliance to specifications is paramount (e.g., satisfaction of safety criteria for a medical device). For other projects, on-budget perfor-mance is most critical. For meaningful use in the SE effectiveness study, the assessment of project performance must achieve a consistent combination of the assessment of all three of these per-formance elements.
Another factor complicating performance assessment arises from changes occurring throughout the duration of the project. During project execution, the needs of the acquirer may change, re-quiring a change in project specifications, cost, and schedule. As projects progress, both the ac-quirer and developer of the product may develop new insights that may also drive changes to specifications. These changes may then drive a renegotiation of the project cost and schedule.
Some projects encounter unanticipated technical challenges, resulting in increased cost and schedule. In some cases, the acquirer may choose to relax the schedule or provide increased fund-ing for these projects. When circumstances surrounding the project result in changes in the ap-

CMU/SEI-2012-SR-010 | 3
proved budget schedule and/or specifications, the definitions of “on time,” “on budget,” and “within specifications” become fuzzy, making the overall assessment of project performance problematic. Our assessment of project performance must strive to be consistent in the presence of
these uncertainties.
2.2 Questionnaire Limitations
We decided that the questionnaire must be kept brief since respondents are volunteering their time and effort to complete the survey. If the survey is too long, or the questions are too difficult to answer, respondents will abandon it, providing no response and no useful information. This sur-vey approach precludes the possibility of in-depth inquiries into the details of the project that
could be helpful in sorting out the uncertainties mentioned in the previous section.
A survey is autonomous. When presenting questions, there is no other means of supplemental communication. The respondent may not ask for clarification from the surveyor and the surveyor may not provide guidance to the respondent. Thus, the survey questions must be as concise, clear, and unambiguous as possible. This quality is often difficult to achieve when faced with the ab-sence of a common lexicon across the surveyed population, as is the case with questions of project
performance.
For example, collecting data from an Earned Value Management System (EVMS) may be a con-cise means of assessing project cost and schedule performance; however, for projects that do not use EVMS, such questions would be meaningless. Furthermore, EVMS measures cost and sched-ule performance against a baseline. Depending on how and when that baseline is established, the interpretation of EVMS data could vary widely. Again, due to the need for brevity, the question-naire may not be able to delve into the depth of inquiry needed to resolve these uncertainties.

CMU/SEI-2012-SR-010 | 4
3 Project Performance Assessment
For the SE effectiveness study, we defined project performance as the amalgam of three charac-teristics:
1. cost performance—the satisfaction of cost and budgetary constraints
2. schedule performance—the satisfaction of intermediate and final time constraints
3. technical performance—the satisfaction of technical and quality requirements
Each of these factors is measured as described later in this report. The results are then linearly combined to create a measure of overall project performance (Perf) and a measure of confidence in that value (Perf_Conf). The process is shown in Figure 1.
Figure 1: Performance Analysis Calculation

CMU/SEI-2012-SR-010 | 5
4 Project Cost Performance Assessment
4.1 Project Cost Questions
Project cost performance is assessed by asking the 10 questions shown in Table 1. These ques-tions take a tri-partite approach to assessing cost performance by examining
1. the difference between the initial budget and the current estimated cost at completion
2. Cost Performance Index (CPI) from an EVMS
3. the respondent’s impression of the degree of customer satisfaction with project cost
We recognized that not all projects would be capable of responding in all three of these areas. Hence, we established a means for accepting and using whatever information was provided.
Table 1: Cost Performance Assessment Questions
QUESTION RESPONSE
Q1. What was the Initial Contract Value for this pro-ject?1
CV_initial
Q2. What is current Contract Value for this project?1 CV_current
Q3. The change in contract value is primarily due to (Please select one)1
ΔCV_Source
1. not applicable; contract value has not changed significantly
2. change in the technical scope of the project
3. unplanned increases in the cost of the project
4. other (please explain)
Q4. What was the initial budget for this project? Budget_initial
Q5. What is the current budget for this project? Budget_current
Q6. What is the projected cost variance at comple-tion for the current contract baseline?
Var_ECAC
Q7. The change in budget is primarily due to (Please select one)
ΔBudget_Source
1. not applicable; budget has not changed signifi-cantly
2. change in the technical scope of the project
3. unplanned increases in the cost of executing the project
4. customer-driven increases in the cost of execut-ing the project
5. other (please explain)
1 This question is used to assess both cost and schedule performance. It is not duplicated in the questionnaire.

CMU/SEI-2012-SR-010 | 6
QUESTION RESPONSE
Q8. When is the EVMS baseline updated? (Please select one)1
EVMS_Strategy
1. EVMS is not tracked on this project
2. Only at contract initiation
3. Whenever a contract change order or renewal is received
4. Incrementally in rolling wave planning
5. Whenever the project is reprogrammed due to a pre-determined cost or schedule variance
6. At periodic intervals
7. Other (Please describe briefly)
Q9. What is the current cumulative (or final) EVMS Cost Performance Index (CPI) for this project?
CPI
Q10. I believe that my customer is satisfied with this project's performance with respect to cost
Cost_Cust
Strongly Disagree
Disagree
Agree
Strongly Agree
The questionnaire includes several questions to resolve some of the uncertainties identified in Section 2.1. Initial and current amounts for contract value are collected to mitigate the impacts of mid-project changes in project scope. Information regarding the strategy for establishing EVMS baselines is also collected to facilitate correct interpretation of EVMS CPI data.
4.2 Project Cost Analysis
The data analysis process used to determine project cost performance is shown in Figure 2 through Figure 6. Input information consists of the 10 parameters collected from the questionnaire (see Table 1). As shown in Figure 2, three analysis paths are pursued:
1. CPI Analysis—assessment of project cost performance based on EVMS CPI (see Figure 3).
2. Cost Data Analysis—assessment of project cost performance based on variance of current estimated cost at completion from initial budget (Corrections are included for project scope changes resulting in a change of contract value as shown in Figure 4.)
3. Customer Data Analysis—assessment of respondents’ impressions of customer satisfaction with project cost performance (See Figure 5.)
Each of these analysis paths is discussed later in this section.

CMU/SEI-2012-SR-010 | 7
Figure 2: Project Cost Performance Analysis
The results of these three analyses are combined (see Figure 6) to produce an overall assessment of project cost performance (Cost_Perf_0) and a confidence measure (Cost_Conf_0) of that val-ue. Cost_Perf_0 is calculated as a linear combination of the three sources of cost performance data (i.e., CPI, variance from budget, customer satisfaction). Cost_Perf_0 is scaled and interpret-ed as follows:
Cost_Perf_0 = 1 Very poor cost performance—Cost is projected to exceed budget by 10% or more; the customer is very dissatisfied with cost perfor-mance.
= 2 Poor cost performance—cost is projected to exceed budget by 5 to 10%; the customer is dissatisfied with cost performance.
= 3 Average cost performance—Cost is projected to be within ±5% of budget.
= 4 Good cost performance—Cost is projected to be 5 to 10% under budget; the customer is satisfied with cost performance.
= 5 Very good cost performance—Cost is projected to be more than 10% under budget; the customer is very satisfied with cost perfor-mance.

CMU/SEI-2012-SR-010 | 8
Cost_Conf_0 is an assessment of the confidence of Cost_Perf_0 and is based on the number of data sources used to calculate Cost_perf_0 and the level of agreement among those sources. Cost_Conf_0 ranges from 0 to 6, with 0 indicating no confidence in the calculated value of Cost_Perf_0, and 6 indicating very high confidence arising from the presence of all three measures of cost performance (i.e., CPI, cost data, customer data) in agreement.
4.2.1 CPI Analysis
CPI data, if available, are analyzed as shown in Figure 3. CPI is a measure of the variance of cur-
rent or projected costs from a predefined baseline. It is calculated as
= ℎ ℎ
Thus, values less than one represent a budget overrun (i.e., poor cost performance) and values greater than one represent a budget underrun (i.e., good cost performance).
An intermediate cost performance variable (Cost_Perf_1) is calculated from CPI as follows:
CPI < 0.90 Cost_Perf_1 = 1 >10% budget overrun
0.90 ≤ CPI < 0.95 Cost_Perf_1 = 2 5-10% budget overrun
0.95 ≤ CPI < 1.05 Cost_Perf_1 = 3 within ±5% of budget
1.05 ≤ CPI < 1.10 Cost_Perf_1 = 4 5-10% budget underrun
1.1 ≤ CPI Cost_Perf_1 = 5 >10% budget underrun

CMU/SEI-2012-SR-010 | 9
Figure 3: CPI Analysis
We also make an assessment of the reliability of the CPI data based on how the EVMS baseline is managed. After evaluating numerous programs, we identified five strategies commonly used by companies when they manage their EVMS baselines:
1. The EVMS baseline is established only at contract initiation. This strategy provides an un-varying reference against which project cost performance can be measured throughout the execution of the project. Thus, CPI data represent the variance from the initial budget for the

CMU/SEI-2012-SR-010 | 10
project. CPI calculated using this strategy is reliable, provided that the scope of the project has not changed. If the scope has changed and that change results in a renegotiated budget and schedule, the CPI produced by this strategy is not indicative of project cost performance.
2. The EVMS baseline is updated whenever a contract change order or renewal is received. This strategy provides a cost reference aligned with the current contract value. If contract change orders were issued to recognize changes in project scope and the associated differ-ences in project budget and schedule, the CPI calculated from this baseline is reliable. If the contract change orders were issued to recognize unanticipated cost or schedule delays not re-lated to a change in project scope, the CPI produced by this strategy is not indicative of pro-ject cost performance.
3. The EVMS baseline is updated periodically in rolling wave planning. This strategy does not provide a consistent baseline against which cost performance may be evaluated. CPI pro-duced by this strategy is not indicative of project cost performance.
4. The EVMS baseline is updated whenever the project is reprogrammed due to a pre-determined cost or schedule variance. This strategy does not provide a consistent baseline against which cost performance may be evaluated. CPI produced by this strategy is not in-dicative of project cost performance.
5. The EVMS baseline is updated at periodic intervals. This strategy does not provide a con-sistent baseline against which cost performance may be evaluated. CPI produced by this strategy is not indicative of project cost performance.
The only two EVMS baseline strategies that produce CPI values useful for evaluating project cost performance are Strategies 1 and 2. Strategy 1 produces a reliable CPI only when project scope has not changed. Strategy 2 produces a reliable CPI only when contract change orders have been issued and the changes are unrelated to project scope. By identifying the reason for contract value changes (ΔCV_Source), we can determine the reliability of the CPI produced by either of these
two strategies.
For all of the strategies described in this section, the reliability of the resulting CPI is captured in an intermediate cost confidence parameter (Cost_Conf_1), where 0 indicates low reliability and 1
indicates high reliability.
4.2.2 Cost Data Analysis
If project cost data, which consist of the initial project budget (Budget_initial), the current project budget (Budget_current), and the estimated cost variance at completion (Var_ECAC), are availa-ble, these cost data can be used to calculate project cost performance. The process used to analyze project cost data and calculate project cost performance is shown in Figure 4.

CMU/SEI-2012-SR-010 | 11
Figure 4: Project Cost Data Analysis
Ideally, we measure cost performance as the ratio of ECAC to Budget_initial. In cases where the project scope has been stable, this ratio is a valid measure of cost performance. However, a differ-ent approach must be taken if the project scope has changed during the execution of the project, as discussed in Section 2.
If the project scope has changed, Budget_initial is no longer a valid cost baseline; we must adapt the baseline to the new scope of the project. If the scope of the project has changed significantly,

CMU/SEI-2012-SR-010 | 12
it is highly likely that contract change orders have been issued to change the contract value to re-flect the revised scope. The magnitude of the scope change can be estimated by the ratio between the initial contract value (CV_initial) and the current contract value (CV_current). In such a case, rather than assess cost performance as ECAC/Budget_initial, we now assess cost performance as
_ _2 = _ ÷ __
Using contract value as an indicator of scope change creates another possible source of error. As noted in Section 2, sometimes contract change orders are issued to recognize project cost over-runs. This type of change order occurs primarily on cost-reimbursable contracts. In these cases, since the change in contract value does not reflect a change of project scope, Budget_initial should remain the cost baseline for the calculation of cost performance.
Once the cost performance ratio (Cost_Perf_2) is established, cost performance (Cost_Perf_3) is
calculated as follows:
Cost_Perf_2 < 0.90 Cost_Perf_3 = 5 >10% budget underrun
0.90 ≤ Cost_Perf_2 < 0.95 Cost_Perf_3 = 4 5-10% budget underrun
0.95 ≤ Cost_Perf_2 < 1.05 Cost_Perf_3 = 3 within ±5% of budget
1.05 ≤ Cost_Perf_2 < 1.10 Cost_Perf_3 = 2 5-10% budget overrun
1.10 ≤ Cost_Perf_2 Cost_Perf_3 = 1 >10% budget overrun
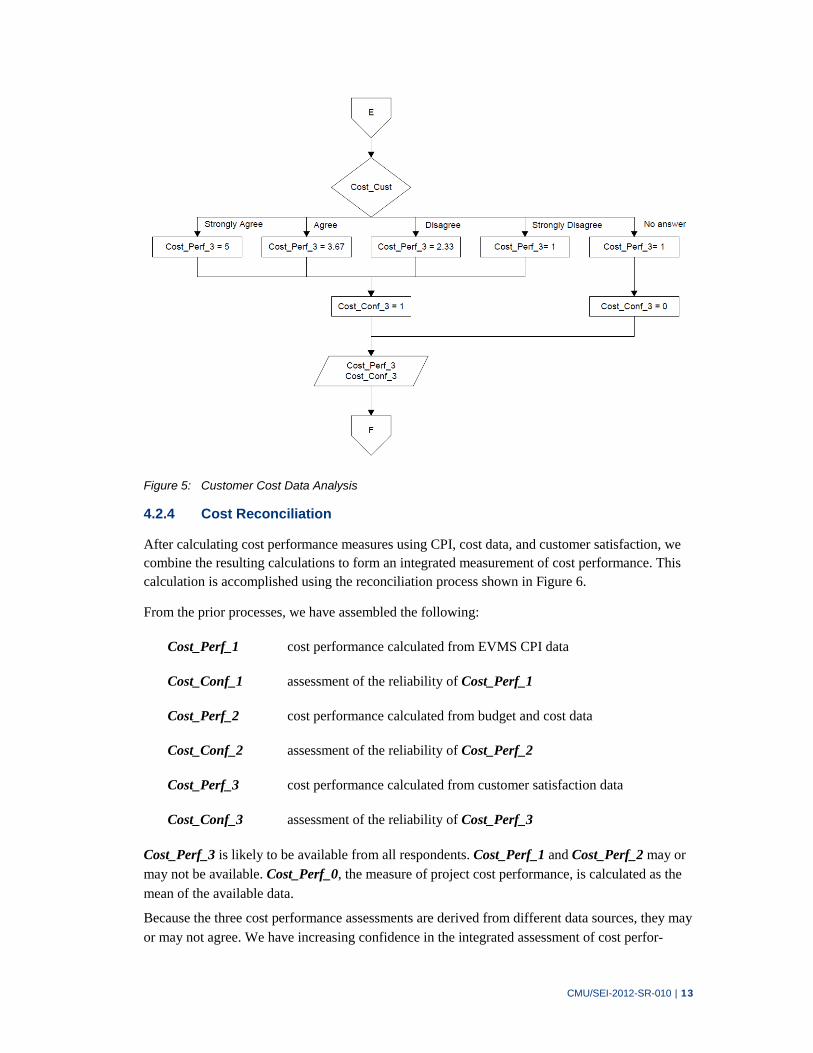
4.2.3 Customer Cost Data Analysis
The survey asks for the respondent’s opinion of the customer’s degree of satisfaction with the cost performance of the project (Cost_Cust). The response is evaluated as shown in Figure 5. Results (Cost_Perf_4) are scaled from 1 to 5 to correspond with the results of the CPI and cost data anal-ysis.
CMU/SEI-2012-SR-010 | 13
Figure 5: Customer Cost Data Analysis
4.2.4 Cost Reconciliation
After calculating cost performance measures using CPI, cost data, and customer satisfaction, we combine the resulting calculations to form an integrated measurement of cost performance. This calculation is accomplished using the reconciliation process shown in Figure 6.
From the prior processes, we have assembled the following:
Cost_Perf_1 cost performance calculated from EVMS CPI data
Cost_Conf_1 assessment of the reliability of Cost_Perf_1
Cost_Perf_2 cost performance calculated from budget and cost data
Cost_Conf_2 assessment of the reliability of Cost_Perf_2
Cost_Perf_3 cost performance calculated from customer satisfaction data
Cost_Conf_3 assessment of the reliability of Cost_Perf_3
Cost_Perf_3 is likely to be available from all respondents. Cost_Perf_1 and Cost_Perf_2 may or may not be available. Cost_Perf_0, the measure of project cost performance, is calculated as the
mean of the available data.
Because the three cost performance assessments are derived from different data sources, they may or may not agree. We have increasing confidence in the integrated assessment of cost perfor-

CMU/SEI-2012-SR-010 | 14
mance as we accrue more data, and as the accrued data show more agreement. We measure agreement between Cost_Perf_1, Cost_Perf_2, and Cost_Perf_3 using pairwise comparisons.
Since each variable ranges only from 1 to 4, we define agreement as pairwise differences ≤ 1.
Cost_Conf_0, the measure of that confidence, ranges from 0 to 6 and is calculated as follows:
• 1 point for the availability of Cost_Perf_1 • 1 point for the availability of Cost_Perf_2 • 1 point for the availability of Cost_Perf_3 • 1 point for the agreement between Cost_Perf_1 and Cost_Perf_2 • 1 point for the agreement between Cost_Perf_1 and Cost_Perf_3
• 1 point for the agreement between Cost_Perf_2 and Cost_Perf_3
The calculation of Cost_Perf_0 and Cost_Conf_0 is shown in Figure 6.
Figure 6: Project Cost Performance Reconciliation

CMU/SEI-2012-SR-010 | 15
5 Project Schedule Performance
5.1 Project Schedule Questions
Project schedule performance is assessed by asking the 12 questions shown in Table 2. These questions take a four-part approach to assessing schedule performance by examining
1. the difference between the initial completion date and the current estimated completion date
2. Schedule Performance Index (SPI) from an EVMS
3. variance from the approved integrated master schedule (IMS)
4. The respondent’s impression of the degree of customer satisfaction with project cost
We recognized that not all projects would be capable of responding in all four of these areas. Hence, a means was established for accepting and using the information provided.
Table 2: Schedule Performance Assessment Questions
QUESTION RESPONSE
Q1. What was the Initial Contract Value for this pro-ject?2
CV_initial
Q2. What is the current Contract Value for this pro-ject?2
CV_current
Q3. The change in contract value is primarily due to (Please select one)2
ΔCV_Source
1. not applicable; contract value has not changed significantly
2. change in the technical scope of the project
3. unplanned increases in the cost of the project
4. other (please explain)
Q4. What was the initial total planned duration of this project?
Sched_initial
Q5. What is the current total planned duration of this project?
Sched_current
Q6. What is the projected schedule variance at completion for the current contract baseline?
ECD_variance
Q7. The change in schedule is primarily due to (Please select one)
ΔSched_Source
1. not applicable; schedule has not changed signifi-cantly
2. change in the technical scope of the project
3. unplanned increases in the schedule for execut-ing the project
4. customer-driven increases in the schedule for executing the project
5. other (please explain)
Q8. Overall, this project is performing per the schedule established in the current IMS ap-proved by the acquirer.
IMS_sat
Strongly Disagree
Disagree
Agree
Strongly Agree
2 This question is used to assess both cost and schedule performance. It is not duplicated in the questionnaire.

CMU/SEI-2012-SR-010 | 16
QUESTION RESPONSE
Q9. The schedule of this project’s critical path, when compared to the current IMS approved by the acquirer is
CP_variance 1. Greater than 6 months late
2. Greater than 3 months late
3. Greater than 1 month late
4. Within plus or minus 1 month
5. Greater than 1 month early
6. Greater than 3 months early
7. Greater than 6 months early
Q10. When is the EVMS baseline updated? (Please select one)2
EVMS_Strategy
1. EVMS is not tracked on this project
2. Only at contract initiation
3. Whenever a contract change order or renewal is received
4. Incrementally in rolling wave planning
5. Whenever the project is reprogrammed due to a pre-determined cost or schedule variance
6. At periodic intervals
7. Other (Please describe briefly)
Q11. What is the current cumulative (or final) EVMS SPI for this project?
SPI
Q12. I believe that my customer is satisfied with this project's performance with respect to schedule.
Sched_Cust
Strongly Disagree
Disagree
Agree
Strongly Agree
The questionnaire includes several questions designed to resolve some of the uncertainties identi-fied in Section 2.1. Initial and current amounts for contract value are collected as an aid to miti-gating the impacts of mid-project changes in project scope. Information regarding the strategy for establishing EVMS baselines is collected to facilitate correct interpretation of the EVMS SPI data.
5.2 Project Schedule Analysis
The data analysis process for project schedule performance is shown in Figures 7 through 12. In-put information consists of the 10 parameters collected from the questionnaire (see Table 1). As shown in Figure 7, four analysis paths are pursued:
1. SPI Analysis—assessment of project schedule performance based on EVMS SPI (see Figure 8).
2. Schedule Data Analysis—assessment of project schedule performance based on variance of the current completion date from the initial completion date (Corrections are included for project scope changes resulting in a change of contract value as shown in Figure 9.)
3. Customer Schedule Data Analysis—assessment of the respondent’s impression of customer satisfaction with project schedule performance (See Figure 10.)
4. IMS Data Analysis—assessment of project schedule performance based on conformance of the project to the customer-approved IMS and variances in the project’s critical path (See Figure 11.)

CMU/SEI-2012-SR-010 | 17
Each of these analysis paths is discussed later in this section.
Figure 7: Project Schedule Performance Analysis
The results of these four analyses are combined (see Figure 12) to produce an overall assessment of project schedule performance (Sched_Perf_0) and a confidence measure (Sched_Conf_0) of that value. Sched_Perf_0 is calculated as a linear combination of the four sources of cost perfor-mance data (i.e., SPI, schedule variance, customer satisfaction, IMS variance). Sched_Perf_0 is scaled and interpreted as follows:
Sched_Perf_0 = 1 Very poor schedule performance—The schedule is projected to ex-ceed plan by 10% or more; the customer is very dissatisfied with schedule performance.
= 2 Poor schedule performance—The schedule is projected to exceed plan by 5 to 10%; the customer is dissatisfied with schedule perfor-mance.
= 3 Average schedule performance—The schedule is projected to be within ±5% of plan.
= 4 Good schedule performance—The schedule is projected to be 5 to 10% under plan; the customer is satisfied with schedule perfor-mance.

CMU/SEI-2012-SR-010 | 18
= 5 Very good schedule performance—The schedule is projected to be more than 10% under plan; the customer is very satisfied with schedule performance.
Sched_Conf_0 is an assessment of the confidence of the Sched_perf_0 value, and is based on the number of data sources used to calculate Sched_perf_0 and the level of agreement among those sources. Sched_Conf_0 ranges from 0 to 10, with 0 indicating no confidence in the calculated value of Sched_Perf_0, and 10 indicating very high confidence arising from the presence of all four measures of cost performance (i.e., SPI, schedule data, IMS, customer data) in agreement.
5.2.1 SPI Analysis
SPI data, if available, are analyzed as shown in Figure 8. SPI is a measure of the variance of the
current or projected schedule from a predefined baseline. It is calculated as
= ℎ ℎ ℎ
Essentially, SPI compares the cost of the work that was planned to be accomplished with the cost of the work that really was accomplished. Thus, values less than one represent a delayed schedule (i.e., poor schedule performance) and values greater than one represent an accelerated schedule
(i.e., good schedule performance).
An intermediate schedule performance variable (Sched_Perf_1) is calculated from SPI as follows:
SPI < 0.90 Sched_Perf_1 = 1 >10% schedule delay
0.90 ≤ SPI < 0.95 Sched_Perf_1 = 2 5-10% schedule delay
0.95 ≤ SPI < 1.05 Sched_Perf_1 = 3 within ±5% of schedule
1.05 ≤ SPI < 1.10 Sched_Perf_1 = 4 5-10% schedule acceleration
1.10 ≤ SPI Sched_Perf_1 = 5 >10% schedule acceleration

CMU/SEI-2012-SR-010 | 19
Figure 8: SPI Analysis
We also make an assessment of the reliability of the SPI data based on how the EVMS baseline is managed. After evaluating numerous programs, we identified five strategies commonly used by companies when managing their EVMS baselines:
1. The EVMS baseline is established only at contract initiation. This strategy provides an un-varying reference against which project schedule performance can be measured throughout the execution of the project. Thus, SPI data represent the variance from the schedule budget

CMU/SEI-2012-SR-010 | 20
for the project. SPI calculated using this strategy is reliable, provided that the scope of the project has not changed. If the scope has changed, resulting in a renegotiated budget and schedule, the SPI produced by this strategy is not indicative of project schedule performance.
2. The EVMS baseline is updated whenever a contract change order or renewal is received. This strategy provides a schedule reference aligned with the current contract value. If con-tract change orders are issued to recognize changes in project scope and the associated dif-ferences in project budget and schedule, the SPI calculated from this baseline is reliable. If contract change orders are issued to recognize unanticipated cost or schedule delays not re-lated to a change in project scope, the SPI produced by this strategy is not indicative of pro-ject schedule performance.
3. The EVMS baseline is updated periodically in rolling wave planning. This strategy does not provide a consistent baseline against which schedule performance may be evaluated. SPI produced by this strategy is not indicative of project schedule performance.
4. The EVMS baseline is updated whenever the project is reprogrammed due to a pre-determined cost or schedule variance. This strategy does not provide a consistent baseline against which schedule performance may be evaluated. SPI produced by this strategy is not indicative of project schedule performance.
5. The EVMS baseline is updated at periodic intervals. This strategy does not provide a con-sistent baseline against which schedule performance may be evaluated. SPI produced by this strategy is not indicative of project cost performance.
The only two EVMS baseline strategies that produce SPI values useful for evaluating project schedule performance are Strategies 1 and 2. Strategy 1 produces a reliable SPI only when project scope has not changed. Strategy 2 produces a reliable SPI only when contract change orders have been issued and the changes are unrelated to project scope. By identifying the reason for contract value changes (ΔCV_Source), we can determine the reliability of the SPI produced by either of
these two strategies.
For all of the strategies discussed, the reliability of the resulting SPI is captured in an intermediate cost confidence parameter (Sched_Conf_1), where 0 indicates low reliability and 1 indicates high
reliability.
5.2.2 Schedule Data Analysis
If project schedule data, consisting of the initial project delivery (Sched_initial), the current pro-ject delivery (Sched_current), and the estimated schedule variance to plan (ECD_variance), are available, these schedule data can be used to calculate project schedule performance. This process for gathering data and calculating project schedule performance is shown in Figure 9.

CMU/SEI-2012-SR-010 | 21
Figure 9: Project Schedule Data Analysis
Ideally, we measure cost performance as ℎ _ + _ℎ _
In cases where the project scope has been stable, this calculation is a valid measure of schedule performance. However, a different approach must be taken if the project scope has changed dur-ing the execution of the project, as discussed Section 2. If the project scope has changed,

CMU/SEI-2012-SR-010 | 22
Sched_initial is no longer a valid schedule baseline. Therefore, we must adapt the baseline to the new scope of the project.
If the scope of the project has changed significantly, it is highly likely that contract change orders have been issued that change the contract value to reflect the revised scope. The magnitude of the scope change can be estimated by the ratio between the initial contract value (CV_initial) and the current contract value (CV_current). In such a case, we assess cost performance as
_ _2 = ℎ _ + _ ℎ _ ÷ __
Using contract value as an indicator of scope change creates another possible error source. As noted in Section 2, sometimes contract change orders are issued to recognize project cost over-runs. This type of change order occurs primarily on cost-reimbursable contracts. In these cases, since the change in contract value does not reflect a change of scope, Sched_initial should remain the cost baseline for calculating cost performance.
Once the schedule performance ratio (Sched_Perf_2a) is established, schedule performance
(Sched_Perf_2) is calculated as follows:
Sched_Perf_2a < 0.90 Sched_Perf_2 = 5 >10% schedule delay
0.90 ≤ Sched_Perf_2a < 0.95 Sched_Perf_2 = 4 5-10% schedule delay
0.95 ≤ Sched_Perf_2a < 1.05 Sched_Perf_2 = 3 within ±5% of plan
1.05 ≤ Sched_Perf_2a < 1.10 Sched_Perf_2 = 2 5-10% schedule acceleration
1.10 ≤ Sched_Perf_2a Sched_Perf_2 = 1 >10% schedule acceleration
5.2.3 Customer Schedule Data Analysis
The survey asks for the respondent’s opinion of the customer’s degree of satisfaction with the schedule performance of the project (Sched_Cust). Responses to this question are evaluated as shown in Figure 10. Results (Sched_Perf_4) are scaled from 1 to 5 to correspond with the results of the SPI analysis and schedule data analysis. This process is shown in Figure 10.

CMU/SEI-2012-SR-010 | 23
Figure 10: Customer Schedule Data Analysis
5.2.4 Integrated Master Schedule Data Analysis
If project schedule data from an IMS are available, these data can be used to calculate project schedule performance. The IMS typically represents the schedule data shared with and approved by the acquirer. As such, it represents the acquirer’s schedule expectations. The IMS also usually includes a definition of the project’s critical path (i.e., the longest sequence of linked tasks that must be performed to complete the project). Analysis of the current schedule status with respect to the IMS provides a useful measure of project schedule performance. This analysis process is shown in Figure 11.

CMU/SEI-2012-SR-010 | 24
Figure 11: IMS Data Analysis

CMU/SEI-2012-SR-010 | 25
An intermediate schedule performance variable, Sched_Perf_3a, is calculated from the variance of the IMS critical path schedule as follows:
CP_variance > 6 months late Sched_Perf_3a = 1
CP_variance = 3 to 6 months late Sched_Perf_3a = 1.67
CP_variance = 1 to 3 months late Sched_Perf_3a = 2.33
CP_variance within ±1 month of plan Sched_Perf_3a = 3
CP_variance = 1 to 3 months early Sched_Perf_3a = 3.67
CP_variance = 3 to 6 months early Sched_Perf_3a= 4.33
CP_variance > 6 months early Sched_Perf_3a = 5
A second assessment (Sched_Perf_3b) is made based on overall compliance with the IMS. This parameter is also scaled from 1 to 5. These two parameters (Sched_Perf_3a, Sched_Perf_3b) are linearly combined to form a measure (Sched_Perf_3) that is scaled from 1 (very poor schedule
performance) to 5 (very good schedule performance).
5.2.5 Schedule Reconciliation
After calculation of cost performance measures using SPI, schedule data, customer satisfaction, and IMS data, we combine them to form an integrated measurement of schedule performance. This combination is accomplished using the cost reconciliation process of Figure 12.
From the prior processes, we have
Sched_Perf_1 schedule performance calculated from EVMS SPI data
Sched_Conf_1 assessment of the reliability of Sched_Perf_1
Sched_Perf_2 schedule performance calculated from schedule data
Sched_Conf_2 assessment of the reliability of Sched_Perf_2
Sched_Perf_3 schedule performance calculated from IMS variance
Sched_Conf_3 assessment of the reliability of Sched_Perf_3
Sched_Perf_4 schedule performance calculated from customer satisfaction data
Sched_Conf_4 assessment of the reliability of Sched_Perf_4
Sched_Perf_4 is likely to be available from all respondents. Sched_Perf_1, Sched_Perf_2, and Sched_Perf_3 may or may not be available for any given project. Because the four schedule per-
formance assessments are derived from different data sources, they may or may not agree.
We have increasing confidence in the integrated assessment of schedule performance as we ac-crue more data, and as the accrued data show more agreement. We measure agreement between Sched_Perf_1, Sched_Perf_2, Sched_Perf_3, and Sched_Perf_4 using pairwise comparisons.
Since each variable ranges only from 1 to 5, we define agreement as pairwise difference ≤ 1.
CMU/SEI-2012-SR-010 | 26
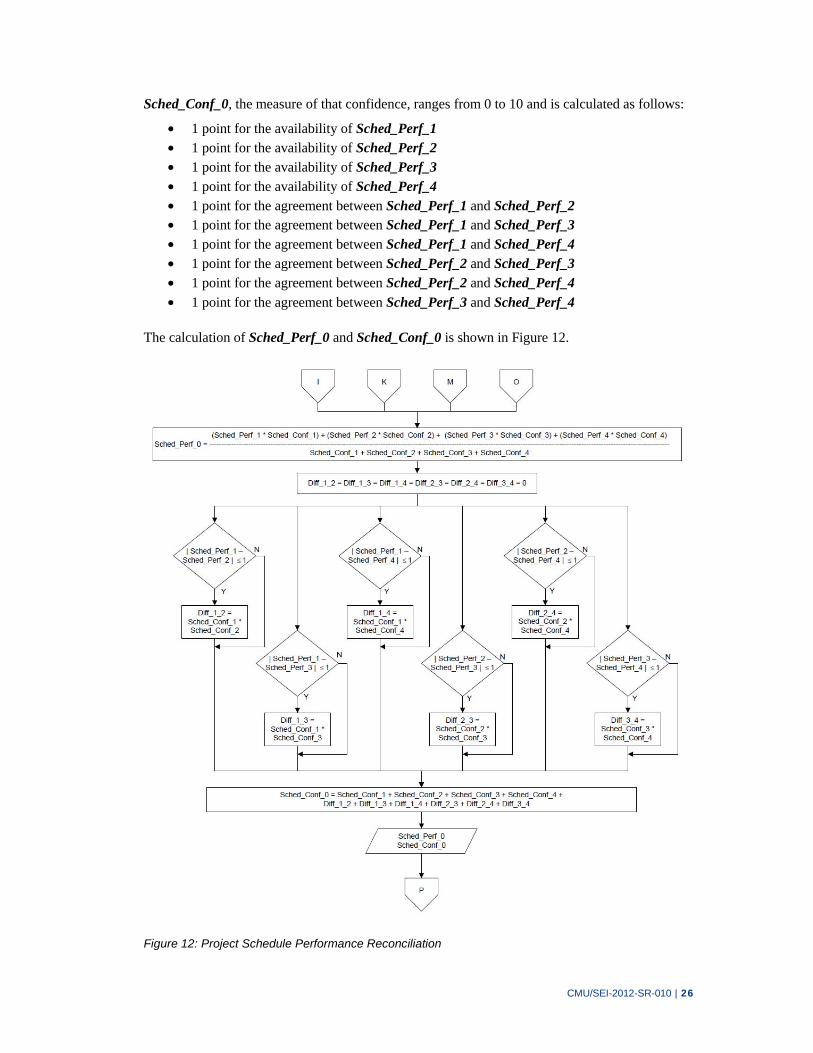
Sched_Conf_0, the measure of that confidence, ranges from 0 to 10 and is calculated as follows:
• 1 point for the availability of Sched_Perf_1 • 1 point for the availability of Sched_Perf_2 • 1 point for the availability of Sched_Perf_3 • 1 point for the availability of Sched_Perf_4 • 1 point for the agreement between Sched_Perf_1 and Sched_Perf_2 • 1 point for the agreement between Sched_Perf_1 and Sched_Perf_3 • 1 point for the agreement between Sched_Perf_1 and Sched_Perf_4 • 1 point for the agreement between Sched_Perf_2 and Sched_Perf_3 • 1 point for the agreement between Sched_Perf_2 and Sched_Perf_4
• 1 point for the agreement between Sched_Perf_3 and Sched_Perf_4
The calculation of Sched_Perf_0 and Sched_Conf_0 is shown in Figure 12.
Figure 12: Project Schedule Performance Reconciliation

CMU/SEI-2012-SR-010 | 27
6 Project Technical Performance
Project technical performance is assessed by asking the two questions shown in Table 3. These questions assess technical performance by examining
1. satisfaction of technical requirement specifications
2. the respondent’s impression of the degree of customer satisfaction with project technical per-formance
Table 3: Technical Performance Assessment Questions
QUESTION RESPONSE
Q1. Requirements are being satisfied and remain on track to be satisfied in the product releases as originally planned; they are not being deleted or deferred to later releases.
Reqts_sat
Strongly Disagree
Disagree
Agree
Strongly Agree
Q2. I believe that my customer is satisfied with this project's performance with respect to technical requirements.
Reqts_Cust
Strongly Disagree
Disagree
Agree
Strongly Agree
Responses to these questions are linearly combined to generate an assessment of technical per-formance (Tech_Perf_0) as shown in Figure 13.

CMU/SEI-2012-SR-010 | 28
Figure 13: Technical Performance Analysis

CMU/SEI-2012-SR-010 | 29
7 Conclusion
This systems engineering effectiveness study uses anonymous and confidential survey techniques to collect information used to assess the performance of development projects. Information col-lected includes the following:
1. the difference between the initial budget and the current estimated cost at completion
2. CPI from an EVMS
3. the respondent’s impression of the degree of customer satisfaction with project cost
4. the difference between the initial completion date and the current estimated completion date
5. SPI from an EVMS
6. variance from the approved IMS
7. the respondent’s impression of the degree of customer satisfaction with project cost
8. satisfaction of technical requirement specifications
9. the respondent’s impression of the degree of customer satisfaction with project technical per-formance
This information is used to calculate measures of project cost performance, project schedule per-formance, and project technical performance. These three measures are combined to produce a measure of overall project performance. All of these measures are used to identify the relation-ships between the application of specific systems engineering practices and project performance.

CMU/SEI-2012-SR-010 | 30

CMU/SEI-2012-SR-010 | 31
References
URLs are valid as of the publication date of this document.
[Elm 2008] Elm, J.; Goldenson, D.; El Emam, K.; Donatelli, N.; & Neisa, A. A Survey of Systems Engineering Effectiveness—Initial Results (CMU/SEI-2008-SR-034). Software Engineering Institute, Carnegie Mellon University, 2008. http://www.sei.cmu.edu/library/abstracts/reports/08sr034.cfm
[Elm 2012] Elm, J. & Goldenson, D. The Business Case for Systems Engineering Study: Results of the SE Effectiveness Survey. (CMU/SEI-2012-SR-009). Software Engineering Institute, Carnegie Mellon University, 2012. http://www.sei.cmu.edu/library/abstracts/reports/12sr009.cfm
[Elm 2013] Elm, J. & Goldenson, D. The Business Case for Systems Engineering Study: Detailed Response Data. (CMU/SEI-2012-SR-011). Software Engineering Institute, Carnegie Mellon University, 2013. http://www.sei.cmu.edu/library/abstracts/reports/12sr011.cfm

REPORT DOCUMENTATION PAGE Form Approved OMB No. 0704-0188
Public reporting burden for this collection of information is estimated to average 1 hour per response, including the time for reviewing instructions, search-ing existing data sources, gathering and maintaining the data needed, and completing and reviewing the collection of information. Send comments regard-ing this burden estimate or any other aspect of this collection of information, including suggestions for reducing this burden, to Washington Headquarters Services, Directorate for information Operations and Reports, 1215 Jefferson Davis Highway, Suite 1204, Arlington, VA 22202-4302, and to the Office of Management and Budget, Paperwork Reduction Project (0704-0188), Washington, DC 20503.
1. AGENCY USE ONLY
(Leave Blank)
2. REPORT DATE
December 2012
3. REPORT TYPE AND DATES COVERED
Final
4. TITLE AND SUBTITLE
The Business Case for Systems Engineering Study: Assessing Project Performance from Sparse Data
5. FUNDING NUMBERS
FA8721-05-C-0003
6. AUTHOR(S)
Joseph P. Elm
7. PERFORMING ORGANIZATION NAME(S) AND ADDRESS(ES)
Software Engineering Institute Carnegie Mellon University Pittsburgh, PA 15213
8. PERFORMING ORGANIZATION REPORT NUMBER
CMU/SEI-2012-SR-010
9. SPONSORING/MONITORING AGENCY NAME(S) AND ADDRESS(ES)
AFLCMC/PZE/Hanscom Enterprise Acquisition Division 20 Schilling Circle Building 1305 Hanscom AFB, MA 01731-2116
10. SPONSORING/MONITORING AGENCY REPORT NUMBER
11. SUPPLEMENTARY NOTES
12A DISTRIBUTION/AVAILABILITY STATEMENT
Unclassified/Unlimited, DTIC, NTIS
12B DISTRIBUTION CODE
13. ABSTRACT (MAXIMUM 200 WORDS)
This report describes the data collection and analysis process used to support the assessment of project performance for the systems engineering (SE) effectiveness study being conducted by the Software Engineering Institute (SEI), the National Defense Industrial Asso-ciation (NDIA) Systems Engineering Division, and the Institute of Electrical and Electronic Engineers (IEEE) Aerospace and Electronic Systems Society. This study seeks to identify relationships between the application of specific systems engineering practices on devel-opment projects, and the performance of those projects, as measured by their satisfaction of budget, schedule, and technical require-ments.
14. SUBJECT TERMS
project performance, systems engineering
15. NUMBER OF PAGES
46
16. PRICE CODE
17. SECURITY CLASSIFICATION OF REPORT
Unclassified
18. SECURITY CLASSIFICATION OF THIS PAGE
Unclassified
19. SECURITY CLASSIFICATION OF ABSTRACT
Unclassified
20. LIMITATION OF ABSTRACT
UL NSN 7540-01-280-5500 Standard Form 298 (Rev. 2-89) Prescribed by ANSI Std. Z39-18
298-102