the business environment, education and entrepreneurship in …€¦ · · 2015-09-13the business...
TRANSCRIPT

1
The Business Environment, Education and Entrepreneurship in Low Income Countries
Zuzana Brixiová ᵃ and Mthuli Ncube ᵇ 1
University of Cape Town and IZA
ᵇ University of Oxford
Abstract
This paper presents a model of costly firm creation in an economy with unconducive business
environment and skill gaps where an equilibrium outcome can be a low-productivity trap. The
model reflects several key stylized facts from the urban labor markets in low income countries
where subdued rates of productive entrepreneurship can co-exist with high output growth.
Substantial improving the business environment would help raise the entrepreneurial productivity
especially if other bottlenecks such as skill shortages addressed. We test model on the World Bank
Enterprise Survey for Ethiopia and aggregate data for entrepreneurship, education and governance.
Key words: Model of start-ups, productivity, low income countries, multivariate analysis
JEL classification: L26, J24, J48, O17
1 The authors are grateful to Zorobabel Bicaba for help with cross-country regressions. They also thank Emerta
Asaminew and Andreas Wörgötter for comments and discussions. Earlier versions were presented at seminars at the
African Development Bank, CERGE-EI, and at the African Economic Conference (Addis Ababa). The views
expressed are those of the authors and do not necessarily reflect those of the African Development Bank.

2
1. Introduction
Policymakers in low income countries (LICs) have for a long time viewed productive
entrepreneurship to be a key part of their strategies for inclusive growth. In contrast to necessity
(or subsistence) entrepreneurship aiming at survival, opportunity entrepreneurship can help people
escape poverty and contribute to development (Bruton et al., 2013).2 In many LICs, however,
emergence of opportunity entrepreneurship and its contribution to growth and job creation has
been limited. One of the reasons is the low competitiveness, stemming in part from an overall
weaker business environment and larger skill gaps in LICs than in more advanced economies.
To encourage entrepreneurship, policymakers in LICs have been reforming their business
environments and educational systems, especially in the context of the relatively low global growth
and declining trade. To guide these efforts, the Global Entrepreneurship Monitor (GEM) group
has developed ‘Entrepreneurship Enabling Conditions’ framework, which clusters the factors
conducive to entrepreneurship into: (i) basic requirements (e.g. institutions, infrastructure,
macroeconomic stability and human capital); (ii) efficiency enhancers (e.g., higher education,
goods and labor market efficiency, financial sector, technological readiness and market size and
(iii) innovation and entrepreneurship policies (e.g., entrepreneurial finance, R&D transfer, etc.).
Drawing on this framework, this paper examines the role of the business environment and skills
for firm creation and performance in the LICs.3 It presents a model of start-ups in an economy
with a rigid business environment, skill gaps, and matching frictions; the model is an extension of
Brixiová (2013) and builds on Snower (1996).4 The paper summarizes key stylized facts of the
urban labor markets in the LICs such as Ethiopia and shows how an economy can end up in a low-
productivity equilibrium, where the overall less productive informal sector provides most of
employment. The results of the model are tested on the World Bank aggregate data for
entrepreneurship, education and governance and the Enterprise Survey data of Ethiopia. Both
theoretical and empirical results suggest that to move the economy into a productive equilibrium,
the complementarity matters. Specifically, reforms to the business environment tend to be more
effective in creating productive firms when accompanied by narrowing skill gaps and vice versa.
The rest of the paper is organized as follows. Section 2 gives stylized facts on entrepreneurship
and the labor market in low income countries. Section 3 presents the model and policy analysis.
Section 4 tests the model on World Bank data from low income and other developing countries.
Section 5 concludes.
2 Other papers that view entrepreneurship as a part of solution to poverty include Anderson et al. (2010), Brixiová
(2010), McKague and Oliver (2012), Bandiera et al. (2013), Bruton et al. (2013) and Tobbias et al. (2013). 3 Focus is on productive entrepreneurship, as its shortage constrains LICs’ income catch up with advanced economies.
The concept of the business environment utilized in this paper includes both basic institutions and infrastructure as
well as greater product and labor market flexibility and access to finance. 4 The paper draws on several streams of the literature. First, is the literature on market failures and externalities in the
labor markets, as in, for example, Snower (1996) who showed that labor market failures lead to suboptimal outcomes
in developed countries. Second, it draws on the literature on the business environment and productivity in developing
and transition economies, as in Brixiová and Egert (2012) and Bah and Fang (2015). Third, the paper is related to the
literature on education and entrepreneurship, recently applied to Malawi by Kolstad and Wiig (2015).
3
2. The Stylized Facts
This section presents several stylized facts on the quality of the business environment, education
and the new firm creation. It utilizes data from the LICs and Ethiopia to gauge association between
the business environment, in particular regulatory quality, educational attainments (proxy for
skills) and entrepreneurial start-ups (e.g., entrepreneurship data from the World Bank).5
(i) Constraints to Entrepreneurship in Low Income Countries
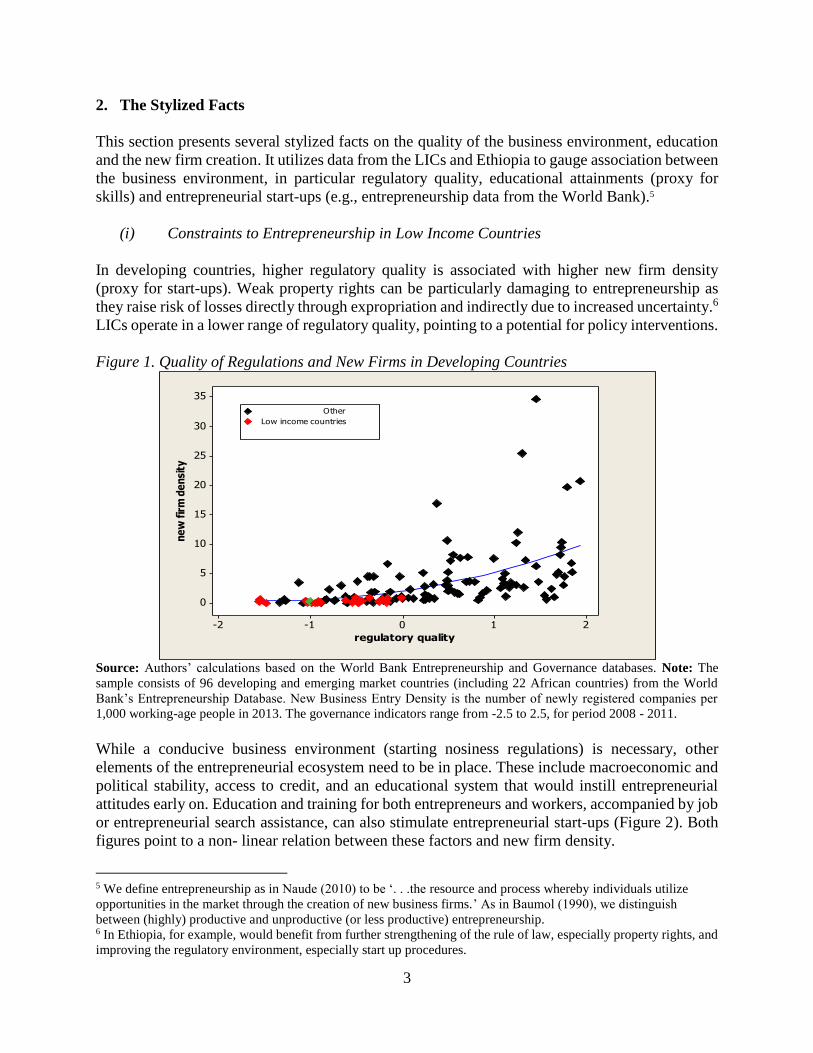
In developing countries, higher regulatory quality is associated with higher new firm density
(proxy for start-ups). Weak property rights can be particularly damaging to entrepreneurship as
they raise risk of losses directly through expropriation and indirectly due to increased uncertainty.6
LICs operate in a lower range of regulatory quality, pointing to a potential for policy interventions.
Figure 1. Quality of Regulations and New Firms in Developing Countries
210-1-2
35
30
25
20
15
10
5
0
regulatory quality
ne
w f
irm
de
nsi
ty
Other
Low income countries
Source: Authors’ calculations based on the World Bank Entrepreneurship and Governance databases. Note: The
sample consists of 96 developing and emerging market countries (including 22 African countries) from the World
Bank’s Entrepreneurship Database. New Business Entry Density is the number of newly registered companies per
1,000 working-age people in 2013. The governance indicators range from -2.5 to 2.5, for period 2008 - 2011.
While a conducive business environment (starting nosiness regulations) is necessary, other
elements of the entrepreneurial ecosystem need to be in place. These include macroeconomic and
political stability, access to credit, and an educational system that would instill entrepreneurial
attitudes early on. Education and training for both entrepreneurs and workers, accompanied by job
or entrepreneurial search assistance, can also stimulate entrepreneurial start-ups (Figure 2). Both
figures point to a non- linear relation between these factors and new firm density.
5 We define entrepreneurship as in Naude (2010) to be ‘. . .the resource and process whereby individuals utilize
opportunities in the market through the creation of new business firms.’ As in Baumol (1990), we distinguish
between (highly) productive and unproductive (or less productive) entrepreneurship. 6 In Ethiopia, for example, would benefit from further strengthening of the rule of law, especially property rights, and
improving the regulatory environment, especially start up procedures.

4
Figure 2. Education and New Firms in Developing Countries
1086420
25
20
15
10
5
0
education_m
new
_de
nsi
tyOther
Low income countries
Source: Authors’ calculations based on the World Bank Entrepreneurship and Governance databases. Note: The
sample consists of 96 developing and emerging market countries (including 22 African countries) from the World
Bank’s Entrepreneurship Database. New Business Entry Density is the number of newly registered companies per
1,000 working-age people in 2013. The governance indicators range from -2.5 to 2.5, for period 2008 - 2011.
(ii) The Example of Ethiopia
Ethiopia’s ‘developmental state’ model has several unique features, including the key role of the
state sector in the non-agricultural output and high growth are combined with low productive
private sector employment, labor market mismatches, a constraining business environment and
relatively low overall educational attainments.7 The sections below highlight main stylized facts.
High Growth, Low Labor Productivity
At an average annual growth of 10.6 percent, Ethiopia was one of the fastest growing countries in
the world in 2005 - 2014. Growth was driven mostly by the modernization of agriculture, public
investment, the expansion of low value-added services (Geiger and Moller, 2013) and recently
also large-scale manufacturing. Wide productivity gaps with East Asian economies and some
African frontier markets persist (McMillan and Rodrik (2011).). The overall low productivity is
partly explained by the sectoral distribution of employment where agriculture accounts for 78 %
of employment (Martins, 2014). In contrast, productive entrepreneurship and SMEs have been
limited, raising doubts about growth sustainability (World Bank, 2014a).8
Constraining Business Environment
The lack of an enabling business environment have contributed to the suppressed private sector.
As Lopez-Garcia (2009) noted for transition economies, the two main barriers to firm creation tend
to be the administrative burdens related to starting a business and access to finance, while the
7 Similarly to other LICs, the informal sector accounts for a large share - 45-50 percent - of the urban employment. 8‘…Ethiopia pursues a public sector-led growth strategy that focuses on promoting growth through high public
investment…’ (IMF, 2012, page 4).

5
government interference and taxes impact the expected profit and firm survival. These are also the
main barriers in Ethiopia.9 For example, minimum capital required to start a business in Addis
Ababa amounts to 10 times GNI per capita. Another area that need strengthening is registering
property, to ensure property right and facilitate formation of collateral and access to finance. In
2015, Ethiopia ranked as number 104 out of 189 countries (World Bank, 2014b).
Skill Shortages
A possible contributing factor to the low entrepreneurial rates is the overall low level of education,
as the success rates and sustainability of early-stage entrepreneurs are positively correlated with
their educational attainment. The level of education, and entrepreneurial education, in Ethiopia is
lagging other low income countries in SSA (Table 3). The skill shortages have been amplified by
an ineffective labor market matching of skilled workers and vacancies (Denu et al, 2005).
Table 1. Entrepreneurial Education and Training in Selected LICs
Source: Herrington and Kelley (2013). Note: Answers are experts’ opinions from surveys conducted by the Global
Entrepreneurship Monitor, measured on an increasing scale from 0 (lowest score) to 5 (highest score). Note: Since
2010, Ghana has been classified as a middle income country.
The education and the environment that individuals are exposed to are key for their entrepreneurial
aptitude (Ncube, 2005). In the Ethiopian universities, entrepreneurship is still in its early phase
and concentrated mostly in business schools and agricultural colleges. Entrepreneurship promotion
centers are scarce. The country thus needs to integrate entrepreneurship in the curricula while
establishing centers of entrepreneurial excellence (Gerba, 2012).
Limited Entrepreneurial Activity
The Global Entrepreneurship Monitor 2013 study lists Ethiopia as having one of the lowest rates
of entrepreneurial activity in SSA, including among the LICs. Only 15% of the adults were starting
or running a new business in 2012, compared to the average of 28% of adults for countries in the
region. Further, in Ethiopia, only 10 % of adults were running established businesses relative to
the regional average of 13 % (Table 2). Only 24 % of adults intended to create a firm, which is
9 This paper considers the access to finance as part of the broader business environment.
ETH SSA av. GHA MLW NIG UGA ZAM
Primary and secondary education:
encourages creativity, self-sufficiency and
initiative 1.9 2.3 2.3 2.3 1.9 1.9 2.2
gives adequate attention to
entrepreneurship and new firm creation 2.3 2.0 2.8 2.9 2.7 2.3 2.8
Universities
provide good and adequate preparation for
starting up and growing new firms 1.8 2.5 2.3 2.9 2.6 1.8 2.3
Business and management education
provide good and adequate preparation for
starting up and growing new firms 2.1 2.7 2.8 3.1 2.3 2.1 2.8
Vocational and professional education
provide good and adequate preparation for
starting up and growing new firms 2.6 2.9 3.0 3.3 2.8 2.6 3.0

6
less than half of the region’s average of 53 %. This is consistent with the observation that about
50 large and medium-sized firms play a key role in the economy (Sutton and Kellow, 2010).
Table 2. Entrepreneurial Activity in Selected LICs, 2012
Source: Herrington and Kelley, 2013. Note: Since 2010, Ghana has been classified as a middle income country.
3. The Model and Policy Analysis
This section develops a model illustrating the role of an enabling business environment and skills
for stimulating productive entrepreneurship, reflecting the above shortages.
3.1 The Environment
The population is normalized to one. There are two types of agents, entrepreneurs and workers,
with population shares and , respectively. They live for one period, are endowed with one
unit of time and amount of consumption good, and have preferences, , where denotes
consumption good and E the expectations agents form at the beginning of the period.
Entrepreneurs
At the beginning of the period, entrepreneurs search for opportunities to open productive firms in
the private sector. This search costs them 2/2
21 xx , 0, 21 , units of the consumption good
and results in the probability x of finding a business opportunity with productivity per worker .
They can turn a business opportunity into a highly-productive firm by hiring skilled workers.
Denoting as number of entrepreneurs searching for skilled workers, the matching h of the
aggregate skilled vacancies, , with skilled workers, , follows:
(1)
where h is the total number of matches and A denotes matching efficiency. Entrepreneurs with a
high-productivity business opportunity find skilled workers with probability .10
10 As Snower (1996) points out, when firms are imperfectly informed about the availability of skilled workers, even
skills that are useful to all firms are not general since not all firms have access to these workers. In (1) to reflect
imperfections in the matching process.
Nascent New Established
Ethiopia 6 9 10
Ghana 15 23 38
Malawi 18 20 11
Nigeria 22 14 16
Uganda 10 28 31
Zambia 27 15 4
Entrepreneurs (% of working age population)
1
w )(cE c
sz
sn
pm
sps nmV sN
];min[];min[ spsss nmNAVNAh
]1,min[s
s
V
NA
1A

7
After finding a highly-productive business opportunity and skilled workers, entrepreneurs pay
start-up cost Fc (e.g. licensing fee, land and building lese, etc.) and produce output according to
(2). The output depends on the productivity level, 0sz , and the quality of the business
environment in the formal sector, , .11 Firms in the formal sector pay profit tax
and earn after-tax profit:
))(1( F
ssss
FF cnwnz (2)
Where sw is the wage of skilled workers (in the formal sector), determined through bargaining.
Entrepreneurs who do not find highly-productive opportunities or skilled workers open low-
productivity firms in the informal sector, with productivity per worker of . The entrepreneurs’
productivity is further lowered by the business climate factor in the informal sector where
.12 The entrepreneurs employ unskilled workers, , where , that is
firms in the informal sector are smaller. Entrepreneurs in the informal sector do not pay taxes, but
are subjected to tax monitoring and full confiscation for tax evasion. Their profit amounts to:
))(1( I
uuuu
Iu cnwnz (3)
where is the wage of an unskilled worker in a low-productivity, informal firm, which equals
the income, b, of the self-employed in the informal sector, and is the probability that the firm’s
tax evasion is detected by the tax authority. In sum, are productivity levels in high-
productivity firms (in the formal sector), low-productivity firms (in the informal sector), and self-
employed, respectively.
Workers
When acquiring skills demanded in the highly productive private firms, workers incur cost,
2/)( 2qqk where is the cost parameter. Their effort results in probability q of obtaining
skills13 and probability of finding a job in a highly productive firm. Workers who
do not obtain skilled jobs work in the informal sector, either as self-employed or in a low-
productive firm. In both cases they earn income .
11 More generally,
F reflects quality of formal institutions. Amoros (2009) shows empirically that differences in
institutional quality help explain differences in entrepreneurship across countries. 12 Dethier at al. (2011) observethat not only can better business environments cause firms to be more efficient, but that
also that inherently more efficient firms choose better business environments. 13 x (and q) are between 0 and 1. Despite their efforts, workers (entrepreneurs) occasionally fail to acquire skills (find
business opportunities).
F 10 F
uzI
10 FI un su nn 0
uw
0 bzz us
0
]1,min[s
s
N
VA
swb

8
While the market for unskilled workers is perfectly competitive, wages for the skilled workers are
set through decentralized bargaining between the skilled workers and the productive private firms.
If bargaining does not lead to an agreement, the workers would receive income from self-
employment in the informal sector, . The outcome of decentralized bargaining depends on the
relative strength of the skilled worker and the firm, :
bzw us
F
s )1()( (4)
The wage gap between skilled and unskilled jobs amounts to )( bz us
F .
The Labor Market Clearing Conditions
The characterization of the environment is completed by the labor market equilibrium conditions.
Denoting as the share of entrepreneurs running low-productivity firms and employ the
unskilled workers, the market clearing condition for the entrepreneurs is:
pu mm (5)
Denoting sn to be the total number of skilled labor employed in the formal private sector,
the total unskilled labor in the informal sector, and as the total number of self-
employed in the informal sector, the labor market equilibrium condition for workers is:
ius nnn 1 (6)
3.2 Multiple Equilibria
An equilibrium in this economy is defined as an allocation of entrepreneurs and workers and wage
rate such that: (i) each entrepreneur chooses the effort x put into search for business opportunities;
(ii) each workers chooses effort q put into acquiring skills; (iii) wage rate is set through Nash
bargaining as in (4); and (iv) labor market clearance conditions are met.14
In equilibrium, the marginal cost of entrepreneur’s search for a business opportunity equals the net
profit as in Equation (7). Similarly, the worker’s marginal cost of acquiring skills equals the
expected difference between a skilled wage and alternative income, given by (8): 15
)(1;)1(
min)(21 us
s
usnx
qAx
(7)
14 It is straightforward to show that depending on the parameters, the model either has (i) a unique ‘low-productivity’
equilibrium where workers and entrepreneurs exert zero effort or (ii) one ‘low productivity’ and one ‘high
productivity’ equilibrium with positive efforts by workers and entrepreneurs. 15 In (7) and (8), the number of skilled vacancies is , where is the number of entrepreneurs who
found a highly productive business opportunity. Similarly, the number of skilled workers searching is .
b
um
uuu nmn in
ss nxV xmp
qN s )1(

9
)(1;)1(
min)( us
s
s wwq
nxAbwq
(8)
and sw specified in Equation (4). Equations (7) and (8) can be obtained by solving entrepreneur´s
and worker´s problems, together with the labor market clearing conditions (5) and (6). In (7),
021 x denotes the marginal cost of entrepreneurial search.
The equilibria form at the intersections of the entrepreneurs’ ‘search curve’ as in (7) and workers’
‘training curve’ given by (8) and (4). The system described by (4), (7) and (8) can lead to two
equilibria: (i) a low-productivity equilibrium, where entrepreneurs exhort limited effort to start
firms and (ii) a high-productivity equilibrium with higher effort by entrepreneurs.
Low Productivity Equilibrium
The first equilibrium is the low productivity trap, where – under a shortage of private firm, i.e.
qnx s )1( – the business environment (i.e. tax rates, start – up cost, search cost) is such that
Aus /1 . Equation (7) shows that in such environment where difference between in profit
between running high and low productivity firm is small, entrepreneurs will not search for highly
productive business opportunities, i.e. x = 0. Equation (8) in turn shows that workers will not
acquire skills i.e. q = 0. The economy will thus consist only of low-productive firms and unskilled
workers, both operating in the informal sector.16 As Snower (1996) emphasized for the case of
developed countries, when the economy is in a low-productivity equilibrium (or ‘low-skill, bad-
job trap’), the need for public stimulus rises markedly relative to other equilibrium cases.
High Productivity Equilibrium
The second, high productivity equilibrium comprises both positive entrepreneurial search and
workers’ learning efforts (x, q>0). A pre-condition is a business environment conducive enough
so that profits in the highly productive private firms employing skilled workers sufficiently higher
than those in productive firms with unskilled workers, i.e. 0 us . In this equilibrium, the
economy consists of both high productivity private firms in the formal sector, low productivity
firms in the informal sector as well as self-employed workers in the informal sector.
3.3 Policy Analysis
In this section, we relate the key parameters of our model to evidence on the business environment
in Ethiopia and other low income countries.
16 The second case is when the share of skilled workers is below that or same as the share of skilled vacancies, i.e.
nxq )1( . When bww us , that is
s
uF
z
b
, unskilled workers will not have incentives to obtain
training. The absence of the skilled workers will remove incentives for entrepreneurs to search for business
opportunities requiring skilled workers.

10
During a start-up phase, each entrepreneur searches for a business opportunity. After a suitable
opportunity is identified, the entrepreneurs need to turn it into productive firms. At this stage, they
can be hampered by cumbersome registering and licensing procedures, stringent hiring regulations,
and the lack of skilled workers, among other factors. The ability of the legal framework to protect
property rights is equally important, as it influences the expected profit and hence effort that
entrepreneurs put into search. The entrepreneurs also consider the state of the financial
infrastructure such as development of capital markets, control of corruption, and effectiveness of
the government during their start-up phase (Ncube, 2005).
Improving the Business Environment
This section underscores the impact of improved business environment on (i) entrepreneurs’ search
for highly-productive business opportunities; and (ii) workers’ effort to acquire skills. It follows
from (4), (7) and (8) that in the case of shortage of skilled vacancies, snxq )1( , a better
business environment (e.g. higher F and lower ) will encourage entrepreneurs to intensify their
search effort (x) for productive business opportunities. This in turn, will incentivize unskilled
workers to acquire skills.17 A more intense search by entrepreneurs due to improved business
environment and the subsequent additional learning efforts by workers will result in a higher
number of productive firms, increased output, and additional productive employment.
Reforming Property Rights
Unclear property rights, which imply a possibility of expropriation (where ), are an
important component of the business climate in many low income countries. Denoting probability
of expropriation as , the efficiency coefficient in the production function changes to
.0)1( FF Entrepreneurs are more likely end up running low productivity firms in the
informal sector, as the expected profit in the formal sector is reduced by the possibility of
expropriation. The reverse also holds – if improvements to property rights are sufficiently large,
entrepreneurs who will increase their search effort and more likely end up in the formal sector.
Given two negative externalities (searching and learning) that characterize the low-productivity
trap, sizeable interventions both on the side of business environment (generating labor demand)
and training (improving quality of labor supply) are needed. The non-linearity in the searching and
learning are key for prioritizing interventions. Specifically, policies should first target the most
significant constraint to the creation of productive firms. In sectors or communities with shortages
of productive firms, policies should focus on better business environment to encourage
entrepreneurial search. In (some high-tech) sectors characterized by skill shortages, interventions
17 More formally, from (2) 0
F
F
s
and
F
s, 0
F
s. From (7) the entrepreneurial search effort x becomes
/)( u
F
sAx if skilled jobs are scarce. Hence 0
F
x
and 0,
xx . From (8) then 0
x
q.
0F

11
encouraging training should be prioritized. Since the binding constraint may be changing over
time, complementary, and well-sequenced, policies would be most effective.
3.4 Illustrative Numerical Solution
To illustrate the impact of policies such as improved functioning of the labor market, A, and a
better business environment, , as well as lower cost of search for business (or entrepreneurs’
skills), , this section provides a numerical example. The baseline parameters are set in Table 3;
these values were set to yield the share of informal sector employment in total employment of 50
percent and of formal sector firms in total firms of 29 percent.18
Table 3. Baseline Parameters Parameter A b
Value 0.5 0.3 0.1 0.1 1 0.55 0.4 0.5 4 2 2 1 0.2 0.35
The indicative elasticity of informal sector employment to changes in each of the business
environment variable ( FA ,, ) is calculated by changing values of these variables by 20 percent
and computing the new informal employment rate (Table 4).
Table 4. Elasticities of Key Outcomes w.r.t. Changes in the Business Environment Variable New
value
New share
of formal
firms
New share
of informal
employment
Elasticity of informal and
unskilled employment to 20 %
change in variable
% of total % change
A 0.60 35 40 -20.0 1.20 32 45 -9.4
0.65 37 36 -27.1
The results in Table 3 indicate that the 20 % improvement in the business environment would
reduce employment in the informal sector by 27 % with a corresponding increase in productive
employment. Improvements in the job matching would have similar impact.
4. Empirical Analysis
4.1 Drivers of Entrepreneurship Globally and in LICs
This section utilizes multivariate regression analysis to find out whether the number of start-ups
(e.g., new firm density) is related to the quality of the business environment and education level.19
18 Parameters are chosen to match the limited available information. For example, the wage of unskilled workers in
the informal sector amounts to 30-40 percent of the wage of the skilled workers, and the wage gap between skilled
workers in the formal and informal sector. 2005, is 30 percent. 19 Data sources are: the World Bank’s Knowledge assessment methodology database (for education), the World
Bank’s governance database (for regulatory quality and the rule of law), and the World Bank’s entrepreneurship
database (for the new form density per 1,000 population).
F
F I sn un sz uz
F

12
The basic empirical equation is specified as follows:
iiiiii ControlenvessBuEducEducDensity _sin... 2
1 (9)
The main findings are that entrepreneurship is positively associated with education and the
financial sector development, but is negatively related to countries’ low or lower-middle income
level. Further, increased educational levels have diminishing effect on entrepreneurship, as shown
in our model and stylized facts in Section 2 (Table 7, columns 1-4). However, in this specification
we have not found direct impact of the business environment (other than the financial sector
development) on entrepreneurship.
To find out if there is complementary effect between education and the business environment, as
suggested by the results of the model in Section 3, we use two approaches. First, we generate
variable equal to the product of education and the business environment or the rule of law (in
levels): ii envessBuEduc _sin* . A positive coefficient indicates that a better business
environment raises the positive effect of additional education (skills) on entrepreneurship.
iiiiiii ControlenvessBuenvessBuEducEducDensity _sin._sin*. (10)
The second approach accounts for the heterogeneity among countries by having the effect of the
business environment to depend on whether it is below or above the medium in the sample:
Otherwise
envessBuMedianenvessBuifmedenvBus
ii
i0
)_sin(_sin1__. (11)
Equation (10) is then written as:
iiiiiii ControlmedenvessBumedenvBusEducEducDensity __sin.__*. (12)
Our model posits that the effect of skills (proxied by education) on entrepreneurship (new firm
density) varies with the quality of the business environment achieved. To capture this
heterogeneity, we estimate marginal effect of an interaction variable between education and the
business environment. Education indeed has a positive effect on new firm density, but its marginal
effect decreases as the as the quality of the business environment (the quality of regulations and
the rule of law) rise. As previously, entrepreneurship is positively related to the financial sector
development but negatively to countries’ low or lower-middle income level (Table 5, columns 5-
6). To put differently, when the quality of the business environment is very low (and below
median), the effectiveness of educational improvements on entrepreneurship is diminished.

13
Table 5. New firms density, Education and Business environment, full sample
Dependent variable (1) (2) (3) (4) (5) (6)
New firm density
Educ 1.188** 1.132** 1.152** 1.159** -0.789* -0.684*
(0.559) (0.545) (0.571) (0.550) (0.426) (0.401)
Educ^2 -0.146** -0.135** -0.140** -0.138**
(0.0667) (0.0645) (0.0692) (0.0666)
Educ*regulatory env.
(below median) 0.821**
(0.379)
Educ*rule-law (below
median) 0.657*
(0.352)
Regulatory env. 0.532
(0.866)
Rule-law -0.272
(0.915)
Regulatory (below
median) -0.577 -5.239**
(0.864) (2.325)
Rule-law (below
median) 0.874 -2.589
(1.251) (2.062)
Domcredit _gdp 0.0512** 0.0582** 0.0541*** 0.0585*** 0.0553*** 0.0596***
(0.0225) (0.0240) (0.0192) (0.0199) (0.0196) (0.0206)
Africa 0.641 0.748 0.741 0.784 0.604 0.387
(0.745) (0.794) (0.716) (0.759) (0.666) (0.807)
Low_income -1.274 -1.831* -1.305 -2.131* -1.537 -2.648**
(1.008) (1.098) (0.979) (1.160) (0.997) (1.138)
Lower_midincome -2.279** -2.733*** -2.319** -2.968*** -2.313** -3.215***
(0.932) (1.019) (0.903) (1.038) (0.957) (1.065)
Constant -0.751 -0.846 -0.531 -1.287 5.717** 4.352*
(1.758) (1.667) (1.899) (1.852) (2.432) (2.242)
Observations 90 90 90 90 90 90
R-squared 0.462 0.460 0.461 0.463 0.457 0.453
Note: Robust standard errors in parentheses. *** p<0.01, ** p<0.05, * p<0.1
We repeat this exercise on the sub-sample of low and middle income countries. Higher education
and better business environment (higher quality regulations) are associated with higher rates of
entrepreneurship. The variable Educ*law(<median) (resp. Educ*regulation(<median)) indicates
whether the effect of education depends on the quality of the role of law (resp. regulatory quality).
Column 6, Table 6 shows that in low and middle income countries, education has a higher effect
with better enforcement of the rule of law.

14
Table 6. New firms density, Education and Business environment, low income countries
Dep. var : (1) (2) (3) (4) (5) (6)
New firm density
Education 0.922* 1.089** 0.934* 1.179** 0.547** 0.592**
(0.478) (0.484) (0.491) (0.503) (0.237) (0.249)
Education^2 -0.0765 -0.0889 -0.0654 -0.0940
(0.0580) (0.0573) (0.0580) (0.0588)
Educ*regulation(<median) -0.296
(0.236)
Educ*law(<median) -0.374*
(0.218)
Regulatory_quality 1.591***
(0.589)
Rule-law 1.283
(0.799)
Regulatory(<median) -1.048** 0.0220
(0.518) (1.094)
Rule-law(<median) -1.589** 0.0115
(0.629) (0.873)
Domcredit_gdp 0.0263 0.0270 0.0364 0.0276 0.0371 0.0297
(0.0258) (0.0302) (0.0244) (0.0237) (0.0243) (0.0240)
Africa 1.063 0.810 1.253 0.781 1.217 0.853
(0.752) (0.805) (0.829) (0.901) (0.796) (0.881)
Constant -1.224 -1.349 -1.648 -1.241 -1.553 -1.076
(1.168) (1.528) (1.151) (1.187) (1.235) (1.211)
Observations 58 58 58 58 58 58
R-squared 0.330 0.312 0.294 0.321 0.295 0.318
Note: Robust standard errors in parentheses. *** p<0.01, ** p<0.05, * p<0.1
4.2 The Example of Ethiopia
This section presents empirical results from the World Bank Enterprise Survey of the urban
Ethiopia.20 It examines entrepreneurial performance (sales) based on the actual and perceived
business environment as well as education. Based on the model, the average sales performance,
defined as uu
I
ss
F nznzsales )1( , and hence depends directly on the business
environment and indirectly, through probability of finding a skilled worker, on education.
Below we present the kernel density estimates of the probability density function of (log of) annual
sales for entrepreneurial firms (micro and small enterprises with less than 20 employees). They
examine if the business environment impacts positively average annual sales. Figure 3a shows that
almost the entire probability density function shifts to the right for MSEs operating under a
government contract relative to those without such contract. Further, at higher sales ranges,
registered firms outperformed unregistered ones (Figure 3b), indicating that being registered and
having government contract – which could help avoid regulations -- may be beneficial for sales.
20 The 2011 World Bank Enterprise Survey of Ethiopia consists of 150 enterprises in the manufacturing and service
sectors in Addis Ababa, of which 117 enterprises were micro (less than 5 employees) and small (5 – 19 employees)
enterprises and 33 medium (20 – 99 employees) and large (100 or more employees) enterprises. For empirical purposes
of this paper entrepreneurship is represented by micro and small firms, i.e. firms with less than 20 employees.

15
Figure 3. Obstacles to operations, MSE characteristics and estimates of sales in Addis Ababa
Figure 3a. Type of contract Figure 3b. Registration
Source: Authors’ calculations based on the World Bank Enterprise Survey of Ethiopia (Addis Ababa, 2011). Note:
Only enterprises with less than 20 employees are included in the graphs.
We tested if the business environment remains significant for firm performance (e.g., sales) in a
multivariate OLS regression. The baseline model links the log of sales to the actual and perceived
business environment as well as to characteristics of the firm (e.g., number of its employees,
education of its workers). As one of the robustness checks, we also looked at the role of corruption,
telecommunications and the combination of the two.
The findings are that besides the size of the firm (number of employees), the sales performance of
micro and small enterprises is positively related to the level of education of its workers, pointing
again to the importance of education. Among the business environment factors, sales are
negatively associated with the limited supply of credit and power outages.21 Firms that perceived
both corruption and the lack of telecommunication services as an obstacle to operations reported
lower sales than firms that perceived either one or none of these factors as an obstacle (Table 7).
5. Conclusions
In this paper, we first presented a model of entrepreneurial start-ups where an equilibrium outcome
could be a low-skill, low-productivity trap. We showed that an improved business environment
and education would foster creation of high-productivity private firms, output and employment.
We also pointed to complementarities between education and the business environment.
More specifically, due to frictions in matching, search cost, and weaknesses in the business climate
(including property rights), the equilibrium conditions lead to suboptimal outcomes in terms of
workers’ and firms’ efforts and the number of productive SMEs, skilled employment and output.
21 The sales performance is also positively correlated with the higher education of the owners (Table 8, Columns 1
and 3). However, since the sampling design was stratified, un-weighted estimates can be biased, while the unbiased
estimates were not statistically significant. Specifically, the strata used in the sample encompass three dimensions:
region, industry, and size http://www.enterprisesurveys.org/nada/index.php/catalog/323/sampling . Under stratified
random sampling, un-weighted estimates are biased unless sample sizes are proportional to the size of each stratum.
This sampling issue was accounted for by weighting individual observations by the inverse of the weights.
0
.05
.1.1
5.2
De
nsity
5 10 15 20logsales
Under government contract
Without government contract
kernel = epanechnikov, bandwidth = 0.8613
Kernel density estimate, by contract
0
.05
.1.1
5.2
De
nsity
5 10 15 20logsale
Firm is registered
Firm is not registered
kernel = epanechnikov, bandwidth = 0.7236
Kernel density estimate of sales

16
Table 8. Firms’ performance and the business environment in Addis Ababa (1) (2)
Variables
Year of formal registration -0.0723** -0.0760**
(0.0301) (0.0295)
Number Of full-time employees 0.202** 0.174**
(0.0855) (0.0842)
Share by the largest owner(s) 0.00200 0.00118
(0.00911) (0.00893)
Experiencing power outages -1.013* -1.571**
(0.554) (0.606)
University education-largest owner 1.199** 1.272**
(0.545) (0.524)
Education as obstacle 0.487 0.978**
(0.344) (0.424)
Educated full time workers 0.0170** 0.0205***
(0.00681) (0.00669)
Top manager is female (=1) -0.0275 -0.722
(0.718) (0.744)
Outstanding personal loans 0.948 1.313**
(0.600) (0.598)
Supply of credit -0.0378* -0.0400**
(0.0190) (0.0187)
Government contracts -0.427 -0.334
(0.598) (0.595)
Corruption as an obstacle 0.662
(0.761)
Telecommunication as an obstacle 0.766
(0.675)
Corruption* telecommunication -2.632**
(1.095)
Constant 155.8** 162.8***
(60.98) (59.77)
Observations 54 54
R-square 0.484 0.561
Weights No No
Normality test (adj. Chi 2) 0.28 0.36
Multicollinearity (Mean VIF) 1.27 1.86 Source: Authors’ calculations based on the World Bank Enterprise Survey of Ethiopia (Addis Ababa, 2011). Note:
Enterprises with less than 20 employees are included in the graphs. Note: VIF stands for variance inflation factor.
Robust standard errors in parentheses. *** p<0.01, ** p<0.05, * p<0.1
Because of weak business environment, entrepreneurs under-invest in searching for business
opportunities relative to the effort they would exhort in a more conducive climate. In the model.
the impact of the low number of private firms on employment is amplified by workers who are
uncertain about finding skilled jobs and under-invest in training.
We tested the results of the model on the World Bank data for entrepreneurship, education and
governance and the business environment. We found that education has a positive effect on new

17
firms’ density, however, its marginal effect is decreasing as the level of education increases. In
low income countries, education has a higher effect with better business environment, in particular
better enforcement of the rule of law. Further, entrepreneurship is positively related to the financial
sector development but negatively related to countries’ low or lower-middle income level. The
case of Ethiopia further underscores the role of education and some elements of the business
environment, especially the infrastructure (electricity) and access to credit, for sales performance.
Many African countries would benefit from addressing the remaining obstacles to private sector
activities, such as high costs of starting a business, weak property rights, burdensome profit tax
rates, unstable tax regimes, and limited access to finance. In the case of high-tech SMEs, skill
shortages among entrepreneurs and workers may need to be tackled to foster innovation and high
value-added activities. Stronger institutions, including business service providers and those
channeling information about business and funding opportunities would also encourage productive
entrepreneurship. These and other constraints, especially in the financial sector, to productive
entrepreneurship in African regions, countries, and sectors could be a topic for further research.

18
References
Amoros, J. A. (2009), ‘Entrepreneurship and Quality of Institutions: A Developing-Country
Approach’, UNU-WIDER Research Paper, No. 2009/07.
Anderson, J. L.; Markides, C. and Kupp, M. (2010), ‘The Last Frontier: Market Creation in
Conflict Zones, Deep Rural Areas and Urban Slums’, California Market Review, Vol. 52(4),
Summer, 6 – 28.
Arruňada, B. (2007), ‘Pitfalls to avoid when measuring institutions: Is Doing Business damaging
business?’ Journal of Comparative Economics, Vol. 35(4), 729 – 747.
Bah, E. and Fang, L. (2015), ‘Impact of the Business Environment on Output and Productivity in
Africa,’ Journal of Development Economics, Vol. 114 (May), 159-171.
Bandiera, O.; Burgess, R.; Das, N.amoroRasul, I. and Sulaiman, M. (2013), ‘Can Basic
Entrepreneurship Transform the Economic Lives of the Poor?’, IZA Discussion Paper 7386.
Baumol, W. J. (1990), ‘Entrepreneurship: Productive, Unproductive and Destructive,’ Journal of
Political Economy, 985(5), 893–921.
Brixiová, Z. (2013), ‘Modeling Productive Entrepreneurship in Developing Countries’, Small
Business Economics, Vol. 41(1), 183 - 194.
Brixiová, Z. and Égert, B. (2012), ‘Business environment, start-ups and productivity during
transition’, Macroeconomic Dynamics, Vol. 16 (S2), 213 - 231.
Bruton, G. D., Ketchen, D. J. and Ireland, R. D. (2013), ‘Entrepreneurship as a Solution to
Poverty’, Journal of Business Venturing, Vol. 28(6), 683 – 689.
Denu, B.; Tekeste, A. and van der Deijl (2005), ‘Characteristics and determinants of youth
unemployment, underemployment and inadequate employment in Ethiopia’, ILO Employment
Strategy Paper 2005/07.
Dethier, J.-J.; Hirn, M. and Straub, S. (2011), Explaining enterprise performance in developing
countries with business climate survey data’, World Bank Research Observer, Vol. 26 (2), 258 -
309.
Geiger, M.; Moller, L. C. (2013), Ethiopia - Second economic update: laying the foundation for
achieving middle income status, World Bank: Washington, DC.
Gelb, A.; Mengistae, T.; Ramachandran, V., and Shah, M. K. (2008), ‘To formalize or not to
formalize? Comparisons of microenterprise data from Southern and East Africa’, Center for
Global Development Working Paper No. 175.

19
Herrington, M. and Kelley, D. (2013), African Entrepreneurship: Sub-Sahara African Regional
Report, Global Entrepreneurship Monitor: Cape Town.
Klapper, L.; Laeven, L. and Rajan, R. (2006), ‘Entry regulation as a barrier to entrepreneurship’,
Journal of Financial Economics, 82, 591–629.
Kolstad, I. and Wiig, A. (2015), ‘Education and Entrepreneurial Success’, Small Business
Economics, Vol. 44, 783–796.
Lopez-Garcia, P. (2009), ‘Business environment and labor market outcomes in European and
Central Asian Countries’, Journal of Entrepreneurial Finance, Vol. 12(4), 35 - 67.
Martins, P. (2014), ‘Structural Change in Ethiopia: An Employment Perspective’, World Bank
6749.
McMillan, M. and Rodrik, D. (2011), ‘Globalization, Structural Change, and Productivity
Growth’, NBER Working Paper 17143, National Bureau of Economic Research.
Naude, W. (2010), ‘Promoting entrepreneurship in developing countries: policy challenges’,
UNU-WIDER Policy Brief, No. 4.
Ncube, M. (2005), ‘Economic Growth, Entrepreneurship and the Business Environment in
Africa’, Economic Research Southern Africa, Working Paper No. 30.
Snower, D., (1996), ‘The low-skill, bad-job trap’, in: Booth, A., Snower, D. (Eds.), in Acquiring
skills: Market Failures, their Symptoms and Policy Responses, Cambridge University Press,
New York, 109–128.
Tobias, J. M.; Mair, J. and Barbosa-Leiker, C. (2013), ‘Towards a Theory of Transformative
Entrepreneurship: Poverty Reduction and Conflict Resolution in Rwanda’s Entrepreneurial
Coffee Sector’, Journal of Business Venturing, Vol. 28(6), 728 – 742.
World Bank (2014b), Doing Business 2015: Going Beyond Efficiency, World Bank: Washington
DC.
Sutton, J. and Kellow, N. (2010), ‘An Enterprise Map of Ethiopia’, International Growth Center:
London.

20
Annex I. Table: Description of Variables
Variables Definition Source
New_density New business density indicates new registrations per 1,000 people ages
15-64.
World Bank's Entrepreneurship
Survey
Education Education is an index computed using the Adult literacy rate (% age 15
and above), the Secondary enrolment and the Tertiary enrolment
World Bank data 2010, from Barro
Lee and UNESCO (2006, 2007).
Regulatory This index measures the incidence of market-unfriendly policies such
as price controls or inadequate bank supervision, as well as perceptions
of the burdens imposed by excessive regulation in areas such as foreign
trade and business development.
Governance Indicators, World
Bank, 2013
Domcredit _gdp Domestic credit to private sector by banks (% of GDP) WDI (2014)
Rule-law This indicator measures the extent to which agents have confidence in
and abide by the rules of society. These include perceptions of the
incidence of both violent and non-violent crime, the effectiveness and
predictability of the judiciary, and the enforceability of contracts.
Governance Indicators, World
Bank, 2013
Source: Authors.
Statistical tests
We first implement a normality test (Jarque-Bera) for the residuals of each specification in table
xx. The conclusion of these tests is that we cannot reject the hypothesis that the residuals are
normally distributed, at least at the 86% level (and 34% level resp.). The second test implemented
is a specification test. Even if, the model has a relatively god predicting power, according to the R
square, we would like to ensure that it is well specified. In practice, we regress the dependent
variable Logsale on its predicted value and the square of this prediction value; and the model is
mis-specified if the prediction squared is significant. We find that the prediction squared does not
have explanatory power, so our specification is well specified.
We also check for the presence of multicollinearity issues utilizing the Variance Inflation Factor
(VIF) test. The VIF shows us how much the variance of the coefficient estimate is being inflated
by multicollinearity. As a rule of thumb, a variable whose VIF values are greater than 10 is highly
correlated to the others. Since, the average VIF for all specifications is by far lower than 10, we
can conclude that our specifications do not suffer from multicollinearity issue.
Stratification and sampling bias
According to World Bank (2011), since the sampling design was stratified and employed
differential sampling individual observations should be properly weighted when making
inferences about the population.22 Under stratified random sampling, un-weighted estimates are
biased unless sample sizes are proportional to the size of each stratum.23
22 The strata used in the sample encompass three dimensions: region of the establishment, industry screener sector,
screener size. 23 With stratification the probability of selection of each unit is, in general, not the same.

21
In Column 2 of table xx account for this sampling issue by weighting individual observations by
the inverse of the weights to account for the fact that the different subjects have different chances
(the probability) of being included in the sample.24
The results are still robust except for few variables. In the weighted regression, whether the largest
owner has University-level education does not matter anymore, while the gender of the top
manager is important determinant of firms’ performances. Indeed, male top managers perform
better than their female counterparts.
24 The cost of correcting for the potential sample bias is a reduction of the efficiency of estimated parameters.