the butterfly effect: do farms do...
TRANSCRIPT

The Butterfly Effect: Do Farms Do Harm?
Braeden Van Deynze, Scott M. Swinton, Leslie Reis
Dept. of Agricultural, Food, and Resource Economics
Michigan State University
HERE Workshop @ University of Illinois
Sept. 28th, 2019 | Champaign, IL

Butterfly Populations On the Decline
• Butterflies are a highly-valued group of insects• Pollination, aesthetic, cultural value• US households’ existence value monarchs at $4.78-$6.65
bill. per 2012 contingent valuation survey (Diffendorfer et al., 2014)
• Butterfly populations in decline, globally and domestically (Sánchez-Bayo & Wyckhuys, 2019; Wepprich et al., 2019)
• 53% of species in decline; 1.8% more species in decline annually
• Ohio populations reduced by 1/3rd in last two decades
• Pesticide exposure potentially a driver of butterfly decline (Agrawal & Inamine, 2018; Thomas, 2016)
2Sept. 28th, 2019

Sparse Evidence of Pesticide-Pop. Connection
Specific evidence for negative pesticide impacts on butterfly populations for some groups:
But past studies have only examined single pesticide groups at a time
3Sept. 28th, 2019
Neonicotinoid insecticides Forister et al., 2016• Sacramento Valley• Many Species• Data from 3 counties since mid-
1990sGilburn et al., 2015• United Kingdom• Many Species• Data from 1984-2012
Glyphosate herbicidesSaunders et al., 2018• Illinois• Monarchs only• Data from 1994-2013

Simultaneously Examining Multiple Pesticides
RQ: How have changes in pesticide use affected Midwestern butterfly abundance?
Contributions
• Use knowledge of substitution effects between pesticides to better inform population models
• Address concerns of omitted variable bias in previous work
• Develop models that can better inform potential policy impacts→ Substitution under taxes/subsidies
4Sept. 28th, 2019

Butterfly-Pesticide System
5Sept. 28th, 2019
Pesticide Use
Pesticide Exposure
Pesticide EffectsAdapted from Sponsler et al. (2019)
Exposure
Pest PressureCosts
Spatiotemporal Butterfly Activity
EFFECT ON BUTTERFLIES
Toxicity
Spatiotemporal Use Patterns
Effect on Resources
Tech

Butterfly-Pesticide System
6Sept. 28th, 2019
Pesticide Use
Pesticide Exposure
Pesticide EffectsAdapted from Sponsler et al. (2019)
Exposure
Pest PressureCosts
Spatiotemporal Butterfly Activity
EFFECT ON BUTTERFLIES
Toxicity
Spatiotemporal Use Patterns
Effect on Resources
Tech
Pathways of Effect1. Exposure2a. Toxicity (Insecticides)2b. Effect on Resources (Herbicides)

Butterfly-Pesticide System
7Sept. 28th, 2019
Pesticide Use
Pesticide Exposure
Pesticide Effects
Exposure
Pest PressureCosts
Spatiotemporal Butterfly Activity
EFFECT ON BUTTERFLIES
Toxicity
Spatiotemporal Use Patterns
Effect on Resources
Tech
Data Needs1. Pesticide use2. Butterfly pops3. Cropland
(exposure)
Panel format
Adapted from Sponsler et al. (2019)

Butterfly Population Data
North American Butterfly Monitoring Network –Butterfly Population Data• Transact surveys conducted by
citizen scientist volunteers
• 56 counties in Iowa, Illinois, Indiana, Michigan, Ohio, and Wisconsin
• 23 species including Monarch
• Aggregated across summer months to county x year x species counts
8Sept. 28th, 2019

Pesticide Use DataKynetec AgroTrak®• Field-level application data for corn and soybean via extensive farmer
phone surveys
• Includes sprayed, seed-treated pesticides, and seed traits for every sampled field
• Measured by acre-treatments: number of applications per field→ Preferred over volume measures because of large differences in application
rates
• Aggregated to county x year x class
9Sept. 28th, 2019
Herbicides• Glyphosate• Non-Glyphosate
Insecticides
Systemic• Neonicotinoids• BT Seed
Sprayed• Pyrethroids• Organophosphates

Contemporaneous Changes in Pesticide Use
10Sept. 28th, 2019

Contemporaneous Changes in Pesticide Use
11Sept. 28th, 2019
Glyphosate substitutes for Non-Glyphosate

Contemporaneous Changes in Pesticide Use
12Sept. 28th, 2019
Systemic Insecticides substitute for Sprayed Insecticides

Land Use Data
13Sept. 28th, 2019
Cropland Data Layer
• Land cover at 30m resolution across region based on satellite data
• Available consistently since 2008
• Calculate share of land under corn and soybeans for each county
• Very little interannual variation within county→ Average over available years to
create static measure and apply to county-years where CDL is unavailable

Modeling Counts as a Function of Pesticides
Poisson model with crossed random intercepts• Dependent variable: # of monarchs observed
- Offset for sampling effort (minutes) so interpreted as rate
• Covariates include…1. Pesticide measures2. Row crop land cover3. Pesticide measures X row crop land cover4. Climate variables (early, mid, and late season)
- Temperature (butterfly growing degree days)- Precipitation (mm)
• Random intercepts for county and year• 370 county-year observations
14Sept. 28th, 2019

Preliminary Results Suggest Possible Impacts
15Sept. 28th, 2019
Shaded regions indicate 95% c.i.’s based on sandwich s.e.’s.

Preliminary Results Suggest Possible Impacts
16Sept. 28th, 2019
Shaded regions indicate 95% c.i.’s based on sandwich s.e.’s.
Model FitMarginal R2: 0.185Conditional R2: 0.988Dispersion Ratio: 12.9

Preliminary Results Suggest Possible Impacts
17Sept. 28th, 2019
Shaded regions indicate 95% c.i.’s based on sandwich s.e.’s.

Preliminary Results Suggest Possible Impacts
18Sept. 28th, 2019
Shaded regions indicate 95% c.i.’s based on sandwich s.e.’s.

Preliminary Results Suggest Possible Impacts
19Sept. 28th, 2019
Shaded regions indicate 95% c.i.’s based on sandwich s.e.’s.
Pesticides are good?- OR -
Biased estimates?

Possible Interpretation of Biased Estimates?Using substitution patterns observed in the literature…
20Sept. 28th, 2019

Possible Interpretation of Biased Estimates?Using substitution patterns observed in the literature…
• Between 1998-2011 GT seed adopters used on average…
0.9 lbs/ac more glyphosate
0.6 lbs/ac less non-glyphosate(Perry et al., 2016)
21Sept. 28th, 2019

Possible Interpretation of Biased Estimates?Using substitution patterns observed in the literature…
• Between 1998-2011 GT seed adopters used on average…
0.9 lbs/ac more glyphosate
0.6 lbs/ac less non-glyphosate(Perry et al., 2016)
• Net effect is negative
• Similar argument for insecticides
• Consistent with upward bias of all pesticide estimates
22Sept. 28th, 2019
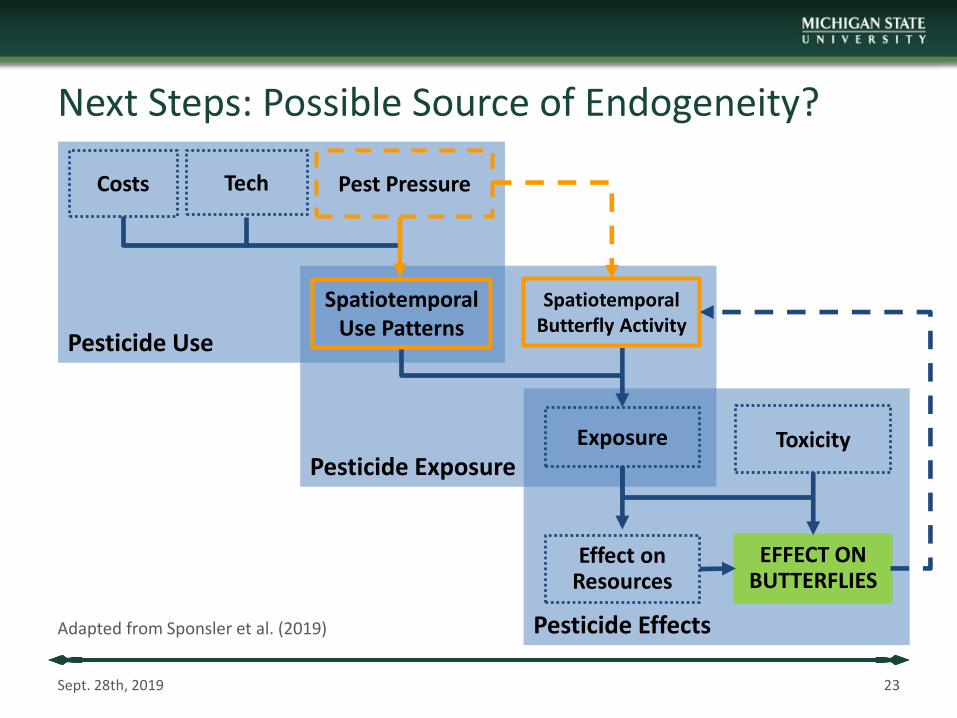
Next Steps: Possible Source of Endogeneity?
23Sept. 28th, 2019
Pesticide Use
Pesticide Exposure
Pesticide EffectsAdapted from Sponsler et al. (2019)
Exposure
Pest PressureCosts
Spatiotemporal Butterfly Activity
EFFECT ON BUTTERFLIES
Toxicity
Spatiotemporal Use Patterns
Effect on Resources
Tech

Next Steps: Possible Source of Endogeneity?
24Sept. 28th, 2019
Pesticide Use
Pesticide Exposure
Pesticide EffectsAdapted from Sponsler et al. (2019)
Exposure
Pest PressureCosts
Spatiotemporal Butterfly Activity
EFFECT ON BUTTERFLIES
Toxicity
Spatiotemporal Use Patterns
Effect on Resources
TechPotential Instruments?1. Prices?2. Tech change?

Next Steps: Model Site-Level Data
• Avoid information loss from aggregation for more precise estimation
• Localized croplandmeasures possible for more accurate accounting for exposure
25Sept. 28th, 2019
Figure from Wepprich et al. (2019)
Ohio Transect Locations

Next Steps: And More…
• Adapt to models more robust to overdispersion
- Negative binomial
- Observation-level random effects
- Quasi-poisson
• Model more species
- Do effects differ by functional traits?
- Migratory vs. non-migratory
- Generalist vs. specialist
- Number of generations per season
26Sept. 28th, 2019

Comments? Suggestions? Questions?
Braeden Van [email protected]
@BVanDeynze on Twitter
27Sept. 28th, 2019