the canadian valuation - soa · the canadian valuation practice and profit pattern kc chan vp &...
TRANSCRIPT

The Canadian Valuation Practice and Profit Pattern
KC ChanVP & Actuary, Asia Desk
May 28, 2010
Objectives
1.General consideration of Canadian valuation
2.An overview Canadian Asset Liability Method
3.An illustration of profit emergence on BE reserve with Provision of Adverse Deviation under Policy Premium Method (PPM)
Introduction
General valuation consideration:
1. Best estimate liability cashflow projection
2. Provision for Adverse Deviation (PfAD)
3. IFRS impact: market value vs. book value
4. Updating economic or non-economic assumptions

Best estimate liability cashflow
1. All benefits should be projected with best estimated assumptions
2. Challenges in projecting non-guaranteed cashflowlike dividend, death benefit that depends on fund value or account value
3. Uncertainty in variable premium and fee income and Best estimate cashflow projection

Provision for Adverse Deviation (PfAD)
1. The effect of this provision should be strengthening the reserve. Examples are lapse PfAD on lapse supported products, mortality PfAD on products that have both death and living benefits
2. On a deterministic approach, the level of PfAD is subjective. However, this can be rationalised as part of risk appetite framework. The PfAD mitigated the level of risk that the company’s income statement will not be affected
3. In Canada, there are suggested minimum level of PfAD for each risk

IFRS: Market value vs. Book Value
1. Under IFRS asset values are reported on market value. Depending on the categorisation of asset into Hold-for-trading (HFT) or Available-for-sale (AFS), the MV impact will be either on an operational income or as other comprehensive income.
2. The issue here is mismatch in asset reporting value that backs the liability. Is the liability value reported on a market base or book base?
3. In SLF, we categorised all asset backing liabilities as HFT. In order to mitigate the market value movement of the HFT asset, we will adjust the liability value (mark up or down to the market value of the HFT asset).

Updating economic and non-economic assumptions
1. Usually review on an annual basis for non-economic experience backed by studies: mortality, morbidity, lapse and expense
2. The most important economic assumption is the discount rate which is embedded in the reserve methodology
3. Other economic assumptions are fund growth rate, inflation rate, default assumptions and credit spreads. They are normally set once a year
Canadian Asset Liability Method (CALM)
• The prescribed method for valuation of policy liabilities in Canada
• Generate cashflows from modeled assets and liabilities
• Concept is based on determine the necessary asset value that will retire the liability cash flow
• A base scenario and 9 scenarios in total and the reserve is taken from the worst one
Definition
• Standards of Practice (SOP) from the CIA specifies that the Canadian GAAP be set using Canadian Asset Liability Method (CALM)
“ In calculating policy liabilities, the actuary would allocate assets to the liabilities at the balance sheet date, forecast their cashflow after that date, and, by trail and error, adjust the allocated assets so that they reduce to zero at the last cash flow”

Interest mismatch risk PfAD (C-3)
• The most significant PfAD
• Want to find out how much is C3 risk (interest rate risk)� If there is no cash flow mismatches, there will be no C3
risk (ie: cashflow received from asset is sufficient to cover liability payment in the same period)
• Key focus:� Cashflows
� Reinvestment
� Scenario assumptions

Cashflows
• Asset cashflows
� Coupon payment from bonds
� Maturity value from bonds
� Dividend payment/ sale from stocks
• Liability cashflows
� Premium in, expense/ commission out
• All cashflows projected should be based on padded assumptions (mortality, lapse, asset default etc)

Reinvestment
• What assets to invest when we have surplus/ deficit
� Ie: corporate bonds, government bond, equity, cash and borrowing if deficit
• Usually follow the Company investment mandate
� Need to move toward this if the existing portfolio is far away from the mandate
• CIA has restriction on what to reinvestment
� Ie: move to government bond in 20 years

Scenario Assumptions
• Equity
• Interest Rates
� Deterministic testing
• Explicitly chosen or prescribed
� Stochastic testing
• Random process to ‘generate’
• Judgment in the choice of model and parameters

Scenario Assumptions
Equity
• Best-estimate assumption would not be more favorable than a benchmark from historical performance
• MfAD for common share dividend = 5%
• MfAD for common share capital gain = 20% of best-estimate + an assumption that those assets change in value at the time when the change is most adverse (determined by testing)� Range between 25% to 40% depending on
volatility

Interest Rates
• CSOP requires testing on 10 scenarios (Base + 9 prescribed scenarios)

Base Scenario
• Implied forward rate for the first 20 years; average of 60 month and 120 month moving average of historic long term bond yields at or after 40th year
CIA Base - June 2007
0.00%
1.00%
2.00%
3.00%
4.00%
5.00%
6.00%
7.00%
0 5 10 15 20 25 30 35 40 45 50
Projection Years
Inte
rest
Rat
e %
3-month 6-month 1-year 2-year 3-year 4-year 5-year 7-year 10-year 20-year 30-year

CIA Scenario 1
• Use 90% of starting rate in year 1; at or after 20th year, use lower bounds for short-term and long-term rates.
CIA Scenario 1 - June 2007
0.00%
1.00%
2.00%
3.00%
4.00%
5.00%
6.00%
0 5 10 15 20 25 30 35 40 45 50
Projection Years
Inte
rest
Rat
e %
3-month 6-month 1-year 2-yaer 3-year 4-year 5-year 7-year 10-year 20-year 30-year
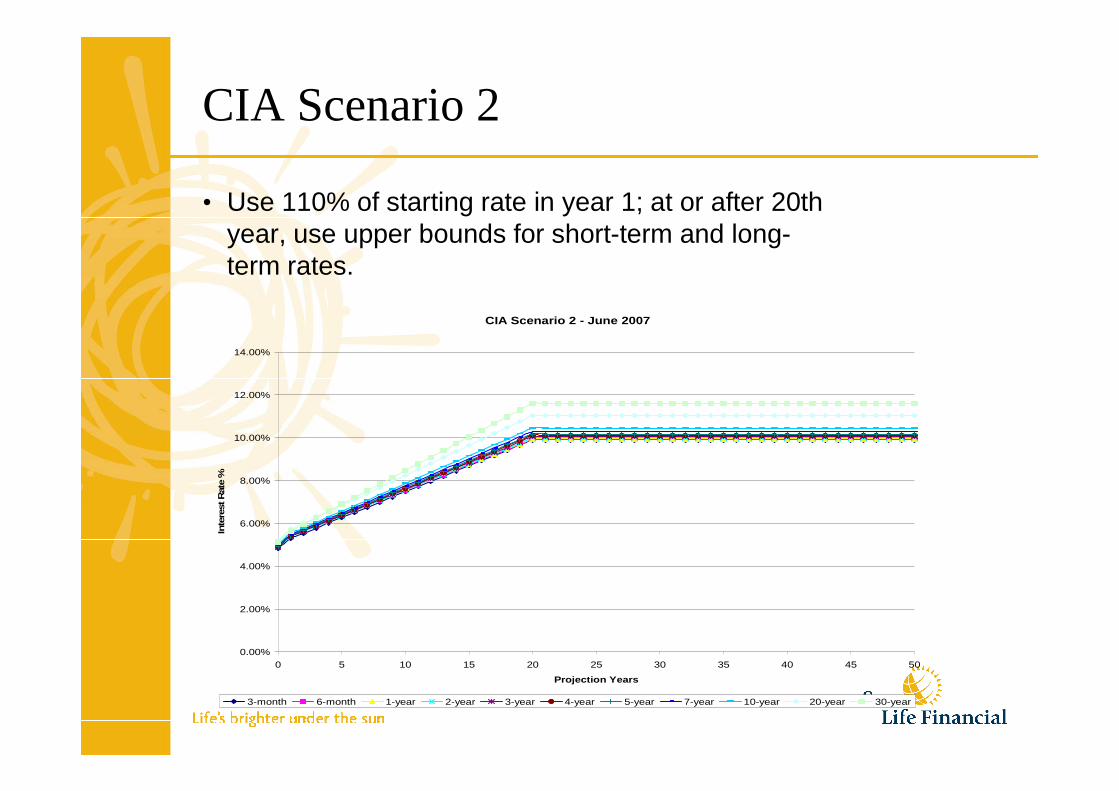
CIA Scenario 2
• Use 110% of starting rate in year 1; at or after 20th year, use upper bounds for short-term and long-term rates.
CIA Scenario 2 - June 2007
0.00%
2.00%
4.00%
6.00%
8.00%
10.00%
12.00%
14.00%
0 5 10 15 20 25 30 35 40 45 50
Projection Years
Inte
rest
Rat
e %
3-month 6-month 1-year 2-year 3-year 4-year 5-year 7-year 10-year 20-year 30-year

CIA Scenario 3
• Long term rates change by 1% to upper bound and then decrease by 1% to lower bound; alternate thereafter; short term rates grade to 60% of long term rates over first 3 years, then stay at 60% after.
CIA Scenario 3 - June 2007
0.00%
2.00%
4.00%
6.00%
8.00%
10.00%
12.00%
14.00%
0 5 10 15 20 25 30 35 40 45 50
Projection Years
Inte
rest
Rat
e %
3-month 6-month 1-year 2-year 3-year 4-year 5-year 7-year 10-year 20-year 30-year

CIA Scenario 4
• Long term rates change by 1% to lower bound and then increase by 1% to upper bound; alternate thereafter; short term rates grade to 60% of long term rates over first 3 years, then stay at 60%.
CIA Scenario 4 - June 2007
0.00%
2.00%
4.00%
6.00%
8.00%
10.00%
12.00%
14.00%
0 5 10 15 20 25 30 35 40 45 50
Projection Years
Inte
rest
Rat
e %
3-month 6-month 1-year 2-year 3-year 4-year 5-year 7-year 10-year 20-year 30-year

CIA Scenario 5
• Long term rates same as Scenario 3; short term rates as a percentage of long term rates, percentage moves up to 120% then down to 40% and increase by 20% annually; capped at 120%.
CIA Scenario 5 - June 2007
0.00%
2.00%
4.00%
6.00%
8.00%
10.00%
12.00%
14.00%
0 5 10 15 20 25 30 35 40 45 50
Projection Years
Inte
rest
Rat
e %
3-month 6-month 1-year 2-year 3-year 4-year 5-year 7-year 10-year 20-year 30-year

CIA Scenario 6
• Long term rates same as Scenario 4; short term rates as a percentage of long term rates, percentage moves down to 40% then up to 120% and decrease by 20% annually; floored at 40%.
CIA Scenario 6 - June 2007
0.00%
2.00%
4.00%
6.00%
8.00%
10.00%
12.00%
14.00%
0 5 10 15 20 25 30 35 40 45 50
Projection Years
Inte
rest
Rat
e %
3-month 6-month 1-year 2-year 3-year 4-year 5-year 7-year 10-year 20-year 30-year

CIA Scenario 7
• 90% of base from year 1 and on
CIA Scenario 7 - June 2007
0.00%
1.00%
2.00%
3.00%
4.00%
5.00%
6.00%
0 5 10 15 20 25 30 35 40 45 50
Projection Years
Inte
rest
Rat
e %
3-month 6-month 1-year 2-year 3-year 4-year 5-year 7-year 10-year 20-year 30-year

CIA Scenario 8
• 110% of base from year 1 and on
CIA Scenario 8 - June 2007
0.00%
1.00%
2.00%
3.00%
4.00%
5.00%
6.00%
7.00%
0 5 10 15 20 25 30 35 40 45 50
Projection Years
Inte
rest
Rat
e %
3-month 6-month 1-year 2-year 3-year 4-year 5-year 7-year 10-year 20-year 30-year

CIA Scenario 9
• Level curve
CIA Scenario 9 - June 2007
4.75%
4.80%
4.85%
4.90%
4.95%
5.00%
5.05%
5.10%
5.15%
5.20%
5.25%
0 5 10 15 20 25 30 35 40 45 50
Projection Years
Inte
rest
Rat
e %
3-month 6-month 1-year 2-year 3-year 4-year 5-year 7-year 10-year 20-year 30-year

Prescribed vs. Additional
• Prescribed
� from SOP (Base & Prescribed 1 to 9)
� Liability is set at the worst prescribed scenario
• Additional
� appropriate to the circumstances
� Credit spreads are treated as additional scenarios
• Liability is set at least as high as the worst prescribed scenario
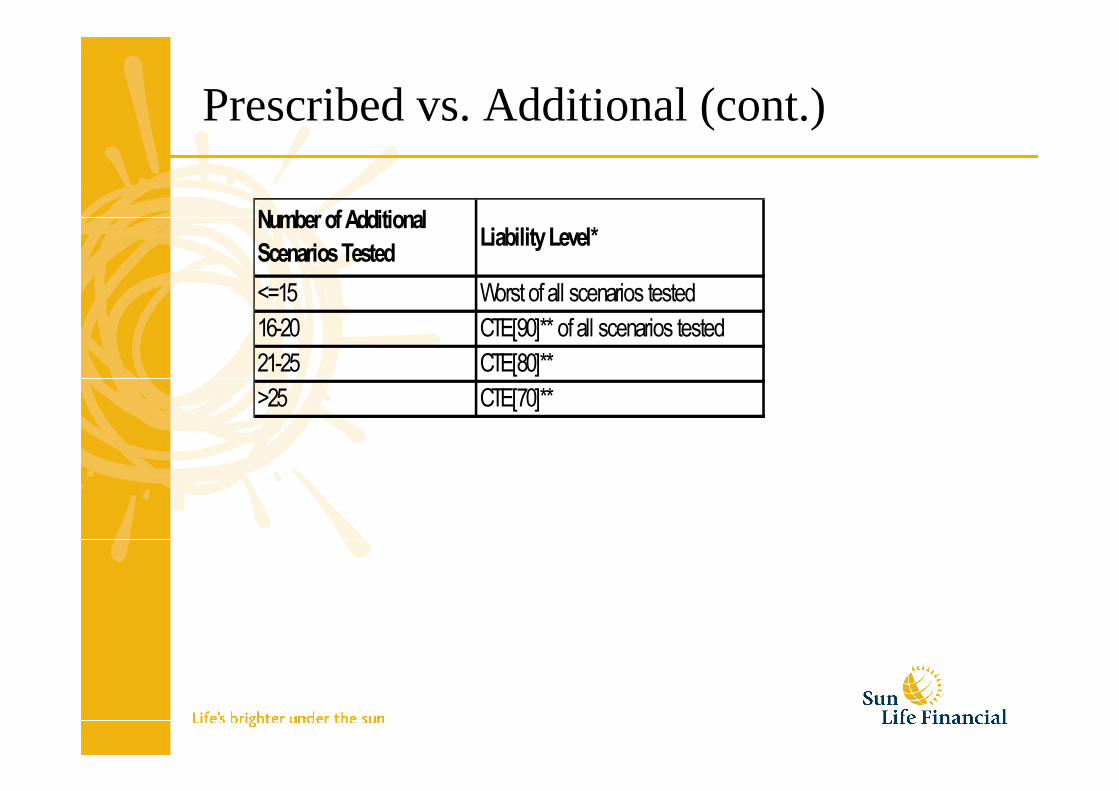
Prescribed vs. Additional (cont.)
Number of Additional
Scenarios TestedLiability Level*
<=15 Worst of all scenarios tested
16-20 CTE[90]** of all scenarios tested
21-25 CTE[80]**
>25 CTE[70]**
Stochastic – special consideration
• Floating (sliding) CTE approach
� Pre-defined formula that is objective and reasonably link to the level of underlying risk
• Ranges which comprehend each of the prescribed scenarios
� Demonstrate that the selected liability is adequate in light of the prescribed scenarios
� Re-parameterization is required if at least one of the prescribed scenarios > all of the generated stochastic scenarios

PPM Illustration – best estimated assumptions
4%Interest Rate
125 Premium
1000Death Benefit
30Age
Parameters
2%2%2%2%2%7%8%9%10%20%Lapse assumption
1.45%1.40%1.35%1.30%1.25%1.20%1.15%1.10%1.05%1.00%Mortality assumption
10987654321
A 5 year pay 10 year endowment product

Best Estimated reserve profit pattern
-0.00 (0.00)0.00 0.00 ----25.52 Net Income
455 (8)(8)(8)(7)(78)(82)(87)(93)(84)Change in Reserve
18 18 18 17 17 14 11 7 3 -Investment Income on Reserve
(0)(0)(0)(0)(0)3 3 3 4 5 Investment Income on CF
(2)(2)(2)(3)(3)(3)(3)(4)(4)(10)Expense
(471)(7)(7)(7)(7)(8)(8)(8)(9)(10)Claims
72 79 88 99 125 Premium
10987654321Income Statement
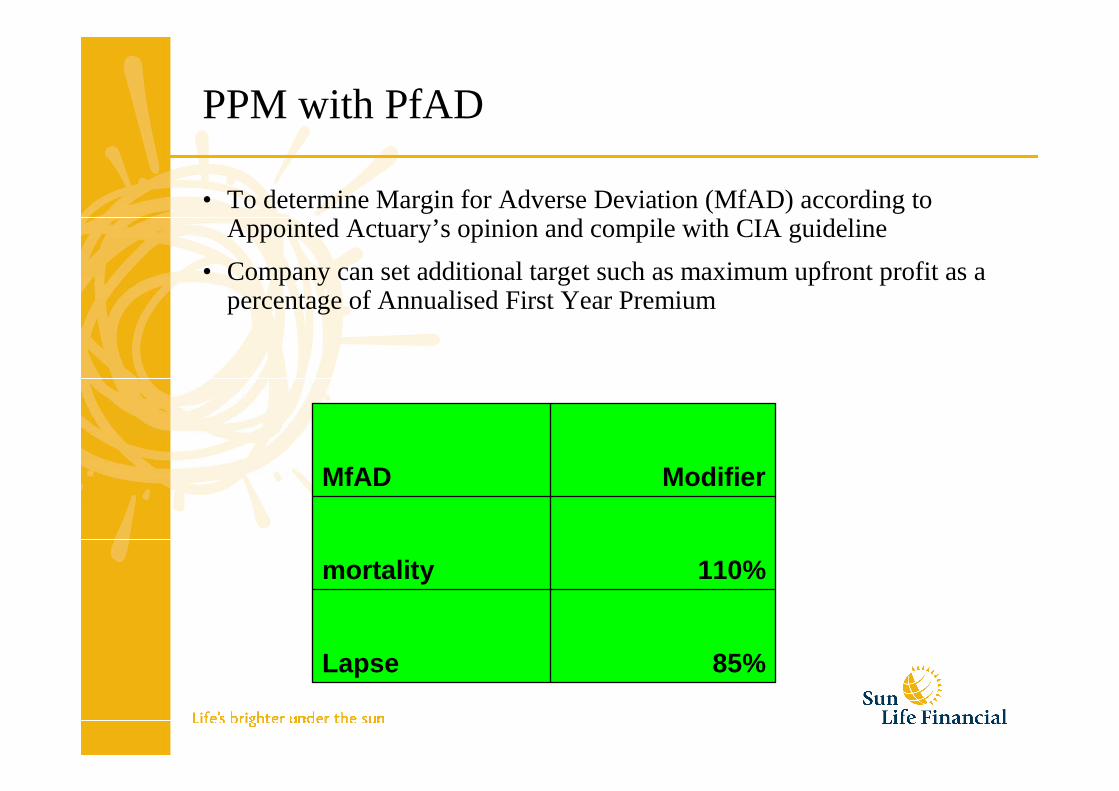
PPM with PfAD
• To determine Margin for Adverse Deviation (MfAD) according to Appointed Actuary’s opinion and compile with CIA guideline
• Company can set additional target such as maximum upfront profit as a percentage of Annualised First Year Premium
85%Lapse
110%mortality
ModifierMfAD

QUESTIONS?
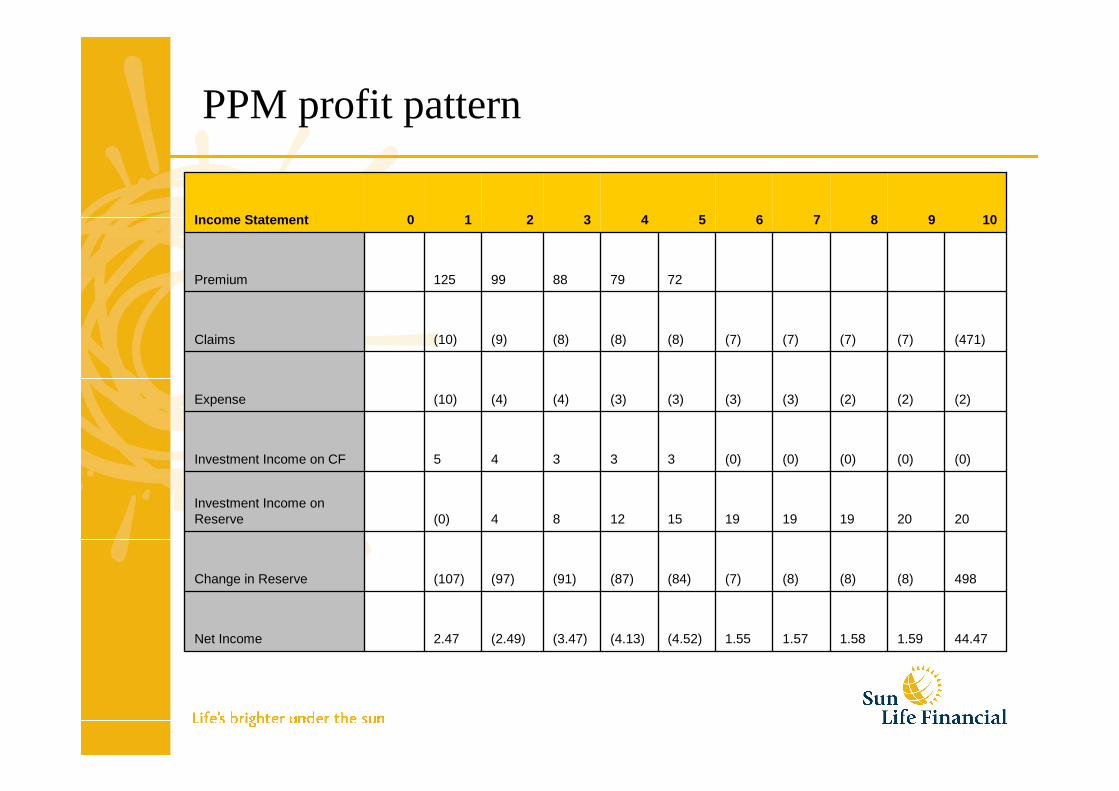
PPM profit pattern
44.47 1.59 1.58 1.57 1.55 (4.52)(4.13)(3.47)(2.49)2.47 Net Income
498 (8)(8)(8)(7)(84)(87)(91)(97)(107)Change in Reserve
20 20 19 19 19 15 12 8 4 (0)Investment Income on Reserve
(0)(0)(0)(0)(0)3 3 3 4 5 Investment Income on CF
(2)(2)(2)(3)(3)(3)(3)(4)(4)(10)Expense
(471)(7)(7)(7)(7)(8)(8)(8)(9)(10)Claims
72 79 88 99 125 Premium
109876543210Income Statement