the car-based bat monitoring scheme for ireland: synthesis
TRANSCRIPT

The Car-Based Bat Monitoring Scheme
for Ireland:
Synthesis Report 2003-2008
Irish Wildlife Manuals No. 39


The Car-Based Bat Monitoring Scheme for Ireland:
Synthesis Report 2003-2008
Niamh Roche1, Steve Langton2 and Tina Aughney1
1. www.batconservationireland.org
Citation:
Roche N., Langton S. and Aughney T. (2009) The Car-Based Bat Monitoring Scheme for Ireland:
Synthesis Report 2003-2008. Irish Wildlife Manuals, No. 39. National Parks and Wildlife Service,
Department of the Environment, Heritage and Local Government, Dublin, Ireland.
Cover image: Map of Ireland showing car transect survey squares
Irish Wildlife Manuals Series Editors: F. Marnell & N. Kingston
© National Parks and Wildlife Service 2009
ISSN 1393 – 6670


Car-Based Bat Monitoring 2003-2008
____________________________
1
CONTENTS
EXECUTIVE SUMMARY ........................................................................................................................................... 3
ACKNOWLEDGEMENTS ........................................................................................................................................... 5
INTRODUCTION...................................................................................................................................................... 7
Why Monitor Ireland’s Bats?......................................................................................................................... 7
Red and Amber Alerts .................................................................................................................................... 8
The Importance of Ireland’s Road Network for Bats................................................................................ 9
Car-Based Bat Monitoring ............................................................................................................................. 9
What is a Car-Based Bat Monitoring Scheme?............................................................................................... 9
Overall Aims of Car-Based Bat Monitoring ................................................................................................... 9
The Aims of this Report ............................................................................................................................... 10
Interpretation of Bat Encounter Data......................................................................................................... 10
Factors Causing Variation in Bat Activity................................................................................................. 11
METHODS ............................................................................................................................................................. 13
Statistical analysis ......................................................................................................................................... 13
Other Vertebrates .......................................................................................................................................... 14
RESULTS................................................................................................................................................................ 15
Volunteers....................................................................................................................................................... 15
Squares Covered 2003-2008.......................................................................................................................... 16
Dataset Generated ......................................................................................................................................... 18
Activity Hotspots and Diversity ................................................................................................................. 21
High Abundance ........................................................................................................................................... 21
Simpson’s Index of Diversity ........................................................................................................................ 22
Abundance and Diversity Combined ............................................................................................................ 23
Common pipistrelle, Pipistrellus pipistrellus .......................................................................................... 24
Common Pipistrelle Yearly Activity ............................................................................................................. 25
Common Pipistrelle Population Trend.......................................................................................................... 25
Soprano pipistrelle, Pipistrellus pygmaeus............................................................................................... 27
Soprano Pipistrelle Yearly Activity .............................................................................................................. 28
Soprano Pipistrelle Population Trend ........................................................................................................... 28
Leisler’s bat, Nyctalus leisleri...................................................................................................................... 30
Leisler’s Bat Yearly Activity ......................................................................................................................... 31
Leisler’s Bat Population Trend...................................................................................................................... 31
Nathusius’ pipistrelle, Pipistrellus nathusii ............................................................................................. 33
Nathusius’ Pipistrelle Yearly Activity.......................................................................................................... 34
Nathusius’ Pipistrelle Population Trend ...................................................................................................... 34
Myotis bats...................................................................................................................................................... 35
Brown long-eared bat, Plecotus auritus..................................................................................................... 37
Power Analysis .............................................................................................................................................. 38

Car-Based Bat Monitoring 2003-2008
____________________________
2
Detecting Declines or Increases.....................................................................................................................38
Number of Transects .....................................................................................................................................39
OTHER VERTEBRATES..........................................................................................................................................41
DISCUSSION .........................................................................................................................................................44
Volunteer uptake ...........................................................................................................................................44
Survey coverage .............................................................................................................................................44
Dataset .............................................................................................................................................................44
Abundance and Diversity ............................................................................................................................44
Species Abundance and Yearly Trends .....................................................................................................45
Common Pipistrelles......................................................................................................................................45
Soprano pipistrelles .......................................................................................................................................45
Leisler’s Bat ...................................................................................................................................................46
Nathusius’ Pipistrelle ....................................................................................................................................46
Myotis Bats....................................................................................................................................................47
Brown Long-eared Bat ...................................................................................................................................47
Power Analysis...............................................................................................................................................47
Reducing Survey Time ..................................................................................................................................47
Other Vertebrates...........................................................................................................................................48
PROPOSALS FOR THE FUTURE OF CAR-BASED BAT MONITORING...................................................................49
Methodology...................................................................................................................................................49
Habitat Use......................................................................................................................................................49
REFERENCES..........................................................................................................................................................50
GLOSSARY OF TERMS ..........................................................................................................................................52
APPENDIX I ...........................................................................................................................................................54
Methods ...........................................................................................................................................................54
Training and equipment ................................................................................................................................54
Sonographic analysis .....................................................................................................................................54
Power Analysis..............................................................................................................................................55
APPENDIX II..........................................................................................................................................................56
Results..............................................................................................................................................................56
Simpson’s Index.............................................................................................................................................56
Relationship with Number of Intervals .........................................................................................................57
Descriptive Statistics .....................................................................................................................................59

Car-Based Bat Monitoring 2003-2008
____________________________
3
EXECUTIVE SUMMARY
The first systematic car-based bat monitoring system in Europe was devised for the Republic of
Ireland (ROI) in 2003 by the Bat Conservation Trust (BCT, UK) and funded by the Irish Heritage
Council. The scheme has been administered by Bat Conservation Ireland (BCIreland) since 2004. The
scheme has expanded year on year, funded by the National Parks and Wildlife Service (NPWS) of the
Department of Environment, Heritage and Local Government (ROI). In 2006 it was extended to
Northern Ireland with additional funding from the Northern Ireland Environment Agency (NIEA),
formerly Environment and Heritage Service, Department of the Environment, Northern Ireland. The
main aim of the scheme is to monitor roadside populations of common pipistrelle, soprano pipistrelle
and Leisler’s bat and to collect sufficient data to identify trends in bat populations.
The method involves driving a known survey route at 24kmph (15mph) with a time expansion bat
detector clamped to the open window of the passenger door. Each survey route (route length is 93km)
consists of 20, 1.6km transects, separated by a 3.2km gap to prevent repeat encounters with the same
bats. Sounds are recorded to minidisc. Minidisc recordings are analysed by BCIreland using Bat
Sound™ software. In the initial pilot study in 2003, routes were mapped and surveyed within seven,
randomly selected, 30km squares. The coverage across the country increased yearly until 2007, when
routes had been mapped in 28, 30km blocks. Surveys are carried out in July and August by trained
volunteers who are mainly staff of NPWS and NIEA, and BCIreland members. Between 60 and 70
surveyors spend approximately 400hrs per annum carrying out the survey. While approximately 35%
of volunteers (or 22 out of 60) do not survey the following year, the repetition rate for team leaders is
very high, with just 17%, or 6 out of 25 failing to repeat the survey the following year.
Out of a possible total of 28 squares up to 27 have been surveyed on any given year. Between 998km
and 1576km of monitoring transects have been driven each year since 2004. From 2003 to 2008,
6543km of monitoring transects have been surveyed. In total, 13606 bat encounters have been
recorded by this monitoring scheme.
The common pipistrelle is the most frequently encountered species. On average 1.68 common
pipistrelle encounters are recorded during each 1.6km monitoring transect. The soprano pipistrelle is
usually the second most frequently encountered species each year. On average 0.67 soprano pipistrelle
encounters are recorded from each 1.6km transect. The Leisler’s bat is usually the third most
frequently encountered bat species. On average, 0.66 Leisler’s bats are encountered during each 1.6km
transect. Other species such as Myotis spp., Nathusius’ pipistrelle and brown long-eared bats are
encountered by the survey in very low numbers.
An examination of average bat abundance and bat diversity in each square shows that the most
abundant squares are found in the south west and east of the country, while the most diverse square
tend to be those with low encounter rates, situated in the north and north west. A combination of the
two factors, however, highlights a number of squares with relatively high diversity and high
abundance. These squares are V93 (west Cork) and V96 (Killarney) in the south west, and S78 in
Carlow/west Wicklow.

Car-Based Bat Monitoring 2003-2008
____________________________
4
Simple linear models fitted to the yearly encounter rate data for each species show that common
pipistrelles may be on an increasing trend. Trends for soprano pipistrelles are less clear but this
species may also be on the increase. Leisler’s bat, likewise appears to show an increasing trend.
Nathusius’ pipistrelle, which had been thought to be on the increase, now appears to be declining
from its high level in 2006, although encounter rates with this species are so low that standard error
bars are very wide. Likewise, error bars for Myotis species’ yearly estimates are too wide to determine
trends.
Power analysis was carried out to determine whether Red and Amber Alert declines in the three target
species can still be detected by the monitoring scheme. Results of this analysis confirm that when 20
squares are surveyed twice yearly a Red Alert decline can be detected within 8, 11, and 12 years for
common pipistrelles, soprano pipistrelles and Leisler’s bats, respectively. Amber Alerts take roughly
twice as long to detect, although exact numbers vary between species. An examination of power of the
data to detect increases shows that results roughly mirror the ability to detect declines, with a similar
number of squares needed to detect either a doubling or halving of the population. For 20 squares
surveyed twice annually it would take 9, 11 and 12 years to detect a 100% increase (over 25 years) in
common pipistrelles, soprano pipistrelles and Leisler’s bat, respectively.
With the issue of driver and surveyor safety of primary concern, investigations were carried out in
2008 to determine whether it will be feasible to reduce the time taken to complete an individual
survey. Power analysis was carried out to determine the impact of reducing the number of transects
surveyed each night. Results show that cutting out the last 5 transects has very little impact on the
number of years required to detect Red or Amber alert declines in common pipistrelles or Leisler’s
bats, but does increase the time needed to pick up Alerts in soprano pipistrelles by 2-3 years. Cutting
out the final 5 transects at the end of each survey would reduce average time to complete a survey to
three hours, from the current average of four hours.
Other vertebrates were recorded by surveyors during each survey night and in total 1109 living
vertebrates other than bats have been recorded from 13014km of roads in July and August 2006 to
2008. The most common species is the domestic cat, which accounts for 52% of all living vertebrates
observed. Cat abundance has increased since 2006. The next most common species encountered are
foxes and rabbits. By way of contrast the most commonly recorded dead vertebrates are rabbits,
followed by badgers and foxes.

Car-Based Bat Monitoring 2003-2008
____________________________
5
ACKNOWLEDGEMENTS
A very special THANK YOU to the surveyors from 2003 to present:
Stephen Aughney Rebecca Jeffrey Ciara O’Mahony Tina Aughney Brian Keeley Elaine O’Riordáin Eric Bann Conor Kelleher Cormac Parle Ted Barker Tara Kelleher Una Patterson Chris Barron Ger Kelleher Chris Peppiatt Imelda Barry Gerry Kelly Gill Robb Dominic Berridge Bee Kesso Niamh Roche John Biggane James Kilroy Gráinne Roche Eileen Biggane Naomi Kingston Tim Roderick Sinéad Biggane Annette Lynch Lorcan Scott Andy Bleasdale Deirdre Lynn Joe Sheehan Emma Boston David Lyons Lorna Somerville Patricia Boston Bella Lysaght Ger Stanton Shaun Boyle Liam Lysaght Robert Steed Daniel Buckley Pauli Lysaght Jonathan Stevenson Kieran Buckley Seppie Lysaght Yvonne Temple Carl Byrne Kevin Maguire Georgina Thurgate Susan Callaghan Mary Maguire Dave Tierney Ruth Carden Fidelma Maher Deirdre Toomey Stephen Carters Ferdia Marnell Kathryn Turner Donna Cassidy Kate McAney Fernando Valverde Damian Clark Eddie McCourt Alyn Walsh Jimi Conroy Annie McCourt Gemma Weir Joe Costelloe James McCrory Betty White Kerry Crawford Lee McDaid Chris Wilson Denis Crinigan Larry McDaid Jane Woodlock Sarah Crinigan Dave McDonagh Cathy Miriam Crowley David McDonagh Reggie Cunningham Juliet McDonnell Guy Dalton Emer McGee Hannah Denniston Barbara McInerney Paschal Dower Melina McMullan Catherine Farrell Michael McNamara Fiona Farrell Simon Mickleburgh Mairead Farrell Robbie Miller Aine Fenner Ken Moore Andrew Fenner James Moran Jennifer Firth Enda Mullen Leonard Floyd Sinead Noonan Bill Forrest David Norriss Kathryn Freeman Irene O’Brien Emma Glanville Mark O’Callaghan Paddy Graham Áine O’Connor Gareth Grindle Séamus O’Connor Clare Heardman A. O’Donaill Catherine Higgins Jim O’Donoghue Therese Higgins Sylvia O’Hehir Rob Holloway Dennis O’Higgins Austin Hopkirk Ciarán O’Keeffe

Car-Based Bat Monitoring 2003-2008
____________________________
6
Thanks also to
• Our funding partners, the Northern Ireland Environment Agency:
• Staff of NPWS, in particular Naomi Kingston, Deirdre Lynn and Ferdia Marnell. • Staff of the Northern Ireland Environment Agency in particular Donna Cassidy and John
Milburne. • Jon Russ of the BCT. • Liam Lysaght. • Colin Catto.

Car-Based Bat Monitoring 2003-2008
____________________________
7
INTRODUCTION
The Car-Based Bat Monitoring Scheme is a joint project of The National Parks and Wildlife Service
(NPWS) of The Department of Environment, Heritage and Local Government, Republic of Ireland,
The Northern Ireland Environment Agency (NIEA) of the Department of the Environment, Northern
Ireland and Bat Conservation Ireland (BCIreland). This project aims to be the primary tool for
monitoring roadside populations of common pipistrelle, soprano pipistrelle and Leisler’s bats in
Ireland. The project protocol was initially devised and piloted by The Bat Conservation Trust (BCT) in
2003 as an initiative of The Heritage Council (ROI) (Catto et al., 2004).
This report presents synthesis results for the past six seasons (2003-2008) of bat monitoring in the
Republic of Ireland and Northern Ireland and follows earlier reports (Catto et al., 2004; Roche et al.,
2005; 2006; 2007; 2008).
2005 saw the first survey square to be completed in Northern Ireland. In 2006 the NIEA funded the
monitoring of three squares in Northern Ireland, and five squares in 2007 and 2008. Results are shown
in the present report.
Why Monitor Ireland’s Bats?
Irish bats are protected under domestic and EU legislation. Under the Republic’s Wildlife Act (1976)
and Wildlife (Amendment) Act (2000) it is an offence to intentionally harm a bat or disturb its resting
place. Bats in Northern Ireland are protected under the Wildlife (Northern Ireland) Order 1985.
The EU Habitats Directive (92/43/EEC) lists all Irish bat species in Annex IV and one Irish species, the
lesser horseshoe bat (Rhinolophus hipposideros), in Annex II. Annex II includes animal species of
community interest whose conservation requires the designation of Special Areas of Conservation
(SACs) because they are, for example, endangered, rare, vulnerable or endemic. Annex IV includes
various species that require strict protection. Article 11 of the Habitats Directive requires member
states to monitor all species listed in the Habitats Directive and Article 17 requires States to report to
the EU on the findings of monitoring schemes.
Ireland and the UK are also signatories to a number of conservation agreements pertaining to bats
such as the Bern and Bonn Conventions. The Agreement on the Conservation of Populations of
European Bats (EUROBATS) is an agreement under the Bonn Convention and Ireland and the UK are
two of the 32 signatories. The Agreement has an Action Plan with priorities for implementation. One
of the current priorities is to produce guidelines on standardised bat monitoring methods across
Europe.
Whilde (1993), the Irish Red Data Book of vertebrates, listed all Irish populations of bats (those species
that were known to occur in Ireland at the time) as Internationally Important. Two Irish species, the
lesser horseshoe bat and the Leisler’s bat (Nyctalus leisleri), were assigned IUCN European threat
categories by Hutson et al. (2000) (VU A2c and LR: nt, respectively). VU A2c indicated that the lesser
horseshoe bat population in Ireland is vulnerable to decline and such declines may be predicted for
the future if there is a decline in occupancy, extent of occurrence or quality of habitat. Ireland holds
important European populations of Leisler’s bat (Stebbings, 1988) which was formerly categorised as

Car-Based Bat Monitoring 2003-2008
____________________________
8
LR (lower risk): nt (near threatened). The conservation status of bats in Ireland and Europe has been
recently updated. The threat level for the lesser horseshoe bat is now described as near threatened for
Europe and the European States (Temple and Terry 2007), but within Ireland its population is
considered to have good prospects (NPWS 2007). The status of the European Leisler’s bat population
has been changed from nt to Least Concern (Temple and Terry 2007) and within Ireland it is
considered to have good prospects (NPWS 2007). This species is still, however, infrequent in the rest
of Europe compared with Ireland where it is quite common.
Despite high levels of legal protection for all species, however, until 2003 there was no systematic
monitoring of any species apart from the lesser horseshoe bat. This Car-based Bat Monitoring Scheme,
the All Ireland Daubenton’s Bat Waterways Survey which began in 2006 (e.g. Aughney et al., 2007)
and the Brown long-eared bat Roost Monitoring Scheme (Aughney and Roche, 2008) are helping to
redress the imbalance and ensure countrywide coverage and monitoring of a number of species
including our important Leisler’s bat.
Definite conclusions from a monitoring project based on the road network, such as a car-based bat
monitoring scheme, can only be made in relation to roadside habitats. Inferences from the roadside
monitoring to wider bat populations can be made but are based on the assumption that population
trend data collected from the roadside will mirror that of the wider population. Some caution is
needed in doing this since population trends in a non-random sub-sample of available habitats will
not necessarily be representative of the population as a whole (Buckland et al., 2005). Further work to
assess the degree of bias in the roadside habitats may therefore be needed before extrapolating to
other habitats.
Red and Amber Alerts
Under the Habitats Directive, Member States are required to identify species declining at >1% per
year. Such a decline would put a species into the “red” category. However, at this stage, assessing
trends to this level of accuracy with the current data set would not be statistically sound. It may be
feasible to address this requirement in the future when more data has been gathered.
Other standard measurements of population trends are widely used. The British Trust for Ornithology
(BTO) has produced Alert levels based on IUCN-developed criteria for measured population declines.
Species are considered of high conservation priority (Red Alert) if their population has declined by
50% or greater over 25 years and of medium conservation priority (Amber Alert) if their populations
have declined by 25-49% over 25 years (Marchant et al., 1997). These Alerts are based on evidence of
declines that have already occurred but if Alerts are predicted to occur based on existing rates of
decline in a shorter time period then the species should be given the relevant Alert status e.g. if a
species has declined by 2.73% per annum over a 10-year period then it is predicted to decline by 50%
over 25 years and should be given Red Alert status after 10 years. Monitoring data should be of
sufficient statistical sensitivity (and better, if possible) to meet these Alert levels. The 2005 report
(Roche et al., 2006) included detailed analyses of the sensitivity achieved by the car-based approach
and power analysis (see Glossary) to evaluate alternative approaches for the future. Power analysis,
has been revisited for the present synthesis report.

Car-Based Bat Monitoring 2003-2008
____________________________
9
The Importance of Ireland’s Road Network for Bats
Ireland’s small roads, most of which are lined with trees and hedgerows, constitute a major network
of connectivity in the landscape. Most European bat species need to fly along linear landscape
features, e.g. hedgerows, walls and tree lines, when commuting from roost to foraging site and vice
versa (e.g. Fairley 2001; Limpens and Kapteyn 1991). In addition, hedgerow and tree-line habitats
along many roads provide a source of insect prey for bats in flight. Bat activity in other habitats
adjacent to roadsides – such as rivers, lakes, bogs and forests could also potentially be examined using
data from this monitoring scheme.
Road developments can potentially impact negatively on bat biodiversity. Data collected on this
programme, when analysed in conjunction with roadside habitat data, will allow more informed
decisions on future road network developments to be made, potentially leading to fewer negative
environmental impacts associated with such developments. Data collected from this monitoring
scheme also have potential applications on a national and regional basis.
Carrying out night-time survey work along roads provides an additional opportunity to survey for
other vertebrates, many species of which traverse the road network or forage along it at night.
Car-Based Bat Monitoring
What is a Car-Based Bat Monitoring Scheme?
This protocol is a method of monitoring bats while driving. Monitoring is carried out using a bat
detector which picks up the ultrasonic (high pitched) echolocation calls made by bats and converts
them to a frequency audible to the human ear. For this scheme, time expansion detectors are used,
which essentially make short recordings of a broad range of ultrasound and replay the sounds at a
slower speed. The monitoring is carried out along mapped routes, at a specific time of year, while
driving at a prescribed speed. All sounds are recorded for analysis at a later stage.
Overall Aims of Car-Based Bat Monitoring
1. Provide a method of monitoring that can be implemented by relatively few surveyors and that
does not require highly trained individuals.
2. Provide a method of data collection that is
• objective
• easily repeatable
• cost effective.

Car-Based Bat Monitoring 2003-2008
____________________________
10
3. Ensure sufficient data is collected that will allow early recognition of Red and Amber Alert
declines in certain Irish bat species’ populations.
4. Record other vertebrate wildlife during the survey.
5. To extrapolate information on bat activity within survey squares to determine ‘hotspot’ areas,
and/or areas of high bat diversity.
6. To determine population trends and allow early detection of population declines or highlight
increases, if any.
The Aims of this Report
This is the first synthesis report for the car-based bat monitoring scheme. For more detail on the
scheme in 2008 see the Irish Bat Monitoring and Recording Schemes: Annual Report 2008 (Aughney et
al., 2009).
This report synthesises the data collected from 2003 to present and
• examines the turnover of surveyors, and volunteer time input
• reviews total bat encounters, bat species diversity and abundant and diverse survey squares
• compares relative activity of each species around the island using average data from 2004 to 2008
• looks at population trend data
• revisits Power, to detect both Alert level decreases or population increases.
• includes results of Power analysis on reducing the numbers of transects
• reviews overall ‘other vertebrate’ data from 2006 to 2008
• makes recommendations on the future of the survey
Interpretation of Bat Encounter Data
The present monitoring project, which requires volunteers to drive a set route at 24km per hour while
recording bats using a time expansion detector, results in the collection of bat sounds that are
recorded to minidisc and subsequently analysed using sonogram analysis software. From this, the
bats present on a particular transect can be identified to species level (in most cases) and the number
of encounters with each species per unit time or unit distance can be established. This method of data
collection allows for cross comparisons in encounter rates between survey dates, between years and
between survey areas. Inter-species comparisons are restricted to those species that emit similar calls
at a similar loudness. The encounter rate of Leisler’s bats, for example, cannot be compared directly

Car-Based Bat Monitoring 2003-2008
____________________________
11
with those of common pipistrelles since Leisler’s bats are much louder and can be detected at a greater
distance compared with common pipistrelles. Trends can be extrapolated over time to determine
whether a population is increasing or in decline.
Encounter rates cannot be assumed to directly reflect numbers of bats. It is possible that a single bat
could be recorded more than once on the same transect, although methodology has been devised to
minimise the risk of repeat encounters from the same individual (Catto et al. 2004). For this reason, to
consider the encounter rates as a direct indication of individual bats would be inaccurate and
overestimate bat numbers. Encounter rates per unit time are used to indicate bat activity levels in the
results section of the present report.
Factors Causing Variation in Bat Activity
Many factors may lead to variation in bat activity, these include:
• Air temperature. Insect prey availability drops in low temperatures (e.g. Taylor, 1963; Williams,
1940; Wellington, 1945).
• Wind speed and direction. Aerial insects swarm to the lee of windward (which could determine
which side of a road the bat will fly along) (e.g. Lewis and Stephenson 1966) and bats tend to
concentrate their activities closer to tree lines during high wind speeds (Verboom and Spoelstra
1999).
• Roost occurrence along a transect. Buildings tend to be situated along roads and bat roosts are
often found in buildings.
• Habitat availability. This may not be a source of major year to year variation but overall
abundance of different habitat types and, possibly, trends in hedgerow maintenance may affect
bat abundance in different areas/squares.
• Lighting. White street lighting can attract insects and subsequently some species of bat, while
causing a decline in others (e.g. Rydell, 1992).
• Timing of survey work: Seasonal and during the night.
• Driving speed – the effects of variations in driving speed were examined using field experiments
in 2005 and 2006. To reduce the impact of driving speed on results the data is now presented in
bat encounters per unit time. See Roche et al. (2007) for details.
• Irish Bats and Climate Change - The impact of man-made greenhouse gas emissions on the
world’s climate has become of particular concern in the past 10 years and the knock-on effect on
vulnerable species of conservation concern is also of importance. For Ireland, continued increases
in air temperature around the country, if they occur, are likely to impact on invertebrate
availability for Ireland’s bat species. In general, aerial insect abundance increases with
temperature. Depending on other population limiting factors, which are largely unknown,
generalist foragers that are not confined to specific habitats, such as common pipistrelles, may be
among the species most likely to show corresponding increases in population as a result of
increased air temperature. The effects of climate change on population trends of more selective

Car-Based Bat Monitoring 2003-2008
____________________________
12
foragers, such as those that select specific habitats, will be much more difficult to predict. With
increasing temperatures it is possible that new bat species will migrate and become residents in
Ireland. Other factors that may affect bats include changing conditions for hibernation, increased
storm events and/or windspeeds, increased rainfall and indirect effects such as land use changes,
for example.

Car-Based Bat Monitoring 2003-2008
____________________________
13
METHODS
The BCT designed this car-based bat monitoring method in 2003. To date much bat monitoring work
has been done in other countries by foot-based trained volunteers (e.g. the UK National Bat
Monitoring Programme (NBMP)) but in Ireland, a paucity of trained bat workers until relatively
recently has meant that such monitoring work has not been feasible. The car-based method ensures
that large areas can be covered in one night and the use of a time-expansion detector means that
volunteers do not need to be highly skilled in bat identification to collect the data accurately. Also,
data for three different species can be collected simultaneously.
Training of surveyors has been carried out in summer prior to Survey 1 each year. Each year survey
teams carried out surveys of a mapped route within a defined 30km Survey Square. Every route
covers 20 x 1.609km (1 mile) Monitoring Transects each of which is separated by a minimum distance
of 3.2km (2 miles). Surveyors are asked to carry out the survey on two dates, one in mid to late July
(Survey 1, S1) and one in early to mid-August (Survey 2, S2). Transect coverage begins 45 minutes
after sundown. Each of the 1.609km transects is driven at 24km (15 miles) per hour (at night) while
continuously recording from a time expansion bat detector on to minidisc. Note that in 2003 surveys
were carried out on later dates than in the following years and the survey began 30 minutes after
sunset. For this reason, 2003 data is not included in average bat encounter rate analyses.
Minidiscs are forwarded (in pre-stamped and addressed envelopes) to BCIreland for analysis.
Each track is downloaded to Bat Sound™ and calls are identified to species level where possible.
Species that can be identified accurately using this method are the common, soprano and Nathusius’
pipistrelles (Pipistrellus pipistrellus, P. pygmaeus, P. nathusii). Pipistrelle calls with a peak in
echolocation between 48kHz and 52kHz are recorded as ‘Pipistrelle unknown’ because they could be
either common or soprano pipistrelles. Leisler’s bat (Nyctalus leisleri), a low frequency echolocating
species, can also be easily identified using this method. Occasional calls of Myotis bats are recorded
but these are noted as Myotis spp. since they could belong to one of a number of similar species –
Daubenton’s, whiskered, Natterer’s or Brandt’s bat (Myotis daubentonii, M. mystacinus, M. nattereri, M.
brandtii). Occasional social calls of brown long-eared bats (Plecotus auritus) are also recorded.
For quality control purposes a number of randomly selected .wav files are forwarded each year to Jon
Russ of The BCT for comparative analysis.
Statistical analysis
For overall yearly trends, a Generalised Linear Model (GLM) with a Poisson error distribution (see
Glossary) has been applied to the data. Confidence intervals are generated by bootstrapping at Survey
Square level (Fewster et al., 2000, see Glossary and Appendix I), as used in GAM analysis (see
Glossary and Appendix I). This approach essentially means that the number of encounters per survey
square is modelled using log of the total number of recording intervals as an offset (Offset see
Glossary) but allows use of a Poisson error distribution.

Car-Based Bat Monitoring 2003-2008
____________________________
14
Bat diversity has also been examined using Simpson’s Index of Diversity.
The Power of the data to detect Amber and Red alert declines has been re-examined, as well as power
to detect upward trends. Power to detect downward trends with lower numbers of transects is also
examined, with a view to reducing survey time for future surveys.
Detailed methodology is given in Appendix I.
Other Vertebrates
Other vertebrates were also recorded by surveyors. From 2006 onwards surveyors were asked to note
all vertebrates including cats on their record sheets. In addition, observers had the facility to record
whether each specimen was living or dead and whether each was observed during or after the
transect. This means that recorders were observing living and dead vertebrates, other than bats, along
a 93km (58mile) route on each survey evening.

Car-Based Bat Monitoring 2003-2008
____________________________
15
RESULTS
Volunteers
Training of volunteers is generally carried out in an informal way using a powerpoint presentation,
demonstrating the use of the equipment and listening to a training CD. Training is carried out in a
mutually agreed venue in June, prior to the first survey. Since many of the volunteers have now
completed the survey for several years running, training courses are generally targeted at new
recruits.
In total, from 2004 to 2008, 124 individuals have taken part in the car-based bat monitoring survey.
Fifty of these are staff of the NPWS, 17 staff of the NIEA and the remainder have been members of Bat
Conservation Ireland and willing friends and family members. Between 60 and 70 individuals carry
out the survey work on a yearly basis. On average, approximately 36% of individuals who participate
in the survey in a given year do not participate the following year (see Figure 1). However, core
surveyors or team leaders, who are responsible for the survey equipment and act as the contact
person, tend to be more likely to repeat the survey year on year. On average just 17% of team leaders
(or 6 out of 25 individuals) do not repeat the survey in the following year.
Surveyor Numbers 2004-2008
0
10
20
30
40
50
60
70
80
2004 2005 2006 2007 2008
Total surveyors (TS)
Non-repeat TS
Core surveyors (CS)
Non-repeat CS
Figure 1: Numbers of volunteers taking part in the car-based bat monitoring survey from 2004 to 2008. Purple
bars show number of individuals who did not repeat the survey in the following year. Green bars show core
surveyors, who are responsible for equipment and act as contact, who did not complete the survey in the next
year.

Car-Based Bat Monitoring 2003-2008
____________________________
16
For certain squares, recruiting volunteers has proven more difficult where there are no bat workers
currently residing or wildlife officers do not have sufficient time or specific bat interests. In such
squares the turnover of volunteers has been higher than the average elsewhere because surveyors who
undertake the work inevitably have to travel to the survey area from some distance away.
Very few surveyors, who train in the methodology, take a box of equipment and commit to carrying
out the work, fail to carry out at least one survey. Generally, just one team out of the 28 (4%) do not do
the survey at all in any given year.
The survey represents a considerable input of voluntary time - each survey takes approximately 240
minutes to complete (see Table 1). Therefore, in 2008, for example, when 49 surveys were completed,
approximately 400 hours of volunteer time were spent on the survey.
Table 1: Average time taken to complete the survey and monitoring transect, per year.
Year Average time to
complete survey
(min)
Average time to
complete transect
(sec)
2004 233 273
2005 237 280
2006 243 263
2007 240 259
2008 236 242
The mean time taken to complete a monitoring transect (1.609km/1mile) varies between survey routes.
As the time expansion detector system only samples for 1/11th of the time, there was an average total
sampling time of 22 seconds per monitoring transect in 2008. Also, for every monitoring transect
covered 0.146km (0.091 miles) were actually surveyed (i.e. 1/11th of the distance).
Squares Covered 2003-2008
Seven teams participated in the 2003 pilot scheme and 17 survey routes were surveyed in 2004.
Twenty one squares were surveyed in 2005. An additional five squares were surveyed in 2006,
bringing the total number of surveyed squares to 26 throughout the island. Equipment for 28 squares
was disseminated in 2007 and 2008. Surveys were carried out in 27 of these in both years.

Car-Based Bat Monitoring 2003-2008
____________________________
17
Figure 2: 30km squares in which surveys have been carried out from 2003. Seven of the above squares were
surveyed in 2003 and gradually larger numbers have been surveyed year on year. The letter and numbers refer to
the south western-most corner Ordnance Survey grid reference.
Survey work is carried out from mid-July to the beginning of August and a repeat survey is carried
out from the beginning of August to mid-August.
Of the 27 squares that were surveyed in 2008, 22 of these were repeated (a total of 49 night’s field
work), see Figure 2. In total, between 998km (2004) and 1576km (2008) of monitoring transects have
been driven each year. Each year a number of equipment problems or other difficulties arise, for
example bad weather, that result in surveys being abandoned or poor quality data that cannot be
included in the dataset. In general, the quality of data collected from 2005 onwards has been very
good, however.
In total, 13606 bat encounters have been recorded since 2003. The total number of bats encountered
has increased yearly from 378 in 2003 to 3280 in 2008. See Table 2 to compare yearly totals.

Car-Based Bat Monitoring 2003-2008
____________________________
18
Table 2: Total number of bat encounters and total number of 1.6km transects surveyed per year.
Note that the total number of bat encounters does not necessarily equate to that number of individual
bats since bats may be recorded more than once during a transect and/or recorded in July and again in
August.
Dataset Generated
Table 3 below shows raw bat encounter data, with encounters per 1.6km transect. Note that the results
in Table 1 of both Roche et al. (2005) and Roche et al. (2006) showed erroneous information which is
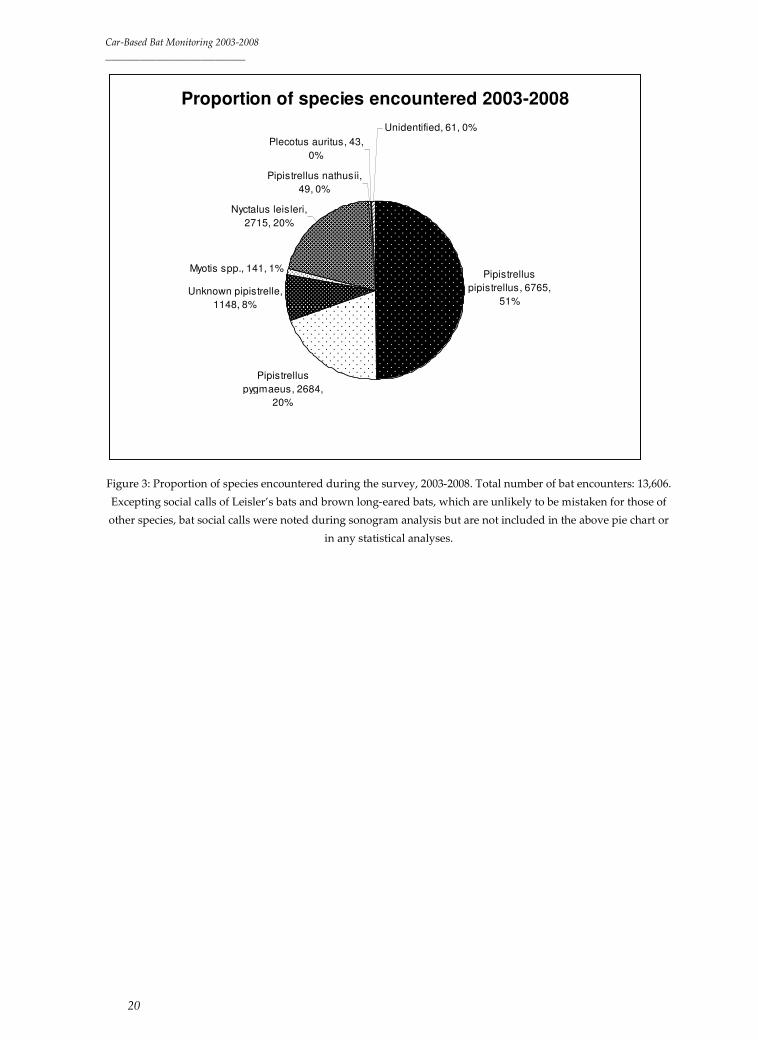
corrected in Table 3 below. Figure 3 shows proportions of each species or species group encountered,
from 2004 to 2008 illustrated as a pie-chart. The common pipistrelle is the most abundant species.
Soprano pipistrelle and Leisler’s bat are equally represented with 20% each of the total bat encounters.
An additional 8% of bat encounters cannot be ascribed to either the common pipistrelle or soprano
pipistrelle and are therefore recorded as ‘unknown pipistrelles’. Myotis spp., Nathusius’ pipistrelles
and brown long-eared bats are rarely encountered.
Year Total No. Bats Transects
2003 378 180
2004 2031 576
2005 1691 608
2006 3212 887
2007 3014 889
2008 3280 927
TOTAL 13606 4067

Car-Based Bat Monitoring 2003-2008
____________________________
19
Table 3: Raw bat encounter data, per 1.609km/1 mile transect, not corrected to encounters per km or per hour,
Car-based Bat Monitoring Scheme 2003-2008. Average number of bats reflects the average number of bat
encounters observed during each 1.609km/1 mile transect travelled. Total Number of Transects (n): 2003 n=180;
2004 n=577 for pipistrelle, Myotis spp. and total bats, n=597 for Leislers1; 2005, n=608; 2006 n=887; 2007 n=889; 2008
n=927, for all species. Note that the detector records for just 1/11th of the time spent surveying so to determine the
actual number of bat encounters per km this must be divided by 0.146 (the total distance sampled for each
1.609km transect).
Average
encounters per
1.6km transect
Common
pipistrelle
Soprano
pipistrelle
Pipistrelle
unidentified
Myotis
spp.
Leisler’s
bat
Nathusius’
pipistrelle
Total
Bats
2003 1.294 0.478 N/a 0.039 0.289 0.000 2.100
2004 1.905 0.695 0.443 0.050 0.511 0.000 3.621
2005 1.344 0.574 0.266 0.035 0.544 0.001 2.781
2006 1.701 0.652 0.271 0.029 0.892 0.033 3.620
2007 1.77 0.639 0.253 0.036 0.631 0.015 3.390
2008 1.686 0.768 0.294 0.029 0.739 0.006 3.537
1 More data was available for Leisler’s than other species in this year due to a detector problem in one
survey square which caused sounds at frequencies above 30kHz to be non-analysable.
Car-Based Bat Monitoring 2003-2008
____________________________
20
Proportion of species encountered 2003-2008
Pipistrellus
pipistrellus, 6765,
51%
Pipistrellus
pygmaeus, 2684,
20%
Unknown pipistrelle,
1148, 8%
Myotis spp., 141, 1%
Nyctalus leisleri,
2715, 20%
Pipistrellus nathusii,
49, 0%
Plecotus auritus, 43,
0%
Unidentified, 61, 0%
Figure 3: Proportion of species encountered during the survey, 2003-2008. Total number of bat encounters: 13,606.
Excepting social calls of Leisler’s bats and brown long-eared bats, which are unlikely to be mistaken for those of
other species, bat social calls were noted during sonogram analysis but are not included in the above pie chart or
in any statistical analyses.

Car-Based Bat Monitoring 2003-2008
____________________________
21
Activity Hotspots and Diversity
High Abundance
Average encounter rates for particular survey squares are subject to a high level of random variation
during each survey. In addition, some squares (such as those in Northern Ireland) have only recently
been added to the survey so a lower number of surveys have been conducted in these compared with
some of the squares further south. However, as a rough exercise in determining overall encounter
rates for different squares, the total number of bat encounters per hour was averaged for each square
from 2004 to 2008. For some squares a full dataset is available, therefore N=10. Other squares have
been surveyed less often so in most cases N ≥ 4. The following map (Figure 4) illustrates a gradation in
overall encounter rates across the island, with higher encounters in the south west and a couple of
midlands squares, and decreasing encounters in the north and north-west. The average total bat
encounter rate per hour for all squares from 2004 to 2008 was 45.20hr-1. Since the common pipistrelle is
the most commonly encountered species, accounting for over 50% of all bats recorded, this map is
heavily biased towards squares with the highest encounters of this species. Indeed decreasing
encounter rates with higher latitudes reflects the relative activity distribution of the common
pipistrelle (e.g. see Figure 7).
Figure 4: Survey squares with total bat encounter rates (per hour) from 2004-2008 expressed as a proportion of the
maximum total encounter rate (Square V99, 81.28hr-1). Pies represent average data from all surveys available,
N=4-10 depending on the square. The overall average rate of total bat encounters for 2004 to 2008 was 45.20hr-1.

Car-Based Bat Monitoring 2003-2008
____________________________
22
Squares V99 and R22 have particularly high encounter rates. Lowest average encounter rates, as may
be expected, are found in squares along the northern and western seaboards; L64 and C72, for
example. Square X49 continues to show somewhat anomalous results with consistently low encounter
rates, despite its location in the south of the island.
Simpson’s Index of Diversity
In order to account for bias towards common pipistrelle abundance, bat diversity has also been examined. Simpson’s Index was applied to the bat encounter data (per hour) for each species in each square.
D = ∑n(n-1)
N(N-1)
where:
n=total encounter rate of a particular species or species group
N=total encounter rate of all species.
The results, shown as Simpson’s Index of Diversity (1-D), are illustrated using pie charts in Figure 5.
The formula 1-D is used because higher numbers reflect higher bat diversity, with 1 indicating
maximum diversity and 0 species uniformity. For Simpson’s Index of Diversity the number reflects
the probability that any given bat encounter will be a different species from the previous bat
encountered. See Appendix II for the full list of Simpson’s Index results for all squares.
Figure 5: Survey squares with Simpson’s Index of Diversity (1-D) shown in orange. High proportion of orange
colour indicates high diversity, or a high probability that any given bat will be a different species from the
previous bat encountered.

Car-Based Bat Monitoring 2003-2008
____________________________
23
The results mainly show that low encounter rate squares are the most diverse, i.e. in low encounter
rate squares, species abundance is more evenly spread than in areas where bats are very abundant.
Examples of squares with low encounter rates but high diversity are C72, G20 and G89.
Abundance and Diversity Combined
Squares with an average total bat encounter rate of >60hr-1 combined with a Simpson’s Index of
Diversity (1-D) score ≥0.6 highlights three squares in particular where both diversity and abundance
are consistently high: S78, V96 and V99. These squares are illustrated in blue in Figure 6. Other
squares that achieve total bat encounters rates >55hr-1 and a Simpson’s Index of Diversity (1-D) ≥0.5
are shown in yellow. All highlighted squares are situated in the south west, midlands and east of the
country.
Figure 6: Overall bat abundance (average total bat encounter rate) and Simpson’s Index of Diversity, combined.
Bat encounter rate >60hr-1 and 1-D≥0.6.
Bat encounter rate >55hr-1 and 1-D≥0.5.
Car-Based Bat Monitoring 2003-2008
____________________________
24
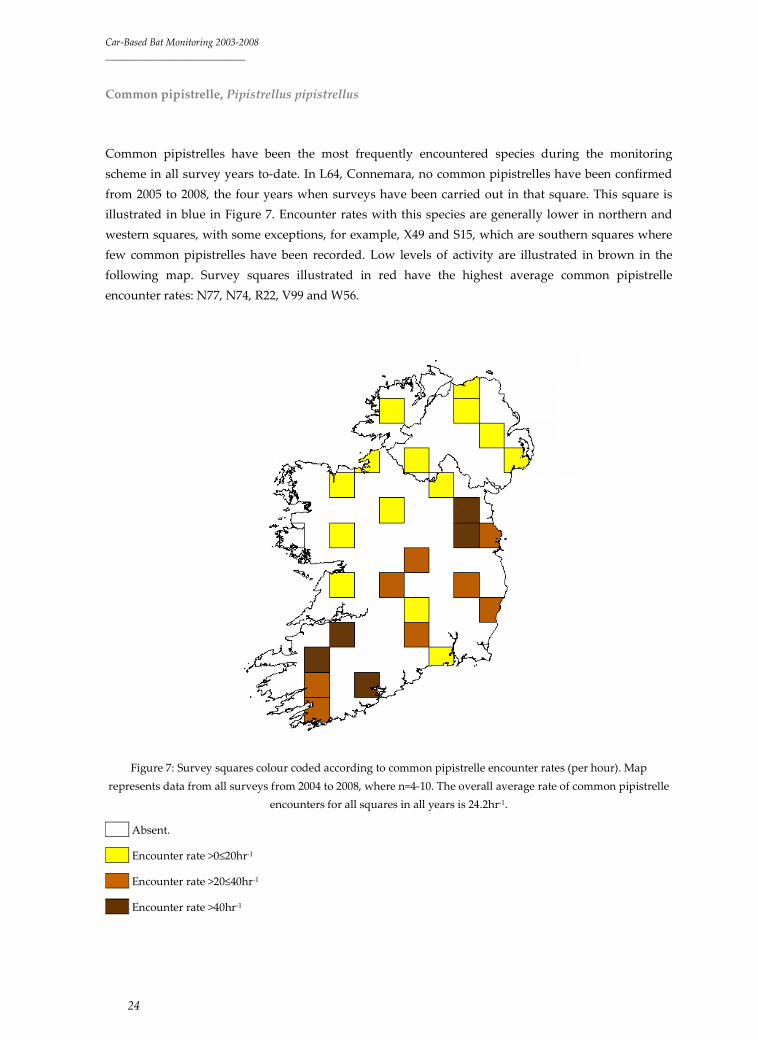
Common pipistrelle, Pipistrellus pipistrellus
Common pipistrelles have been the most frequently encountered species during the monitoring
scheme in all survey years to-date. In L64, Connemara, no common pipistrelles have been confirmed
from 2005 to 2008, the four years when surveys have been carried out in that square. This square is
illustrated in blue in Figure 7. Encounter rates with this species are generally lower in northern and
western squares, with some exceptions, for example, X49 and S15, which are southern squares where
few common pipistrelles have been recorded. Low levels of activity are illustrated in brown in the
following map. Survey squares illustrated in red have the highest average common pipistrelle
encounter rates: N77, N74, R22, V99 and W56.
Figure 7: Survey squares colour coded according to common pipistrelle encounter rates (per hour). Map
represents data from all surveys from 2004 to 2008, where n=4-10. The overall average rate of common pipistrelle
encounters for all squares in all years is 24.2hr-1.
Absent.
Encounter rate >0≤20hr-1
Encounter rate >20≤40hr-1
Encounter rate >40hr-1
Car-Based Bat Monitoring 2003-2008
____________________________
25
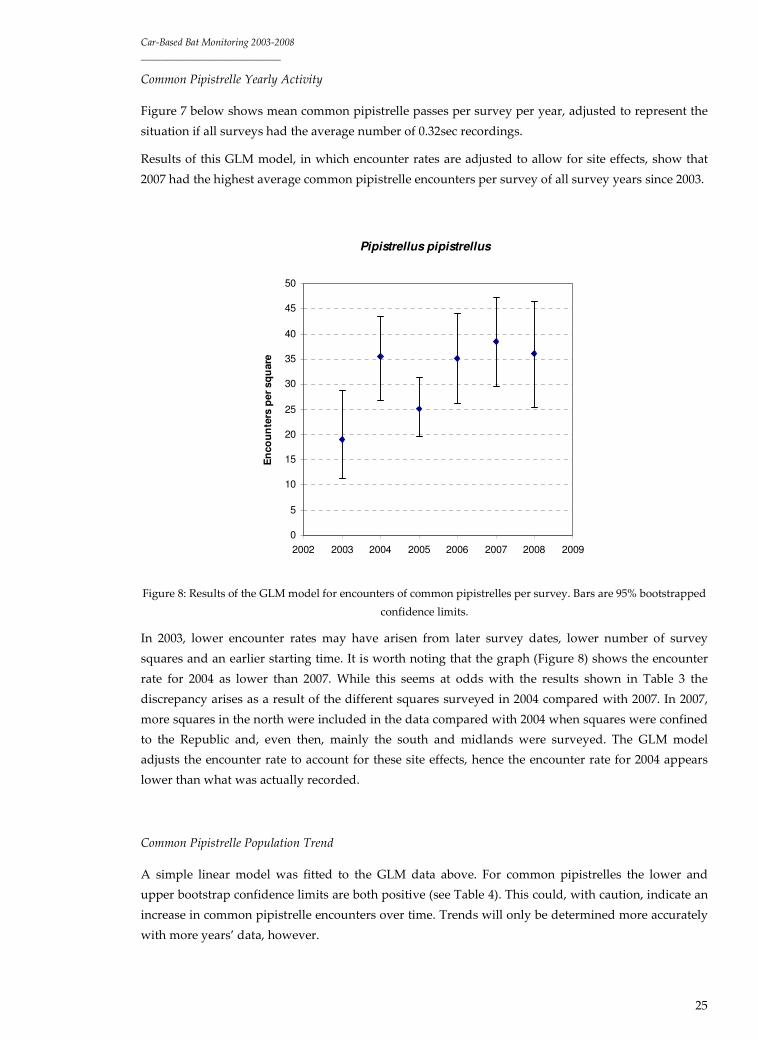
Common Pipistrelle Yearly Activity
Figure 7 below shows mean common pipistrelle passes per survey per year, adjusted to represent the
situation if all surveys had the average number of 0.32sec recordings.
Results of this GLM model, in which encounter rates are adjusted to allow for site effects, show that
2007 had the highest average common pipistrelle encounters per survey of all survey years since 2003.
Pipistrellus pipistrellus
0
5
10
15
20
25
30
35
40
45
50
2002 2003 2004 2005 2006 2007 2008 2009
En
co
un
ters
per
sq
uare
Figure 8: Results of the GLM model for encounters of common pipistrelles per survey. Bars are 95% bootstrapped
confidence limits.
In 2003, lower encounter rates may have arisen from later survey dates, lower number of survey
squares and an earlier starting time. It is worth noting that the graph (Figure 8) shows the encounter
rate for 2004 as lower than 2007. While this seems at odds with the results shown in Table 3 the
discrepancy arises as a result of the different squares surveyed in 2004 compared with 2007. In 2007,
more squares in the north were included in the data compared with 2004 when squares were confined
to the Republic and, even then, mainly the south and midlands were surveyed. The GLM model
adjusts the encounter rate to account for these site effects, hence the encounter rate for 2004 appears
lower than what was actually recorded.
Common Pipistrelle Population Trend
A simple linear model was fitted to the GLM data above. For common pipistrelles the lower and
upper bootstrap confidence limits are both positive (see Table 4). This could, with caution, indicate an
increase in common pipistrelle encounters over time. Trends will only be determined more accurately
with more years’ data, however.

Car-Based Bat Monitoring 2003-2008
____________________________
26
Table 4: Slopes and 95% confidence limits for a linear model of trend. Confidence limits are formed by
bootstrapping at the site level. Slopes relate to the population change on the logarithmic scale per year.
P. pipistrellus
Slope 0.07
95% lower 0.01
95% upper 0.13
Car-Based Bat Monitoring 2003-2008
____________________________
27
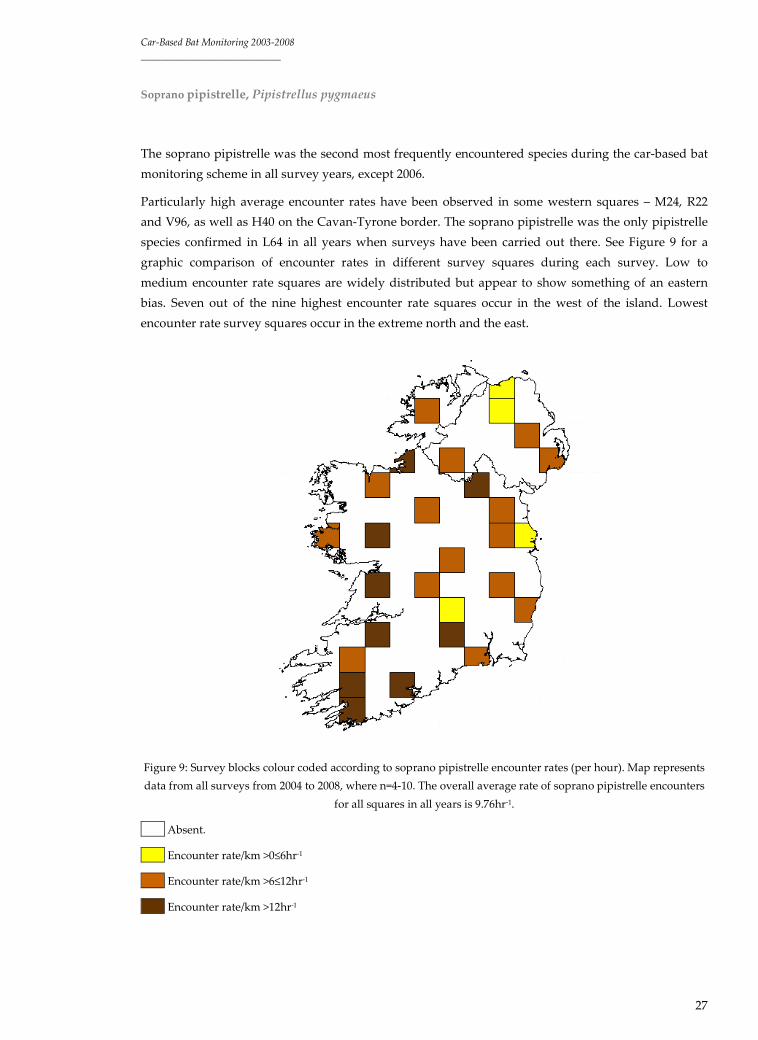
Soprano pipistrelle, Pipistrellus pygmaeus
The soprano pipistrelle was the second most frequently encountered species during the car-based bat
monitoring scheme in all survey years, except 2006.
Particularly high average encounter rates have been observed in some western squares – M24, R22
and V96, as well as H40 on the Cavan-Tyrone border. The soprano pipistrelle was the only pipistrelle
species confirmed in L64 in all years when surveys have been carried out there. See Figure 9 for a
graphic comparison of encounter rates in different survey squares during each survey. Low to
medium encounter rate squares are widely distributed but appear to show something of an eastern
bias. Seven out of the nine highest encounter rate squares occur in the west of the island. Lowest
encounter rate survey squares occur in the extreme north and the east.
Figure 9: Survey blocks colour coded according to soprano pipistrelle encounter rates (per hour). Map represents
data from all surveys from 2004 to 2008, where n=4-10. The overall average rate of soprano pipistrelle encounters
for all squares in all years is 9.76hr-1.
Absent.
Encounter rate/km >0≤6hr-1
Encounter rate/km >6≤12hr-1
Encounter rate/km >12hr-1
Car-Based Bat Monitoring 2003-2008
____________________________
28
In 2006 REML modelling indicated that there was a not quite significant negative relationship between
encounter rates and grid reference eastings (p=0.09) (Roche et al. 2007).
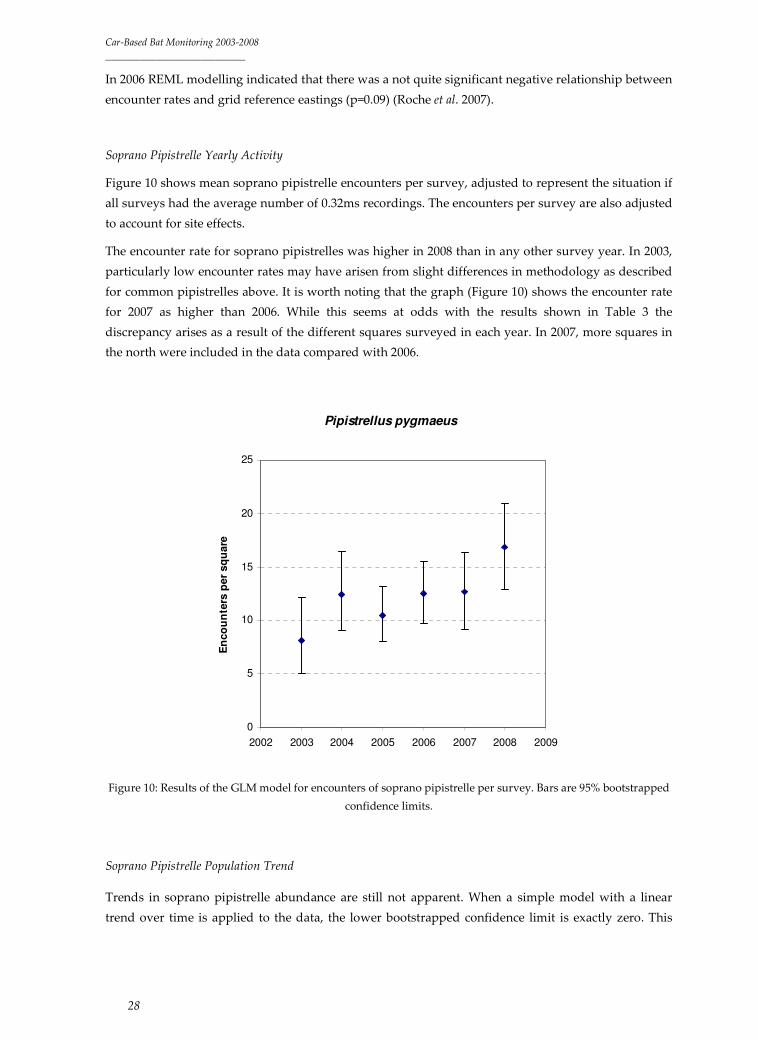
Soprano Pipistrelle Yearly Activity
Figure 10 shows mean soprano pipistrelle encounters per survey, adjusted to represent the situation if
all surveys had the average number of 0.32ms recordings. The encounters per survey are also adjusted
to account for site effects.
The encounter rate for soprano pipistrelles was higher in 2008 than in any other survey year. In 2003,
particularly low encounter rates may have arisen from slight differences in methodology as described
for common pipistrelles above. It is worth noting that the graph (Figure 10) shows the encounter rate
for 2007 as higher than 2006. While this seems at odds with the results shown in Table 3 the
discrepancy arises as a result of the different squares surveyed in each year. In 2007, more squares in
the north were included in the data compared with 2006.
Pipistrellus pygmaeus
0
5
10
15
20
25
2002 2003 2004 2005 2006 2007 2008 2009
En
co
un
ters
per
sq
uare
Figure 10: Results of the GLM model for encounters of soprano pipistrelle per survey. Bars are 95% bootstrapped
confidence limits.
Soprano Pipistrelle Population Trend
Trends in soprano pipistrelle abundance are still not apparent. When a simple model with a linear
trend over time is applied to the data, the lower bootstrapped confidence limit is exactly zero. This

Car-Based Bat Monitoring 2003-2008
____________________________
29
implies an increase of borderline significance. However, more data is required before trends can be
definitively deduced.
Table 5: Slopes and 95% confidence limits for a linear model of trend. Confidence limits are formed by
bootstrapping at the site level. Slopes relate to the population change on the logarithmic scale per year.
P. pygmaeus
Slope 0.10
95% lower 0.00
95% upper 0.20

Car-Based Bat Monitoring 2003-2008
____________________________
30
Leisler’s bat, Nyctalus leisleri
Leisler’s bats have been the third most frequently encountered species during the monitoring scheme
in all survey years to-date, except 2006 when the species was the second-most common. This species
has been encountered in all survey squares. Low levels of activity are illustrated in brown in the
following map (Figure 11). Encounter rates with this species are generally lowest in north western
squares. Survey squares illustrated in red have the highest average Leisler’s bat encounter rates: H79,
J06, N77, S12, S78, V93, V96 and V99. These squares are located mainly in the south-west, south and
east of the country.
Figure 11: Survey blocks colour coded according to Leisler’s bat encounter rates (per hour). Map represents data
from all surveys from 2004 to 2008, where n=4-10. The overall average rate of Leisler’s bat encounters for all
squares in all years is 10.39hr-1.
Absent.
Encounter rate/km >0≤6hr-1
Encounter rate/km >6≤12hr-1
Encounter rate/km >12hr-1
Car-Based Bat Monitoring 2003-2008
____________________________
31
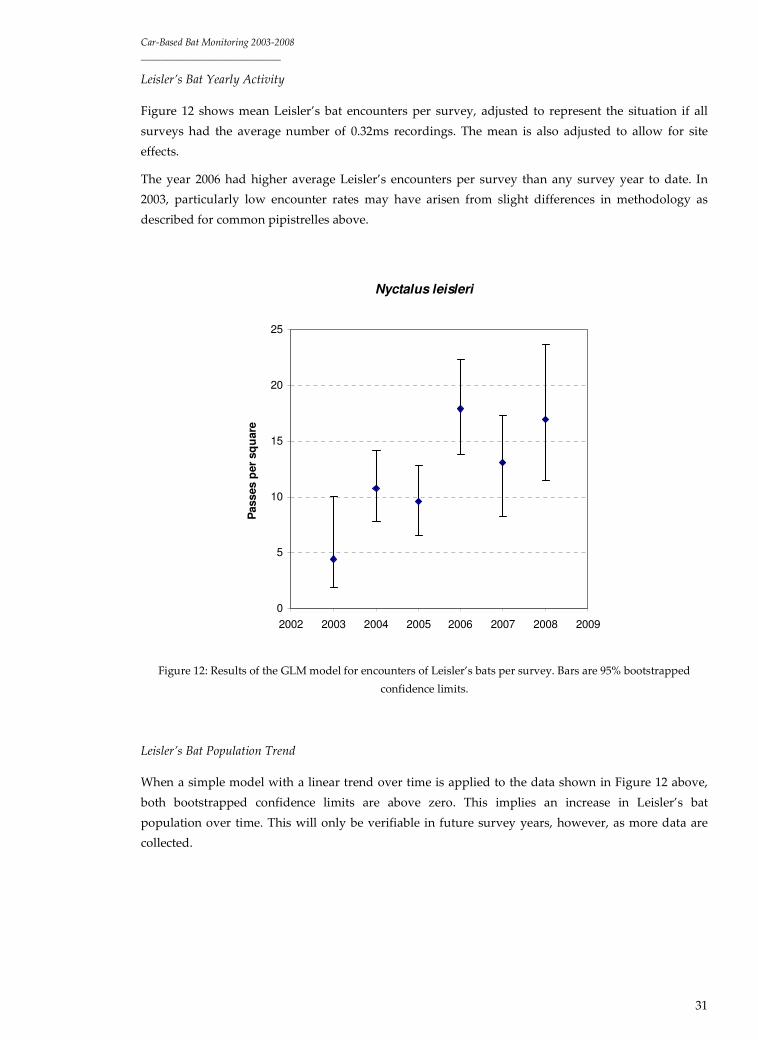
Leisler’s Bat Yearly Activity
Figure 12 shows mean Leisler’s bat encounters per survey, adjusted to represent the situation if all
surveys had the average number of 0.32ms recordings. The mean is also adjusted to allow for site
effects.
The year 2006 had higher average Leisler’s encounters per survey than any survey year to date. In
2003, particularly low encounter rates may have arisen from slight differences in methodology as
described for common pipistrelles above.
Nyctalus leisleri
0
5
10
15
20
25
2002 2003 2004 2005 2006 2007 2008 2009
Pass
es p
er
sq
uare
Figure 12: Results of the GLM model for encounters of Leisler’s bats per survey. Bars are 95% bootstrapped
confidence limits.
Leisler’s Bat Population Trend
When a simple model with a linear trend over time is applied to the data shown in Figure 12 above,
both bootstrapped confidence limits are above zero. This implies an increase in Leisler’s bat
population over time. This will only be verifiable in future survey years, however, as more data are
collected.

Car-Based Bat Monitoring 2003-2008
____________________________
32
Table 6: Slopes and 95% confidence limits for a linear model of trend. Confidence limits are formed by
bootstrapping at the site level. Slopes relate to the population change on the logarithmic scale per year.
N. leisleri
Slope 0.15
95% lower 0.03
95% upper 0.23

Car-Based Bat Monitoring 2003-2008
____________________________
33
Nathusius’ pipistrelle, Pipistrellus nathusii
This species was recorded for the first time by the car monitoring scheme in 2005 in square N77, the
North-East. This species is known to be resident in Northern Ireland and, while it has been recorded
in the Republic, its status there is somewhat unclear.
Figure 13: Presence (black) / absence (white) of Nathusius’ pipistrelle in 2006 (top), 2007 (bottom left) and 2008
(bottom right). Note that some squares indicate absence but were not surveyed in a particular year. Nathusius’
pipistrelle has not been recorded in all three years in any survey square, although J06, a stronghold for the bat,
was not surveyed in 2008.
The car-based bat monitoring results for 2006 saw a dramatic increase in Nathusius’ pipistrelle
encounters across the island. While some of these occurred in newly surveyed squares in Northern
Ireland, where Nathusius’ pipistrelles may be expected to occur, additional recordings of the species
were made in squares that had been surveyed for a number of years prior to 2006 but where the
species had not previously been recorded. R22, S78, T05, N11 and V96 were among the first squares
mapped and surveyed in 2003 and most were surveyed every year since, but Nathusius’ pipistrelle
was recorded in each in 2006 for the first time.
In general Nathusius’ pipistrelle has been recorded from the north, east and south-west with no
records in western squares such as L64, M24 or G20.

Car-Based Bat Monitoring 2003-2008
____________________________
34
Nathusius’ Pipistrelle Yearly Activity
Figure 14 shows mean Nathusius’ pipistrelle encounters per survey, adjusted to represent the
situation if all surveys had the average number of 0.32ms recordings. The encounters per survey are
also adjusted to account for site effects. Highest encounter rates were recorded in 2006.
Pipistrellus nathusii
0.0
0.1
0.2
0.3
0.4
0.5
0.6
0.7
0.8
0.9
1.0
2002 2003 2004 2005 2006 2007 2008 2009
En
co
un
ters
per
sq
uare
Figure 14: Results of the GLM model for Nathusius’ pipistrelle encounters per survey. Bars are 95% bootstrapped
confidence limits.
Nathusius’ Pipistrelle Population Trend
Data collected thus far shows an increase to 2006 followed by a decrease to 2008 levels. While data is
very sparse for this species, the trend may be quadratic. Certainly, when a simple model is fitted to the
data, with a linear trend over time, the lower bootstrapped confidence interval for Nathuisus’
pipistrelle is negative (see Table 7). This indicates that the species may not currently be on the
increase, as was thought in previous reports (e.g. Roche et al. 2007).
Table 7: Slopes and 95% confidence limits for a linear model of trend. Confidence limits are formed by
bootstrapping at the site level. Slopes relate to the population change on the logarithmic scale per year.
P. nathusii
Slope 0.29
95% lower -0.02
95% upper 0.52

Car-Based Bat Monitoring 2003-2008
____________________________
35
Myotis bats
Myotis bats have been recorded from all but six of the 28 survey squares (see Figure 15). Locations of
Myotis bat records from the car-based bat monitoring scheme are widely distributed throughout the
country.
Figure 15: Survey blocks colour coded according to Myotis bat presence/absence, 2004 to 2008. Locations where
Myotis bats have been recorded are highlighted in black. White squares indicate an absence of records to-date.
Myotis bats occur in such low numbers during the car-based bat monitoring survey that little can be
determined about trends, due to the large error bars surrounding each yearly estimate (see Figure 16).
A simple model fitted to the Myotis data with a linear trend over time does not give any indication of
trends either since the bootstrapped confidence intervals encompass zero. Should trends in Myotis
encounter rates become apparent in time, these should be treated cautiously since the results for
Myotis bats are likely to comprise a number of species.

Car-Based Bat Monitoring 2003-2008
____________________________
36
Myotis species
0.0
0.2
0.4
0.6
0.8
1.0
1.2
1.4
1.6
1.8
2002 2003 2004 2005 2006 2007 2008 2009
En
co
un
ters
per
sq
uare
Figure 16: Results of the GLM model for Myotis encounters per survey. Bars are 95% bootstrapped confidence
limits.

Car-Based Bat Monitoring 2003-2008
____________________________
37
Brown long-eared bat, Plecotus auritus
This species was encountered for the first time by the car monitoring scheme in 2005. The species is
largely undetectable by the scheme due to its quiet echolocation calls. However, it does occasionally
produce social calls of higher amplitude (loudness). Locations of Survey Squares where the species
has been recorded are shown in Figure 17.
Figure 17: Survey blocks colour coded according to brown long-eared bat social call presence/absence, 2004 to
2008. Locations where brown long-eared bats have been recorded are highlighted in black. White squares
indicate an absence of records.
This species is monitored using a separate scheme of counting individuals at roosts, see Aughney et al.
2009.

Car-Based Bat Monitoring 2003-2008
____________________________
38
Power Analysis
Detecting Declines or Increases
The Power of the data to detect Red or Amber Alert declines, or population increases, was
investigated using all available data. Power analysis results, using two surveys per year with varying
numbers of squares are shown in Tables 8 and 9. Individual values are subject to estimating errors so
it is necessary to take a broad view of the effectiveness of different numbers of transects, comparing
for a range of scenarios. The differences from previous results (see Roche et al., 2006) are generally
small, with some minor reductions in the time taken.
Table 8: Number of years (including the extra years needed at either end of the GAM curve) to achieve 80%
power for Amber and Red Alert Declines (i.e. 25% or 50% decline over 25 years). [Whilst the number of years
must be an integer in reality results are shown here with one decimal place to aid comparisons. Standard errors
are 1.0 years for most estimates, but will be larger for values over 28 years (shown in italics). All figures use 20
one mile transects per square.]
Common pipistrelles Soprano pipistrelles Leisler’s
No. of
Squares
Amber Red Amber Red Amber Red
10 21.9 11.7 31.6 12.8 31.3 13.4
15 18.8 10.9 24.6 12.6 21.2 13.7
20 15.9 8.2 19.4 11.2 22.6 12.3
25 14.3 6.7 19.2 9.7 19.8 11.8
Power analysis was also carried out on the effect of doubling of numbers over 25 years (Table 9). Since
the GAM models are additive on a logarithmic scale, the power for a doubling of the population could
be expected to be roughly the same as for a halving (i.e. the same as the red alert which is a 50%
reduction over 25 years). This does appear to be roughly the case; differences are larger for 10 squares,
but this result may not be reliable since 10 squares is really too few for the bootstrapping process.
Table 9: Number of years (including the extra years needed at either end of the GAM curve) to achieve 80%
power for a 100% increase (i.e. doubling of the population) over 25 years. [Whilst the number of years must be an
integer in reality results are shown here with one decimal place to aid comparisons. Standard errors are 1.0 years
for most estimates. All figures use 20 one mile transects per square.]
No. of Squares Common pipistrelles Soprano pipistrelles Leisler’s
10 12.7 16.5 17.9
15 8.3 12.8 13.3
20 9.1 11.3 12.4
25 7.9 8.2 10.7

Car-Based Bat Monitoring 2003-2008
____________________________
39
Number of Transects
A review of data in Roche et al., (2008) showed that the best way to reduce survey time is to cut down
on the number of transects covered rather than cut out the two mile gaps between transects. Power
analysis was carried out in summer 2008 (therefore without the data from 2008) to determine what
kind of scenario could result in shorter survey times while minimising loss of precision within the
data.
Table 10 (a to d) shows the results of this Power Analysis. Rows highlighted in grey show the
difference in Power when between 20 and 25 squares are surveyed twice annually, either with 20 or 15
one mile transects.
Table 10: number of years (including the extra years needed at either end of the GAM curve) to achieve 80%
power for various scenarios. [Whilst the number of years must be an integer, in reality, results are shown here
with one decimal place to aid comparisons. Standard errors are 1.0 years for most estimates, but will be larger for
values over 28 years (shown in italics). Note that Table 10a results shown below differ slightly from results shown
in Table 9, this is because Table 9 includes 2008 data, which were not available for the analysis shown here.]
a) 20 one mile transects per square
Common pipistrelles Soprano pipistrelles Leisler’s
No. of Squares Amber Red Amber Red Amber Red
10 18.1 11.2 33.2 13.8 38.2 15.7
15 15.6 8.6 26.6 11.7 29.7 14.4
20 15.0 7.8 20.4 12.4 25.9 14.0
25 14.7 7.6 20.3 9.7 23.5 12.7
b) 15 one mile transects per square
Common pipistrelles Soprano pipistrelles Leisler’s
No. of Squares Amber Red Amber Red Amber Red
10 18.7 11.9 37.0 16.2 35.4 17.0
15 16.8 8.9 28.8 13.0 29.9 13.5
20 14.6 7.8 25.2 13.7 25.6 14.0
25 13.3 7.7 22.7 11.3 25.1 12.8
c) 10 one mile transects per square
Common pipistrelles Soprano pipistrelles Leisler’s
No. of Squares Amber Red Amber Red Amber Red
10 24.5 9.3 42.1 16.8 >30 17.4
15 18.5 10.0 31.3 13.4 31.1 14.5
20 17.4 9.4 27.6 13.7 27.5 14.6

Car-Based Bat Monitoring 2003-2008
____________________________
40
25 15.5 9.8 25.0 12.5 25.4 13.7
d) 5 one mile transects per square
Common pipistrelles Soprano pipistrelles Leisler’s
No. of Squares Amber Red Amber Red Amber Red
10 27.7 13.6 51.9 19.1 61.1 23.6
15 22.2 12.3 35.1 15.7 37.8 18.6
20 19.3 12.1 32.6 15.8 33.1 17.0
25 18.4 9.9 29.7 16.1 31.4 15.7
Comparing 15 transects (Table 10b) with the current design (Table 10a), it can be seen that there is
very little loss of efficiency; most Alerts take only 1-2 more years to detect. Only for soprano
pipistrelles with small numbers of squares is there an appreciable increase in the number of years
required. For 10 transects, the change in the time required from the full 20 transects is still relatively
small for common pipistrelle and Leisler’s. Only when the number of transects is reduced down to 5
(Table 10d) does the impact on power become really marked.

Car-Based Bat Monitoring 2003-2008
____________________________
41
OTHER VERTEBRATES
Dog
10%
Cat
52%
Fox
11%
Rabbit
10%
Hare
1%
Frog
2%
Badger
2%
Deer
2%
Hedgehog
2%
Ow l
1%
Other
0%
Small Mammal
7%
Other Mustelid
0%
Figure 17: Living vertebrates, other than bats, observed during all surveys 2006-2008 n=1109. Surveys prior to
2006 did not include cats and dogs so results are not included. ‘Small mammals’ category includes mice, rats,
pygmy shrews, voles and unidentified small mammals. The ‘Others’ category includes horses and birds. The
‘Other mustelids’ category includes stoat, mink and pine marten.
Surveyors were asked to record living and dead vertebrates other than bats during survey transects in
2004 and 2005. From 2006, recording of other vertebrates was carried out throughout the survey,
during and between transects, thus covering far larger areas than in previous years. From 2006
surveyors were also specifically requested to record cats and dogs.
Between 4,100 and 4,600km of roads were surveyed for vertebrates other than bats each year since
2006. Of particular interest from 2006 onwards was the high number of cats observed. Cats constitute
52% of the total living vertebrate records from 2006 to 2008 (see Figure 17). The second most
frequently recorded vertebrate is the fox at 11%. Similar numbers of rabbits and dogs are also
recorded (10% each). Rare and/or protected species of interest are also occasionally recorded, such as
barn owls and pine martens.

Car-Based Bat Monitoring 2003-2008
____________________________
42
Table 11: Number of living and dead vertebrates, other than bats, recorded by surveyors, 2004 onwards.
Year Living
Vertebrates
Dead
Vertebrates
2004 62 9
2005 80 4
2006 322 28
2007 383 21
2008 404 29
Trends in encounter rates of other mammals or vertebrates have not been examined to-date. Overall
average total encounter rates have increased steadily, from 0.077km-1 in 2006, 0.084km-1 in 2007 and
0.095km-1 in 2008 (see Figure 18).
Vertebrate Encounters (apart from bats) per Kilometre
0
0.02
0.04
0.06
0.08
0.1
0.12
2006 2007 2008
Total vertebrates
Total vertebrates except
cats
Figure 18: Total vertebrate encounters per kilometre for the years 2006 to 2008 shown in blue. The same data with
cat encounters subtracted is shown in pink.
A plot of the same data with the most abundant species, the cat, removed shows that the increasing
trend is largely due to the increase in the number of cats observed per kilometre since 2006. The totals
for other vertebrates (minus cats), when plotted separately on the same Figure (18) are largely static.
Further year’s data are required before the increasing trend in cat numbers can be confirmed.

Car-Based Bat Monitoring 2003-2008
____________________________
43
Dog
3% Cat
14%
Fox
8%
Rabbit
27%Badger
14%
Deer
1%
Hedgehog
9%
Small Mammal
19%
Other
5%
Figure 19: Dead vertebrates, other than bats, observed during all surveys 2006-2008 n=78. Surveys prior to 2006
did not include cats and dogs or records between transects, so results are not included. ‘Small mammals’ category
includes mice and rats. The ‘Other’ category includes crows (2) and pheasants (1).
Comparing the live (Figure 17) versus dead (Figure 19) specimen pie charts reveals quite a
discrepancy in species distribution of the two. Cats only constitute 14% of the dead specimens
observed, despite accounting for over 50% of all live vertebrate sightings. Rabbits, the third most
frequently recorded living vertebrates, are the most commonly observed dead species found along
roadsides, accounting for 27% of all dead specimen records. Also, badgers constitute 14% of the dead
animals encountered compared with just 2% of the live fauna. Similarly, just 2% of live specimens are
hedgehogs, while this species accounts for 9% of the dead roadside fauna.

Car-Based Bat Monitoring 2003-2008
____________________________
44
DISCUSSION
Volunteer uptake
To date there has been little difficulty recruiting volunteers for the car-based bat monitoring survey.
Training has been relatively informal but targeted solely at surveyors who have committed to
volunteering the time required. This approach has worked well. Surveyors have shown a very high
level of dedication with a relatively low turnover of team leaders from year to year. Certain squares
have a higher turnover than others, mainly due to a lack of resident bat workers or wildlife officers
with available time in those locations. The high level of year to year repetition among core surveyors
is one of the reasons why the survey has been so successful in reaching its targets each year.
Survey coverage
Since 2007 up to 28 squares distributed around the island have been surveyed yearly. This is very
good coverage with all regions of the country included in the survey. Bat encounter rates can therefore
be assumed to provide a good representation of overall encounter rates for roadsides throughout the
island.
Dataset
Good numbers of bats are generally encountered by the survey. In total 13,606 bat encounters have
been recorded since the first surveys were carried out in 2003. Over 50% of these are common
pipistrelles with soprano pipistrelles and Leisler’s bats recorded in similar numbers accounting for
20% each. Comparisons with data from the Bats and Roadside Mammals Project in the UK, for
example in 2008, (Russ et al., 2008), show almost universally higher encounter rates among these
species in Ireland compared with Britain. Common pipistrelle encounter rates were 1.05km-1 in
Ireland, compared with 0.81km-1 in Britain in 2008. Soprano pipistrelle encounter rates were also
higher in Ireland, 0.48km-1, compared with 0.39km-1 in Britain in 2008. The encounter rate with
Leisler’s bat in Ireland was a whole order of magnitude higher at 0.46km-1 compared with Britain at
0.01km-1. It should be noted that there are several differences in methodology between the two
surveys that may account for differences in species encounter rates between the two islands, although
Leisler’s bat is most certainly more abundant in Ireland than Britain.
Abundance and Diversity
Examination of both encounter rates and recorded bat diversity in each of the 30km squares shows
that, while some of the low encounter rate squares are quite diverse and some high encounter rate
squares less so, when the two elements are combined the most abundant squares with high bat
diversity are found in the south west, midlands and east of the country. V96 and V93, in Kerry and

Car-Based Bat Monitoring 2003-2008
____________________________
45
west Cork, respectively, along with S78 in Carlow/west Wicklow are the survey squares with greatest
abundance and bat diversity combined. While habitat analysis may contribute to some understanding
of this result, particularly with regard to the specific squares highlighted, climate is also likely to play
a significant role in these findings. Ideally, it should be possible to develop a predictive model for
general bat activity and diversity along roadsides throughout the island, based on the current dataset
and an analysis of habitats and climate.
Species Abundance and Yearly Trends
Common Pipistrelles
This species is distributed widely throughout the country but it has never been recorded during the
surveys of L64 in Connemara. This species is significantly correlated with grid reference eastings and
negatively correlated with northings (Roche et al., 2007). It is less frequently encountered in the
extreme north and north-west although it does occur there.
Highest common pipistrelle encounter rates were recorded by the car-based bat monitoring scheme in
2007. Encounter rates dropped slightly in 2008. July and August 2008 were exceptionally wet and high
rainfall may have accounted for the slightly depressed activity of this species compared with the
previous year (weather data from www.meteireann.ie). Despite the slight drop in activity levels from
2007 to 2008 this species may, overall, be on an increasing trend, although this needs to be verified
with more years of data. Certainly, for an opportunistic forager such as the common pipstrelle (e.g.
Davidson-Watts et al., 2006), increasing air temperatures associated with continuing climate change
seem likely to result in population increases (see also Roche et al., 2008 for more detailed discussion).
Soprano pipistrelles
Soprano pipistrelles are usually the second most frequently encountered species by the car-based bat
monitoring scheme (2006 excepted). This species may not occur along roads as frequently as the
common pipistrelle, or, because it has higher frequency echolocation calls, it may not be as detectable
where it does occur.
A gradation in activity distribution of this species is not as apparent for this species as it is for the
common pipistrelle. Highest encounter rate survey squares mainly, however, occur in the west of the
island and lowest encounter rate squares are located in the east and extreme north. In some studies
soprano pipistrelles have been shown to actively select riparian habitats for foraging (e.g. Davidson-
Watts et al., 2006; Nicholls and Racey, 2006; Russ and Montgomery 2002). The west of Ireland, with its
high rainfall and relatively mild temperatures may therefore provide ideal conditions for this species,
while the extreme north may be less ideal due to lower average temperatures.
Soprano pipistrelles were recorded more frequently in 2008 than in any previous year, despite the
high rainfall experienced during the two survey months in that year. The soprano pipistrelle
population may be increasing but more years of data need to be collected before any conclusions can

Car-Based Bat Monitoring 2003-2008
____________________________
46
be made. The Bats and Roadside Mammals project in Britain saw a parallel increase in soprano
pipistrelle encounters in 2008 (Russ et al., 2008).
Leisler’s Bat
This species is usually the third most frequently encountered species from the monitoring scheme
(excepting 2006 when it was second, see Roche et al., 2007). The encounter rate with Leisler’s bats
increased in 2008 compared with 2007.
In 2006, REML analysis showed a significant positive association with the south of the island, and an
association of borderline significance with the east of the island. Average encounter rate data from
2004 to 2008 confirms these associations, whereby squares with high Leisler’s activity are concentrated
in the south and east of the island.
The population of this species may be on an increasing trend, although, at the relatively early stage of
year six of the scheme, this needs to be verified with more years of surveying. Comparable data from
the ‘Bats and Roadside Mammals’ project in Britain showed a decrease in Leisler’s abundance in 2008
compared with 2007 (Russ et al., 2008) but overall trend data is not yet available from Britain since the
project has been running there for a shorter timescale.
Nathusius’ Pipistrelle
This species was recorded for the first time by the car-based bat monitoring scheme in a square in the
north-east in 2005. 2006 saw a massive increase in the number of Nathusius’ pipistrelle encounters
along with an increase in the number of squares where the species was recorded. While 2006 was the
first year that included surveys in Northern Ireland, many of the new records for the species were
derived from squares south of the border and where the species had not been previously recorded.
The bat was recorded in additional squares in 2007, but was not re-recorded in all of the squares
where it had been observed in 2006. In 2008 the encounter rate with this species dropped further so
that it now appears as though the population is on a quadratic trend. Encounters with the species are
so low, however, that large error bars surround the trend estimates and any discussion on patterns in
the data should be viewed with caution. The records of Nathusius’ pipistrelle derived from the car-
based bat monitoring scheme are widely distributed across the island but so far the species has been
absent from survey squares in the mid-west.
A similar increase in Nathusius’ pipistrelle abundance to that observed in Ireland in 2006 was
recorded by the car-based bat survey in the UK in 2006 (Russ et al. 2006) and the encounter rate with
this species has continued to drop from the 2006 levels in Britain (see Russ et al., 2007 and Russ et al.,
2008).

Car-Based Bat Monitoring 2003-2008
____________________________
47
Myotis Bats
Small numbers of Myotis bats have been encountered each year. No Myotis calls were identified to
species level. Numbers of encounters with Myotis species from the car-based bat monitoring scheme
are too low to determine population trends. Myotis bats have been recorded in most survey squares.
Brown Long-eared Bat
Social calls from this species were recorded by the car-based bat monitoring scheme for the first time
in 2005. Similar numbers of encounters with the species were recorded in 2006 and 2007. The number
of encounters is still too low to determine population trends, however. This species has been recorded
from more than half of the survey squares and records have been widely distributed around the
island.
Power Analysis
Power analysis was revisited using all the data available from 2003. Results confirmed that car-based
bat monitoring is a robust method for monitoring the three target species – common pipistrelle,
soprano pipistrelle and Leisler’s bat.
With between 20 and 25 squares surveyed twice yearly the number of years required to achieve 80%
power for Red Alert declines is approximately 7-8 for common pipistrelles and 10-12 for soprano
pipistrelles and Leisler’s bats. Amber Alerts take longer to achieve at 14-16 years for common
pipistrelles and 19-22 for soprano pipistrelles and Leisler’s bats.
It has been assumed, to date, that the time needed to achieve 80% power to detect Red or Amber Alert
decreases would mirror the time needed to achieve 80% power for equivalent increases. This
assumption was checked for the first time and was shown to be roughly correct. Some differences
were visible in the time needed to achieve 80% power with lower number of squares (10) but these
particular results may not be reliable since this number of squares is too low for the bootstrapping
process anyway. In reality a far higher number of squares, between 22 and 24, are surveyed twice
yearly.
The real data collected by the car-based bat monitoring scheme should therefore be on target to
achieve power for declines or increases within the timeframes shown.
Reducing Survey Time
Roche et al. (2008) reviewed the options available for reducing survey time. Statistically, there were
some concerns about removing the two mile gap between transects and driving a continuous route,
even though this would make the Irish scheme comparable to some of the other European monitoring
schemes. Therefore, analyses were carried out to determine the affect on power of reducing the
number of transects on a survey route. At the current number of squares surveyed (between 20 and

Car-Based Bat Monitoring 2003-2008
____________________________
48
25) with a reduction to 15 transects there is a broad pattern showing a slight increase (approximately
0.5) in the number of years required to achieve 80% power for declines in common pipistrelles and
Leisler’s bats. The soprano pipistrelle shows a greater increase in timespan by about 2-3 years.
Reducing transect numbers would lessen survey time, lower fuel costs and reduce the carbon
footprint of the scheme. If the increase in time required to detect declines (by roughly half a year for
common pipistrelles and Leisler’s and two to three years for soprano pipistrelles) is considered
acceptable, then reducing survey length to 15 transects appears ideal. With this number of transects
per survey it would not be necessary to increase the number of squares to compensate for loss in
precision. Average length of survey time for a 15 transect survey would be reduced by one hour.
Therefore the surveyor input per annum could be expected to decrease to roughly 300hrs (based on
two person teams).
Other Vertebrates
Average encounter rates with other vertebrates have increased yearly since 2006. However, this
increase is due to a corresponding increase in cat numbers. The cat is by far the most commonly
occurring mammal species along Irish roadsides at night. Cats account for over 50% of all ‘other
vertebrate’ sightings recorded during the car survey. Trends in total vertebrate encounters, excepting
cats, have been largely static since 2006 but when more years of data have been collected it may be
valid to examine trends in some of the other relatively common species such as foxes and rabbits.
A wider variety of mammal species are present in Britain, as may be expected, but rabbits are the most
frequently recorded species there (Russ et al., 2008). Cats are the second most frequently recorded
species in Britain where 0.012km-1 were recorded in 2008, compared with 0.05km-1 in Ireland.
Dead vertebrates along roads are also recorded by the car-based bat monitoring surveyors. Despite
their prevalence along Irish roadsides at night, cats are rarely recorded dead on the roads. Just 14% of
dead specimens were cats compared with over 50% of live animals. Badgers, rabbits and hedgehogs
account for a far greater proportion of the dead fauna observed along roadsides, compared with live
fauna. Badger carcasses may persist for longer on the roadside, compared with some small animal
carcasses, and hedgehogs may also remain identifiable for a long time on account of their spines.
Certain behavioural patterns may account for an increased likelihood of car collisions among these
species.

Car-Based Bat Monitoring 2003-2008
____________________________
49
PROPOSALS FOR THE FUTURE OF CAR-BASED BAT MONITORING
Methodology
Continue as at present surveying each square twice yearly, but drop the last five transects on each
survey route.
Habitat Use
Land classifications for Ireland and possible methods of examining habitat associations of different bat
species should be examined in 2009.

Car-Based Bat Monitoring 2003-2008
____________________________
50
REFERENCES
Armitage, P. and Berry, G. (1987) Statistical Methods in Medical Research. 2nd Ed. Blackwell Scientific Publications Oxford.
Aughney, T., Carden, R., Roche, N. and Langton, S. (2009) Irish Bat Monitoring and Recording Schemes: Annual Report for 2008. In prep.
Aughney, T., Langton, S. and Roche, N. (2007) All-Ireland Daubenton’s Bat Waterway Survey 2006, Irish Bat Monitoring Programme. Bat Conservation Ireland. Report submitted to The National Parks and Wildlife Service.
Aughney, T. and Roche, N. (2008) Brown long-eared bat Plecotus auritus Roost Monitoring 2007, Irish Bat Monitoring Programme. Bat Conservation Ireland. Report submitted to The National Parks and Wildlife Service.
Aughney, T. and Roche, N. (2009) Brown long-eared bat Plecotus auritus Roost Monitoring 2008, Irish Bat Monitoring Programme. Bat Conservation Ireland. Report submitted to The National Parks and Wildlife Service.
The Bat Conservation Trust (2006). The National Bat Monitoring Programme: Annual Report 2005. BCT, London.
Baillie, S.R., Crick, H.Q.P., Balmer, D.E., Beaven, L.P., Downie, I.S., Freeman, S.N., Leech, D.I., Marchant, J.H., Noble, D.G., Raven, M.J., Simpkin, A.P., Thewlis, R.M. & Wernham, C.V. (2002) Breeding Birds in the Wider Countryside: their conservation status 2001. Research Report 278. BTO, Thetford.
Buckland S.T., Magurran A.E., Green R.E. and Fewster R.M. (2005) Monitoring change in biodiversity through composite indices. Philos. T. Roy. Soc. B. 360: 243-254.
Catto, C., Russ, J. and Langton, S. (2004) Development of a Car Survey Monitoring Protocol for the Republic of Ireland. Prepared on behalf of the Heritage Council by the Bat Conservation Trust UK. The Heritage Council, Ireland.
Fairley, J. (2001) A Basket of Weasels. Northern Ireland.
Fewster, R.M., Buckland, S.T., Siriwardena, G.M., Baillie, S.R. and Wilson, J.D. (2000) Analysis of population trends for farmland birds using generalized additive models. Ecology. 81 1970-1984.
Hutson, A.M., Mickleburgh, S.P. and Racey, P.A. (2000) Microchiropteran bats: global status survey and conservation action plan. IUCN/SSC Chiroptera Specialist Group. IUCN, Gland, Switzerland and Cambridge, UK.
Lewis, T. and Stephenson, J.W. (1966) The permeability of artificial windbreaks and the distribution of flying insects in the leeward sheltered zone. Annals of Applied Biology, 58: 355-363.
Limpens, H.J.G.A. and Kapteyn, K. (1991) Bats, their behaviour and linear landscape elements. Myotis, 29: 39-48.
Marchant, J.H., Wilson A.M., Chamberlain D.E., Gregory R.D. and Baillie S.R. (1997) Opportunistic Bird Species – Enhancements for the Monitoring of Populations. BTO Research Report No. 176. BTO, Thetford.
Morgan, B.J.T. (1992) Analysis of Quantal Response Data. Chapman and Hall.
Nicholls, B. and Racey, P.A. (2006) Contrasting home-range size amd s[atial partitioning in cryptic and sympatric pipistrelle bats. Behavioural Ecology and Sociobiology, 61: 131-142.
NPWS (2007) The status of EU protected habitats and species in Ireland. National Parks and Wildlife Service, Department of the Environment, Heritage and Local Government. Dublin, Ireland.
Roche, N. and Aughney, T. (2007) Pilot Scheme for Monitoring Woodland Bats in the Republic of Ireland. Bat Conservation Ireland. Report submitted to The National Parks and Wildlife Service.

Car-Based Bat Monitoring 2003-2008
____________________________
51
Roche, N., Catto, C., Langton, S., Aughney, T. and Russ, J. (2005) Development of a Car-Based Bat Monitoring Protocol for the Republic of Ireland. Irish Wildlife Manuals, No. 19. National Parks and Wildlife Service, Department of the Environment, Heritage and Local Government, Dublin.
Roche, N., Langton, S., Aughney, T. and Haysom, K. (2006) The Car Based Bat Monitoring Scheme for Ireland: Report for 2005. Bat Conservation Ireland.
Roche, N., Langton, S., Aughney, T. and Russ, J. (2007) The Car Based Bat Monitoring Scheme for Ireland: Report for 2006. Bat Conservation Ireland.
Roche, N., Langton, S. and Aughney, T. (2008) The Car Based Bat Monitoring Scheme for Ireland: Report for 2007. Bat Conservation Ireland.
Russ, J., Briggs, P. and Wembridge, D. (2007) The Bats and Roadside Mammals Project. Final Report on the Third Year of Study. The Bat Conservation Trust and the Mammals Trust UK.
Russ, J., Briggs, P. and Wembridge, D. (2008) The Bats and Roadside Mammals Project. Final Report on the Fourth Year of Study. The Bat Conservation Trust and the Mammals Trust UK.
Russ, J., Catto, C. and Wembridge, D. (2006) The Bats and Roadside Mammals Project. Final Report on the Second Year of Study. The Bat Conservation Trust and the Mammals Trust UK. The Bat Conservation Trust UK and The Mammal Society.
Russ, J.M. and Montgomery, W.I. (2002) Habitat associations of bats in Northern Ireland: implications for conservation. Biological Conservation 108: 49-58.
Rydell, J. (1992) Exploitation of insects around streetlamps by bats in Sweden. Functional Ecology 6: 744-750.
Sims, M, Elston, D.A., Harris, M.P. and Wanless, S. (2006) Incorporating Variance Uncertainty into a Power Analysis of Monitoring Designs. Journal of Agricultural, Biological, and Environmental Statistics 12: 236–249.
Stebbings, R.E. (1988) Conservation of European Bats. Christopher Helm, London.
Taylor, L.R. (1963) Analysis of the effects of temperature on insects in flight. Journal of Animal Ecology 32: 99-117.
Temple, H.J. and Terry, A. (2007) The Status and Distribution of European Mammals. Office for Official Publications of the European Communities, Luxembourg.
Verboom, B. and Spoelstra, K. (1999) Effects of food abundance and wind on the use of tree lines by an insectivorous bat, Pipistrellus pipistrellus. Canadian Journal of Zoology 77: 1393-1401.
Wellington, W.G. (1945) Conditions governing the distribution of insects in the free atmosphere. The Canadian Entomologist 77: 7-15.
Whilde, A. (1993) Irish Red Data Book 2: Vertebrates. HMSO, Belfast.
Williams, C.B. (1940) An analysis of four years captures of insects in a light trap: Part II. The effects of weather conditions on insect activity; and the estimation and forecasting of changes in the insect population. Transactions of the Royal Entomological Society of London 90: 227-306.

Car-Based Bat Monitoring 2003-2008
____________________________
52
GLOSSARY OF TERMS
Bootstrapping
This is a method for estimating the sampling distribution of an estimator by resampling with
replacement from the original sample. In the context of population indices the resampling is done for
entire sites and ensures that confidence limits and significance levels are unaffected by any temporal
correlation in the data. It also allows for the effects of ‘overdispersion’ which occurs when data are
more variable than expected from a Poisson distribution.
Covariate
This is a variable that is possibly predictive of the outcome under study. A covariate may be of direct
interest or be a confounding variable or effect modifier.
Doppler Effect
Apparent change in frequency of a sound (measured in kilohertz, kHz) as a result of movement, either
of the source or the observer. The apparent frequency of a sound increases as the source of the sound
moves towards an observer or the observer move towards it and decreases as the source moves away
from an observer or the observer moves away from it.
GLM
Generalised Linear Model: a generalisation of ordinary regression and analysis of variance models,
allowing a variety of different error distributions and different link functions between the response
variable and the explanatory variables. The models used here have a Poisson error distribution and a
logarithmic link.
GAM
Generalised additive model: these models allow a smooth, non-parametric curve to be fitted to an
explanatory variable, within a GLM. In estimating population indices they are used to smooth out
year-to-year variation (Fewster et al. 2000).
Offset
A covariate with a fixed slope of 1.0, in this case implying that the total count doubles if the number of
recording intervals doubles.
Poisson Distribution

Car-Based Bat Monitoring 2003-2008
____________________________
53
The Poisson distribution is a discrete probability distribution. It expresses the probability of a number
of events occurring in a fixed time if these events occur with a known average rate, and are
independent of the time since the last event. It is frequently used as the basis of statistical models of
counts of organisms or events.
Power Analysis
Analysis of the power (probability) to reject a false null hypothesis. A test with high power has a large
chance of rejecting the null hypothesis when this hypothesis is false. In the case of the present project
the null hypothesis would state that that there is no decline in bat populations. Power is measured as a
percentage, and greater power reflects the increased likelihood of detecting a declining trend (as
outlined for Red or Amber Alerts). The power analysis carried out for the present project is one-tailed
(i.e. examines a declining trend only) at P=0.05 (which is equivalent to P=0.l for a two sided test).
REML
Restricted (or residual) maximum likelihood (REML) is a method for fitting linear mixed models. In
contrast to conventional maximum likelihood estimation, REML can produce unbiased estimates of
variance and covariance parameters. This method assumes the data are normally distributed.
Relative Standard Error
The standard error of an estimate expressed as a proportion of the percentage of the estimate. Also
known as the coefficient of variation.

Car-Based Bat Monitoring 2003-2008
____________________________
Appendix I: Methods 54
APPENDIX I
Methods
Training and equipment
Training workshops to explain the project to new surveyors and demonstrate the equipment were
carried out in June and July 2008 in Belfast and Longford.
During training workshops volunteers/NPWS/EHS staff are presented with an information pack
which includes an outline of the protocol for the car survey, a distribution map showing twenty
randomly generated 30km² survey blocks, a map showing part of an overall route with examples of
monitoring transects, a list of sunset times for areas within the Republic of Ireland and Northern
Ireland, guidelines for using the minidisc recorder, and two recording sheets, one to record transect
details and one to record survey information. In addition, each surveyor is equipped with maps, a
minidisc recorder, a stereo connecting lead, a bat detector (Tranquillity Transect), a car window
mounting clamp, a thermometer, a first aid kit and a flashing beacon. A training CD is also provided.
This demonstrates sounds that surveyors should be able to hear while surveying, sounds that indicate
problems with equipment, bat sounds and other sounds that surveyors may encounter during the
survey.
The car transect method is employed to monitor bat activity within twenty 1.609 km (1 mile)
monitoring transects along a selected survey route within randomly generated 30km² squares. Time
expansion bat detectors are used to assess bat activity along the route and bat calls are recorded onto a
minidisc recorder.
Each surveyor is assigned at least one 30 km² survey square and asked to choose a suitable survey
route within each block comprising of twenty 1.609 km (1 mile) monitoring transects spaced 3.218 km
(two miles) apart. Details of the transect route are recorded by the surveyor on the appropriate form
and highlighted on the maps provided.
Each survey square is driven in July. A repeat survey is carried out in mid-August 2007. The bat
detector is positioned at 45° to the rear of the car in the horizontal plane and 45° to the vertical plane
as previous work had shown that this angle minimised background noise and interference. Surveying
begins 45 minutes after sunset and volunteers are required to drive at 24kmph along each monitoring
transect, recording bat activity via the bat detector onto the minidisk recorder. This low speed was
chosen because low speeds reduce background noise and the effect of Doppler shifts on recorded calls
(for details see Catto et al. 2004).
Sonographic analysis
Time expansion audio data is transferred to a computer hard drive as separate *.wav files representing
the numbered tracks (20 files, one for each monitoring transect) on the minidisc using the software
Win Nmd (v1.2x, Christian Klukas). Occasionally, multiple tracks are recorded for each monitoring
transect and these are joined into a single *.wav file using the software program AddAWav (v1.5,
Geoff Phillips). Using Bat Sound (Pettersson Elektronik AB) software, bats are categorised into species
from the measured parameters of their echolocation calls.

Car-Based Bat Monitoring 2003-2008
____________________________
Appendix I: Methods 55
Each adjacent 320ms time expanded sequence is treated as an independent sample, and therefore
species occupying adjacent 320ms sequences are treated as separate individuals. It is occasionally
possible to identify more than one individual of the same or different species within a single 320 ms
sequence.
The REML models are fitted using the average number of passes per minute for each 1.6km long
monitoring transect. The small number of instances where the monitoring transect contains less than
50 0.32 second recording periods are excluded, as the models suggest that these produce abnormally
low counts. No attempt has been made to fit models to the Myotis spp. data (or to the indeterminate
pipistrelles) as there is far too little data to permit sensible modelling.
Power Analysis
Simulations are based on the variance components from a REML model of suitably transformed bat
counts per survey, estimating variances for sites, sites within years and replicate surveys within sites
within years. Data are simulated using these variance estimates and back-transformed to the original
scale after adding suitable year effects in order to produced the required long-term trend. Uncertainty
in the estimates of variances can lead to erroneous estimates of power (Sims et al., 2006) and so each
simulated dataset is based on variance estimates taken from a bootstrapped version of the original
dataset, thus ensuring that the power results are effectively averaged over a range of plausible values
of the variance estimates.
GAM models are then fitted to the simulated data, using bootstrapping to produce a one-tailed test for
a decline at P = 0.05 (equivalent to P = 0.1 for a two sided test). Calculations are based on a GAM
analysis of trend over time (rather than REML), although a REML model is used as the basis for the
simulations. In order to find the number of years required to achieve 80% power for each number of
sites, a sequential method (based on a modified up-and-down method, Morgan, 1992) is used to
determine the number of years of data to include in each simulated dataset, ensuring that precise
estimates are obtained with the minimum number of simulated datasets. The final estimate of power
is then taken from a logistic regression of the probability of obtaining a significant decline against the
number of years of data included in the simulation.
All GAM curves used the default degrees of freedom (0.3*nyears). Because GAM trends are estimated
with less precision in the first and last years of a series, the second year is used as the base year in the
simulations, and the trend is estimated up to the penultimate year
Last year a log-normal transformation of the counts was initially used, but this tended to produce a
small number of implausibly large numbers of bat passes. The results presented here therefore use a
transformation based on normal scores (see for example Armitage and Berry, 1987) which was more
successful in mimicking the distribution of the real data.
Results should be treated with caution as they are dependent on many assumptions, some of which
will only be approximately correct. In particular, the simulations assume that the same trend applies
across all habitats, and more sites will be needed in the situation where the extent of the decline varies
geographically or between different habitats. It is also assumed that all surveys are successfully
completed; missing surveys will increase the number of sites needed to achieve the specified level of
power.

Car-Based Bat Monitoring 2003-2008
____________________________
Appendix II: Results 56
APPENDIX II
Results
Simpson’s Index
Table A1: Simpson Index of Diversity and Overall Average Bat Abundance for all surveys. Red
highlights abundance >60 and diversity (1-D) ≥0.6; Yellow highlights abundance >55 and diversity
(1-D) ≥0.5.
Square
Simpsons
Index (D)
Simpson's Index of
Diversity (1-D)
Total
encounters/hr
C72 0.30 0.70 15.77
G20 0.34 0.66 21.05
G53 0.44 0.56 20.58
G89 0.30 0.70 24.20
H13 0.40 0.60 34.60
H40 0.39 0.61 38.64
H79 0.50 0.50 29.44
J06 0.33 0.67 43.98
J33 0.44 0.56 28.46
L64 0.54 0.46 10.33
M24 0.35 0.65 35.90
M87 0.31 0.69 23.73
N11 0.48 0.52 58.34
N74 0.54 0.46 63.34
N77 0.41 0.59 68.65
O04 0.57 0.43 41.03
R22 0.46 0.54 78.87
R28 0.32 0.68 39.21
R88 0.47 0.53 50.29
S12 0.42 0.58 64.62
S15 0.46 0.54 50.28
S78 0.39 0.61 63.48
T05 0.46 0.54 47.59
V93 0.35 0.65 63.70

Car-Based Bat Monitoring 2003-2008
____________________________
Appendix II: Results 57
V96 0.36 0.64 70.94
V99 0.50 0.50 81.28
W56 0.49 0.51 66.85
X49 0.34 0.66 30.60
Relationship with Number of Intervals
The Tranquility Transect detectors are set to record continuously for 320 milliseconds and they then
play back this ultrasound more slowly (x10) so that, when analysis is carried out, recordings are
visible as 3200ms of slowed-down sounds with short gaps in between each when the detector is
recording. Each piece of slowed-down sound is referred to as an interval or snapshot and a single bat
echolocation call or sequence of echolocation calls in one snapshot is referred to as a bat encounter.
Typically, recordings from a single transect consist of 70-75 snapshots.
In previous years, transects with less than 50 320ms recording snapshots have been excluded as these
seemed to produce some atypical values. Since this assumption had not been checked for a number of
years, some models were fitted to investigate the relationship between passes and number of
snapshots. A REML model was fitted to the log-transformed number of passes per minute using the
data for all one mile transects, and then the residuals from each one mile transect were plotted against
the number of 320ms snapshots or intervals. If the number of passes per minute is independent of the
number of snapshots, as it should be, there should be no relationship between the two (i.e. a mess of
points). Figure 1 shows the results; to make it easier to spot any trend, a smoothed fitted line is shown,
which should be horizontal if there is no relationship.

Car-Based Bat Monitoring 2003-2008
____________________________
Appendix II: Results 58
Figure 1; residuals from a REML analysis plotted against number of 0.32ms snapshots. The red line
is a fitted line (spline with 4d.f.).
Pip45
AllbatsPlecotus
NathusLeis
MyotisPipunk
Pip55
1.0
0.0
-1.0
1.5
1.0
0.5
0.0
100
-0.5
60
-1.0
20
-1.5
0 40 80 120
1201008060
0.0
40
1.0
200
60
0
80
40
100
80
120
120
0.5
1.5
-0.25
0.00
0.25
0.50
0
0.75
40
1.00
80
1.25
120
1.50
-0.5
0.5
1.5
0 40
1.5
-0.5
800
60
-0.5
1.5
20 100
1.0
60
-1.0
1.0
20
120
20
0.5
60
2.0
100
2.0
0.0
20
0.0
40
0.5
100
As can be seen, the lines are more or less horizontal, but do show some signs of an upward slope for
low numbers of snapshots for common pipistrelles, and a downward slope for soprano pipistrelles,
Myotis spp. and Leisler’s. These slopes level off at different points for different species; for common
pipistrelles it is around 50-60 snapshots, but for other species it is less. It is also worth noting that, for
all species, the effects are fairly subtle. We did, therefore, consider changing the 50 snapshots criterion
for a lower value, but in practice the gain in data is very small, with only one more survey producing
enough data to contribute to the GLM models. Therefore, the 50 snapshots criterion has been
retained.
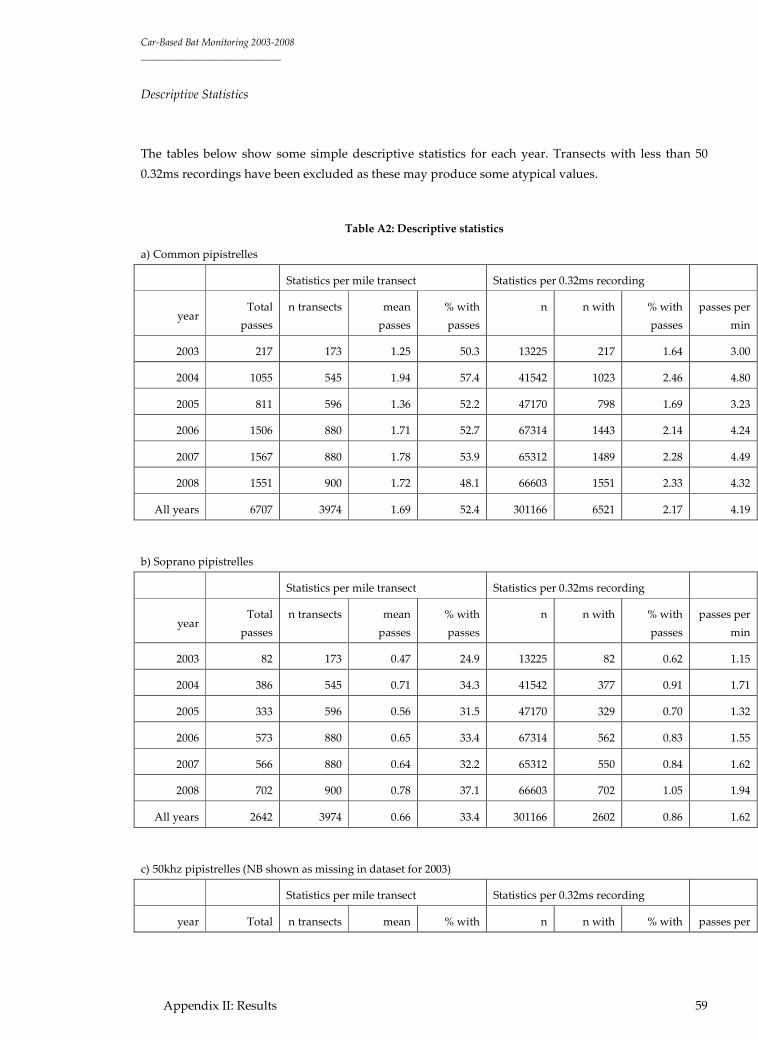
Car-Based Bat Monitoring 2003-2008
____________________________
Appendix II: Results 59
Descriptive Statistics
The tables below show some simple descriptive statistics for each year. Transects with less than 50
0.32ms recordings have been excluded as these may produce some atypical values.
Table A2: Descriptive statistics
a) Common pipistrelles
Statistics per mile transect Statistics per 0.32ms recording
year Total
passes
n transects mean
passes
% with
passes
n n with % with
passes
passes per
min
2003 217 173 1.25 50.3 13225 217 1.64 3.00
2004 1055 545 1.94 57.4 41542 1023 2.46 4.80
2005 811 596 1.36 52.2 47170 798 1.69 3.23
2006 1506 880 1.71 52.7 67314 1443 2.14 4.24
2007 1567 880 1.78 53.9 65312 1489 2.28 4.49
2008 1551 900 1.72 48.1 66603 1551 2.33 4.32
All years 6707 3974 1.69 52.4 301166 6521 2.17 4.19
b) Soprano pipistrelles
Statistics per mile transect Statistics per 0.32ms recording
year Total
passes
n transects mean
passes
% with
passes
n n with % with
passes
passes per
min
2003 82 173 0.47 24.9 13225 82 0.62 1.15
2004 386 545 0.71 34.3 41542 377 0.91 1.71
2005 333 596 0.56 31.5 47170 329 0.70 1.32
2006 573 880 0.65 33.4 67314 562 0.83 1.55
2007 566 880 0.64 32.2 65312 550 0.84 1.62
2008 702 900 0.78 37.1 66603 702 1.05 1.94
All years 2642 3974 0.66 33.4 301166 2602 0.86 1.62
c) 50khz pipistrelles (NB shown as missing in dataset for 2003)
Statistics per mile transect Statistics per 0.32ms recording
year Total n transects mean % with n n with % with passes per

Car-Based Bat Monitoring 2003-2008
____________________________
Appendix II: Results 60
passes passes passes passes min
2003
2004 247 545 0.45 29.2 41542 247 0.59 1.12
2005 159 596 0.27 20.0 47170 159 0.34 0.63
2006 239 880 0.27 18.6 67314 238 0.35 0.67
2007 225 880 0.26 17.7 65312 221 0.34 0.65
2008 266 900 0.30 17.6 66603 266 0.40 0.74
All years 1136 3801 0.30 19.9 287941 1131 0.39 0.74
d) Myotis spp.
Statistics per mile transect Statistics per 0.32ms recording
year Total
passes
n transects mean
passes
% with
passes
n n with % with
passes
passes per
min
2003 7 173 0.04 2.9 13225 7 0.05 0.11
2004 28 545 0.05 4.4 41542 28 0.07 0.12
2005 21 596 0.04 2.3 47170 21 0.04 0.08
2006 26 880 0.03 2.4 67314 26 0.04 0.07
2007 32 880 0.04 2.5 65312 32 0.05 0.09
2008 26 900 0.03 2.4 66603 26 0.04 0.07
All years 140 3974 0.04 2.7 301166 140 0.05 0.09
e) Leisler’s
Statistics per mile transect Statistics per 0.32ms recording
year Total
passes
n transects mean
passes
% with
passes
n n with % with
passes
passes per
min
2003 52 173 0.30 15.6 13225 52 0.39 0.72
2004 295 565 0.52 23.2 43087 293 0.68 1.31
2005 314 596 0.53 21.6 47170 314 0.67 1.24
2006 787 880 0.89 27.6 67314 769 1.14 2.26
2007 557 880 0.63 20.3 65312 547 0.84 1.56
2008 672 900 0.75 24.2 66603 672 1.01 1.90
All years 2677 3994 0.67 23.2 302711 2647 0.87 1.67

Car-Based Bat Monitoring 2003-2008
____________________________
Appendix II: Results 61
f) Nathusius’ pipistrelle
Statistics per mile transect Statistics per 0.32ms recording
year Total
passes
n transects mean
passes
% with
passes
n n with % with
passes
passes per
min
2003 0 173 0.00 0.0 13225 0 0.00 0.00
2004 0 565 0.00 0.0 43087 0 0.00 0.00
2005 1 596 0.00 0.2 47170 1 0.00 0.00
2006 29 880 0.03 2.2 67314 28 0.04 0.08
2007 13 880 0.01 1.2 65312 13 0.02 0.04
2008 6 900 0.01 0.7 66603 6 0.01 0.02
All years 49 3994 0.01 0.9 302711 48 0.02 0.03
g) Brown long-eared (not separately recorded before 2007)
Statistics per mile transect Statistics per 0.32ms recording
year Total
passes
n transects mean
passes
% with
passes
n n with % with
passes
passes per
min
2003
2004
2005
2006
2007 17 880 0.02 1.4 65312 17 0.03 0.05
2008 2 900 0.00 0.2 66603 2 0.00 0.01
All years 19 1780 0.01 0.8 131915 19 0.01 0.03