the carbon reduction, resources and opportunities toolkit
TRANSCRIPT

The Carbon Reduction, Resources and Opportunities Toolkit (CaRROT) - Guidelines and Opportunities

CaRROT – Guidelines and Opportunities 2
This report is in the public domain. The authors encourage the circulation of the report to the various multi-stakeholders within Kenya’s floricultural sector. Users are welcome to download, save, or distribute this report electronically or in any other format. We do ask that, if you distribute this report, you credit the authors and mention the website http://www.kenyaflowercouncil.org/ and not alter the text. An electronic copy of this report is available at http://www.kenyaflowercouncil.org/ .
This document is an output from a project funded by the UK Department for International Development (DFID) and the Netherlands Directorate-General for International Cooperation (DGIS) for the benefit of developing countries. However, the views expressed and information contained in it are not necessarily those of or endorsed by DFID or DGIS, who can accept no responsibility for such views or information or for any reliance placed on them. This publication has been prepared for general guidance on matters of interest only, and does not constitute professional advice. You should not act upon the information contained in this publication without obtaining specific professional advice. No representation or warranty (express or implied) is given as to the accuracy or completeness of the information contained in this publication, and, to the extent permitted by law, the entities managing the delivery of the Climate and Development Knowledge Network do not accept or assume any liability, responsibility or duty of care for any consequences of you or anyone else acting, or refraining to act, in reliance on the information contained in this publication or for any decision based on it. Management of the delivery of CDKN is undertaken by PricewaterhouseCoopers LLP, and an alliance of organisations including Fundación Futuro Latinoamericano, INTRAC, LEAD International, the Overseas Development Institute, and SouthSouthNorth.

CaRROT – Guidelines and Opportunities 3
Executive Summary
In Kenya, the flower industry has recorded the highest growth in both volume and value of all horticultural products, including fruits and vegetables, contributing over GBP (£) 350 million to the economy in 2011 alone. Further growth is expected in future with more value addition, improved varieties, increased efficiency in production, maintaining quality and social standards, favourable production conditions and developed infrastructure. Kenya’s flower industry is one of the oldest and largest sectors maintaining an average growth of 20% per annum after its rapid expansion in the early 1990s1. According to the Kenya Flower Council (KFC), the sub-sector employs 90,000 people directly and a further 600,000 to 700,000 indirectly in auxiliary services. In 2011, the flower industry contributed Kshs 44.51 billion to the economy (KFC, AGM Report, 2012). In 2009, the Ministry of Agriculture estimated the value of horticultural exports to be Kshs 72 billion in 2009 (including Kshs 37 billion from cut flowers) (adapted from World Bank, Issue Paper, 2011). Kenyan flowers also make up 30 to 35% of flowers auctioned in Europe, with roses making up to 74% of the flower exports. The impacts of climate change greatly affect the growth and competitiveness of the agriculture and floriculture sector. A defining feature of agricultural systems, a characteristic which extends to the horticulture and floriculture industry in particular, is the high degree of vulnerability and exposure to extreme weather events, climate variability and change; all of which exacerbate the severity of climate impact and place the sector at risk. Both sectors are key economic sectors however they are governed by climate sensitive resources, which drive their levels of productivity. Emerging trends and heightened consumer awareness have triggered a more cautious attitude to the effects of greenhouse gas (GHG) emissions in line with the global climate change agenda. There is an increased need for climate friendly products and sustainable business practices internationally. To preserve and strengthen the flower sector’s competitive position in the global markets, it must proactively seek to address adverse impacts through a unified response to climate change mitigation and improved natural resource management. Currently, there is no focused greenhouse gas (GHG) accounting and management approach, and/or self-regulating guidelines. The flower sector is merely regulated through self-regulatory Codes of Practice overseen by KFC. The Codes of Practice are benchmarked against other international standards, such as Global G.A.P, Fair Flowers-Fair Plants, Tesco’s Nurture and Kenya Bureau of Standards (including KS-1758), in addition to various other national regulatory frameworks. Additionally, there are many standards that affect the flower industry in Kenya, including Fairtrade, UK Carbon Trust, PAS 2050:2008/11 (public standard), Pipeline-ISO: 14067-040/44, GHG protocol -2004/2011, DHCP (Netherlands), JTS, CarbonZero, and several other private schemes. There are, however, no standards that are specific to the African context. This is a big challenge for the Kenyan horticulture sector. To improve the sector’s competitiveness in view of the emerging climate change related risks and opportunities, a Carbon Reduction, Resources and Opportunities Toolkit (CaRROT) was developed by the Camco Advisory Services (Kenya) Limited (Camco), in conjunction with the KFC and the Horticultural Crops Development Authority (HCDA). CaRROT provides practical and localized GHG, energy and water use accounting and management solutions to enable the sector to improve production efficiency. Although there are various carbon calculators available in the market, there are no publically available GHG and/or resources management tools tailored to the flower sector in Africa (particularly in Kenya). CaRROT is unique, simple, accessible, and in the form of an integrated MS Excel sheet. It takes into account 3 complimentary components, namely: (i) energy; (ii) water; and (iii) carbon emissions.
1 Kenya Flower Council: Market data accessed on 09
th September 2013 - http://www.kenyaflowercouncil.org/marketdata.php

CaRROT – Guidelines and Opportunities 4
When developing an inventory of an organisation’s GHG emissions, the most important elements to consider are (i) quantity: data which covers the full scope of GHG emissions associated with a farm; (ii) assessment boundary: identifying the inventory boundaries which determine which entities are included in the organisational carbon footprint; and (iii) activity data: which sources of GHGs and activities are included in an organisation's carbon footprint. This assessment methodology forms the basis of CaRROT and has been informed by consultations with stakeholders in Kenya’s flower value chain. Users of the toolkit are required to provide source data related to their activities. In implementing CaRROT, Kenya’s flower farmers are empowered to quantify their basic carbon footprint. CaRROT also acts as a business management tool used by management to integrate carbon emissions and climate change into high-level operational decision-making with regard to procurement, production, and inventory management. In addition, it assists technical staff members to quantify monthly resource consumption at farm level, as well as the carbon emissions associated with commercial activities (such as, use of fossil fuels for energy generation, including electricity). The purpose of these guidelines is four-fold: 1. It supports the application of the CaRROT toolkit, thereby encouraging the transition of
the flower sector to a low carbon emissions sector. The key frameworks used integrate the ISO 14000 standards, the IPCC 2006 Guidelines for National GHG Inventories and GHG Protocol, and intend to help move the Kenyan flower industry towards greater use of GHG emissions accounting methods, reporting guidelines and adherence to voluntary standards.
2. It also promotes appropriate mitigation measures and strengthens the resilience of the sector against climate change impacts through practical adaptation solutions targeting energy and water use. It provides flower farmers with: (i) guidance on the choice of methods of determining GHG emissions; (ii) general information on determining the appropriate GHG inventory; (iii) identifying individual resource consumption capacities; (iv) suggestions for ensuring effective data handling and management; and (v) suggestions for developing efficient quality assurance/quality control procedures.
3. It provides an overview of the climate business opportunities available to the floriculture sector, including a brief overview of prospects available to Kenyan flower farmers related to carbon markets, climate financing and climate funds.
4. It provides sectoral recommendations to enhance the capacity, productivity and global competitiveness of Kenya’s flower sector.

CaRROT – Guidelines and Opportunities 5
List of Tables
Table 1: Growth of the Flower Sector in Tonnes and Values in the last 5 years ........................ 9
Table 2: A List of Various Carbon Calculators ......................................................................... 11
Table 3: Existing Standards Applicable to Kenya’s Flower Sector ........................................... 14
Table 4: Overview of the Various Standards Considered ........................................................ 16
Table 5: Summary of the main ISO GHG Accounting Standards ............................................ 16
Table 6: GHG Protocol series of Accounting and Reporting Standards ................................... 17
Table 7: An Overview of CaRROT’s Inventory Boundary ........................................................ 23
Table 8: GHG Emitting Activity Categories and Emission Sources .......................................... 24
Table 9: Potential CDM Projects for the Flower Sector ............................................................ 34
Table 10: Examples of Voluntary Carbon Market Projects ...................................................... 35

CaRROT – Guidelines and Opportunities 6
List of Figures
Figure 1: Market Destinations for Kenya’s flowers ..................................................................... 9
Figure 2: Addressing the Impacts of Climate Change.............................................................. 10
Figure 3: Levels of Climate and Carbon Management ............................................................. 10
Figure 4: Toolkit Calculation Boundaries ................................................................................. 12
Figure 5: Setting the Major Source of GHG Emissions for the Floriculture Economic Sector ... 13
Figure 6: Relationship between General and Sectoral Guidance ............................................ 18
Figure 7: Kenya Flower Industry Value Chain ......................................................................... 20
Figure 8: Assessment Methodology for CaRROT ................................................................... 21
Figure 9: GHG Inventory ......................................................................................................... 22
Figure 10: Conceptualization for Setting an Operational Assessment Boundary ..................... 25
Figure 11: The Process of Data Collection .............................................................................. 26
Figure 12: GHG Emissions Calculation (A: Direct measurement & B: Indirect using emission
factors) .................................................................................................................................... 28
Figure 13: Conceptualisation of the GHG Emissions Rating Scale .......................................... 29
Figure 14: Carbon Offsets in the Compliance and in the Voluntary Market .............................. 34
Figure 15: Direction and Investment Required for Kenya’s Flower Industry ............................ 37

CaRROT – Guidelines and Opportunities 7
Acronyms and Abbreviations
Camco Camco Advisory Services (Kenya) Limited
CaRROT Carbon Reduction, Resources and Opportunities Toolkit
CDKN Climate and Development Knowledge Network
CDM Clean Development Mechanism
CH4 Methane
CO2 Carbon Dioxide
GDP Gross Domestic Product
GHG Greenhouse gas
GWP Global Warming Potential
HCDA Horticultural Crops Development Authority
HFCs Hydrofluorocarbons
IPCC Intergovernmental Panel on Climate Change
ISO International Organization for Standardization
KFC Kenya Flower Council
KNBS Kenya National Bureau of Statistics
LEAF Linking Environment And Farming
MoPND Ministry of Planning and Development, Kenya
MPS More Profitable Sustainability
N2O Nitrous Oxide
NEMA National Environment Management Authority, Kenya
PFCs Perfluorocarbons
PoA CDM Programme of Activities
SFCs Sulphur Hexafluoride
UNEP United Nations Environment Programme
WBCSD World Business Council for Sustainable Development
WRI World Resources Institute
WMO World Meteorological Organization

CaRROT – Guidelines and Opportunities 8
Table of Contents
Executive Summary ................................................................................................................ 3
List of Tables ........................................................................................................................... 5
List of Figures ......................................................................................................................... 6
Acronyms and Abbreviations ................................................................................................ 7
1 Introduction ................................................................................................................. 9
1.1 An Overview of Kenya’s Flower Sector ....................................................................... 9
1.2 Climate Change Management Solutions ................................................................... 10
1.3 Application of CaRROT ............................................................................................. 12
2 Existing Sustainability Principles and Standards ................................................... 14
2.1 Carbon Accounting Standards .................................................................................. 16
2.2 Resource Management: Principles and Standards.................................................... 18
3 CaRROT and Kenya’s Flower Sector ....................................................................... 20
3.1 Assessment Methodology ......................................................................................... 21
3.2 Inventory Boundary ................................................................................................... 23
3.3 Data Collection and Handling .................................................................................... 26
3.4 GHG Emissions Calculations and Benchmarking ...................................................... 27
3.5 Quality Control and Assurance.................................................................................. 30
3.6 Reporting .................................................................................................................. 31
4 Climate Opportunities for Kenya’s Flower Sector ................................................... 32
4.1 Compliance Mechanisms .......................................................................................... 32
4.2 Voluntary Markets ..................................................................................................... 34
4.3 Climate Financing and Funds ………...………………………………………………….. 36
5 Conclusion and Sectoral Recommendations .......................................................... 37
6 References ................................................................................................................. 40
Annex I – Glossary of Terms ................................................................................................ 42
Annex II – Guidelines on the CaRROT ................................................................................. 44
Annex III – Summary of National, Regional and International Financing Mechanisms.... 48

CaRROT – Guidelines and Opportunities 9
1 Introduction
1.1 An Overview of Kenya’s Flower Sector Global warming and climate change have gained prominence as a key sustainable development issue with tangible impacts on the ability of socio-economic sectors to achieve global competitiveness. The floriculture sector is one of the sectors impacted due to its reliance on climate sensitive resources that are adversely affected by increased climate variability and climate change. Given the environmental and economic impacts of climate change, it is necessary for businesses to align their operations and business strategies to account for the growing recognition and need for sustainable environmental goods and services.
The Kenya flower sector has been steadily growing at an average of 20% per annum over the last three decades (Table 1) and is now one of the leading exporters of cut flowers to the European Union (EU) contributing over 35% of all flower sales in the market. The Ministry of Agriculture estimated the value of horticultural exports was Kshs 72 Billion in 2009, with Kshs 37 Billion attributed to cut flowers (adapted from World Bank, Issue Paper, 2011). In 2011, the flower sector contributed Kshs 44.51 Billion to the economy (KFC, AGM Report, 2012), and employed approximately 90,000 people directly and a further 600,000 to 700,000 indirectly through auxiliary services.
Table 1: Growth of the Flower Sector in Tonnes and Values in the last 5 years
Year 2006 2007 2008 2009 2010 2011
Volume in Metric tonnes
86,480 91,193 93,639 117,713 120,221 121,891
Value in Billion’s (Kshs)
23.56 29.74 39.77 36.70 35.50 44.51
Source: Adapted from Kenya Cut Flower Industry - Market Data 2
The exports of mixed flower bouquets and related products are achieved through direct sales and auctioning. Approximately 65% of exported flowers are also sold through the Dutch auctions, although direct sales are growing substantially. The main markets within the EU include Holland, United Kingdom (UK), Germany, France and Switzerland (Figure 1). Other emerging growing destinations include Japan, Russia and United States of America (USA). However, Kenya’s floricultural industry, though a major foreign earner, is not immune to the effects of climate change.
Figure 1: Market Destinations for Kenya’s flowers
Source: Market Data – Kenya Cut Flower Industry3
2 Kenya Flower Council website accessed on 03
rd September 2013 - http://www.kenyaflowercoun
cil.org/marketdata.php
France
Germany
Holland
UK
Others
CaRROT – Guidelines and Opportunities 10
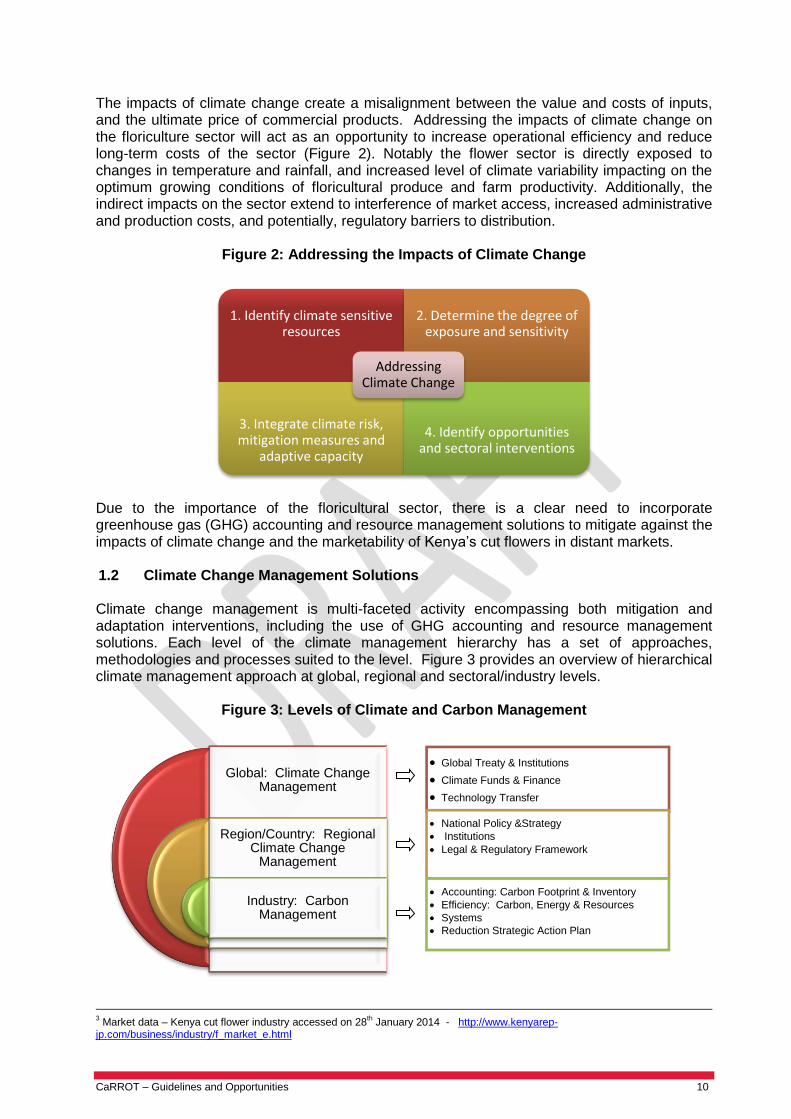
The impacts of climate change create a misalignment between the value and costs of inputs, and the ultimate price of commercial products. Addressing the impacts of climate change on the floriculture sector will act as an opportunity to increase operational efficiency and reduce long-term costs of the sector (Figure 2). Notably the flower sector is directly exposed to changes in temperature and rainfall, and increased level of climate variability impacting on the optimum growing conditions of floricultural produce and farm productivity. Additionally, the indirect impacts on the sector extend to interference of market access, increased administrative and production costs, and potentially, regulatory barriers to distribution.
Figure 2: Addressing the Impacts of Climate Change
Due to the importance of the floricultural sector, there is a clear need to incorporate greenhouse gas (GHG) accounting and resource management solutions to mitigate against the impacts of climate change and the marketability of Kenya’s cut flowers in distant markets. 1.2 Climate Change Management Solutions Climate change management is multi-faceted activity encompassing both mitigation and adaptation interventions, including the use of GHG accounting and resource management solutions. Each level of the climate management hierarchy has a set of approaches, methodologies and processes suited to the level. Figure 3 provides an overview of hierarchical climate management approach at global, regional and sectoral/industry levels.
Figure 3: Levels of Climate and Carbon Management
3 Market data – Kenya cut flower industry accessed on 28
th January 2014 - http://www.kenyarep-
jp.com/business/industry/f_market_e.html
1. Identify climate sensitive resources
2. Determine the degree of exposure and sensitivity
3. Integrate climate risk, mitigation measures and
adaptive capacity
4. Identify opportunities and sectoral interventions
Addressing Climate Change
Global: Climate Change Management
Region/Country: Regional Climate Change
Management
Industry: Carbon Management
Global Treaty & Institutions
Climate Funds & Finance
Technology Transfer
National Policy &Strategy
Institutions
Legal & Regulatory Framework
Accounting: Carbon Footprint & Inventory
Efficiency: Carbon, Energy & Resources
Systems
Reduction Strategic Action Plan

CaRROT – Guidelines and Opportunities 11
Example of Carbon Calculator South Africa’s Wine and Fruit Carbon Calculator is the only one of its kind on the continent focusing on horticultural carbon accounting. South Africa is fully integrated into and exposed to international markets; garnering much attention within global climate change discussions due to the country’s exceptionally carbon-intensive means of production particularly so for exported goods such as fruit and wine.
The focus of the Carbon Reduction, Resources and Opportunities Toolkit (CaRROT) and these guidelines is on carbon management at an industry level, particularly for the flower sector. Notably, carbon management is emerging as part of a suite of environmental management practices underpinning sustainable socio-economic activity. The increase in carbon management practices has further led to the development of the accounting and management tools, such as carbon calculators. A carbon calculator is one of the most accessible tools for the quantification of GHG emissions. The concept of a calculator is very familiar one and its use in the context of climate change helps to make an abstract concept (such as, carbon) concrete at the lowest levels of understanding. Although there are various carbon calculators available in the market, including South Africa’s Wine and Fruit Carbon Calculator, there are no publically available GHG and/or resources management tools tailored for the flower sector in Africa. In addition, from Table 2 below it is evident that a substantial number of calculators would not be applicable for the horticulture (particularly, floriculture) sector in Kenya. Therein lays the uniqueness of the CaRROT.
Table 2: A List of Various Carbon Calculators
Source: IOP Science, 2013

CaRROT – Guidelines and Opportunities 12
1.3 Application of CaRROT In response to the lack of a specific GHG and resources management tool for Kenya’s flower sector, the industry has embarked on the development of the CaRROT as a unique, sector oriented, and region specific toolkit aimed at addressing the challenges posed by climate change, coupled with the prospect of increasing long-term sustainability and competitiveness of the flower industry. This integrated toolkit was developed by Camco Advisory Services (Kenya) Limited (Camco), in conjunction with the Kenya Flower Council (KFC), Horticultural Crops Development Authority (HCDA) and funded by the Climate and Development Knowledge Network (CDKN). The tool aims to assist Kenya’s flower industry to maintain low carbon operational activities through the provision of practical and localized GHG, energy and water accounting and management systems. As there is currently no sectoral baseline for GHG and resource usage and management within the flower sector, the toolkit will also enable sector members to support the development of a sector comparative study and identify areas for the improvement of overall production efficiency. Application of the toolkit is intended to encourage the transition of the flower sector to a low carbon emissions sector through the implementation of a selection of existing global standards that will allow flower farms to leverage their resource management conservations practices and increase their marketability. CaRROT is a simple accounting and management tool used for quantifying energy and water consumption at farm level, as well as GHG emissions associated with farm operational activities. It is one step ahead of a common carbon calculator, as it incorporates complimentary components, namely: (i) energy; (ii) water; and (iii) GHG emissions (Figure 4). It is simple, accessible, and easy to use. The features have been designed with the local context in mind.
Figure 4: Toolkit Calculation Boundaries
The energy component monitors and accounts for grid-electricity, non-grid electricity, diesel, petroleum and kerosene usage. Additionally, water use from diverse sources; municipal water, boreholes, lakes, rivers, reservoirs and water harvesting, is considered. The GHG emissions derived from operational activities is also measured. Figure 5 below provides an overview of the major GHG emissions associated with floricultural activity. This overview also reflects the data requirements for the water, energy and GHG data sources required for the CaRROT.

CaRROT – Guidelines and Opportunities 13
Figure 5: Setting the Major Source of GHG Emissions for the Floriculture Economic Sector
To augment the implementation of the CaRROT, these guidelines were developed to support the application of the toolkit and illustrate the carbon accounting principles and standards used in the development of the toolkit, including but not limited to the Intergovernmental Panel on Climate Change (IPCC), International Standards of Organisations (ISO) and the GHG Protocol. In addition, it will assist the flower sector with identifying potential climate opportunities. Both the toolkit and guidelines provide the carbon and resource management framework needed to position the flower sector in terms of voluntary emissions disclosure and developing a platform for a coordinated response to reduction of GHG emissions, tracking resource utilisation and mitigating product and supply chain emissions, while highlighting climate change potential opportunities. The core objectives of CaRROT and these guidelines include: (a) developing a localized resources management tool that focuses on GHG emissions, energy and water use; and (b) raising awareness on climate change and identifying win-win opportunities that will enhance the sector’s competitiveness. This will promote appropriate mitigation activities and strengthen the resilience of the sector against climate change impacts through practical adaptation solutions targeting energy and water use. The core guidelines on how to use the CaRROT and screenshots are provided in Annex II.
CaRROT – Guidelines and Opportunities 14
2 Existing Sustainability Principles and Standards
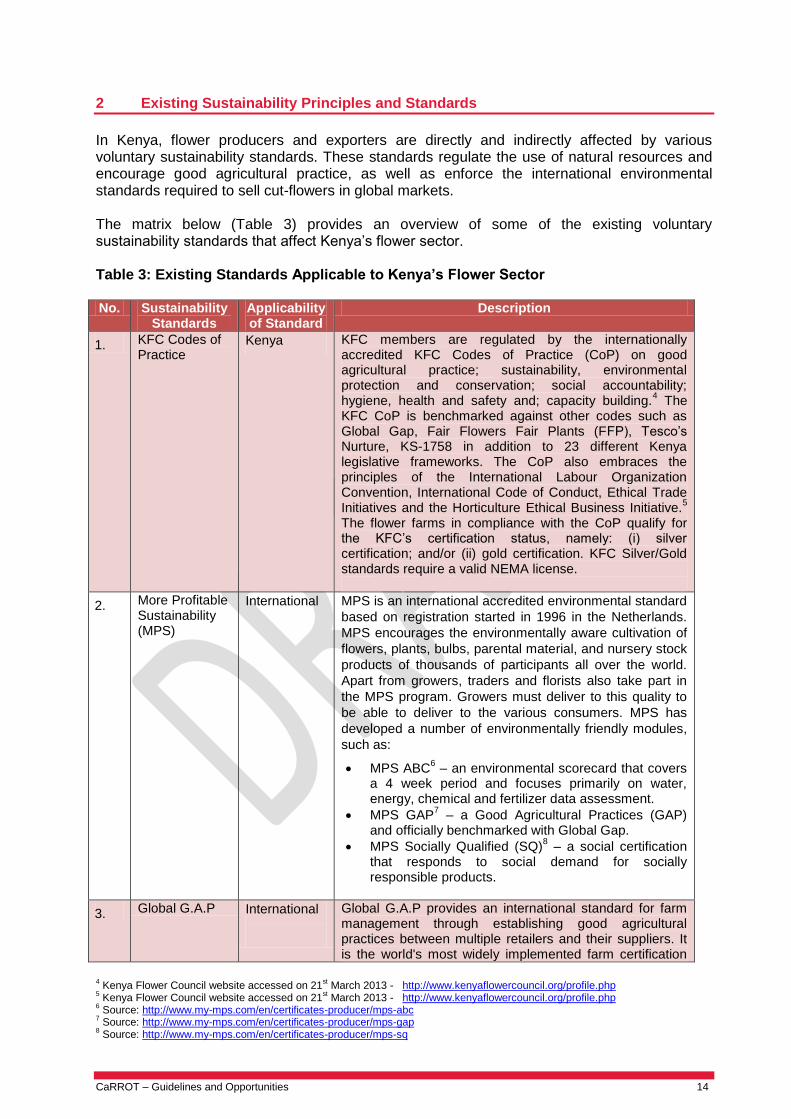
In Kenya, flower producers and exporters are directly and indirectly affected by various voluntary sustainability standards. These standards regulate the use of natural resources and encourage good agricultural practice, as well as enforce the international environmental standards required to sell cut-flowers in global markets. The matrix below (Table 3) provides an overview of some of the existing voluntary sustainability standards that affect Kenya’s flower sector. Table 3: Existing Standards Applicable to Kenya’s Flower Sector No. Sustainability
Standards Applicability of Standard
Description
1. KFC Codes of Practice
Kenya KFC members are regulated by the internationally accredited KFC Codes of Practice (CoP) on good agricultural practice; sustainability, environmental protection and conservation; social accountability; hygiene, health and safety and; capacity building.
4 The
KFC CoP is benchmarked against other codes such as Global Gap, Fair Flowers Fair Plants (FFP), Tesco’s Nurture, KS-1758 in addition to 23 different Kenya legislative frameworks. The CoP also embraces the principles of the International Labour Organization Convention, International Code of Conduct, Ethical Trade Initiatives and the Horticulture Ethical Business Initiative.
5
The flower farms in compliance with the CoP qualify for the KFC’s certification status, namely: (i) silver certification; and/or (ii) gold certification. KFC Silver/Gold standards require a valid NEMA license.
2. More Profitable Sustainability (MPS)
International
MPS is an international accredited environmental standard
based on registration started in 1996 in the Netherlands.
MPS encourages the environmentally aware cultivation of
flowers, plants, bulbs, parental material, and nursery stock
products of thousands of participants all over the world.
Apart from growers, traders and florists also take part in
the MPS program. Growers must deliver to this quality to
be able to deliver to the various consumers. MPS has
developed a number of environmentally friendly modules,
such as:
MPS ABC6 – an environmental scorecard that covers
a 4 week period and focuses primarily on water, energy, chemical and fertilizer data assessment.
MPS GAP7 – a Good Agricultural Practices (GAP)
and officially benchmarked with Global Gap.
MPS Socially Qualified (SQ)8 – a social certification
that responds to social demand for socially responsible products.
3. Global G.A.P International
Global G.A.P provides an international standard for farm management through establishing good agricultural practices between multiple retailers and their suppliers. It is the world's most widely implemented farm certification
4 Kenya Flower Council website accessed on 21
st March 2013 - http://www.kenyaflowercouncil.org/profile.php
5 Kenya Flower Council website accessed on 21
st March 2013 - http://www.kenyaflowercouncil.org/profile.php
6 Source: http://www.my-mps.com/en/certificates-producer/mps-abc
7 Source: http://www.my-mps.com/en/certificates-producer/mps-gap
8 Source: http://www.my-mps.com/en/certificates-producer/mps-sq
CaRROT – Guidelines and Opportunities 15
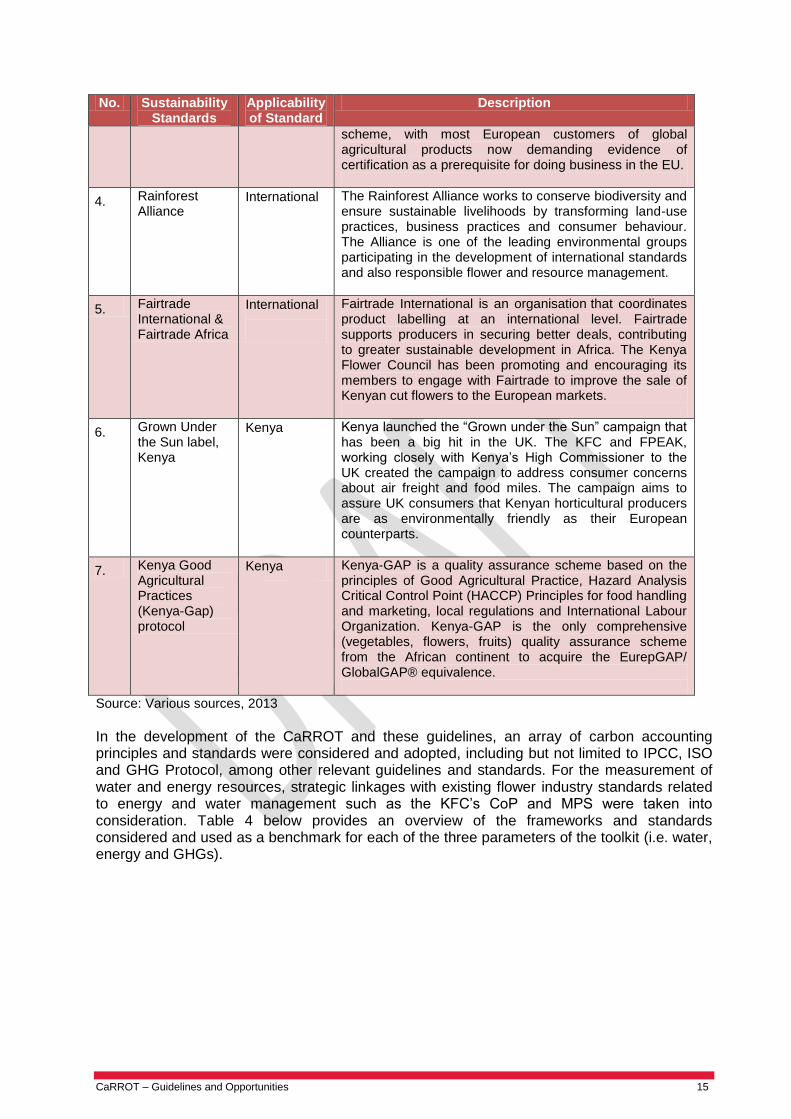
No. Sustainability Standards
Applicability of Standard
Description
scheme, with most European customers of global agricultural products now demanding evidence of certification as a prerequisite for doing business in the EU.
4. Rainforest Alliance
International
The Rainforest Alliance works to conserve biodiversity and ensure sustainable livelihoods by transforming land-use practices, business practices and consumer behaviour. The Alliance is one of the leading environmental groups participating in the development of international standards and also responsible flower and resource management.
5. Fairtrade International & Fairtrade Africa
International
Fairtrade International is an organisation that coordinates product labelling at an international level. Fairtrade supports producers in securing better deals, contributing to greater sustainable development in Africa. The Kenya Flower Council has been promoting and encouraging its members to engage with Fairtrade to improve the sale of Kenyan cut flowers to the European markets.
6. Grown Under the Sun label, Kenya
Kenya Kenya launched the “Grown under the Sun” campaign that has been a big hit in the UK. The KFC and FPEAK, working closely with Kenya’s High Commissioner to the UK created the campaign to address consumer concerns about air freight and food miles. The campaign aims to assure UK consumers that Kenyan horticultural producers are as environmentally friendly as their European counterparts.
7. Kenya Good Agricultural Practices (Kenya-Gap) protocol
Kenya Kenya-GAP is a quality assurance scheme based on the principles of Good Agricultural Practice, Hazard Analysis Critical Control Point (HACCP) Principles for food handling and marketing, local regulations and International Labour Organization. Kenya-GAP is the only comprehensive (vegetables, flowers, fruits) quality assurance scheme from the African continent to acquire the EurepGAP/ GlobalGAP® equivalence.
Source: Various sources, 2013
In the development of the CaRROT and these guidelines, an array of carbon accounting principles and standards were considered and adopted, including but not limited to IPCC, ISO and GHG Protocol, among other relevant guidelines and standards. For the measurement of water and energy resources, strategic linkages with existing flower industry standards related to energy and water management such as the KFC’s CoP and MPS were taken into consideration. Table 4 below provides an overview of the frameworks and standards considered and used as a benchmark for each of the three parameters of the toolkit (i.e. water, energy and GHGs).

CaRROT – Guidelines and Opportunities 16
Table 4: Overview of the Various Standards Considered
All of the standards highlighted in this section are policy neutral and applicable to Kenya’s flower sector. The standards guide sustainable practices at both a sectoral level, as well as in-house management of operational processes. 2.1 Carbon Accounting Standards a) ISO 14000: ‘Family of Environmental Standards’
Carbon management as a discipline is still growing; however a host of standards exist with more being developed as the management practices mature. The ISO 14000 “Family of Environmental Management Standards” is the cornerstone of carbon management. The main ISO standards for carbon accounting are summarised in Table 5. Table 5: Summary of the main ISO GHG Accounting Standards
Standard Description
ISO 14064 parts 1, 2 and 3
Accounting GHG and verification standards for general GHG accounting (organisational and project)
ISO 14065 Specifies requirements to accredit or recognize organizational bodies that undertake GHG validation or verification using ISO 14064
14066
Specifies competency requirements for greenhouse gas validators and verifiers.
ISO 14067 1 - 2 Accounting standard for product carbon footprints
ISO 14069 Accounting standard specifically for organisational carbon foot-printing
Source: The ISO 14000 series The ISO 14000 series provides guidance on the implementation of management systems; accounting and assessment of impacts; auditing and evaluation; and communication of assertions. The ISO standards are generic for flexibility and allow for maximum application to the three parameters (i.e. water, energy and carbon) of the toolkit. b) GHG Protocol: ‘Corporate Accounting and Reporting Standards’ The World Business Council for Sustainable Development (WBCSD) in conjunction with the World Resources Institute (WRI) has developed the GHG Protocol to translate and align the carbon accounting and management methodologies with financial accounting and corporate systems. The GHG Protocol methodologies mirror those of the ISO and are developed in collaboration with ISO. The GHG Protocol is the most widely used accounting and reporting
Nati
on
al
Reg
ula
tory
Fra
mew
ork
s
KF
C C
ert
ific
ati
on
Sta
nd
ard
s
Mo
re P
rofi
tab
le
Su
sta
inab
ilit
y
(MP
S)
IPC
C
ISO
GH
G P
roto
co
l
Allia
nc
e o
f W
ate
r
Ste
ward
sh
ip
Defr
a
IEA
Eco
inv
en
t
Bio
gra
ce
Carb
on
Tru
st
Water √ √ √ √ √
Energy √ √ √ √ √ √ √ √
Greenhouse Gases
√ √ √ √ √ √ √

CaRROT – Guidelines and Opportunities 17
standards particularly in the private sector due to the accessible language style and presentation format alignment with familiar business concepts, terms and systems. The GHG Protocol provides the accounting framework for nearly every GHG standard and program in the world, including ISO to the Climate Registry, as well as hundreds of GHG inventories prepared by individual companies. The GHG Protocol consists of 4 distinct but interlinked standards. Table 6 provides a summary of the GHG Protocol series of carbon accounting and reporting standards applicable to the CaRROT and these guidelines. Table 6: GHG Protocol series of Accounting and Reporting Standards
Standard Focus
(i) Corporate Accounting and Reporting Standards (Corporate Standard):
Private and public sector focus
Organisational carbon emissions from business activities and operations
Methodologies for carbon inventories and reporting
(ii) Project Accounting Protocol and Guidelines
Project focused carbon accounting
Quantifies carbon (reduction) benefits of climate change mitigation projects
Policy neutral
(iii) Corporate Value Chain (Scope 3) Accounting and Reporting Standard
Private and public sector focus
Value chain carbon emissions beyond the direct carbon emissions stemming from an organization’s operations and activities
Supports strategies to address climate impacts throughout the value chain.
(iv) Product Life Cycle Accounting and Reporting Standard:
Calculate the full life cycle carbon emissions of a product
companies can measure the greenhouse gases associated with the full life cycle of products including raw materials, manufacturing, transportation, storage, use and disposal
First step towards more sustainable products
Source: GHG Protocol
c) IPCC: 2006 Guidelines for National GHG Inventories: The Intergovernmental Panel on Climate Change (IPCC)9 reviews and assesses the most recent scientific, technical and socio-economic information produced worldwide relevant to the understanding of climate change. IPCC 2006 Volumes 1, 2, 3 and 4 provides general guidance and reporting for preparing annual greenhouse gas inventories in the Energy and, Agriculture, Forestry and other Land Use (AFOLU) sector. This volume integrates the previously separate guidance in the Revised 1996 IPCC Guidelines for National Greenhouse Gas Inventories for Agriculture (Chapter 4) and Land Use, Land-Use Change and Forestry (Chapter 5). This integration recognizes that the processes underlying greenhouse gas emissions and removals, as well as the different forms of terrestrial carbon stocks, can occur across all types of land. It recognizes that land-use changes can involve all types of land. This approach is intended to improve consistency and completeness in the estimation and reporting of greenhouse gas emissions and removals.
9 The Intergovernmental Panel on Climate Change (IPCC) is the leading international body for the assessment of climate change.
It was established by the United Nations Environment Programme (UNEP) and the World Meteorological Organization (WMO) in 1988 to provide the world with a clear scientific view on the current state of knowledge in climate change and its potential environmental and socio-economic impacts (Source: http://www.ipcc.ch/organization/organization.shtml#.UvM4ZvuPPs0)

CaRROT – Guidelines and Opportunities 18
In the development of the toolkit, the project team took into consideration the general information on inventory compilation, quality assurance/quality control, uncertainty and guidance on the choice of methods of determining GHG emissions as provided in Volume 1 (General Guidance and Reporting) and Volume 2 (Energy). Figure 6 below illustrates the sectoral approach utilized to determine an appropriate emissions inventory. The development of a GHG inventory is also addressed in Chapter 3 of these guidelines.
Figure 6: Relationship between General and Sectoral Guidance
Source: IPCC, 200610
2.2 Resource Management: Principles and Standards To support the integration of water and energy resource management systems in the toolkit, the project team was cognizant of the various national legislations (including subsidiary legislations) that are likely to affect the flower sector, such as the Water Act11, Environmental Management and Coordination Act12, Energy Act 200613 and the Energy (Energy Management) Regulations 201214, among others. The requirements provided in the existing legislation are also entrenched in the KFC CoP to ensure sustainable business systems and procedures are implemented within the private sector, including flower farms. The sections below provide an overview of the additional frameworks that were considered in the development of the toolkit. Conversely to the existing global carbon management frameworks, resource management standards (specifically for water and energy resources) are more fragmented. a) Water CaRROT applies the KFC CoP requirements related to water utilization. The CoP is closely benchmarked to the ‘International Water Stewardship Standards’ administered by the Alliance of Water Stewardship (AWS). The AWS standard’s overall objective is to minimize the negative impacts and maximize the positive impacts of social, environmental and economic water use.
10
IPCC: National GHG Inventories Programme brochure accessed on 06th February 2014 -
https://www.ipcc.ch/pdf/activity/2006gls-brochure.pdf 11
Act No. 8 of 2002, Laws of Kenya 12
Act No. 8 of 1999, Laws of Kenya 13
Act No. 12 of 2006, Laws of Kenya 14
Legal Notice No. 102 of 2012

CaRROT – Guidelines and Opportunities 19
The standard is implemented on key principles which are designed to mitigate the negative impacts and magnify the positive impacts of water stewardship at the site and watershed levels, in a way that is environmentally, socially, and economically sustainable. b) Energy For effective energy management and energy efficiency, ISO 50001 – ‘Energy Management Standard’ was taken into consideration. This standard supports integrated energy management and is complementary to previously stated ISO 14000 series. In addition, the project team reviewed the audit requirements of the Energy (Energy Management) Regulations 2012 to establish compatible business management system.

CaRROT – Guidelines and Opportunities 20
3 CaRROT and Kenya’s Flower Sector
Kenya’s flower sector value chain is quite complex as there are a number of supply chain streams for the distribution and sale of flowers in export markets. The five supply streams fall into two broad categories, namely: (i) auction oriented stream with independent retailers as the main vendors; and (ii) direct or mass retail route in which the producer and final retail outlet have a direct agreement with the flower producers. Figure 7 provides a brief overview of the supply channels and activities that make up the flower industry value chain. It is within this framework that the activity emissions for CaRROT will be quantified to understand where GHG emissions occur and the degree of risk or opportunity they represent.
Figure 7: Kenya Flower Industry Value Chain15
15
The dark arrows indicate steps that may be skipped or combined in different ways before reaching the end-consumer
Production &
Delivery
Production &
Post-Harvest
Handling
Transport to
Market
Distribution
Channels
Retail
Consumer
Packaging
Fertilisers production & use
Transportation
Energy & Water efficiency
Cold Chain Management
Logistics & Transportation
Packaging
Air miles
Carbon Emissions

CaRROT – Guidelines and Opportunities 21
3.1 Assessment Methodology The focus of the toolkit and these guidelines is farm-level operations, although as far as possible GHG emissions associated with contracted services and the production of farm inputs and supporting business administrative activities were included (Figure 8).
Figure 8: Assessment Methodology for CaRROT
The flower industry GHG accounting guidelines for CaRROT are drawn from ISO, IPCC’s national GHG emissions guidelines and the GHG Protocol range of standards. These standards have been developed as an organisational carbon foot printing reference tool to be used in conjunction with the CaRROT. It is worthy of note that the GHG emissions assessment imbedded in CaRROT includes the six GHGs stated in the Kyoto protocol. To determine the impact of the GHGs on the environment, the toolkit took into consideration the global warming potentials (GWP)16 of each GHG which is expressed in CO2 equivalents and provides an indication of the strength of the greenhouse warming capacity of a GHG relative to that of CO2 when released into the atmosphere. The six GHGs which are imbedded in CaRROT and their GWP are: (i) carbon dioxide (CO2) - 1; (ii) methane (CH4) - 25; (iii) nitrous oxide (N2O) - 298; (iv) sulphur hexafluoride (SF6) – 22,800; (v) perfluorocarbons (PFCs) range from 7,390 – 17,700; and (vi) hydrofluorocarbons (HFCs) range from 124 – 14,800. Although nitrogen trifluoride is covered under the Kyoto Protocol but has been included in the list of GHG gases to be covered by the GHG Protocol. The scope of CaRROT is focused on three elements of the GHG inventory (Figure 9) to do with the actual quantification of activity-related GHGs. The most important elements required for developing an inventory include the: (i) quantity: data which covers the full scope of GHG emissions associated with a farm; (ii) assessment boundary: identifying the inventory boundaries which determine which entities are included in the organisational carbon footprint; and (iii) activity data: which sources of GHGs and activities are included an organisation's carbon footprint. The specified assessment methodology forms the basis of the CaRROT specifications and is greatly informed by the Kenya’s flower value chain. The user of the toolkit is required to provide source data related to their activities highlighted in the sectoral value chain (refer to Figure 5).
16
The ‘global warming potential’ of a gas is its relative potential contribution to climate change over a 100 year period, where CO2 =1 (see Glossary for a full definition). Source: IPCC (2007)

CaRROT – Guidelines and Opportunities 22
Figure 9: GHG Inventory
Quality
Principles of data quality Quality Control & Assurance
Calculate GHG Emissions
Activity Data Emissions factors Global warming potentials
Collect Data
Invoices Vehicle logs Meter readings & measurements
Identify Categories of Emissions
Mobile Stationary Process Fugitive
Set Inventory Boundary & Assessment Period
Organisational Operational Assessment period (date)
Select GHGs to included
Kyoto Gases

CaRROT – Guidelines and Opportunities 23
In utilising CaRROT, Kenya’s flower farmers are empowered to quantify their basic carbon footprint17. This is done by the review and analysis of the six GHGs taken into account in the toolkit’s assessment methodology. CaRROT acts as a business management tool used by management to integrate carbon emissions and climate change into high level operational decision-making with regard to procurement, production, and inventory management18. In addition, it assist technical staff members to quantify monthly resource consumption at farm level, as well as the carbon emissions associated with commercial activities (such as, use of fossil fuels for the energy generation, including electricity). It is envisaged that the flower farms will maintain a consistent track of annual consumption trends over the next 3 years and review them in comparison with data sources indicating their cost implications, to eventually develop baseline data for the comparative analysis of the company’s overall performance. 3.2 Inventory Boundary The inventory boundary for CaRROT comprises of two elements: (i) the organisational boundary which indicates the legal entity that is the subject of the assessment; and (ii) the operational boundary which encompasses the carbon emissions and activities that will form part of the carbon footprint or GHG emissions assessment (Table 7). Table 7: An Overview of CaRROT’s Inventory Boundary
Organisational boundary Operational boundary
Setting the organisational boundary Identifies which entities are included in an organisational GHG assessment.
Setting the operational boundary entails defining the scope of direct and indirect emissions for those entities included within a company's defined organisational carbon footprint.
By completing worksheet 3 of the CaRROT, the flower farm determines the operational boundary selected for assessment.
By completing worksheet 4, 5, and 6 of the CaRROT, the flower farm determines the operational boundary selected for assessment.
Determined by either the: equity share approach based on the
company’s share of equity or economic interest in the operation; or
control approach based on the company’s financial or operational control of the entity.
In line with the GHG Protocol, carbon emissions are divided into three separate categories which indicate the degree of direct responsibility or causation of a company for carbon emissions: Scope 1 - Direct emissions generated
from company owned machinery or vehicles.
Scope 2 - Special category reserved for purchased electricity and/or energy in the form of heat or steam.
Scope 3 - Emissions generated as a result of a company's need or request for services provided by a third-party19.
17
A carbon footprint is a measure of the GHG emissions associated with the activities and products of companies, organisations and people. 18
Benjaafar, S. ; Yanzhi Li and Daskin, M. 2013 . Carbon Footprint and the Management of Supply Chains: Insights from Simple Models. Automation Science and Engine 10 (1) 19
Activities such as business travel using commercial flights or transport not owned by the company in question fall within this category.
CaRROT – Guidelines and Opportunities 24
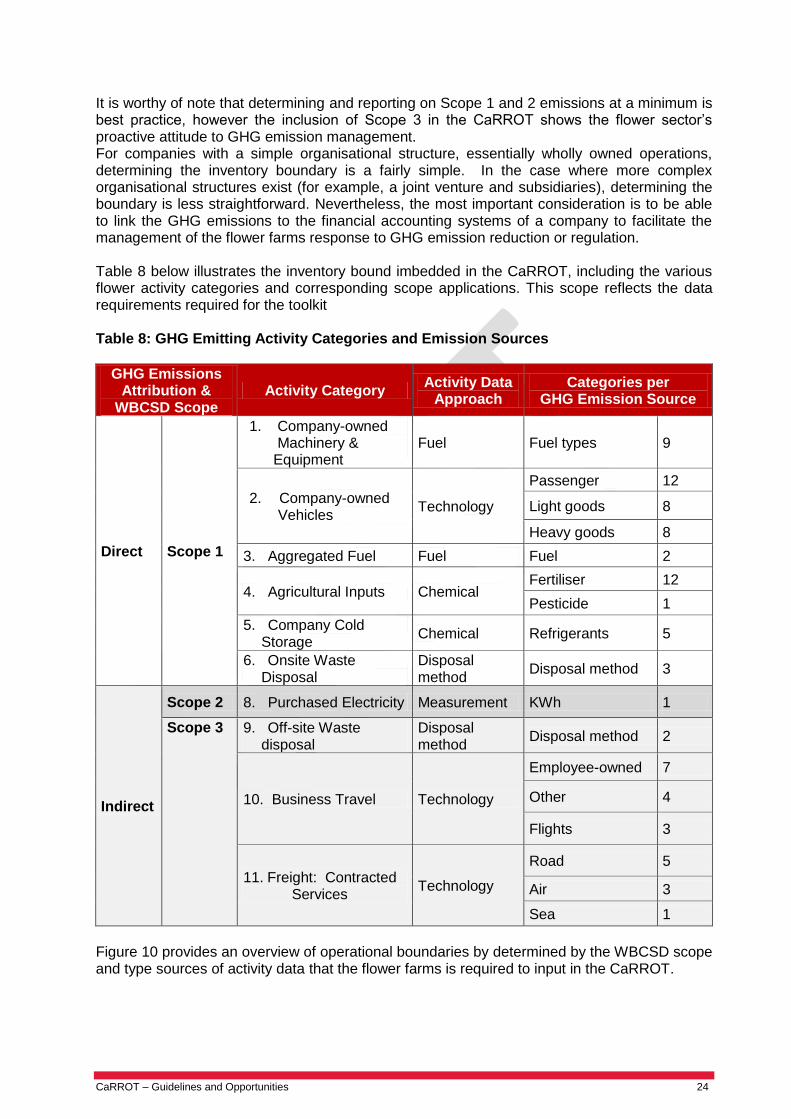
It is worthy of note that determining and reporting on Scope 1 and 2 emissions at a minimum is best practice, however the inclusion of Scope 3 in the CaRROT shows the flower sector’s proactive attitude to GHG emission management. For companies with a simple organisational structure, essentially wholly owned operations, determining the inventory boundary is a fairly simple. In the case where more complex organisational structures exist (for example, a joint venture and subsidiaries), determining the boundary is less straightforward. Nevertheless, the most important consideration is to be able to link the GHG emissions to the financial accounting systems of a company to facilitate the management of the flower farms response to GHG emission reduction or regulation. Table 8 below illustrates the inventory bound imbedded in the CaRROT, including the various flower activity categories and corresponding scope applications. This scope reflects the data requirements required for the toolkit Table 8: GHG Emitting Activity Categories and Emission Sources
GHG Emissions Attribution &
WBCSD Scope Activity Category
Activity Data Approach
Categories per GHG Emission Source
Direct Scope 1
1. Company-owned Machinery & Equipment
Fuel Fuel types 9
2. Company-owned Vehicles
Technology
Passenger 12
Light goods 8
Heavy goods 8
3. Aggregated Fuel Fuel Fuel 2
4. Agricultural Inputs Chemical Fertiliser 12
Pesticide 1
5. Company Cold Storage
Chemical Refrigerants 5
6. Onsite Waste Disposal
Disposal method
Disposal method 3
Indirect
Scope 2 8. Purchased Electricity Measurement KWh 1
Scope 3 9. Off-site Waste disposal
Disposal method
Disposal method 2
10. Business Travel Technology
Employee-owned 7
Other 4
Flights 3
11. Freight: Contracted Services
Technology
Road 5
Air 3
Sea 1
Figure 10 provides an overview of operational boundaries by determined by the WBCSD scope and type sources of activity data that the flower farms is required to input in the CaRROT.

CaRROT – Guidelines and Opportunities 25
Operational Boundary
Scope 1: Direct
Scope 2: Purchased energy
Scope 3: Indirect emision
Figure 10: Conceptualization for Setting an Operational Assessment Boundary
Direct GHG emissions from sources owned or controlled by the company
Company-owned vehicles
Company-owned furnaces, boilers
Process emissions from onsite industrial or production processes
Must be included in an organisational carbon footprint
Special category of indirect emissions
GHG emissions from the generation of purchased electricity or other forms of energy 2 consumed by the company.
Scope 2 GHGs are emitted at the site where electricity is generated and not where or when it is used by the end-consumer
Heterogeneous set of indirect emissions are included in this category
An optional reporting category for the treatment of all other indirect emissions
GHG emissions from contracted services provided by other companies
Examples of Data Sources

CaRROT – Guidelines and Opportunities 26
3.3 Data Collection and Handling a) Data Sources Consistent and accurate data collection and management plays an important role in determining the quality and credibility of any GHG inventory. There are two types of data used to under CaRROT’s GHG emissions assessment: (i) primary; and (ii) secondary data. The primary data will be specific to the flower farm activities and technology, while the secondary data are measures that are derived or non-specific data that applicable to the farm but are derived elsewhere, such as databases. Primary data is preferred as it captures accurately the activities and technologies of an organization. Most activity data required for a GHG inventory is captured in some form in an organization’s financial accounting systems. Documents such as vehicle log books, invoices for purchased electricity and fuels, water and energy metered readings, and supply or stock inventories give an indication of the nature and quantities of resources and materials consumed that form part of an organization’s GHG inventory. Direct measures may also be available in cases where the consumables and materials is measured and monitored using automated systems. Figure 11 provides an overview of the steps generally taken to collect data for an inventory.
Figure 11: The Process of Data Collection
Data used in the GHG inventory should be sufficiently detailed and comprehensive to address reporting obligations and management purposes. Data sets used should be consistent with the period for which the inventory is being developed and should be consistent, complete and accurate to allow comparisons over time. The more complete and accurate GHG inventory data are the more useful and credible an inventory becomes. Emphasis should be placed on obtaining data that are complete and cover all important
Data
Sources
•Identify key GHG emissions (including categories and sources)
•Identify the quantity of consumption for water and energy sources
•Collect relevant data from key document sources
Review/Handle
Data
•Review data and documentation
•Ensure data relevance and comprehensiveness
•Ensure effective data handling and storage processes
Quality
Management
•Determine the comprehensiveness and quality of data
•Embed data collection and quality management systems in business operational systems

CaRROT – Guidelines and Opportunities 27
GHG emissions sources and activities. Data sources should be stored, the origin and quality documented as well as changes and methods used to alter data used in the inventory from its original form or source. As one of the most important elements of a GHG inventory, data used need to adhere (as far as possible) to the principles of data quality: relevance, completeness, consistency, transparency and accuracy. Whenever possible, audited data should be used in an inventory as it has such important implications for the accounting and reporting company. As a company’s GHG Inventory management systems mature, data management systems and data management process owners will be put in place to facilitate and simplify the data collation process and form the basis for the continuous improvement of data quality. b) Uncertainty Uncertainty is important part of developing a good quality inventory. In many cases, particularly where generic and/or secondary data is used, it may not be possible to eliminate uncertainty but it should be accounted for and factored into how emissions are reported. Uncertainty in a GHG inventory applicable to the CaRROT can be reduced by addressing the following elements of the inventory development process and inputs: (i) Improving the inclusiveness of assumptions used to underpin calculations or to
generate data. (ii) Improve the model selected to describe processes. (iii) Improvement data representatives and decreased sampling biases. (iv) Improved measurement precision. (v) Eliminating known risks of bias that may arise from equipment calibration or settings. (vi) Improving the knowledge and understanding of processes responsible for GHG
emissions. (vii) Using data that has comprehensive and descriptive metadata.
As discussed in these guidelines, most of the GHG inventory development effort should be given to those elements that have the most significant impact on the organizational GHG inventory. A variety of mathematical and statistical techniques and where applicable, expert judgment, may be used to quantify and address the uncertainty associated with input data, emission factors, methodological uncertainty and processes. 3.4 GHG Emissions Calculations and Benchmarking a) Quantification of GHG Emissions There are two broad approaches used quantifying the GHGs associated with the scopes, processes and activities included the GHG inventory of an organization: a) Direct emissions data: This is derived from actual emissions releases measured at
source and/or is based on stoichiometric equation balancing and mass flows entering and leaving a defined system. Measuring emissions at source requires specialised equipment and the associated technical expertise to both operate and interpret information obtained from these systems; and
b) Indirect quantification using emission factors: This involves the use of predetermined emission factors that may be drawn from a variety of sources using any number of

CaRROT – Guidelines and Opportunities 28
techniques, technologies and methodologies. Emissions factors provide a unit measure of GHG emissions (for example, kg CO2) per unit activity (for example, litres of diesel consumed).
The second approach involves the use predetermined emission factors that may be drawn from a variety of sources using any number of techniques, technologies and methodologies. Emissions factors provide a unit measure of GHG emissions (for example, kg CO2) per unit activity (for example, litres of diesel consumed). Figure 12 below provides an illustration of the methods employed in the quantification of GHG emissions in the CaRROT. Figure 12: GHG Emissions Calculation (A: Direct measurement & B: Indirect using emission factors20)
The use of GHG emission factors to quantify GHG emissions is widespread. Wherever possible source or facility/technology specific emission factors are preferable to generic emissions factors; however it is often too costly to develop such specific emission factors. The grid emission factors and default values incorporated within the toolkit are pursuant to IPCC 1996 & 2006, GHG Protocol, International Energy Association (IEA) 2007, EcoInvent (2010), Carbon Trust, Defra (2012), Biograce (2011) guidelines and standards. The agreed unit of GHG measurement is tonnes of CO2 equivalent (tCO2e). In line with the emission scope of activities provided by the GHG Protocol, the CaRROT incorporates 3 operational
20
Emissions factors themselves may have been determined using direct emissions measurements and data. In order to determine the emissions associated with a specific activity, activity data (for example, litre of fuel consumed) is multiplied by the associated emissions factor (kg CO2/litre fuel consumed) to give the total amount of GHG emissions associated with a particular activity.
Direct measurement/
Stoichiometry/
Mass balance
Direct Measurement
Data X
Normalise GHG
emissions relative
to CO2
Global
Warming
Potential
Tonnes CO2e
Carbon Dioxide
Equivalents
(CO2e) = A
B
Activity
Data
Emission
Factor
Global
Warming
Potential
Carbon Dioxide
Equivalents
(CO2e) X X =
GHG emitting
activity e.g.
litres diesel
GHGs emitted
e.g. kg fuel/litre
of diesel
Normalise GHG
emissions
relative to CO2
Tonnes CO2e
CaRROT – Guidelines and Opportunities 29
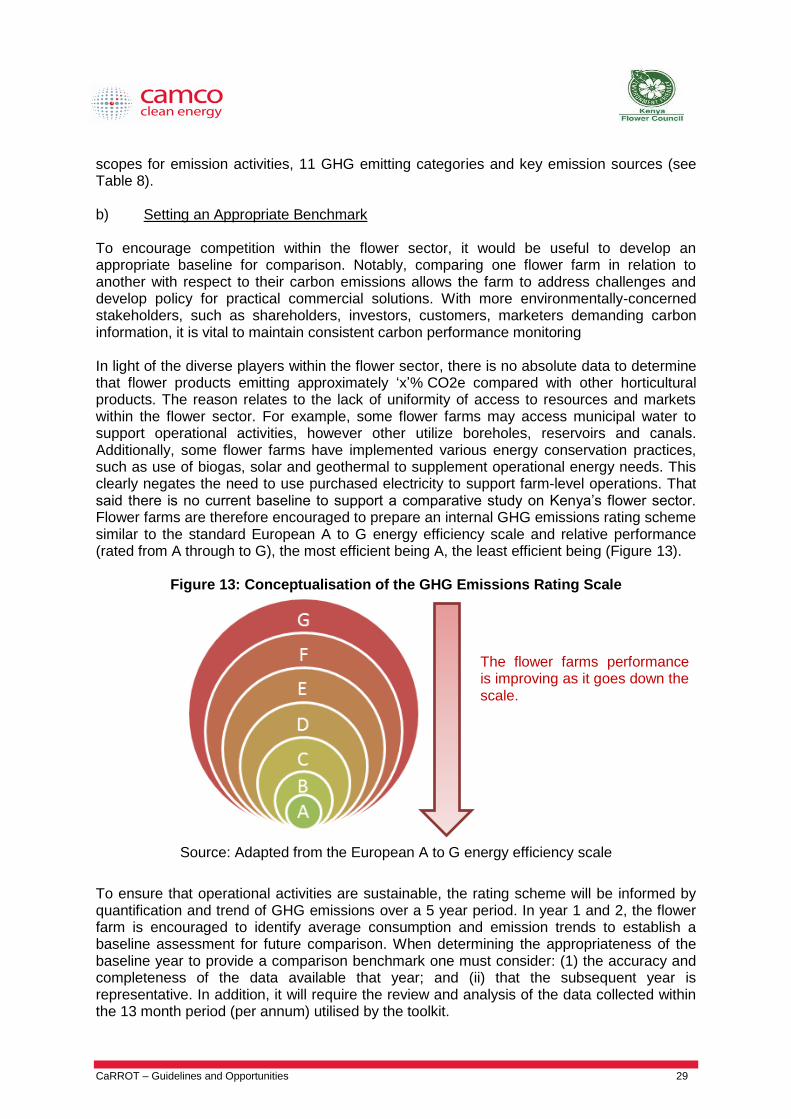
scopes for emission activities, 11 GHG emitting categories and key emission sources (see Table 8). b) Setting an Appropriate Benchmark To encourage competition within the flower sector, it would be useful to develop an appropriate baseline for comparison. Notably, comparing one flower farm in relation to another with respect to their carbon emissions allows the farm to address challenges and develop policy for practical commercial solutions. With more environmentally-concerned stakeholders, such as shareholders, investors, customers, marketers demanding carbon information, it is vital to maintain consistent carbon performance monitoring In light of the diverse players within the flower sector, there is no absolute data to determine that flower products emitting approximately ‘x’% CO2e compared with other horticultural products. The reason relates to the lack of uniformity of access to resources and markets within the flower sector. For example, some flower farms may access municipal water to support operational activities, however other utilize boreholes, reservoirs and canals. Additionally, some flower farms have implemented various energy conservation practices, such as use of biogas, solar and geothermal to supplement operational energy needs. This clearly negates the need to use purchased electricity to support farm-level operations. That said there is no current baseline to support a comparative study on Kenya’s flower sector. Flower farms are therefore encouraged to prepare an internal GHG emissions rating scheme similar to the standard European A to G energy efficiency scale and relative performance (rated from A through to G), the most efficient being A, the least efficient being (Figure 13).
Figure 13: Conceptualisation of the GHG Emissions Rating Scale
Source: Adapted from the European A to G energy efficiency scale
To ensure that operational activities are sustainable, the rating scheme will be informed by quantification and trend of GHG emissions over a 5 year period. In year 1 and 2, the flower farm is encouraged to identify average consumption and emission trends to establish a baseline assessment for future comparison. When determining the appropriateness of the baseline year to provide a comparison benchmark one must consider: (1) the accuracy and completeness of the data available that year; and (ii) that the subsequent year is representative. In addition, it will require the review and analysis of the data collected within the 13 month period (per annum) utilised by the toolkit.
The flower farms performance is improving as it goes down the scale.

CaRROT – Guidelines and Opportunities 30
The periodical quantification of the GHG emissions will allow flower farmers to adapt and monitor their internal benchmarking scheme to ensure it is fit for purpose. Thereafter in year 3, 4 and 5, the flower farm will be empowered to set strategic targets for the improvement of business management systems. This process will determine: (i) how well the flower farm is at reducing its GHG emissions and managing its resources (that is, water and energy); (ii) how well the flower farm is performing in managing its GHG emissions in comparison to another flower farm of similar size with reasonably similar access resources; (iii) areas that require improvement; and (iv) the accuracy of supply chain, carbon reduction and resource management information reported by the flower farm. The parameters of a national benchmarking scheme will then be determined by the compilation of data from individual flower farms over a period of time and the development of flower sector benchmarks and ratings at a sectoral level. c) Tracking Emission over Time Part of setting the inventory boundaries includes: (i) providing a clear indication of the GHG emissions assessment period; and (ii) the period for data is collected. The assessment period selected will have an impact on the monitoring and targeting strategies that the flower farm will implement to ultimately reduce GHG emissions. The time frame also has implications on reporting and interactions with relevant stakeholders (for example, investors, shareholders, customers). The assessment period shall analyse the trends, inventory quality and effectiveness implemented business policy. For tracking purposes, the assessment period selected should be used consistently to monitor carbon performance over time (for example, the proposed 5 year benchmarking period). The base year emissions assessment will act as the reference point for GHG emissions assessments going forward. Data management systems should be put in place to ensure that data quality improves to such a point that a credible set of data exists upon which to a base year emissions can be determined. The base year may need to be recalculated in some situations in order to allow continued comparison with subsequent GHG emission inventories. Base year recalculations may be undertaken using a range of mathematical approaches, each to be determined by the circumstances which have prompted the recalculation. Base year recalculations should not occur in response to the organic growth or decline of a flower farm. 3.5 Quality Control and Assurance a) Data Quality Management
Quality control (QC) and assurance (QA) are critical components of developing and maintaining an accurate a GHG inventory. There are also a number of ISO standards which focus on quality management, a very important part of developing a credible and meaningful carbon inventory. These guidelines encourage flower farms to integrate the CaRROT as part of the business management systems. This will include applying their internal quality control and assurance procedures to all primary and secondary data requirements for the toolkit. The data should be assessed for its relevance, completeness, consistency, transparency and accuracy.

CaRROT – Guidelines and Opportunities 31
Data and calculation verification, cross-checking and validation should take place as part of the inventory development of the flower farm. This will be done at the time of data collection and may be performed by the internal farm auditor or any other authorized technical staff member within the flower farm. Data validation is also important and should be undertaken by a designated person (for example, the farm manager) with the necessary insight and experience to assess the data quality, applicability and validity of assumptions and emissions factors used and accuracy of GHG emissions computations and resource quantification calculations. A second system of cross-checking, verification and validation is necessary as part of the quality assurance processes. This process can be undertaken by an authorized senior management representative. As the importance of GHG inventories increased with an associated tightening of legal and regulatory requirements associated with GHG emissions management, the role of assurance has become even more prominent as pillar of a credible inventory. 3.6 Reporting As previously stated, the CaRROT incorporates existing standards and principles. The requirements prescribed in the GHG Protocol therefore form part of these guidelines. The reporting approach divides emissions into three main categories: Scope 1 which covers GHG emission sources owned or controlled by the reporting organization. This can include emissions from combustion of company owned vehicles, boilers, furnaces or emissions from chemical production in company process equipment; Scope 2 which covers reporting based on purchased electricity. For many flower farms, purchased electricity represents one of the largest sources of GHG emissions and the most significant opportunity to reduce these emissions; and Scope 3 which is an optional but widely reported category for other indirect emissions. Examples include use of sold/outsourced products and services such as transportation services and purchased fuels
As with the accounting component of the inventory, reporting must also be framed within the accounting principles that address accuracy, validity, consistency, completeness and transparency. At a minimum the report should include a description of the reporting organization or company, the methodology used to quantify emissions and the results of the assessment period. The CaRROT provides for rudimentary reporting on the flower farm, quantification of carbon performance and the results dashboard allows for collation and analysis of input data. Please note that purchased offsets (if applicable) must be reported separately from the three scopes above.

CaRROT – Guidelines and Opportunities 32
4 Climate Opportunities for Kenya’s Flower Sector
The opposite of climate risk is climate opportunities. Following the quantification of their GHG emissions and resource consumption, flower farms can utilise the quantified carbon performance data to take advantage of the various national, regional and international climate related opportunities available. To fully benefit from the various opportunities and financing/funding mechanisms, private sector (including the flower industry) must look at climate change as not only a developmental challenge, but a potential economic earner. Notably, there are business opportunities in implementing mitigation measures to reduce GHG emissions and developing adaptation measures to acclimatise to the impacts of climate change. Various financing and funding mechanisms are available to encourage climate change adaptation through innovation and climate change mitigation through transfer of technologies. They range from purely private sector driven initiatives, to public-private partnership engagements. This section reviews some of the many potential climate opportunities available to Kenya’s flower sector. 4.1 Compliance Mechanisms The Clean Development Mechanism (CDM) as defined by the Kyoto Protocol (in collaboration with the United Nations Framework Convention on Climate Change (UNFCCC)), permits countries with emission reduction targets and commitments (categorized as Annex 1 countries) to purchase the certified emission reductions (CERs) generated from projects implemented in non-Annex 1 countries (for example Ethiopia, Kenya, Uganda, and Tanzania, among others), each unit equivalent to one metric ton of CO2. For example, Belgium buying CERs from CDM projects allows industrialized parties to supplement their domestic mitigation actions by ’offsetting‘ one tCO2e per CER. The rationale being that such a scheme will allow for the purchase of the most cost effective CERs while promoting sustainable development and without placing mitigation burdens on developing countries. The global scale of CDM has been expanding rapidly and by September 2012, over one billion CERS units have been issued. However, a 2009 directive by the EU restricts the trade in CERs within the EU emissions trading system (EU ETS) to those generated from CDM projects registered in Least Developed Countries (LDC) post-2012. This effectively excludes CERs generated from all CDM projects implemented in Kenya as a non-LDC, and registered after 2012. Exclusion from the EU ETS which is the largest global CER market will inevitably slow down investments in CDM projects within the country. Nevertheless, other countries are now establishing similar trading platforms, which may over time provide a new source of demand for CERs in Kenya. Notably, the Kenyan flower industry if they wish to participate in CDM activities may do so through various initiatives that have been piloted across the industry. For instance:
The industry forest project that the Kenya Flower Council has been advocating and promoting can be used to develop a CDM project. This is a viable option since currently there are 3 afforestation/reforestation (AR) CDM projects registered in Kenya. The Kenyan flower industry is widely diversified and technologically advanced with biogas generation, solar power, and water efficiency projects that can be used to develop viable CDM projects across the industry.

CaRROT – Guidelines and Opportunities 33
Alternatively the flower farms can opt for a programmatic approach in developing an energy related CDM project. CDM Programme of Activities (PoA) lowers the transaction costs by aggregating small, but related CER generating initiatives. PoAs are a modality of project development under CDM of the UNFCCC. The aim of PoAs is to allow replicable projects with low physical spread of GHG reductions into the CDM. For example, biogas projects which will ensure energy efficiency by supplementing the farms’ energy needs, address solid waste management challenges and introduce potential revenue for the farm can be developed under the CDM PoA option. Presently, the Ministry of Energy of Kenya is working in collaboration with 2 flower farms in Kenya, P.J. Dave Limited (located in Isinya) and Simbi Roses (located in Thika), on pilot schemes to convert farm waste into biogas which can serve as a model to be replicated in other flower farms. The projects are in preliminary stages, however following consultations with the flower farms participating there are high hopes for success.
The use of solar thermal applications to generate heat during the day for use in the greenhouses at night is also a potential CDM PoA project. This heating option off-sets the use of GHG intensive fossils fuels and reduces the use of grid-based electricity. The solar thermal applications may also be used to heat water, and the steam further recycled in the greenhouses. An example of flower farms implementing a similar project is Bilashaka Flowers which is situated near Lake Naivasha and Timaflor Flower Farm in Nanyuki.
The PoA projects are often linked to higher sustainability benefits, but are too small to pay back the high transaction costs involved in the CDM process. It allows countries, such as Kenya, to participate in the CDM. Some of the key advantages of CDM PoA over regular CDM project activities include: a) transaction costs, investment risks and uncertainties for individual component project
activities (CPA) participants are reduced; b) PoAs are managed on a regional level which speeds up the approval process by the
designated authority linked to the UNFCCC; c) access to the CDM is extended to smaller projects which would not be viable as
stand-alone projects; d) direct engagement of individual project developers in the CDM process is not
required; and e) emission reductions can be continuously scaled up after PoA registration, since an
unlimited number of CPAs can be added at a later stage. Some promising examples of potential PoAs that can be implemented by the flower sector are in areas of energy efficiency, such as the use of solar lighting kits, compact fluorescent lamps and solar water heaters. As flower farm staff will tend to live on-site, these options can be applied for commercial and domestic purposes.
The PoA approach can be used to bundle the various sustainable projects in the Kenyan flower industry to access carbon finance. Undertaking feasibility studies to determine the viability of such projects to access carbon financing can be the first step towards developing CDM and/or CDM PoA projects. Table 9 below illustrates a variety of CDM projects that would also be applicable for the Kenya’s flower sector.

CaRROT – Guidelines and Opportunities 34
Table 9: Potential CDM Projects for the Flower Sector
CDM Classification/Sector Potential Projects
Reforestation/Afforestation Tree plantation on surplus land or degraded land available
Fuel wood production
Agriculture Use of bio-fertilizers/bio-agents to reduce N2O
Energy efficient farm implements
Conservational agriculture
Waste Compost from green waste
Biogas from green waste
Energy from waste
Conventional Power Production Electric Power Generation
Electric power production from renewable energy sources including, solar, biomass, geothermal etc
Heating Systems Low Carbon Fuel
Use of solar energy/ geothermal/biomass energy to heat greenhouses replacing fossil fuel
Renewable Energy Transport Fuel
Use of biodiesel for transport, farming or international movements
Use of carts, trolleys for transport of internal farming products
Power Consumption/ Energy Efficiency
Energy efficient water pumping systems
Low emission electric lamps/LEDS
Biogas lamps
Installation of high efficiency steam boiler
Source: WB, Technical Paper, 2011 Public climate finance from climate funds and donor agencies are more likely to be forthcoming, following Kenya’s exclusion from the EU ETS, and Kenya is well placed to benefit from that funding given the relatively developed nature of its climate change response strategy and policies, as well as its potential renewable energy opportunities. 4.2 Voluntary Markets
Unlike the compliance mechanisms (for example, CDM and/or CDM PoAs), the voluntary markets are not bound to any legally binding agreement (such as the Kyoto Protocol). Nevertheless they maintain and observe the same credibility of accounting and verification systems of compliance markets. The voluntary markets will produce and trade in verified emission reductions (VERs) (Figure 14).
Figure 14: Carbon Offsets in the Compliance and in the Voluntary Market

CaRROT – Guidelines and Opportunities 35
Source: Carbon Association, 200821
In a voluntary carbon market, an entity (from example, an individual flower farm) volunteers to offset its emissions by purchasing carbon credits that reduce the amount of carbon in the atmosphere (Table 10). Some of the reasons for engaging in the voluntary carbon market include: (i) saving money/reduce operating costs; (ii) Corporate Social Responsibility (CSR); (iii) leading by example; (iv) demand from stakeholders; (v) pre-compliance; and (vi) mitigating reputational and commercial risk. In 2007, the Chicago Climate Exchange and over-the-counter voluntary carbon markets transacted 65 million tCO2e valued at US ($) 330 million. This was a 250% increase from the previous year (2006). The voluntary market is growing at twice the rate of the compliance market. Unfortunately, regional disparities are just as pronounced in the voluntary market as with the CDM. In 2007, only 2% of transacted VER volumes were sourced in Africa. Presently, the Gold Standard is the premier certification scheme for voluntary off-set projects that ensures the quality and validity of the project activities. The processes and procedures are similar to that of CDM, including a comprehensive monitoring process, inclusion of local stakeholder consultations’ during both the design phase and feedback rounds and a sustainable development matrix, including social, economic and environmental benefits for local communities.
Table 10: Examples of Voluntary Carbon Market Projects
Activity Category Project Type
1. Renewable Energy a. Grid connected b. Off grid
Small hydro and geothermal
PV lighting systems, wind and solar
2. Energy Efficiency a. Grid connected b. Off grid
compact fluorescent lamps
fuel efficient wood stoves (for example, for staff households)
3. Forestry a. Tree planting b. Conservation
watershed reforestation
forest protection
Source: Green Markets International, “The Voluntary Carbon Market”, 2007
21
Source: http://caaltd.org/Carbon/Market.aspx

CaRROT – Guidelines and Opportunities 36
4.3 Climate Financing and Funds There are various existing and up-coming climate financing and funding mechanisms that are accessible for Kenya’s flower sector and enable direct access to financing necessary to develop climate change projects. They range from domestic funding, regional climate initiatives and international commitments. There are different financing opportunities established at a national, regional and international level. The funds applicable for the flower sector include: (i) Kenya’s National Climate fund (to be established); (ii) Climate Change Adaptation fund; (iii) African Adaptation Fund; (iv) East African Community (EAC) – Climate Change Fund; and (v) various other UNFCCC mandated funds. Annex III shows a brief summary of potential, existing and emerging national, regional and international finances and funds applicable to Kenya’s flower sector. It is incumbent to the flower farmers to proactively pursue these opportunities (where applicable).

CaRROT – Guidelines and Opportunities 37
Systems & Management Focus: Carbon Emissions Accounting,
Monitoring & Reporting
a. Mandatory & Voluntary Carbon & Eco-Labelling
b. Carbon Emissions Accounting and Footprinting
c. Mandatory & Voluntary Carbon Emissions
Reporting
d. Growing Retail Sector & the Wal-Mart Effect
e. Retailer Led Climate & Sustainability Initiatives
Direction & Investment Required for Kenya Industry
a. Industry Carbon accounting standards &
methodology
b. Industry & value chain baseline carbon
assessments
c. Carbon monitoring, assurance & reporting
framework
d. National & international industry
benchmarks
e. Value chain carbon management tools
f. Carbon management processes & systems
g. Process risks & control frameworks
5 Conclusion and Sectoral Recommendations
In a nutshell, the lack of exhaustive information on carbon standards and frameworks is a key constraint for flower exporters on meeting new buyer requirements on carbon. There is a high demand for basic information on why buyers are making these requirements, the type of information needed and the ways to comply. Public agencies also require this information both to disseminate to exporters but also to frame policies that can support sectors in meeting these standards. Information is further needed to feed into the design of national, regional, and international climate change mitigation, adaptation policies and overall environmental industry strategies. Figure 15 provides an overview of the strategic direction the flower industry needs to take to successfully respond to the emphasis on sustainability on flower production, which forms an increasingly key feature of local and export markets.
Figure 15: Direction and Investment Required for Kenya’s Flower Industry
The implementation of CaRROT and its guidelines address the abovementioned systems and management focus for carbon emissions accounting, monitoring and reporting criterion. It is envisaged the direction and investment required will be achieved through the implementation of core sectoral recommendations. Notably, the major drivers of having the carbon and resource management standards in place at a national level is to align the national climate change agenda with that of global perspectives on carbon emission reduction, to comply with government and lobby groups requirements (for example, the National Environment Management Authority (NEMA), LEAF standard), and to ensure operational efficiency for the floriculture sector. To enhance the sectoral productivity and global competitiveness of the flower sector, the CaRROT project has identified various activities that should be undertaken at a sectoral level. a) Sectoral baselines: In light of the impacts of climate change (both direct and
indirect), the productivity of the floriculture industry in Kenya is one of the many vulnerable sectors. It is therefore recommended that the flower sector as a whole undertakes sector-level baseline assessments (in addition to the on-going farm-level assessments) to the determine the: (i) baseline characteristics of the flower sector; (ii) available resources and geographical locations, to link flower farms to resources

CaRROT – Guidelines and Opportunities 38
and options within close proximity; (iii) market access challenges and the numerous applicable standard requirements; (iv) sectoral GHG emission trends; (v) sector’s competitiveness (relative to other countries in the region and globally); and (vi) climate risk assessments, among others. The sectoral baselines will also enable the sector to pursue consolidated sectoral climate change response efforts.
b) Consolidated sectoral activities: In recognition of the potential business opportunities identified in Chapter 4 (Potential Business Opportunities) of these guidelines, Kenya’s flower sector would benefit in participating in consolidated sectoral activities, such as PoAs, as well as applications for funding from the various financing and funding mechanisms. That said, capacity building (both technical and informational) to increase expertise in the floriculture sub-sector is vital. Awareness creation on the numerous national, regional and international mechanisms and standards available will allow flower farms to develop sustainable resource management strategies to enhance energy efficiency and proactive business practices. Joint sourcing of technical, advisory and operational services will also lower the cost per firm. Additionally, enhanced capacity building needs will support the establishment of voluntary guidelines standards for the floricultural sector, through synchronizing sectoral agendas with national, regional and international mechanism requirements. The value addition of a holistic approach for the flower sector’s participation will attract climate investment and international recognition of national efforts, which can then be leveraged during lobbying initiatives.
c) Policy development: Active participation in national and regional policy development is essential to create an enabling environment for Kenya’s flower sector through the provision of clear sectoral guidelines and incentives. Presently, there is no floricultural specific regulatory framework that directly coordinates and manages the activities within the flower sector. There are however numerous national policies with existing and upcoming policies on the environment and climate change that affect the sector’s productivity and competitiveness, including Agriculture Act22, Water Act23, Energy Act24, Employment Act25, Income Tax Act26, Value Added Tax (VAT) Act27, Customs and Excise Act28, and Environmental Management and Coordination Act (EMCA)29 among others. It is recommended that the sector performs a scoping assessment of existing policies and policy frameworks developed that subsequently directly and/or indirectly affect the floriculture sector, and ensure that there is adequate dialogue with government during the development of new regulatory or institutional frameworks. Presently, the Kenya Bureau of Standards (KEBS) in collaboration with KFC is in the process of developing a national compliance mechanism for the flower sector. The process is still on-going and shall hopefully be completed in the coming year.
d) Lobbying and advocacy (National and International): The floriculture industry should also participate in various lobbying and advocacy initiatives for the
23
Act No. 8 of 2002, Laws of Kenya 24
Act No.12 of 2006, Laws of Kenya 25
Act No. 1 of 2007, Laws of Kenya 26
Chapter 470 of the Laws of Kenya 27
Chapter 476 of the Laws of Kenya 28
Chapter 472 of the Laws of Kenya 29
Act No. 8 of 1999, Laws of Kenya

CaRROT – Guidelines and Opportunities 39
development of policies relevant and specific to the flower sector in Kenya. This will ensure they are at the forefront of creating an enabling environment for the industry. In addition to enhancing the flower sector’s competitive advantage in national and international markets through their capitalization of a positive brand image, focused on the brand equity attached to adhering to environmentally friendly activities and practices. Furthermore, engaging in regional and international climate change debates will enhance their access to technological and financial advancements available at the regional and international levels.

CaRROT – Guidelines and Opportunities 40
6 References
2012 Guidelines to Defra / DECC's GHG Conversion Factors for Company Reporting.
Department for the Environment, Food and Rural Affairs, London.
Ballingall J. and Winchester N. (2008). Food miles: Starving the poor? University of Otago,
School of Business, New Zealand.
Government of Kenya (GoK), National Horticulture Policy, 2012. Accessed from:
http://www.kilimo.go.ke/kilimo_docs/pdf/National_Horticulture_Policy.pdf
Horticultural Crops Development Authority (HCDA), Horticulture Validated Report 2010.
Accessed from:
http://www.hcda.or.ke/Statistics/2010/2010%20Horticulture%20Validated%20Report.
IEA. (2009). International Energy Agency. Energy Statistics. www.iea.org
International Organization for Standardization (ISO). (2006). ISO 14064-1 Part 1:
Specification with guidance at the organization level for quantification and reporting
of greenhouse gas emissions and removals
International Organization for Standardization (ISO). (2011). Win the energy challenge with
ISO 50001.
International Organization for Standardization (ISO). (2010). GHG schemes addressing
climate change. How ISO standards help.
International Organization for Standardization (ISO). 2009.Environmental management.The
ISO 14000 family of International Standards
IPCC (2007), Climate Change 2007: Synthesis Report Contribution of Working Groups I, II
and III to the Fourth Assessment Report of the Intergovernmental Panel on Climate
Change [Core Writing Team, Pachauri, R.K and Reisinger, A. (Eds.)]. IPCC, Geneva,
Switzerland, 104 pp.
IPCC (2006), Revised IPCC Guidelines for National Greenhouse Gas Inventories: Reference
Manual. Intergovernmental Panel on Climate Change. Cambridge University Press,
Cambridge
KFC (2012), AGM Activity Report 2012. Kenya Flower Council. Nairobi.
KFC (2012), Blog Archive, September Issue 1 and 3, 2012. Kenya Flower Council. Nairobi.
KFC (2012), Codes of Practice. Kenya Flower Council. Nairobi.
KFC (2012), Gold and Silver Standards Checklist. Kenya Flower Council. Nairobi.
KNBS. (2012), Economic Survey Highlights, 2012. Nairobi: Kenya National Bureau of
Stastics

CaRROT – Guidelines and Opportunities 41
KNBS; MoPND. (2010), Economic Survey 2010. Nairobi: Kenya National Bureau of Statistics
and the Ministry of Panning and National Development
Soil Association Press Release, Ensuring limited organic freight is fair and ethical, 6 March
2008.
Stern Review, 2006
World Bank (2011), The Impact of Climate Change on Competitiveness in the East Africa
Region: Opportunities for Effective Interventions and Adaptation Projects. Technical
Paper,2011.
World Bank and KFC (2011), The Global Competitiveness of the Kenyan Flower Industry.
Accessed from:
http://www.euacpcommodities.eu/files/2.ESA_.D02_KFC_Seminar_Issue_-
_Global_Competitiveness.pdf
World Bank and KFC (2011), The Role of Strategic Environmental Assessments in the
Floriculture Industry in East Africa Region, Nairobi.
WRI/WBCSD - GHG Protocol. (2011). Corporate Value Chain (Scope 3) Accounting and
Reporting Standard. Supplement to the GHG Protocol Corporate Accounting and
Reporting Standard. World Business Council for Sustainable Development, Geneva
and World Resources Institute, Washington.
WRI/WBCSD - GHG Protocol. (2004). Greenhouse Gas Protocol: A Corporate Accounting
and Reporting Standard- Revised Edition. World Business Council for Sustainable
Development, Geneva and World Resources Institute, Washington.
WRI/WBCSD - GHG Protocol. (2011). Product Life Cycle Accounting and Reporting
Standard. World Business Council for Sustainable Development, Geneva and World
Resources Institute, Washington

CaRROT – Guidelines and Opportunities 42
Annex I – Glossary of Terms
Carbon Dioxide
Equivalent (Co2e):
The universal unit of measurement used to indicate the global
warming potential (GWP) of each of the 6 Kyoto greenhouse gases.
It is used to evaluate the impacts of releasing (or avoiding the
release of) different greenhouse gases.
Climate change:
A change of climate which is attributed directly or indirectly to human
activity that alters the composition of the global atmosphere and
which is in addition to natural climate variability over comparable
time periods (Source: United Nations Framework Convention on
Climate Change).
Control:
The ability of a company to direct the operating policies of a facility
or organisation. Usually, if the company owns more than 50% of the
voting interests, this implies control. The holder of the operating
licence often exerts control; however, holding the operating licence
is not a sufficient criterion for being able to direct the operating
policies of a facility or organisation. In practice, the actual exercise
of dominant influence itself is enough to satisfy the definition of
control without requiring any formal power or ability through which it
arises.
Direct emissions:
Emissions that are produced by organisation-owned equipment or
emissions from organisation-owned premises, such as carbon
dioxide from electricity generators, gas boilers and vehicles, or
methane from landfill sites.
Equity share:
The percentage of economic interest in/benefit derived from an
organisation.
Global warming:
The continuous gradual rise of the earth's surface temperature
thought to be caused by the greenhouse effect and responsible for
changes in global climate patterns (see also Climate Change).
Global Warming
Potential (GWP):
The GWP is an index that compares the relative potential (to CO2) of
the 6 greenhouse gases to contribute to global warming i.e. the
additional heat/energy which is retained in the Earth’s ecosystem
through the release of this gas into the atmosphere. The additional
heat/energy impact of all other greenhouse gases are compared
with the impacts of carbon dioxide (CO2) and referred to in terms of
a CO2 equivalent (CO2e) e.g. Carbon dioxide has been designated a
GWP of 1, Methane has a GWP of 21.
Greenhouse gases
(GHG):
The current IPCC inventory includes six major greenhouse gases.
These are Carbon dioxide (CO2), Methane (CH4), Nitrous oxide
(N2O), Hydrofluorocarbons (HFCs), Perfluorocarbons (PFCs),
Sulphur hexafluoride (SF6).
The Intergovernmental A special intergovernmental body established by the United Nations

CaRROT – Guidelines and Opportunities 43
Panel on Climate
Change (IPCC):
Environment Programme (UNEP) and the World Meteorological
Organisation (WMO) to provide assessments of the results of
climate change research to policy makers. The Greenhouse Gas
Inventory Guidelines are being developed under the auspices of the
IPCC and will be recommended for use by parties to the Framework
Convention on Climate Change.
Indirect emissions:
Emissions that are a consequence of the activities of the reporting
company but occur from sources owned or controlled by another
organisation or individual. They include all outsourced power
generation (e.g. electricity, hot water), outsourced services (e.g.
waste disposal, business travel, transport of company-owned goods)
and outsourced manufacturing processes. Indirect emissions also
cover the activities of franchised companies and the emissions
associated with downstream and/or upstream manufacture,
transport and disposal of products used by the organisation, referred
to as product life-cycle emissions.
Kyoto Protocol:
The Kyoto Protocol originated at the 3rd Conference of the Parties
(COP) to the United Nations Convention on Climate Change held in
Kyoto, Japan in December 1997. It specifies the level of emission
reductions, deadlines and methodologies that signatory countries
(i.e. countries who have signed the Kyoto Protocol) are to achieve.

CaRROT – Guidelines and Opportunities 44
Annex II – Guidelines on the CaRROT
WORK
SHEET TOOLKIT SECTION DESCRIPTION
The links of the left-hand side and bottom of the toolkit will allow access to the various
worksheets of the toolkit.
Users should note that parts 4 (Water), 5 (Energy) and 6 (Greenhouse Gas Emissions)
have separate instructions to assist with data entry.
1 Welcome Page At the onset, the toolkit provides the project rationale
and background information. It also provides the
instructions related to licensing, ownership and
disclaimers.
2 Introduction This section provides an overview of the toolkit’s
contents in order of worksheet, including the general
assumptions and specific instructions required to
complete the toolkit.
3 Company Details The individual company is requested to insert some
general company details. This will assist Kenya Flower
Council (KFC) within compiling the sectoral baseline
proposed in the recommendations.
4 Water The individual company is requested to provide
agricultural and non-agricultural production water usage.
Data should be input per period, in line with data
submitted to KFC and More Profitable Sustainability
(MPS). There shall be a total of 13 periods per annum.
Each period consists of a maximum of 28 calendar days.
The company is requested to provide accurate and
complete data.
5 Energy The individual company is requested to provide data
related to grid and/or off-grid energy, diesel
consumption, petroleum consumption and kerosene
consumption. Data should be input per period, in line
with data submitted to KFC and MPS. There shall be a
total of 13 periods per annum. Each period consists of a
maximum of 28 calendar days. The company is
requested to provide accurate and complete data.
6 Greenhouse Gases
(GHG)
The individual company is requested to provide data
related to fertilizers used, grid electricity usage, diesel
consumption, petroleum consumption and kerosene
consumption. Data should be input per period, in line

CaRROT – Guidelines and Opportunities 45
WORK
SHEET TOOLKIT SECTION DESCRIPTION
with data submitted to KFC and MPS. There shall be a
total of 13 periods per annum. Each period consists of a
maximum of 28 calendar days. The company is
requested to provide accurate and complete data.
7 Results Dashboard This section provides a detailed summary of results
generated from inputted data. It is tabulated, as well as
presented in a graph format.
Worksheet 1 and 2 provide an overview of the project and the contents of the toolkit. The User is only requires to input data from Worksheet 3. Below are some screenshots of worksheets 3 to 7.
Screenshot of Worksheet 3

CaRROT – Guidelines and Opportunities 46
Screenshot of Worksheets 4
Screenshot of Worksheets 5
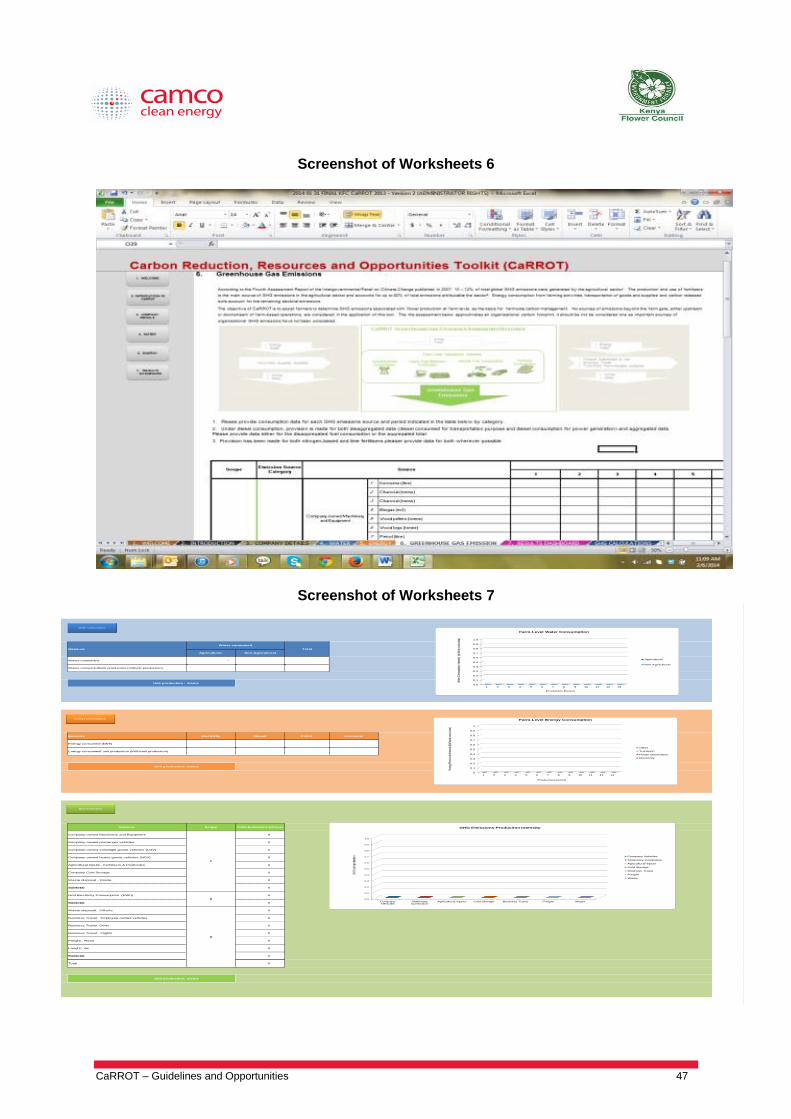
CaRROT – Guidelines and Opportunities 47
Screenshot of Worksheets 6
Screenshot of Worksheets 7
Agricultural Non-Agricultural
Water consumed - - -
Water consumed/unit production (m3/unit production) #DIV/0! #DIV/0! #DIV/0!
Unit production : stems
Measure Electricity Diesel Petrol Kerosene
Energy consumed (kWh) - - - -
Energy consumed/ unit production (kWh/unit production) #DIV/0! #DIV/0! #DIV/0! #DIV/0!
Unit production: stems
Sources Scope Total Emissions (tCO2e)
Company-owned Machinery and Equipment 0
Company-owned passenger vehicles 0
Company-owned vans/light goods vehicles (LGV) 0
Company-owned heavy goods vehicles (HGV) 0
Agricultural Inputs: Fertilisers & Pesticides 0
Company Cold Storage 0
Waste disposal - Onsite 0
Subtotal 0
Grid Electricity Consumption (KWh) 0
Subtotal 0
Waste disposal: Off-site 0
Business Travel: Employee-owned vehicles 0
Business Travel: Other 0
Business Travel: Flights 0
Freight: Road 0
Freight: Air 0
Subtotal 0
Total 0
Unit production: stems
Total
3
Measure
Water consumed
1
2
Water Consumption
Energy Consumption
GHG Emissions
0.0
0.1
0.2
0.3
0.4
0.5
0.6
0.7
0.8
0.9
1.0
CompanyVehicles
StationaryCombution
Agricultural Inputs Cold Storage Business Travel Freight Waste
tCO2 e/u
nit pr
oduc
tion
GHG Emissions Produciton Intensity
Company Vehicles
Stationary Combution
Agricultural Inputs
Cold Storage
Business Travel
Freight
Waste
0.0
0.1
0.2
0.3
0.4
0.5
0.6
0.7
0.8
0.9
1.0
1 2 3 4 5 6 7 8 9 10 11 12 13
Wate
r Con
sump
tion
Inten
sity
(m3/u
nit pr
oduc
tion )
Production Period
Farm-Level Water Consumption
Agricultural
Non-Agricultural
0
0.1
0.2
0.3
0.4
0.5
0.6
0.7
0.8
0.9
1
1 2 3 4 5 6 7 8 9 10 11 12 13
Ener
gy P
rodu
ction
Inten
sity (
kWh/u
nit p
rodu
ction
)
Production period
Farm-Level Energy Consumption
Other
Transport
Power Generation
Electricity

CaRROT – Guidelines and Opportunities 48
Annex III – Summary of National, Regional and International Financing Mechanisms
No. Fund Funder Description Sector Eligibility Criterion
NATIONAL
1. National Climate Fund Government of Kenya
The recommendations of sub-component 8 (Finance) of Kenya’s National Climate Change Action Plan (NCCAP), the proposed National Climate Fund (NCF) is defined as “a mechanism that supports countries to direct finance toward climate change projects and programmes by facilitating the collection, blending, coordination of, and accounting for climate finance.
Cross-sector
It is unclear how businesses will be able to apply, as the fund is still being established
2. Climate Change Adaptation Fund
UNFCCC (administered by NEMA)
The fund provides a unique monetary disbursement process which promotes direct access to funds intended to finance full costs of adaptation. The core objective is to assist developing countries, such as Kenya, that are vulnerable to the adverse effects of climate change in an effort to reduce negative impacts facing communities, countries and sectors.
Cross-sector
It is unclear how businesses will be able to apply, as the fund is still being established
3. Fast Start Climate Danida As part of this climate change Cross sector Supports private sector

CaRROT – Guidelines and Opportunities 49
No. Fund Funder Description Sector Eligibility Criterion
Change Programme package, Kenya became the first African country to receive funding as bilateral support from Denmark. The programme emphasises the role of the private sector and communities in facilitating the use of innovative technology to reduce climate change vulnerability and contribute to a low carbon development path.30
Water management
Other natural resource management areas
development and innovation
4. Business Advocacy Fund Danida, DFID The fund is able to provide capacity building, mentoring and grants to support dialogue and advocacy projects.
Cross sector Supports business member organisations, trade unions and CSOs
5. Climate Innovation Centre (CIC), Kenya
World Bank, DFID The centre provides an integrated set of services, activities and programmes that empowers Kenyan entrepreneurs to deliver innovative climate technology solutions
Water management
Agribusiness
Renewable energy
Supports entrepreneurs developing innovative renewable energy, water and agriculture technologies
REGIONAL
1. Africa Enterprise Challenge Fund (AECF)31
AusAid, Danida, DFID, IFAD, NMFA, Sida (hosted by the Alliance for a
Africa Enterprise Challenge Fund provides grants and interest free loans to businesses who wish to implement innovative, commercial viable, high impact projects in
Agriculture
Financial services,
Renewable energy
Technologies
Supports private sector companies to compete for investment support for their new and innovative business
30
http://kenya.um.dk/en/danida-en/nrm/climate-change/fast-start-climate-change-pilot-projects/ 31
http://www.aecfafrica.org/

CaRROT – Guidelines and Opportunities 50
No. Fund Funder Description Sector Eligibility Criterion
Green Revolution in Africa)
Africa.
ideas
2. Africa Carbon Asset Development (ACAD)
UNEP, Standard Bank and the German Federal Environment Ministry
This public-private partnership to support carbon project development on increasing deal-flow in Africa. The carbon market is a promising mechanism to stimulate green industries and a low-carbon economy in Africa.
Cross sector Supports private sector through the prvision of seed funding and advises on how to generate carbon credits
3. East African Community - Climate Change Fund
East Africa Community (EAC)
The EAC Climate Change Master Plan (EACCMP) is focused on providing a comprehensive framework for climate change adaptation and mitigation initiatives, in line with the EAC climate change agenda and international climate change debates. A joint fund shall be established to combat the effects of the climate change in the region
Cross sector
Transboundary issues
Need to be part of the EAC
It is unclear how businesses will be able to apply, as the fund is still being established
INTERNATIONAL
1. Clean Development Mechanism and PoA32
UNFCCC coordinated carbon markets
Energy efficiency
Renewable energy
Construction
Transportation
Mining and extractive industries
Chemicals production
Applicable under an existing UNFCCC approved methodology
Demonstrate additionality
32
UNFCCC - CDM
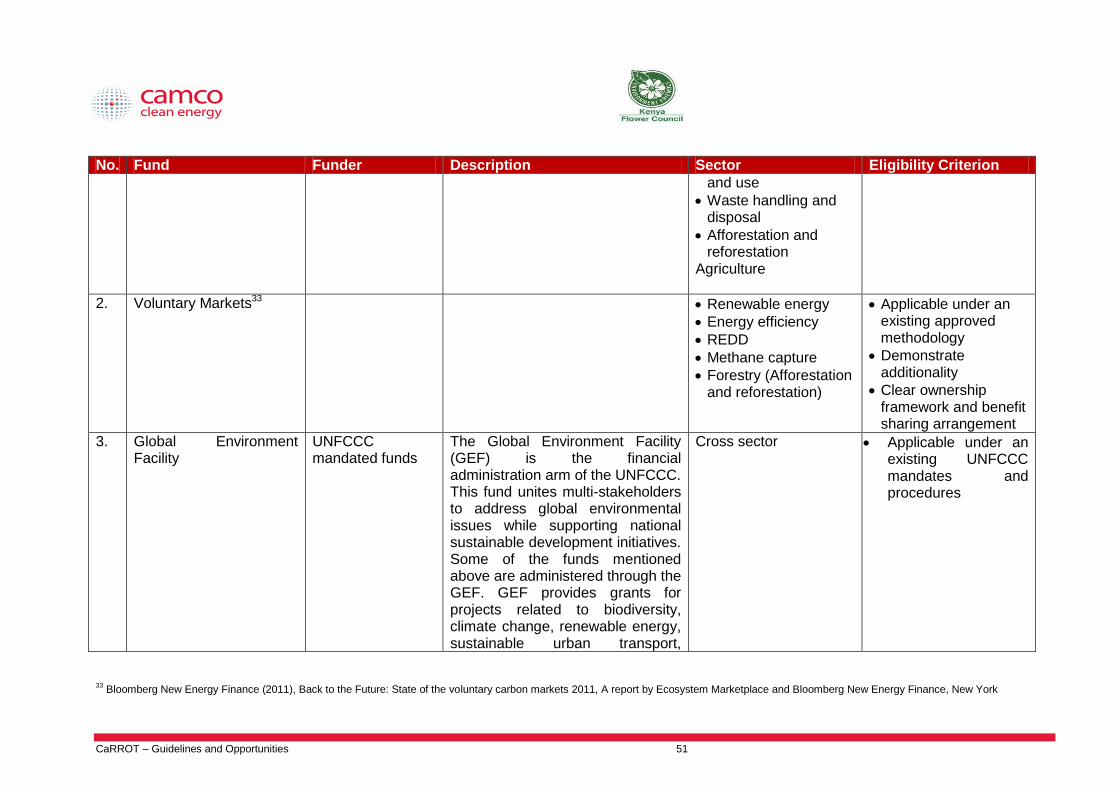
CaRROT – Guidelines and Opportunities 51
No. Fund Funder Description Sector Eligibility Criterion
and use
Waste handling and disposal
Afforestation and reforestation
Agriculture
2. Voluntary Markets33 Renewable energy
Energy efficiency
REDD
Methane capture
Forestry (Afforestation and reforestation)
Applicable under an existing approved methodology
Demonstrate additionality
Clear ownership framework and benefit sharing arrangement
3. Global Environment Facility
UNFCCC mandated funds
The Global Environment Facility (GEF) is the financial administration arm of the UNFCCC. This fund unites multi-stakeholders to address global environmental issues while supporting national sustainable development initiatives. Some of the funds mentioned above are administered through the GEF. GEF provides grants for projects related to biodiversity, climate change, renewable energy, sustainable urban transport,
Cross sector Applicable under an existing UNFCCC mandates and procedures
33
Bloomberg New Energy Finance (2011), Back to the Future: State of the voluntary carbon markets 2011, A report by Ecosystem Marketplace and Bloomberg New Energy Finance, New York

CaRROT – Guidelines and Opportunities 52
No. Fund Funder Description Sector Eligibility Criterion
international waters, land degradation, sustainable management of land use, land-use change, and forestry, the ozone layer, and persistent organic pollutants.
4. Special Climate Change Fund (SCCF)
This fund finances projects relating to adaptation, technology transfer and capacity building, energy, transport, industry, agriculture, forestry and waste management, and economic diversification. The bulk of financing is based on adaptation activities. The SCCF helps developing countries increase their national development sectors’ resilience to impacts of climate change. SCCF activities are based primarily on NAPAs (in LDCs) or national communications (reports by non-Annex I countries summarizing a country’s mitigation and adaptation needs).
5. Green Climate Fund (GCF)
The purpose of this fund is to make a significant and ambitious contribution to the global efforts towards attaining the goals set by the international community to combat climate change. The fund aims to assist developing countries

CaRROT – Guidelines and Opportunities 53
No. Fund Funder Description Sector Eligibility Criterion
in their efforts to combat climate change through the provision of grants and other concessional financing for mitigation and adaptation projects, programs, policies, and activities.
6. Adaptation Fund The adaptation fund finances projects and programmes to help developing countries adapt to the negative effects of climate change. The Adaptation Fund was established to finance concrete adaptation projects and programmes in developing countries that are particularly vulnerable to the adverse effects of climate change. The Adaptation Fund is financed from the share of proceeds on the CDM project activities and other sources of funding.
CaRROT – Guidelines and Opportunities 54
The correct citation for this report is: Camco Advisory Services (K) Ltd. 2014. “Carbon Reduction, Resources and Opportunities Toolkit (CaRROT): Guidelines and Opportunities”. Prepared by Camco in conjunction with Kenya Flower Council for the CDKN funded project on the developing a Carbon Reduction, Resources and Opportunities Toolkit (CaRROT) for Kenya’s Flower Sector. January 2014.