the case for investing in europe 2016 - amcham eu | …€¦ · the case for investing in europe...
TRANSCRIPT

The Case for Investing in Europe 2016
Why U.S. firms should stay the course
Joseph P. Quinlan
2 The Case for Investing in Europe 2016
I would like to thank AmCham EU for spearheading this project and for their input and insight in putting together this report. I also want to thank the companies that provided case studies for this report—their input helps to bring to life what statistics cannot. The views expressed here are my own, and do not necessarily represent those of AmCham EU.
Joseph P. QuinlanTransatlantic Fellow at the Center for Transatlantic Relations, Johns Hopkins, and the German Marshall Fund, Washington, DC.
Executive Summary
The transatlantic partnership remains critical to the long-term health of the global economy. In a world in perpetual change, one truss of continuity remains the deep integration of the United States and Europe. It is Europe’s size and wealth, depth in human capital, and respect for the rule of law, among other attributes, that makes the region a natural partner of the United States.
The post-war economic integration of the EU is one of the greatest triumphs of the past sixty-five years. At the core of Europe’s peace, reconciliation and prosperity is the fact that no other region of the world has successfully integrated and grown as a single entity like the EU over the past half century.
Notwithstanding some formidable challenges, Europe still remains among the most attractive long-term
places in the world for business.
The Case for Investing in Europe 2016
Acknowledgements
3The Case for Investing in Europe 2016
Why Europe still matters
Alongside the United States and China, the European Union is one of the largest economic entities in the world—a
fact often overlooked or ignored by the common consensus. The sum of Europe’s parts is economically massive.
• Europe continues to attract more than half of U.S. aggregate foreign direct investment (FDI) outflows. The region’s share of U.S. FDI has averaged nearly 60% of the total this decade, up slightly from previous periods.
• Economic growth in Europe is on the rebound. Real economic activity is accelerating thanks to the ECB’s more accommodating monetary policies, lower oil prices, and the weaker Euro. All three variables should help produce growth of 1.5-2% in the European Union this year, one of the strongest levels in years.
• In 2015, U.S. affiliate income in Europe fell by 3.7%, to $231 billion. That is off a record high reached in 2014 and comes against a very challenging backdrop in Europe. The latter still accounts for the bulk of U.S. global foreign affiliate income.
• The long-term rise in U.S. foreign affiliate earnings in Europe has underpinned more output and employment in Europe, more R&D expenditures across the continent, and more bi-lateral trade not only between Europe and the U.S. but also between Europe and many other parts of the world. U.S. foreign affiliates in Europe have long been agents of growth in virtually every country they have operated in.
• The more profitable U.S. affiliates are in Europe, the more earnings are available to the parent firm to hire and invest at home, dole out higher wages to U.S. workers, and /or increase dividends to U.S. shareholders. U.S. corporate success in Europe is hugely important to the overall and long-term success of many U.S. multinationals, and by extension, the U.S. economy.
What’s right with Europe
Europe is on the economic mend—real growth in Europe is accelerating and expected to average 1.5-2% over
the near term.
Europe is not only among the largest economic entities in the world, it is also among the wealthiest. It is
Europe’s size and wealth that sets the region apart from many other parts of the world, the United States
included. On a per capita basis, Europe is home to some of the wealthiest nations in the world.
• In the 2016 Ease of Doing Business rankings, 14 European economies ranked among the top 25 most business-friendly countries. Denmark ranked 3rd overall, followed by the United Kingdom (6th), Sweden (8th), Norway (9th), Finland (10th), Germany (15th), Estonia (16th), Ireland (17th), Iceland (19th), Lithuania (20th), Austria (21st), Latvia (22nd), Portugal (23rd), and Poland (25th).
Quinlan, Joseph P., The Case for Investing in Europe 2016, Why U.S. firms should stay the course
Editor and Project Manager Marykate Collins, Communications Officer, AmCham EU
New York: 2016 © Quinlan, Joseph, P.
AmCham EU53 Avenue des Arts1000 BruxellesBelgium
T: +32 513 68 92E: [email protected] www.amchameu.eu
4 The Case for Investing in Europe 2016
• European economies remain among the most competitive in the world. For instance, in the latest rankings of global competitiveness from the World Economic Forum, six European countries were ranked among the top 10, and seven more among the top twenty-five. Switzerland ranked first, Germany 4th, the Netherlands 5th, Finland 8th, Sweden 9th and the United Kingdom 10th. Meanwhile, Norway ranked 11th, Denmark ranked 12th, Belgium 19th, Luxembourg 20th, France 22nd , Austria 23rd, and Ireland 24th.
Europe’s periphery remains attractive
Roughly 11% of corporate America’s European workforce is now based in central and eastern Europe,
up from virtually zero two decades ago. Affiliate employment in central and eastern Europe expanded at
an average annual pace of 8.7% between 1999-2014 versus a comparable 0.8% rate in western Europe.
Reflecting many variables—greater employment, rising incomes, and most of all, pent up demand for
western goods after decades of denial—personal consumption in central and eastern Europe doubled
between 1990 and 2005 and then nearly doubled again by 2012, when expenditures totaled an impressive
$2.6 trillion. In 2013, consumption hit a peak of $2.8 trillion before sliding modestly in 2014 and 2015 as
recessionary forces mounted in Russia and parts of the Middle East.
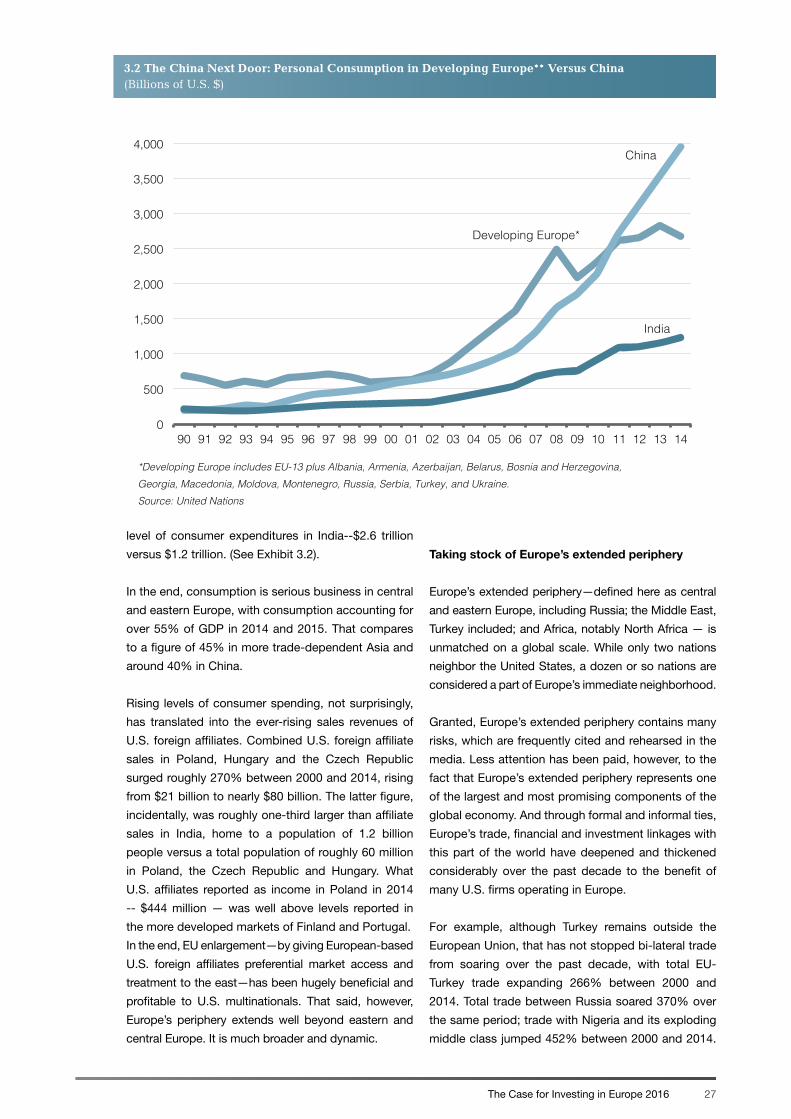
• The consumers in developing Europe, while not as robust as consumers in China, easily outspend consumers in India. Consumer spending in China (roughly $4 trillion in 2014) was greater than the combined personal consumption expenditures in developing Europe (Russia included). Spending in the latter, however, was nearly triple the level of consumer expenditures in India--$2.6 trillion versus $1.2 trillion.
• Europe’s periphery consumed more than $3 trillion in goods imports in 2013—a figure greater than imports of China and a figure larger than the world’s top importer of goods, the United States.
• U.S. firms “inside” the European Union have been a part of the surge in trade between developed Europe and its extended periphery.
TTIP: A potential global game changer
The Transatlantic Trade and Investment Partnership (TTIP) currently under negotiation by the United States
and the EU promises to unleash significant opportunities to generate jobs, trade and investment across
the Atlantic.
A transatlantic free trade pact would not only be about reducing tariffs. It would also be about reducing
non-tariff barriers and harmonizing the web of regulatory standards that inhibit transatlantic trade and
investment flows and add to the cost of doing business on both sides of the ocean. A deal would be a
win-win for both parties, with large transatlantic firms, as well as medium- and small-sized firms reaping
benefits.
• A free trade deal would help create jobs and income on both sides of the pond, and spur more cross-border trade and investment in goods and services. The more far-reaching the agreement, the greater the impact on key sectors of the transatlantic economy, notably in services where there is plenty of scope for further integration.
• A transatlantic free trade agreement would serve notice to the developing nations that the world’s two largest economies can still work together, and when they do, they still have a great deal of global economic leverage over most, in not all, developing nations.

Why Europe still matters
Chapter 1
6 The Case for Investing in Europe 2016
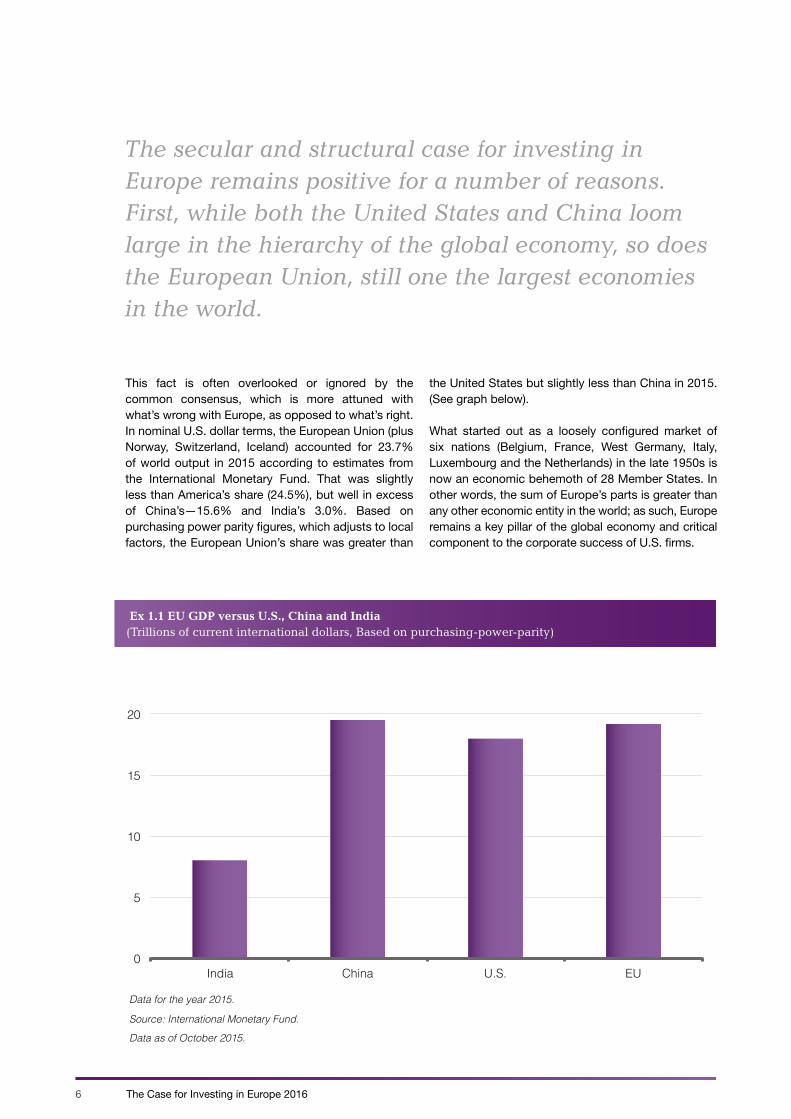
The secular and structural case for investing in Europe remains positive for a number of reasons. First, while both the United States and China loom large in the hierarchy of the global economy, so does the European Union, still one the largest economies in the world.
Ex 1.1 EU GDP versus U.S., China and India(Trillions of current international dollars, Based on purchasing-power-parity)
0
5
10
15
20
25
India China U.S. EU
Data for the year 2015.
Source: International Monetary Fund.
Data as of October 2015.
This fact is often overlooked or ignored by the common consensus, which is more attuned with what’s wrong with Europe, as opposed to what’s right. In nominal U.S. dollar terms, the European Union (plus Norway, Switzerland, Iceland) accounted for 23.7% of world output in 2015 according to estimates from the International Monetary Fund. That was slightly less than America’s share (24.5%), but well in excess of China’s—15.6% and India’s 3.0%. Based on purchasing power parity figures, which adjusts to local factors, the European Union’s share was greater than
the United States but slightly less than China in 2015. (See graph below).
What started out as a loosely configured market of six nations (Belgium, France, West Germany, Italy, Luxembourg and the Netherlands) in the late 1950s is now an economic behemoth of 28 Member States. In other words, the sum of Europe’s parts is greater than any other economic entity in the world; as such, Europe remains a key pillar of the global economy and critical component to the corporate success of U.S. firms.
7The Case for Investing in Europe 2016
All Countries EuropeEurope as a % of World
1950-1959 20,363 3,997 19.6%
1960-1969 40,634 16,220 39.9%
1970-1979 122,721 57,937 47.2%
1980-1989 171,880 94,743 55.1%
1990-1999 869,489 465,336 53.5%
2000-2009 2,056,009 1,149,810 55.9%
2010-2015 1,916,989 1,097,977 57.3%
Source: Bureau of Economic Analysis
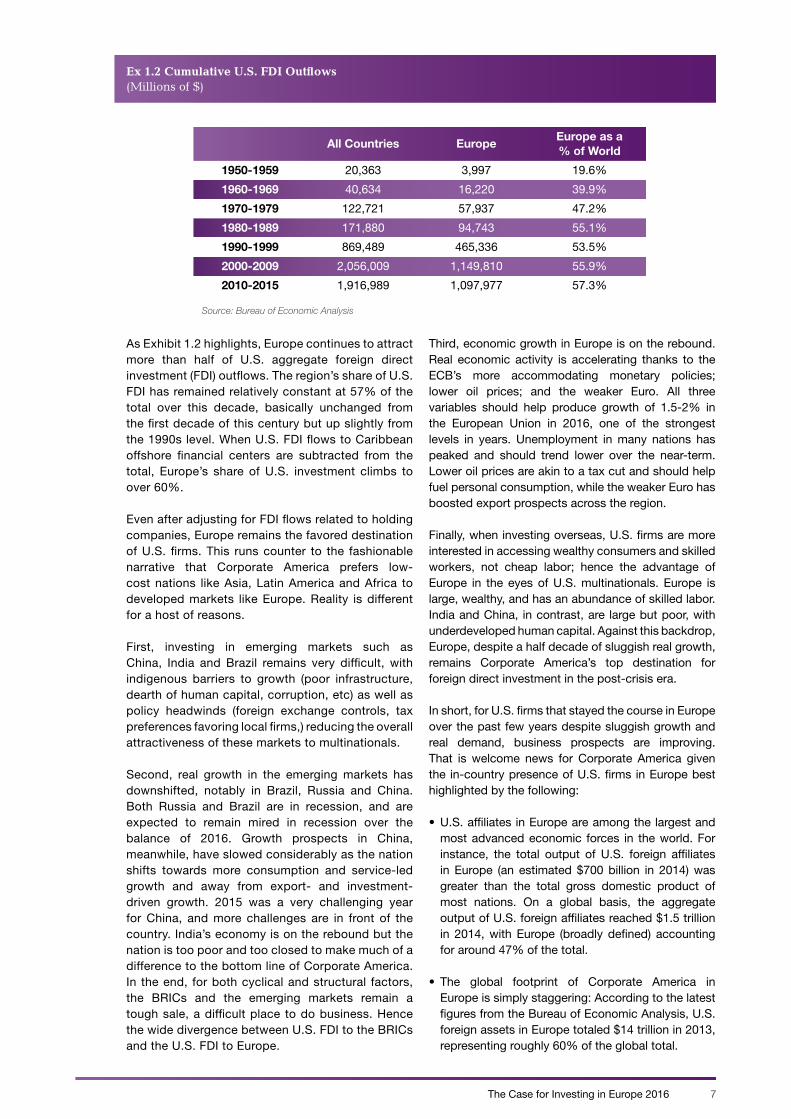
Ex 1.2 Cumulative U.S. FDI Outflows(Millions of $)
As Exhibit 1.2 highlights, Europe continues to attract more than half of U.S. aggregate foreign direct investment (FDI) outflows. The region’s share of U.S. FDI has remained relatively constant at 57% of the total over this decade, basically unchanged from the first decade of this century but up slightly from the 1990s level. When U.S. FDI flows to Caribbean offshore financial centers are subtracted from the total, Europe’s share of U.S. investment climbs to over 60%.
Even after adjusting for FDI flows related to holding companies, Europe remains the favored destination of U.S. firms. This runs counter to the fashionable narrative that Corporate America prefers low-cost nations like Asia, Latin America and Africa to developed markets like Europe. Reality is different for a host of reasons.
First, investing in emerging markets such as China, India and Brazil remains very difficult, with indigenous barriers to growth (poor infrastructure, dearth of human capital, corruption, etc) as well as policy headwinds (foreign exchange controls, tax preferences favoring local firms,) reducing the overall attractiveness of these markets to multinationals.
Second, real growth in the emerging markets has downshifted, notably in Brazil, Russia and China. Both Russia and Brazil are in recession, and are expected to remain mired in recession over the balance of 2016. Growth prospects in China, meanwhile, have slowed considerably as the nation shifts towards more consumption and service-led growth and away from export- and investment-driven growth. 2015 was a very challenging year for China, and more challenges are in front of the country. India’s economy is on the rebound but the nation is too poor and too closed to make much of a difference to the bottom line of Corporate America. In the end, for both cyclical and structural factors, the BRICs and the emerging markets remain a tough sale, a difficult place to do business. Hence the wide divergence between U.S. FDI to the BRICs and the U.S. FDI to Europe.
Third, economic growth in Europe is on the rebound. Real economic activity is accelerating thanks to the ECB’s more accommodating monetary policies; lower oil prices; and the weaker Euro. All three variables should help produce growth of 1.5-2% in the European Union in 2016, one of the strongest levels in years. Unemployment in many nations has peaked and should trend lower over the near-term. Lower oil prices are akin to a tax cut and should help fuel personal consumption, while the weaker Euro has boosted export prospects across the region.
Finally, when investing overseas, U.S. firms are more interested in accessing wealthy consumers and skilled workers, not cheap labor; hence the advantage of Europe in the eyes of U.S. multinationals. Europe is large, wealthy, and has an abundance of skilled labor. India and China, in contrast, are large but poor, with underdeveloped human capital. Against this backdrop, Europe, despite a half decade of sluggish real growth, remains Corporate America’s top destination for foreign direct investment in the post-crisis era.
In short, for U.S. firms that stayed the course in Europe over the past few years despite sluggish growth and real demand, business prospects are improving. That is welcome news for Corporate America given the in-country presence of U.S. firms in Europe best highlighted by the following:
• U.S. affiliates in Europe are among the largest and most advanced economic forces in the world. For instance, the total output of U.S. foreign affiliates in Europe (an estimated $700 billion in 2014) was greater than the total gross domestic product of most nations. On a global basis, the aggregate output of U.S. foreign affiliates reached $1.5 trillion in 2014, with Europe (broadly defined) accounting for around 47% of the total.
• The global footprint of Corporate America in Europe is simply staggering: According to the latest figures from the Bureau of Economic Analysis, U.S. foreign assets in Europe totaled $14 trillion in 2013, representing roughly 60% of the global total.
8 The Case for Investing in Europe 2016
• U.S. foreign affiliates are a major source of employment in Europe; indeed, U.S. foreign affiliate employment in Europe has increased steadily over the decade and a half, with affiliate employment in Europe rising from 3.7 million workers in 2000 to 4.2 million workers in 2013, the last year of available data. By our estimates, we forecast that U.S. foreign affiliates in Europe employed 4.3 million workers in 2014. On a global basis, U.S. affiliates (majority- and non-majority-owned) employed roughly 14.5 million workers in 2013, with the bulk of these workers—roughly 35%-- in Europe. Interestingly, U.S. affiliates employed more manufacturing workers in Europe in 2012 (1.8 million) than in 1990 (1.6 million). This reflects EU enlargement process, and hence greater access to more manufacturing workers, and the premium U.S. firms place on highly skilled manufacturing workers, with Europe one of the largest sources in the world.
• In 2013, the last year of available data, U.S. affiliates sunk $29.8 billion on research and development in Europe, up 11.5% from the previous year. On a global basis, Europe accounted for roughly 60% of total U.S. R&D in 2013. R&D expenditures by U.S. affiliates were greatest in Germany ($8.3 billion), the United Kingdom ($5.3 billion), Belgian ($2.6 billion), Switzerland ($3.7 billion), France ($2.4 billion), the Netherlands ($1.5 billion) and Ireland ($1.9 billion). These seven nations accounted for 86% of U.S. global spending on R&D in Europe in 2013.
• U.S. majority-owned foreign affiliate sales on a global basis (goods and services) totaled an estimated $6.3 trillion in 2014, with Europe, per usual, accounting for the bulk of U.S. affiliate sales. We estimate that U.S. foreign affiliate sales in Europe were $2.9 trillion, up 4% from the prior year. U.S. affiliate sales in Europe, by our estimates, amounted to 46% of the global total. Reflecting the primacy of Europe, sales of U.S. affiliates in Europe were almost double the comparable figures for the entire Asian region in 2013, the last year of available data. Affiliate sales in the United Kingdom ($643 billion) were almost double total sales in South America. Sales in Germany ($338 billion) were three-fourths larger than combined sales in Africa and the Middle East. U.S. affiliate sales of $260 billion in China in 2013 were below those in Ireland ($313 billion) and Switzerland ($287 billion).
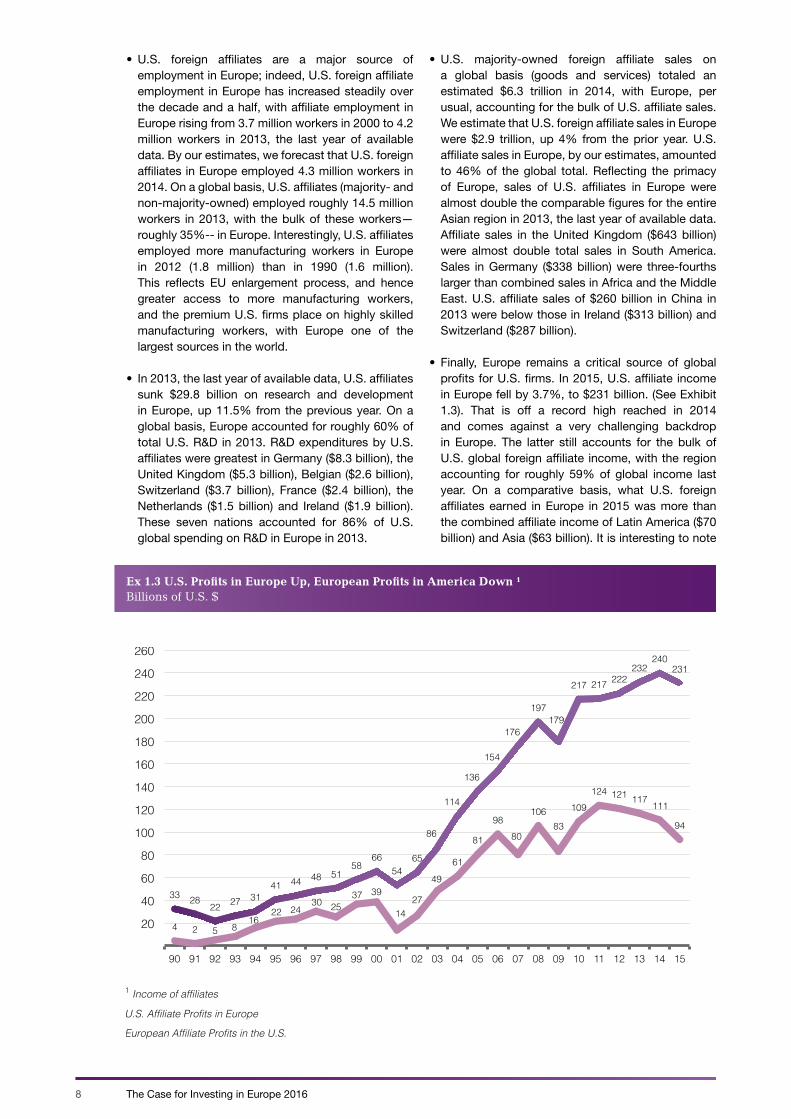
• Finally, Europe remains a critical source of global profits for U.S. firms. In 2015, U.S. affiliate income in Europe fell by 3.7%, to $231 billion. (See Exhibit 1.3). That is off a record high reached in 2014 and comes against a very challenging backdrop in Europe. The latter still accounts for the bulk of U.S. global foreign affiliate income, with the region accounting for roughly 59% of global income last year. On a comparative basis, what U.S. foreign affiliates earned in Europe in 2015 was more than the combined affiliate income of Latin America ($70 billion) and Asia ($63 billion). It is interesting to note
33 28 22 27 31
41 44 48 51 58
66 54
65
86
114
136
154
176
197 179
217 217 222 232
240 231
4 2
30 25 37 39
14 27
49
61
81
98 80
106 83
109 124 121 117 111
94
20
40
60
80
100
120
140
160
180
200
220
240
260
90 91 92 93 94 95 96 97 98 99 00 01 02 03 04 05 06 07 08 09 10 11 12 13 14 15
U.S. Affiliate Profits in Europe
European Affiliate Profits in the U.S.
1 Income of affiliates
24 22 16
8 5
Ex 1.3 U.S. Profits in Europe Up, European Profits in America Down ¹Billions of U.S. $
9The Case for Investing in Europe 2016
that combined U.S. foreign affiliate income earned in China and India in 2013 ($12.5 billion), the last year of full data, was only around 18% of what U.S. affiliates earned/reported in the Netherlands and a fraction of U.S. earnings in such countries as the United Kingdom and Ireland.
In the end, Europe remains hugely important to U.S. multinationals. Corporate America’s bet on Europe has paid handsome dividends. The transatlantic partnership has been beneficial for both parties. When it comes to the bottom line—earnings—both U.S. and European firms, including their workers and shareholders, have prospered from the deepening bonds of the transatlantic economy.
Note that between 1990 and 2000, what U.S. affiliates earned in Europe doubled from $33 billion to $66 billion. The creation of the Single Market in 1992 helped drive this process, as did underlying growth in Europe. The profits picture only improved in the ensuing decade—indeed between 2001 and 2013, U.S. affiliate income (a proxy for global earnings) rose almost $180 billion (or 330%), soaring from $54 billion in 2001, to $231 billion in 2015.
In 2015, European affiliates of U.S. multinationals earned $231 billion, a figure some 3.5 times larger than the level of 2000 ($65.6 billion). Meanwhile, U.S. affiliates of European multinationals recorded a slight decline in earnings in 2015—$17 billion. Yet even with this modest annual decline, what European affiliates earned in the U.S. was nearly 2.5 times larger than earnings in 2000.
Taking the long view, the transatlantic partnership—through thick and thin—continues to yield significant benefits to companies on both sides of the Atlantic. And these benefits, in general, have been spread far and wide. Rising U.S. foreign affiliate earnings in Europe, for instance, have underpinned more output, and employment growth in Europe, more R&D expenditures across the continent, and more bi-lateral trade not only between the U.S. and Europe but also between Europe and many other parts of the world. U.S. foreign affiliates in Europe have long been agents of growth in virtually every country that they have operated in.
Meanwhile, the more profitable U.S. affiliates are in Europe, the more earnings are available to the parent firm to hire and invest at home, dole out higher wages
3M is a global technology company with a significant presence in Europe since the 1920s. In 1951, 3M established its first subsidiaries in Germany, the United Kingdom and France, and today its presence extends to cover 30 countries across Europe, which has turned Europe into its largest operational region outside the US.
3M has a diversified portfolio of science-based innovative and sustainable solutions in healthcare, energy, water, transportation, security and communications. The company serves customers and consumers with a portfolio of more than 50,000 products.
Employing nearly 20,000 people in Europe, 3M continuously builds on and invests in the strengths of its employees. It has more than 50 manufacturing sites, 27 Research & Development centers and 7 Customer Innovations Centers in Europe. Its European-based R&D centers continuously develop new technologies that help address some of Europe’s most important challenges.
3M plans to expand even further, and is set to increase the number of employees in its R&D centers by 20% between 2013 and 2018.
Healthcare is at the heart of 3M. The company has introduced numerous innovations in the field of medical care, ranging from skin protection and surgical equipment to dentistry products and its famous Littmann stethoscope. 3M healthcare technology production and R&D centers are mainly located in Germany.
As a leader in sustainable technologies, 3M is committed to supporting Europe’s fight against climate change. 3M’s 2025 climate and energy goals are fully aligned with those of the European Union.
3M believes in a Europe that attracts investment and promotes industrial competitiveness. As a science and technology company, 3M supports stable and science-based European legislation that stimulates innovation and entrepreneurship. 3M believes that European policymakers need to incentivize business through legislation promoting predictable and favorable investment environments.
The full completion of the European Single Market, including a harmonized digital and energy market, is at the core of making Europe more attractive for new investment and job creation.
Company Case Study: 3M
10 The Case for Investing in Europe 201610
to U.S. workers and/or increase dividends to U.S. shareholders. In other words, U.S. corporate success in Europe is hugely important to the overall and long-term success of many U.S. multinationals, and by extension, the U.S. economy. The more successful U.S. affiliates are in reaching new consumers in Europe and leveraging the continent’s resources, the better off the foreign affiliates, the U.S. parent company, U.S. workers, shareholders and local communities will be.
Being a part of Europe, or being “inside” the European Union means being inside one of the largest economic entities in the world, and having the wherewithal to leverage Europe’s competitive advantages, which can take the form of hiring a life scientist in Ireland, conducting R&D with Swiss scientists, tapping the university talent of Grenoble, France, or participating in numerous government-sponsored R&D projects.
Another reason to be “inside” Europe is to avoid costs associated with various nations import tariffs and non-tariff barriers, all of which add to the cost of doing business and undermine U.S. competitiveness.
Finally, for many U.S. service providers, the very nature of their products—whether a financial firm or a large-scale retailer—mandates that firms operate inside the EU. And given the potential of the massive market for various services in Europe, many U.S. firms are doing just that.
Transatlantic services: The sleeping giant of the transatlantic economy
As we have highlighted in the past, services are the sleeping giant of the transatlantic economy, and a key area offering significant opportunities for stronger and deeper transatlantic linkages. That said, transatlantic ties in services—both in trade and investment—are already quite large. Indeed, the services economies of the U.S. and Europe have become even more intertwined over the past decade, with cross border trade in services and foreign affiliate sales of services continuing to expand in the post-crisis environment. By sectors, transatlantic linkages continue to deepen in insurance, education, telecommunications, transport, utilities, advertising and computer services. Other sectors such as aviation, e-health and e-commerce are slowly being liberalized and deregulated.
On a regional basis, Europe accounted for 37% of total U.S. service exports and for 42% of total U.S. services imports in 2015. Three out of the top ten export markets for U.S. services in 2015 were in Europe (2015 data unavailable for Ireland, Norway, Sweden, Switzerland and Spain at the time of this update). The United Kingdom ranked 1st, followed by Germany (6th), and France (9th). Of the top ten service providers to the U.S. in 2015, four were European states, with the United Kingdom ranked first, Germany second, France seventh and Italy ninth. The U.S. enjoyed a $57.5 billion trade surplus in services with
Europe in 2015, versus a $173 billion trade deficit in goods with Europe.
U.S. services exports to Europe were $264 billion in 2015, down 1% from the peak reached in the prior year, and up nearly 27% from the cyclical lows of 2009, when exports to Europe plunged 9.3%. Service exports (or receipts) have been fueled by a number of service-related activities like travel, passenger fares, education and financial services. In terms of transport services, the top five export markets in 2015, ranking order, were Japan, Canada, the UK, Brazil and China. The United Kingdom ranked as one of the largest markets for exports of insurance services and for exports of financial services. The UK was also the top export market for U.S. trade in intellectual property—or charges or fees for the use of intellectual property rights—as well as the in telecommunications, computer and information services. As for “other business service exports” or activities like management consulting and R&D, the UK ranked number one in 2015, followed by the Netherlands (5th) and Germany (6th).
Beyond services trade, there are the activities of foreign affiliates, with transatlantic foreign affiliate sales of services much deeper and thicker than traditional trade figures suggest. Indeed, sales of affiliates have exploded on both sides of the Atlantic over the past few decades thanks to the falling communication costs and the proliferation of the internet. Affiliate sales of services have not only supplemented trade in services but also become the overwhelming mode of delivery in a rather short period of time. Affiliates sales of U.S. services rose more than 10-fold between 1990 and 2013, exceeding $1 trillion for the first time in 2007. In 2013, the last year of full data, U.S. affiliate services sales ($1.3 trillion) were roughly double the level of U.S. service exports ($688 billion).
Sales of services of U.S. foreign affiliates in Europe have increased each year since plunging in 2009 on account of the transatlantic recession. Sales rose to $649 billion in 2013, up 1.7% from the prior year. U.S. service exports to Europe in the same year totaled $253 billion, well below sales of services by affiliates. In other words, like goods, how U.S. firms deliver services in Europe (and vice versa) is done now primarily by U.S. foreign affiliates. The United Kingdom accounted for just under 30% of all U.S. affiliate sales in Europe; affiliate sales totaled $191 billion, a figure greater than total affiliate sales in Latin America ($167 billion), Africa ($14 billion) and the Middle East ($18 billion). Affiliate sales in Ireland remain quite large—$86 billion—and reflect strong U.S.-Irish foreign investment ties with leading U.S. internet, software and social media leaders. On a global basis, Europe accounted for nearly 50% of total U.S. affiliate service sales.
We estimate that sales of services of U.S. affiliates in Europe rose by around 6%, to $688 billion in 2014. U.S. service exports to Europe for the same year were
11The Case for Investing in Europe 2016
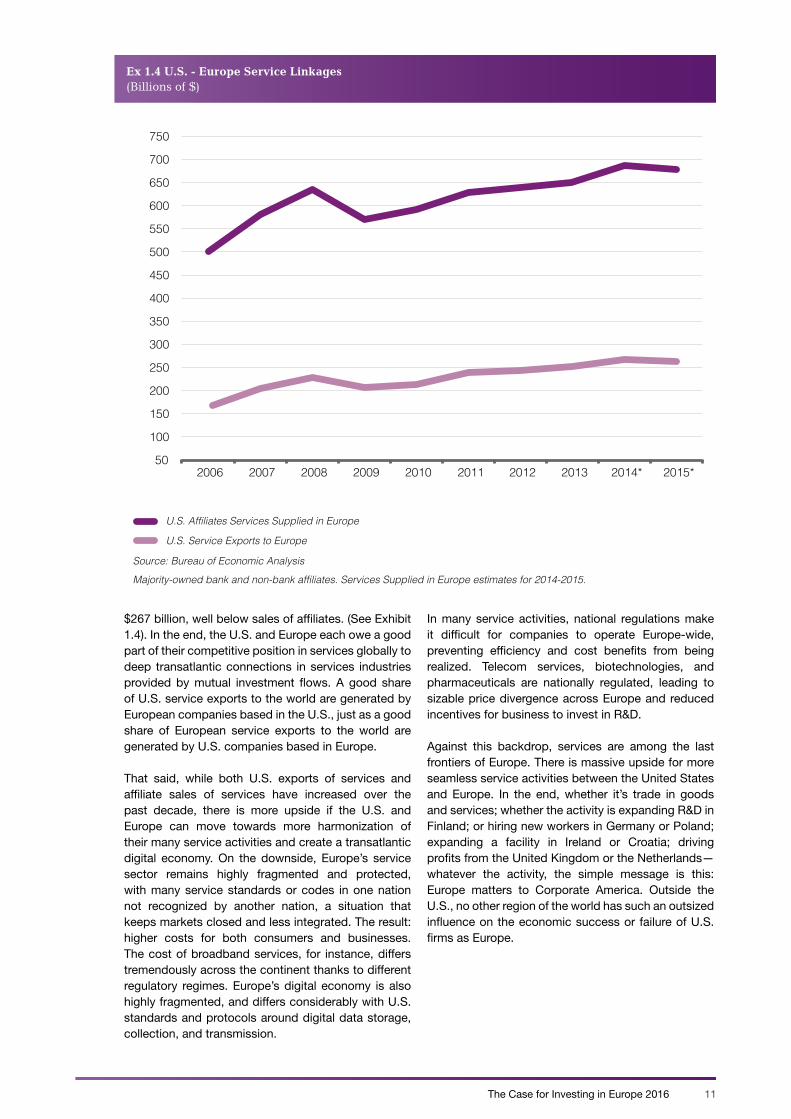
$267 billion, well below sales of affiliates. (See Exhibit 1.4). In the end, the U.S. and Europe each owe a good part of their competitive position in services globally to deep transatlantic connections in services industries provided by mutual investment flows. A good share of U.S. service exports to the world are generated by European companies based in the U.S., just as a good share of European service exports to the world are generated by U.S. companies based in Europe.
That said, while both U.S. exports of services and affiliate sales of services have increased over the past decade, there is more upside if the U.S. and Europe can move towards more harmonization of their many service activities and create a transatlantic digital economy. On the downside, Europe’s service sector remains highly fragmented and protected, with many service standards or codes in one nation not recognized by another nation, a situation that keeps markets closed and less integrated. The result: higher costs for both consumers and businesses. The cost of broadband services, for instance, differs tremendously across the continent thanks to different regulatory regimes. Europe’s digital economy is also highly fragmented, and differs considerably with U.S. standards and protocols around digital data storage, collection, and transmission.
In many service activities, national regulations make it difficult for companies to operate Europe-wide, preventing efficiency and cost benefits from being realized. Telecom services, biotechnologies, and pharmaceuticals are nationally regulated, leading to sizable price divergence across Europe and reduced incentives for business to invest in R&D.
Against this backdrop, services are among the last frontiers of Europe. There is massive upside for more seamless service activities between the United States and Europe. In the end, whether it’s trade in goods and services; whether the activity is expanding R&D in Finland; or hiring new workers in Germany or Poland; expanding a facility in Ireland or Croatia; driving profits from the United Kingdom or the Netherlands—whatever the activity, the simple message is this: Europe matters to Corporate America. Outside the U.S., no other region of the world has such an outsized influence on the economic success or failure of U.S. firms as Europe.
50
100
150
200
250
300
350
400
450
500
550
600
650
700
750
2006 2007 2008 2009 2010 2011 2012 2013 2014* 2015*
U.S. Affiliates Services Supplied in Europe
U.S. Service Exports to Europe
Source: Bureau of Economic Analysis
Majority-owned bank and non-bank affiliates. Services Supplied in Europe estimates for 2014-2015.
Ex 1.4 U.S. - Europe Service Linkages(Billions of $)

12 The Case for Investing in Europe 2016
What’s right with Europe
Chapter 2
13The Case for Investing in Europe 2016 13
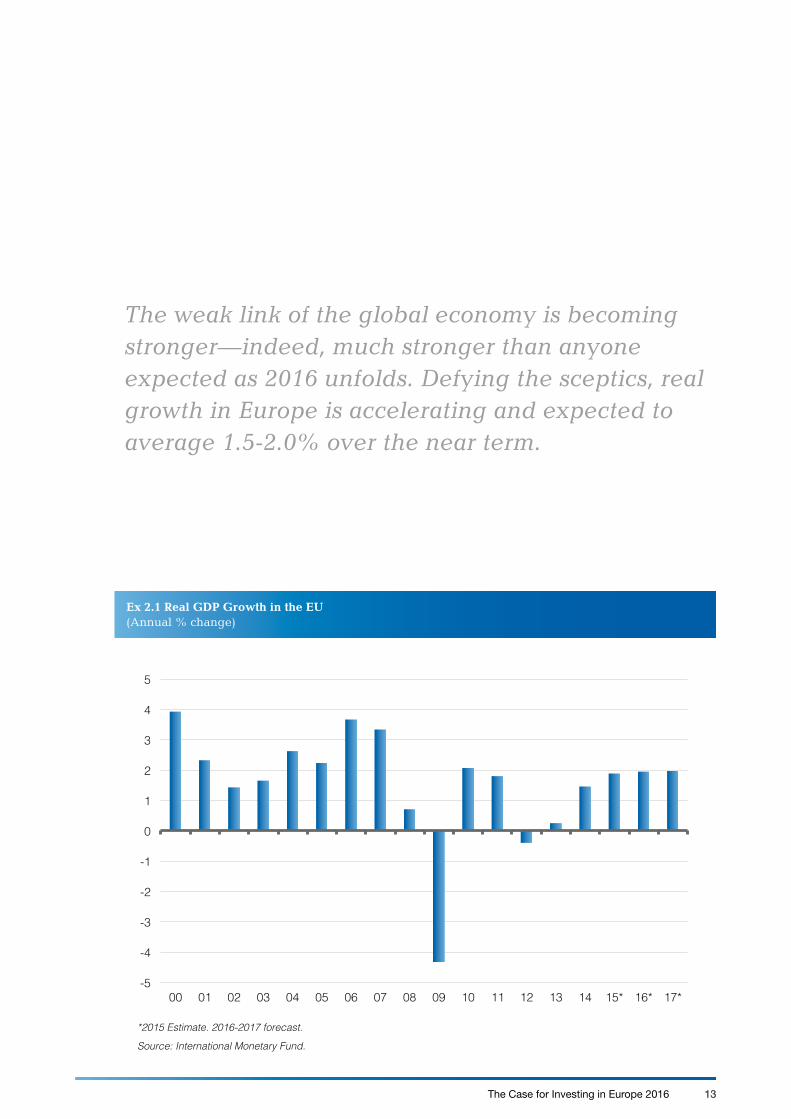
Ex 2.1 Real GDP Growth in the EU(Annual % change)
-5
-4
-3
-2
-1
0
1
2
3
4
5
00 01 02 03 04 05 06 07 08 09 10 11 12 13 14 15* 16* 17*
*2015 Estimate. 2016-2017 forecast.
Source: International Monetary Fund.
The weak link of the global economy is becoming stronger—indeed, much stronger than anyone expected as 2016 unfolds. Defying the sceptics, real growth in Europe is accelerating and expected to average 1.5-2.0% over the near term.
14 The Case for Investing in Europe 2016
The figure on the previous page hardly defines “robust” and in reality the challenges before Europe are substantial. (See Exhibit 2.1). But the cyclical economic rebound will assist in addressing many of these issues, as will the fundamental strengths of Europe—strengths that have been all but forgotten during the past few years of crisis. On balance, there is plenty right with Europe, giving plenty of reasons for U.S. firms to stay the course in Europe.
First, even allowing for the last six years of sluggish real growth, the European Union remains one of the largest economic entities in the world, a point emphasized in Chapter One. By breaking down barriers to trade and investment, by allowing for the free flow of capital and
people, by opting for a Single Market and a single currency in many cases, by embracing these and other strategies/policies over the past few decades—the sum of Europe’s parts are sizable relative to other competing economic entities in the world. No American firm can afford to be missing or absent from a market that is roughly the size of the entire U.S. economy.
Second, in addition to being on the mend and one of the largest economic blocs in the world, Europe is also wealthy, and wealth matters. Wealth is correlated with highly skilled labor, rising per capita’s, innovation, and a world class R&D infrastructure, among other things. In the aggregate, 14 of the 25 wealthiest nations in the world are European. Per capita levels in Europe are
As home to some of the most innovative and exciting brands in the world, Europe is naturally a key market for a technology company like Oracle.
As the adoption of technologies such as cloud computing, a particular strength of Oracle’s, gathers pace across the region and as businesses and governments look to greater insights from the data they create, demand for Oracle’s products and services continues to increase across the region, from established markets such as France, Italy, Germany, Spain and the UK to hotbeds of innovation and skills in Central and Eastern Europe.
Oracle has been growing its presence in Europe for more than 30 years. Today Oracle operates in every EU Member State, with more than 130 locations across more than 30 European countries.
Loïc Le Guisquet, President of Oracle, whose role includes all of Europe, said, ‘This region is attractive for a variety of reasons. Many of the biggest organizations in the world are here. Many are growing their presence in the region and each is at a different stage of their journey to the cloud. This region offers a very attractive mix of businesses for Oracle to work with, ranging from those in more mature markets to those in emerging markets.’
Oracle is also a major employer, with more than 27,000 people working for the company across Europe, Middle East and Africa. And Oracle continues to grow. Just this year Oracle launched a major recruitment drive to bring in 1400 new hires across the region. The majority of those roles will be based in Europe, in the Czech Republic, Ireland, the Netherlands and Spain.
As a global business, Europe’s talented, highly-educated and multilingual skills market has always been a great benefit to Oracle as the business has grown. But the company also invests in helping to develop the skills locally as demand continues to grow.
Along with a number of other large technology companies, Oracle has partnered with the European Commission on the Grand Coalition for Digital Jobs and the company’s not-for-profit Oracle Academy is active across Europe, partnering with educational institutions to help students develop their technical skills in areas such as programming and project management.
As Oracle has focused more on developing cloud-based products and services it has also increased its investment in operating European data centers in countries including the UK and Germany. These not only support jobs but contribute towards an overall increase in the quality of connectivity across Member States, as well as ensuring European businesses have cost-effective and easy access to the most powerful software applications and data services in the world.
This also ensures Oracle can provide services to government and public sector, securing and optimizing citizen data for the provision of quick, lower-cost services.
Europe is one of the most diverse, innovative and exciting markets in the world and Oracle is immensely proud of its success in Europe and of being a major investor in the European workforce, technology industry and skills market.
Company Case Study: Oracle
0 10,000 20,000 30,000 40,000 50,000 60,000 70,000 80,000 90,000
India
China
Brazil
Italy
Germany
Ireland
Sweden
Switzerland
Source: World Bank Data for 2014
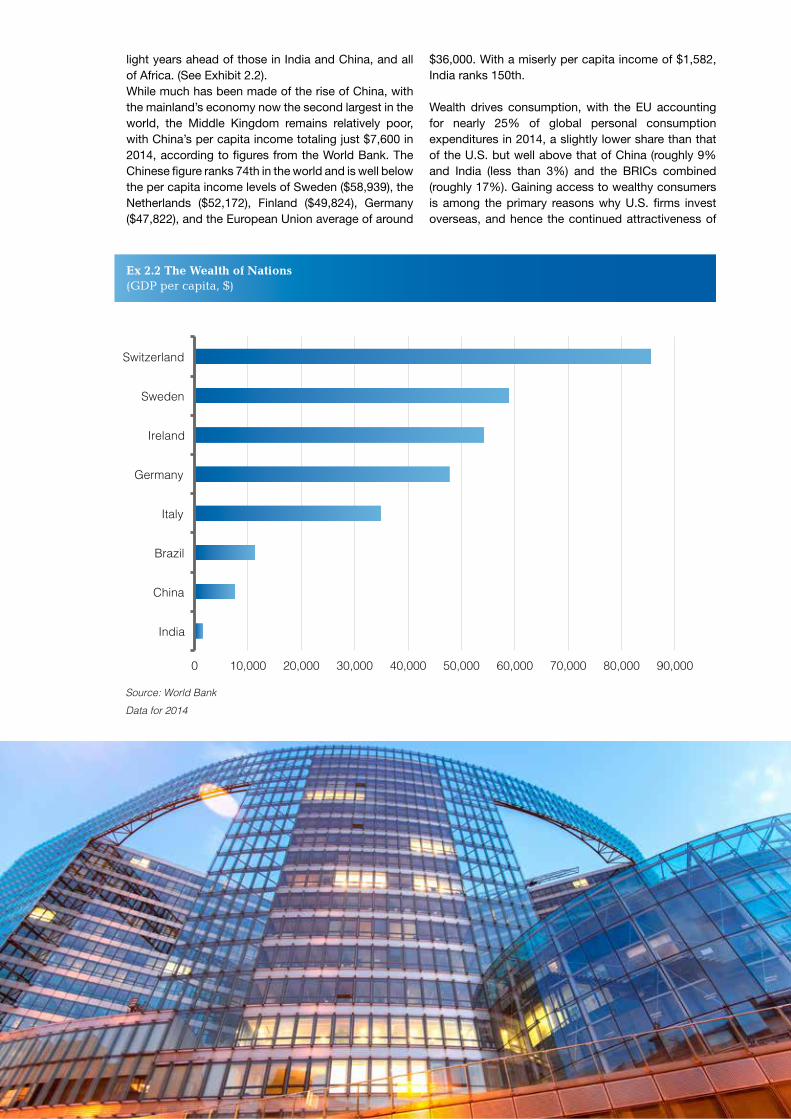
Ex 2.2 The Wealth of Nations (GDP per capita, $)
light years ahead of those in India and China, and all of Africa. (See Exhibit 2.2).While much has been made of the rise of China, with the mainland’s economy now the second largest in the world, the Middle Kingdom remains relatively poor, with China’s per capita income totaling just $7,600 in 2014, according to figures from the World Bank. The Chinese figure ranks 74th in the world and is well below the per capita income levels of Sweden ($58,939), the Netherlands ($52,172), Finland ($49,824), Germany ($47,822), and the European Union average of around
$36,000. With a miserly per capita income of $1,582, India ranks 150th.
Wealth drives consumption, with the EU accounting for nearly 25% of global personal consumption expenditures in 2014, a slightly lower share than that of the U.S. but well above that of China (roughly 9% and India (less than 3%) and the BRICs combined (roughly 17%). Gaining access to wealthy consumers is among the primary reasons why U.S. firms invest overseas, and hence the continued attractiveness of
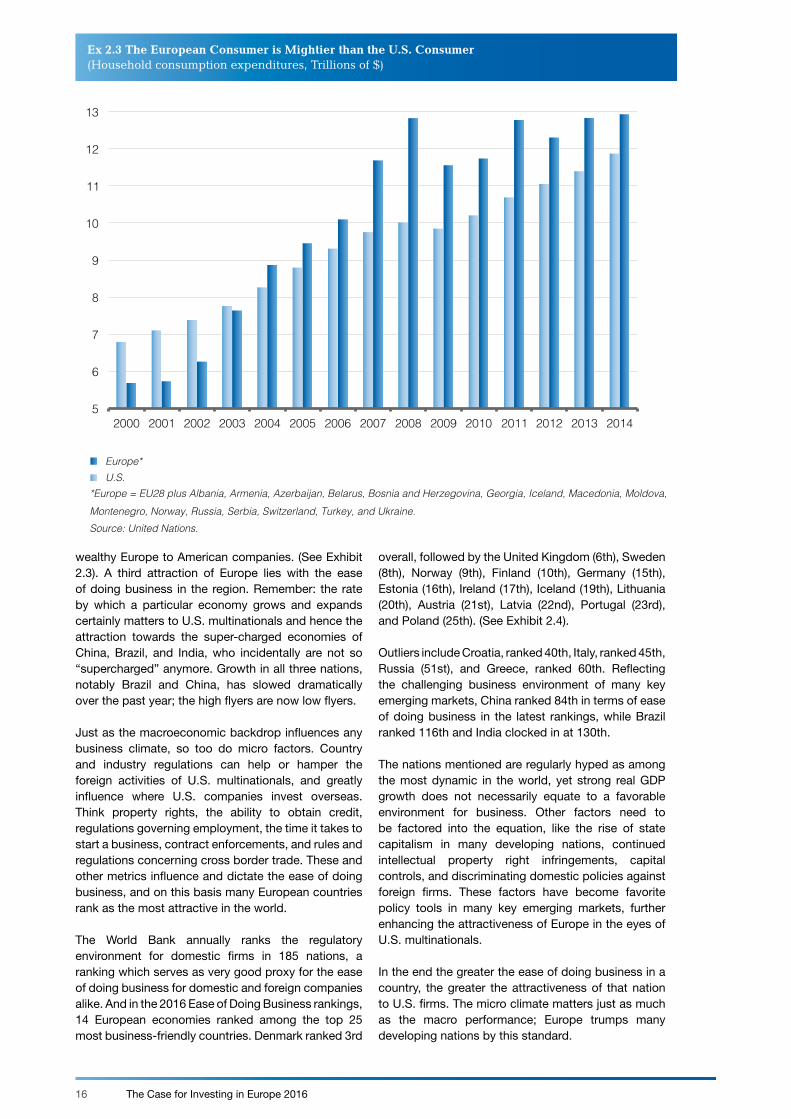
16 The Case for Investing in Europe 2016
wealthy Europe to American companies. (See Exhibit 2.3). A third attraction of Europe lies with the ease of doing business in the region. Remember: the rate by which a particular economy grows and expands certainly matters to U.S. multinationals and hence the attraction towards the super-charged economies of China, Brazil, and India, who incidentally are not so “supercharged” anymore. Growth in all three nations, notably Brazil and China, has slowed dramatically over the past year; the high flyers are now low flyers.
Just as the macroeconomic backdrop influences any business climate, so too do micro factors. Country and industry regulations can help or hamper the foreign activities of U.S. multinationals, and greatly influence where U.S. companies invest overseas. Think property rights, the ability to obtain credit, regulations governing employment, the time it takes to start a business, contract enforcements, and rules and regulations concerning cross border trade. These and other metrics influence and dictate the ease of doing business, and on this basis many European countries rank as the most attractive in the world.
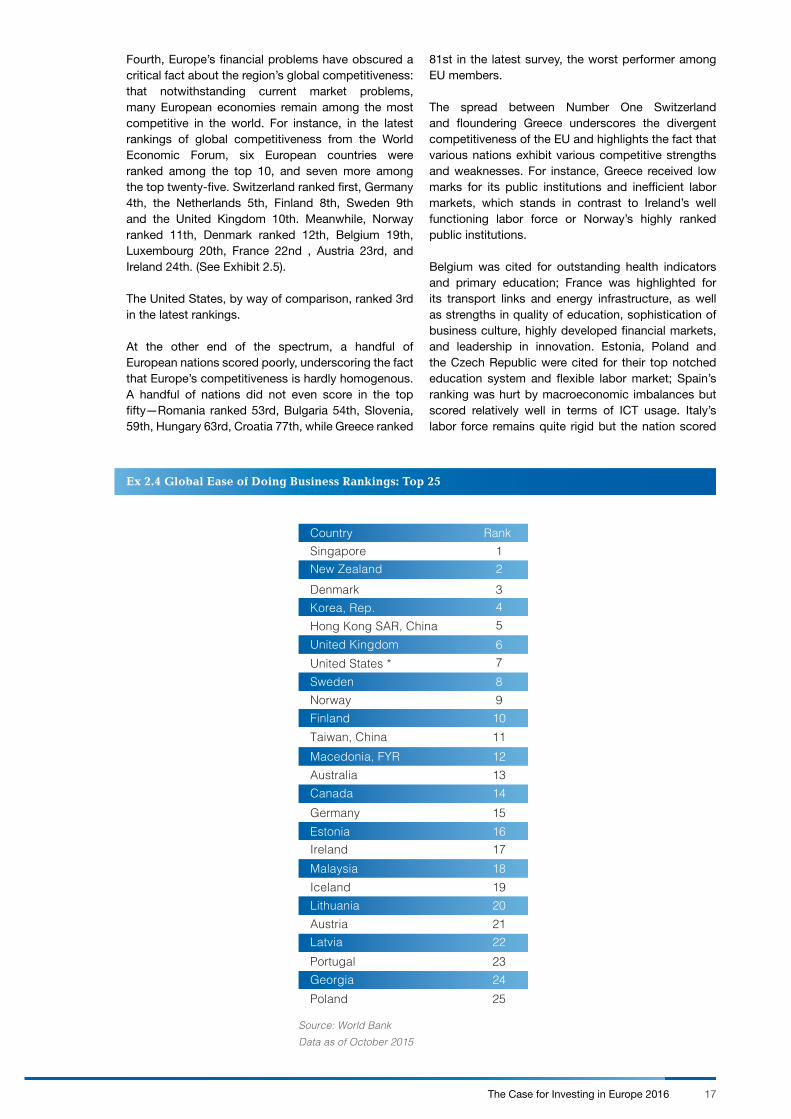
The World Bank annually ranks the regulatory environment for domestic firms in 185 nations, a ranking which serves as very good proxy for the ease of doing business for domestic and foreign companies alike. And in the 2016 Ease of Doing Business rankings, 14 European economies ranked among the top 25 most business-friendly countries. Denmark ranked 3rd
overall, followed by the United Kingdom (6th), Sweden (8th), Norway (9th), Finland (10th), Germany (15th), Estonia (16th), Ireland (17th), Iceland (19th), Lithuania (20th), Austria (21st), Latvia (22nd), Portugal (23rd), and Poland (25th). (See Exhibit 2.4).
Outliers include Croatia, ranked 40th, Italy, ranked 45th, Russia (51st), and Greece, ranked 60th. Reflecting the challenging business environment of many key emerging markets, China ranked 84th in terms of ease of doing business in the latest rankings, while Brazil ranked 116th and India clocked in at 130th.
The nations mentioned are regularly hyped as among the most dynamic in the world, yet strong real GDP growth does not necessarily equate to a favorable environment for business. Other factors need to be factored into the equation, like the rise of state capitalism in many developing nations, continued intellectual property right infringements, capital controls, and discriminating domestic policies against foreign firms. These factors have become favorite policy tools in many key emerging markets, further enhancing the attractiveness of Europe in the eyes of U.S. multinationals.
In the end the greater the ease of doing business in a country, the greater the attractiveness of that nation to U.S. firms. The micro climate matters just as much as the macro performance; Europe trumps many developing nations by this standard.
5
6
7
8
9
10
11
12
13
2000 2001 2002 2003 2004 2005 2006 2007 2008 2009 2010 2011 2012 2013 2014
U.S. Europe*
*Europe = EU28 plus Albania, Armenia, Azerbaijan, Belarus, Bosnia and Herzegovina, Georgia, Iceland, Macedonia, Moldova, Montenegro, Norway, Russia, Serbia, Switzerland, Turkey, and Ukraine. Source: United Nations.
Ex 2.3 The European Consumer is Mightier than the U.S. Consumer (Household consumption expenditures, Trillions of $)
17The Case for Investing in Europe 2016
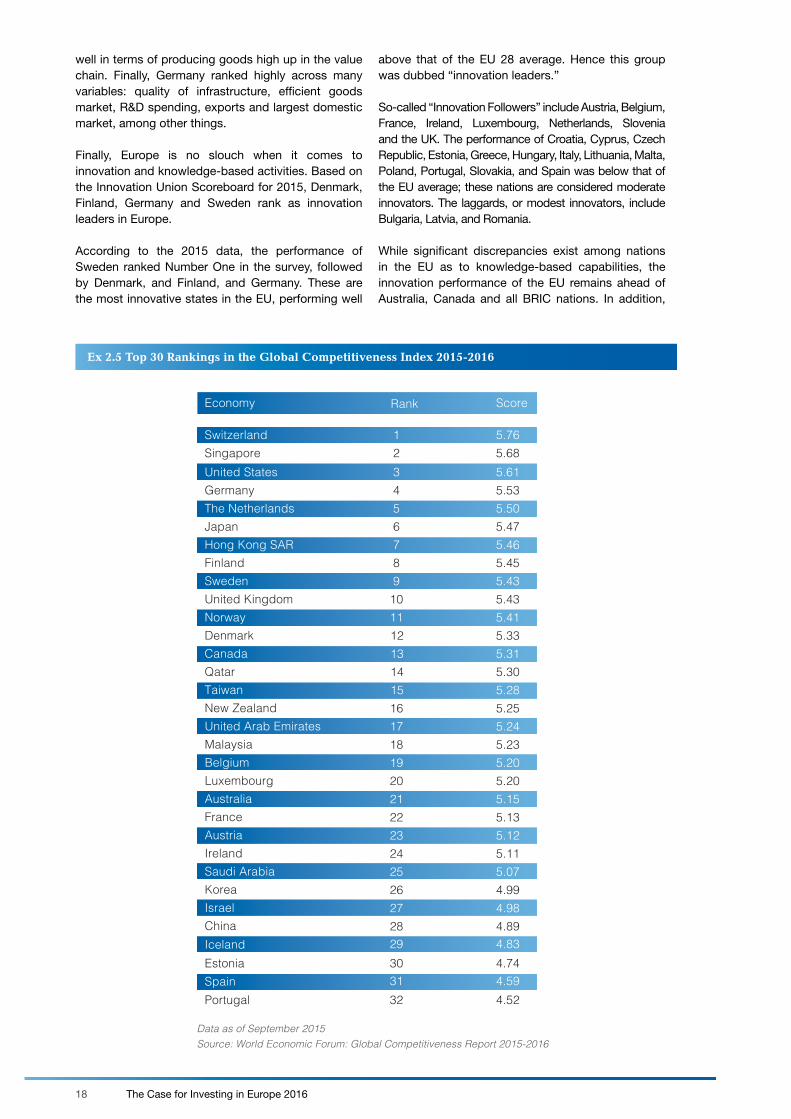
Fourth, Europe’s financial problems have obscured a critical fact about the region’s global competitiveness: that notwithstanding current market problems, many European economies remain among the most competitive in the world. For instance, in the latest rankings of global competitiveness from the World Economic Forum, six European countries were ranked among the top 10, and seven more among the top twenty-five. Switzerland ranked first, Germany 4th, the Netherlands 5th, Finland 8th, Sweden 9th and the United Kingdom 10th. Meanwhile, Norway ranked 11th, Denmark ranked 12th, Belgium 19th, Luxembourg 20th, France 22nd , Austria 23rd, and Ireland 24th. (See Exhibit 2.5).
The United States, by way of comparison, ranked 3rd in the latest rankings.
At the other end of the spectrum, a handful of European nations scored poorly, underscoring the fact that Europe’s competitiveness is hardly homogenous. A handful of nations did not even score in the top fifty—Romania ranked 53rd, Bulgaria 54th, Slovenia, 59th, Hungary 63rd, Croatia 77th, while Greece ranked
81st in the latest survey, the worst performer among EU members.
The spread between Number One Switzerland and floundering Greece underscores the divergent competitiveness of the EU and highlights the fact that various nations exhibit various competitive strengths and weaknesses. For instance, Greece received low marks for its public institutions and inefficient labor markets, which stands in contrast to Ireland’s well functioning labor force or Norway’s highly ranked public institutions.
Belgium was cited for outstanding health indicators and primary education; France was highlighted for its transport links and energy infrastructure, as well as strengths in quality of education, sophistication of business culture, highly developed financial markets, and leadership in innovation. Estonia, Poland and the Czech Republic were cited for their top notched education system and flexible labor market; Spain’s ranking was hurt by macroeconomic imbalances but scored relatively well in terms of ICT usage. Italy’s labor force remains quite rigid but the nation scored
Ex 2.4 Global Ease of Doing Business Rankings: Top 25
Country Rank Singapore 1New Zealand 2Denmark 3Korea, Rep. 4Hong Kong SAR, China 5United Kingdom 6United States * 7Sweden 8Norway 9Finland 10Taiwan, China 11Macedonia, FYR 12Australia 13Canada 14Germany 15Estonia 16Ireland 17Malaysia 18Iceland 19Lithuania 20Austria 21Latvia 22Portugal 23Georgia 24Poland 25
Data as of October 2015Source: World Bank
!"#$%"&'%()&#*&+#,-.&/0(,-)((&1%-2,-.(3&45)&4#6&781%-2 9#0-:;<! "#$%&'()*+ ,*-./*&0&$12 3*$4&)56 7()*&8.9*':; <($%.7($%."=98.>?#$&@ A$#B*1.7#$%1(4C A$#B*1."B&B*D.EF "-*1*$G ,()-&H!I J#$0&$1!! K&#-&$8.>?#$&!+ L&M*1($#&8.JN9!2 =ODB)&0#&!6 >&$&1&!; P*)4&$H!@ QDB($#&!C R)*0&$1!F L&0&HD#&!G RM*0&$1+I S#B?O&$#&+! =ODB)#&++ S&BT#&+2 U()BO%&0+6 P*()%#&+; U(0&$1
Source: World BankData as of October 2015.
18 The Case for Investing in Europe 2016
well in terms of producing goods high up in the value chain. Finally, Germany ranked highly across many variables: quality of infrastructure, efficient goods market, R&D spending, exports and largest domestic market, among other things.
Finally, Europe is no slouch when it comes to innovation and knowledge-based activities. Based on the Innovation Union Scoreboard for 2015, Denmark, Finland, Germany and Sweden rank as innovation leaders in Europe.
According to the 2015 data, the performance of Sweden ranked Number One in the survey, followed by Denmark, and Finland, and Germany. These are the most innovative states in the EU, performing well
above that of the EU 28 average. Hence this group was dubbed “innovation leaders.”
So-called “Innovation Followers” include Austria, Belgium, France, Ireland, Luxembourg, Netherlands, Slovenia and the UK. The performance of Croatia, Cyprus, Czech Republic, Estonia, Greece, Hungary, Italy, Lithuania, Malta, Poland, Portugal, Slovakia, and Spain was below that of the EU average; these nations are considered moderate innovators. The laggards, or modest innovators, include Bulgaria, Latvia, and Romania.
While significant discrepancies exist among nations in the EU as to knowledge-based capabilities, the innovation performance of the EU remains ahead of Australia, Canada and all BRIC nations. In addition,
Ex 2.5 Top 30 Rankings in the Global Competitiveness Index 2015-2016
Economy Rank Score
Switzerland 1 5.76Singapore 2 5.68United States 3 5.61Germany 4 5.53The Netherlands 5 5.50Japan 6 5.47Hong Kong SAR 7 5.46Finland 8 5.45Sweden 9 5.43United Kingdom 10 5.43Norway 11 5.41Denmark 12 5.33Canada 13 5.31Qatar 14 5.30Taiwan 15 5.28New Zealand 16 5.25United Arab Emirates 17 5.24Malaysia 18 5.23Belgium 19 5.20Luxembourg 20 5.20Australia 21 5.15France 22 5.13Austria 23 5.12Ireland 24 5.11Saudi Arabia 25 5.07Korea 26 4.99Israel 27 4.98China 28 4.89Iceland 29 4.83Estonia 30 4.74
Portugal 32 4.52Spain 31 4.59
Data as of September 2015Source: World Economic Forum: Global Competitiveness Report 2015-2016
19The Case for Investing in Europe 2016
based on the latest figures, the EU is closing its performance gap with Japan and the United States.
In that R&D expenditures are a key driver of value-added growth, it is interesting to note that Europe-based companies accounted for roughly 21.3% of total global R&D in 2015. That lagged behind the share of the U.S. (26.4% in 2015) but was well ahead of the global share of R&D spending in Japan (8.7%), China (19.8%), and India (3.5%). In 2015, Germany, Sweden, Switzerland, Austria, Finland and Denmark spent more on R&D as a percentage of GDP than the United States.
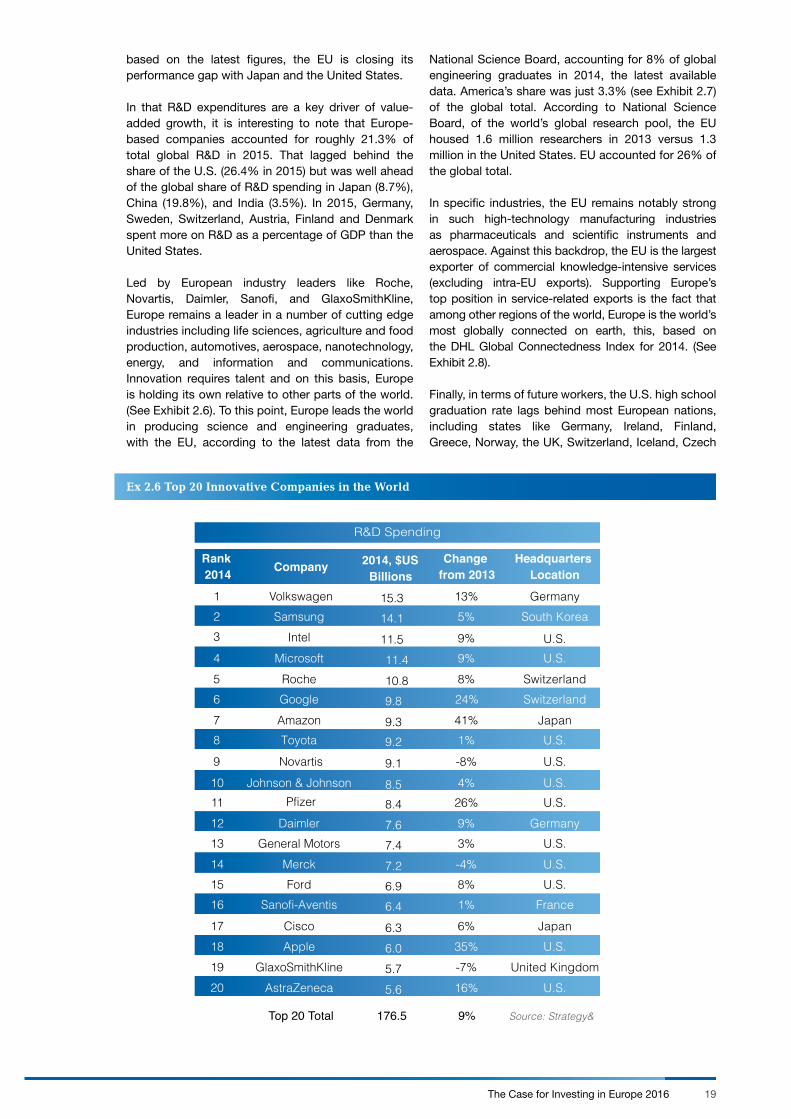
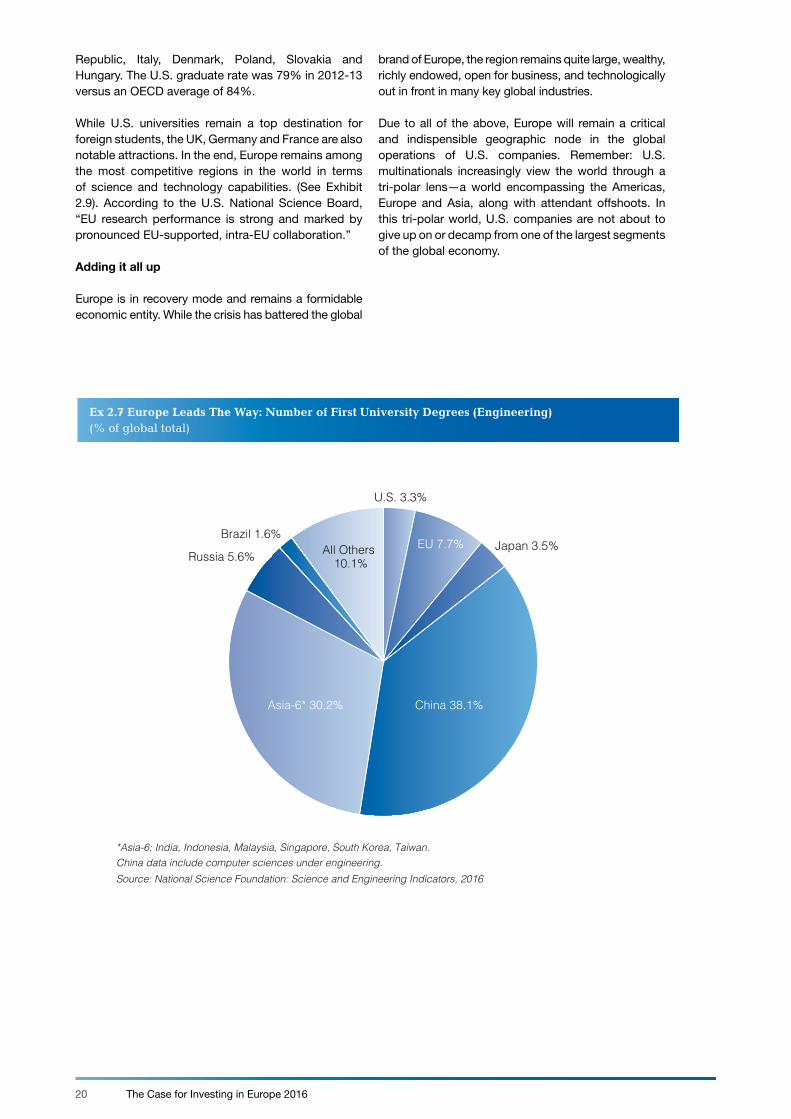
Led by European industry leaders like Roche, Novartis, Daimler, Sanofi, and GlaxoSmithKline, Europe remains a leader in a number of cutting edge industries including life sciences, agriculture and food production, automotives, aerospace, nanotechnology, energy, and information and communications. Innovation requires talent and on this basis, Europe is holding its own relative to other parts of the world. (See Exhibit 2.6). To this point, Europe leads the world in producing science and engineering graduates, with the EU, according to the latest data from the
National Science Board, accounting for 8% of global engineering graduates in 2014, the latest available data. America’s share was just 3.3% (see Exhibit 2.7) of the global total. According to National Science Board, of the world’s global research pool, the EU housed 1.6 million researchers in 2013 versus 1.3 million in the United States. EU accounted for 26% of the global total.
In specific industries, the EU remains notably strong in such high-technology manufacturing industries as pharmaceuticals and scientific instruments and aerospace. Against this backdrop, the EU is the largest exporter of commercial knowledge-intensive services (excluding intra-EU exports). Supporting Europe’s top position in service-related exports is the fact that among other regions of the world, Europe is the world’s most globally connected on earth, this, based on the DHL Global Connectedness Index for 2014. (See Exhibit 2.8).
Finally, in terms of future workers, the U.S. high school graduation rate lags behind most European nations, including states like Germany, Ireland, Finland, Greece, Norway, the UK, Switzerland, Iceland, Czech
Source: Strategy&
Company
9%
R&D Spending
Rank 2014
1
78
6
91011121314151617181920
23
45
Volkswagen
AmazonToyota
Top 20 Total
NovartisJohnson & Johnson
DaimlerGeneral Motors
MerckFord
Sanofi-AventisCiscoApple
GlaxoSmithKlineAstraZeneca
SamsungIntel
MicrosoftRoche
2014, $US Billions
15.3
9.39.2
176.5
9.8
9.18.58.47.67.47.26.96.46.36.05.75.6
14.111.511.410.8
Change from 2013
13%
41%1%
24%
-8%4%26%9%3%-4%8%1%6%35%-7%16%
5%
9%9%8%
Headquarters Location
Germany
JapanU.S.
Switzerland
U.S.U.S.U.S.
GermanyU.S.U.S.U.S.
FranceJapanU.S.
United KingdomU.S.
South Korea
U.S.U.S.
Switzerland
Pfizer
Ex 2.6 Top 20 Innovative Companies in the World
20 The Case for Investing in Europe 2016
Ex 2.7 Europe Leads The Way: Number of First University Degrees (Engineering)(% of global total)
U.S. 3.3%
EU 7.7% Japan 3.5%
China 38.1% Asia-6* 30.2%
Russia 5.6%
Brazil 1.6% All Others
10.1%
*Asia-6: India, Indonesia, Malaysia, Singapore, South Korea, Taiwan. China data include computer sciences under engineering. Source: National Science Foundation: Science and Engineering Indicators, 2016
Republic, Italy, Denmark, Poland, Slovakia and Hungary. The U.S. graduate rate was 79% in 2012-13 versus an OECD average of 84%.
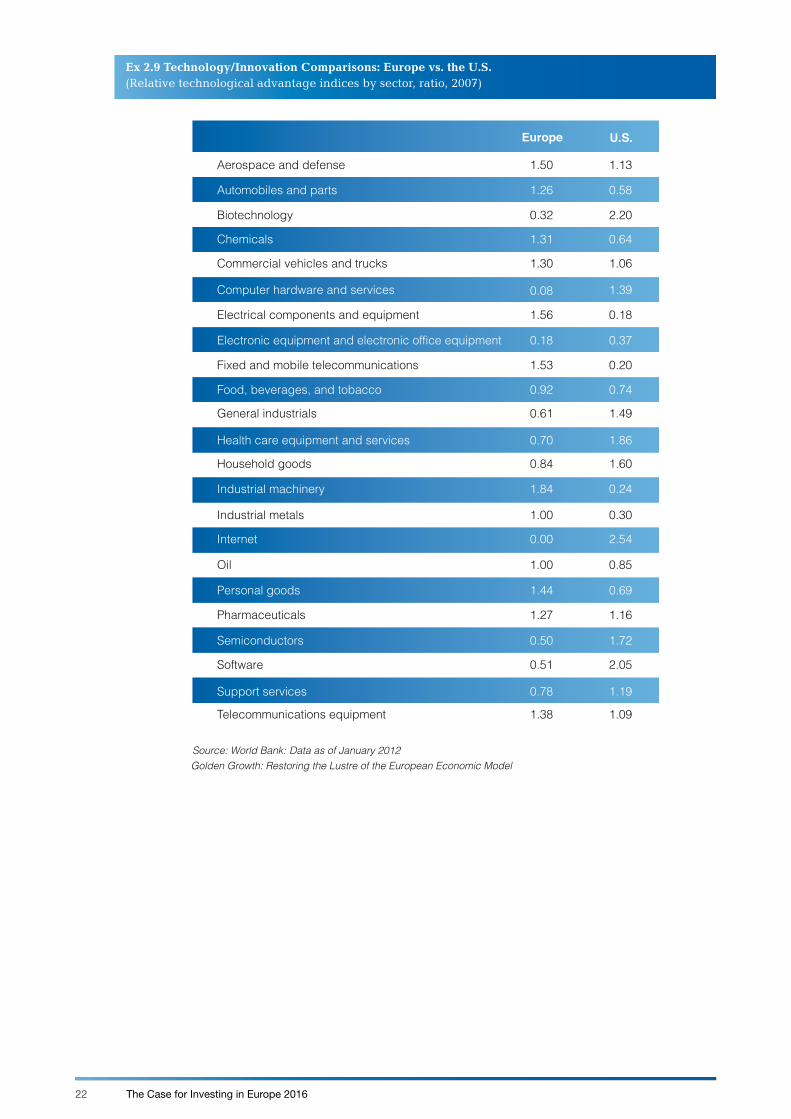
While U.S. universities remain a top destination for foreign students, the UK, Germany and France are also notable attractions. In the end, Europe remains among the most competitive regions in the world in terms of science and technology capabilities. (See Exhibit 2.9). According to the U.S. National Science Board, “EU research performance is strong and marked by pronounced EU-supported, intra-EU collaboration.”
Adding it all up
Europe is in recovery mode and remains a formidable economic entity. While the crisis has battered the global
brand of Europe, the region remains quite large, wealthy, richly endowed, open for business, and technologically out in front in many key global industries.
Due to all of the above, Europe will remain a critical and indispensible geographic node in the global operations of U.S. companies. Remember: U.S. multinationals increasingly view the world through a tri-polar lens—a world encompassing the Americas, Europe and Asia, along with attendant offshoots. In this tri-polar world, U.S. companies are not about to give up on or decamp from one of the largest segments of the global economy.

21The Case for Investing in Europe 2016
Rank Country
1 Netherlands2 Ireland3 Singapore4 Belgium5 Luxembourg6 Switzerland7 United Kingdom8 Denmark9 Germany10 Sweden23 United States
BRIC's69 Russia71 India74 Brazil84 China
Source: DHL.Data as of November 2014.
Ex 2.8 The 2014 DHL Global Connectedness Index, Overall Results
22 The Case for Investing in Europe 2016
Ex 2.9 Technology/Innovation Comparisons: Europe vs. the U.S.(Relative technological advantage indices by sector, ratio, 2007)
Data as of January 2012Source: World Bank: Golden Growth: Restoring the Lustre of the European Economic Model
General industrials
Oil
Personal goods
Pharmaceuticals
Semiconductors
Software
Telecommunications equipment
Europe
0.61
1.00
1.44
1.27
0.50
0.51
1.38
U.S.
Aerospace and defense 1.50 1.13
Automobiles and parts 1.26 0.58
Biotechnology 0.32 2.20
Chemicals 1.31 0.64
Commercial vehicles and trucks 1.30 1.06
Computer hardware and services 0.08 1.39
Electrical components and equipment 1.56 0.18
Electronic equipment and electronic office equipment 0.18 0.37
Food, beverages, and tobacco 0.92 0.74
1.49
Health care equipment and services 0.70 1.86
Household goods 0.84 1.60
Industrial machinery 1.84 0.24
Industrial metals 1.00 0.30
Internet 0.00 2.54
0.85
0.69
1.16
1.72
2.05
Support services 0.78 1.19
1.09
Fixed and mobile telecommunications 1.53 0.20

23The Case for Investing in Europe 2016
As one of Europe’s largest suppliers of oil and gas, a major refiner of crude oil for fuels and lubricants, and one of Europe’s leading petrochemical companies, ExxonMobil employs more than 18,000 people across 18 European countries.
European upstream operations account for 14% of ExxonMobil’s net oil and gas production, and ExxonMobil continues to progress exploration and development projects in Europe. Additionally, ExxonMobil provides natural gas supply to the European market through LNG receiving terminals in the United Kingdom and Italy.
Present in Europe for over 125 years, ExxonMobil remains a major investor. Over the past five years, ExxonMobil has invested $14.5 billion in Europe and has recently announced major upgrades at its refineries in Antwerp and Rotterdam. The Antwerp coker project, valued at more than US $1 billion, will convert heavy, higher-sulfur residual oils into much-needed transportation fuels, helping to expand trade and support the European economy. The expansion of the hydrocracker at the Rotterdam refinery will
upgrade heavier byproducts into cleaner, higher-value products, including premium lube base stocks and ultra-low sulfur diesel.
The refining industry is of strategic importance to the European economy. Operations at nine refineries in Europe represent 30% of ExxonMobil’s global capacity. This European presence allows ExxonMobil to contribute to the economy, to ensure secure supplies of petroleum products, and to enable other important industries to operate in Europe. In addition to selling branded fuels through Esso branded stations, ExxonMobil has a strong commercial fuels offering that serves marine, aviation, road transportation, mining, and wholesale customers across Europe – a cornerstone for mobility of people and goods in Europe.
These investments demonstrate that despite a challenging industry environment ExxonMobil is committed to its long-term strategy of investing in projects in advantaged locations where it can continue to increase competitiveness and profitability.
Company Case Study: ExxonMobil

24 The Case for Investing in Europe 2016
Europe’s periphery remains attractive
Chapter 3
25The Case for Investing in Europe 2016
Notwithstanding ongoing geo-political “hotspots”
in Europe’s periphery, the majority of economies are
expanding and becoming more integrated, not less, with
Europe in particular and the global economy in general.
The European Union is an unusual blend of developed
market economies (the EU-15) and developing
markets (the EU-13), and when fused, the two halves
offer some of the best commercial opportunities in the
world. The EU-13 members, for clarification, include
many nations that joined the EU over the past decade
via the EU enlargement process, with Croatia the
latest entrant.
The alchemy of western and eastern/central and
eastern Europe has been hugely beneficial to those
U.S. firms embedded in the European Union. EU
enlargement has meant not only the geographic
extension of Europe but also the enlargement of
market opportunities, resources and profits in the east
for U.S. multinationals.
Poland, the Czech Republic, Slovakia and other states
in the region represent new and untapped markets
and a lower wage base by which U.S. firms have
been quick to leverage. To the latter point, roughly
11% of corporate America’s European workforce is
now based in central and eastern Europe, up from
virtually zero two decades ago. Affiliate employment
in central and eastern Europe expanded at an average
annual pace of nearly 9% between 1999-2014 versus
a comparable 0.8% rate in western Europe.
According to most recent figures, there are more
Polish manufacturing workers on the payrolls of
U.S. foreign affiliates (roughly 107,000 workers) than
manufacturing workers employed by affiliates in Spain
(71,500), Ireland (48,600) or even Japan (77,400) and
South Korea (59,200) for that matter.
Meanwhile, while EU enlargement has given U.S. firms
access to a relatively large pool of skilled and low-
cost labor, it has also given companies access to new
consumers. Consumerism—as measured by personal
consumption expenditures—has simply soared over
the past decade in the east. (See Exhibit 3.1).
Large, wealthy, competitive, well endowed with critical inputs—these key attributes underpin the attractiveness of the European Union to Corporate America. Yet to this list another item must be added: Europe’s large and expanding, yet volatile economic periphery, encompassing not only central and eastern Europe, but also Turkey, the Middle East, North Africa and sub-Saharan Africa.
26 The Case for Investing in Europe 2016
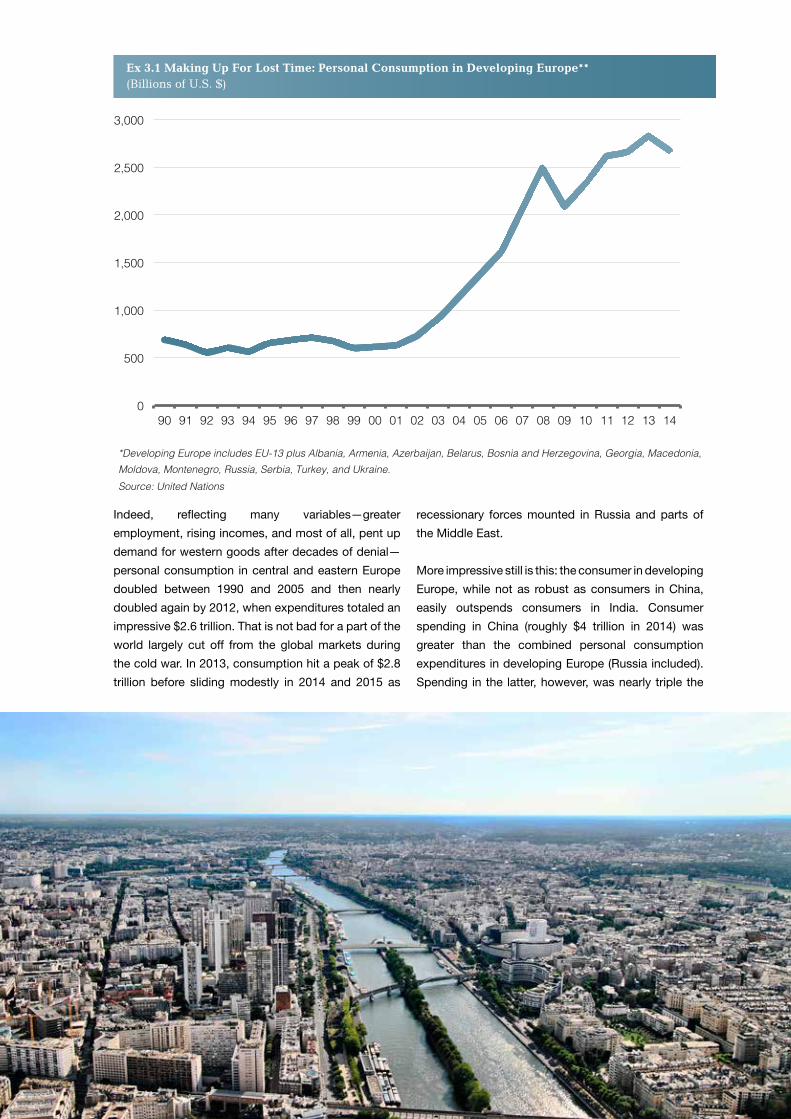
Indeed, reflecting many variables—greater
employment, rising incomes, and most of all, pent up
demand for western goods after decades of denial—
personal consumption in central and eastern Europe
doubled between 1990 and 2005 and then nearly
doubled again by 2012, when expenditures totaled an
impressive $2.6 trillion. That is not bad for a part of the
world largely cut off from the global markets during
the cold war. In 2013, consumption hit a peak of $2.8
trillion before sliding modestly in 2014 and 2015 as
recessionary forces mounted in Russia and parts of
the Middle East.
More impressive still is this: the consumer in developing
Europe, while not as robust as consumers in China,
easily outspends consumers in India. Consumer
spending in China (roughly $4 trillion in 2014) was
greater than the combined personal consumption
expenditures in developing Europe (Russia included).
Spending in the latter, however, was nearly triple the
0
500
1,000
1,500
2,000
2,500
3,000
90 91 92 93 94 95 96 97 98 99 00 01 02 03 04 05 06 07 08 09 10 11 12 13 14
*Developing Europe includes EU-13 plus Albania, Armenia, Azerbaijan, Belarus, Bosnia and Herzegovina, Georgia, Macedonia, Moldova, Montenegro, Russia, Serbia, Turkey, and Ukraine. Source: United Nations
Ex 3.1 Making Up For Lost Time: Personal Consumption in Developing Europe**(Billions of U.S. $)
27The Case for Investing in Europe 2016
level of consumer expenditures in India--$2.6 trillion
versus $1.2 trillion. (See Exhibit 3.2).
In the end, consumption is serious business in central
and eastern Europe, with consumption accounting for
over 55% of GDP in 2014 and 2015. That compares
to a figure of 45% in more trade-dependent Asia and
around 40% in China.
Rising levels of consumer spending, not surprisingly,
has translated into the ever-rising sales revenues of
U.S. foreign affiliates. Combined U.S. foreign affiliate
sales in Poland, Hungary and the Czech Republic
surged roughly 270% between 2000 and 2014, rising
from $21 billion to nearly $80 billion. The latter figure,
incidentally, was roughly one-third larger than affiliate
sales in India, home to a population of 1.2 billion
people versus a total population of roughly 60 million
in Poland, the Czech Republic and Hungary. What
U.S. affiliates reported as income in Poland in 2014
-- $444 million — was well above levels reported in
the more developed markets of Finland and Portugal.
In the end, EU enlargement—by giving European-based
U.S. foreign affiliates preferential market access and
treatment to the east—has been hugely beneficial and
profitable to U.S. multinationals. That said, however,
Europe’s periphery extends well beyond eastern and
central Europe. It is much broader and dynamic.
Taking stock of Europe’s extended periphery
Europe’s extended periphery—defined here as central
and eastern Europe, including Russia; the Middle East,
Turkey included; and Africa, notably North Africa — is
unmatched on a global scale. While only two nations
neighbor the United States, a dozen or so nations are
considered a part of Europe’s immediate neighborhood.
Granted, Europe’s extended periphery contains many
risks, which are frequently cited and rehearsed in the
media. Less attention has been paid, however, to the
fact that Europe’s extended periphery represents one
of the largest and most promising components of the
global economy. And through formal and informal ties,
Europe’s trade, financial and investment linkages with
this part of the world have deepened and thickened
considerably over the past decade to the benefit of
many U.S. firms operating in Europe.
For example, although Turkey remains outside the
European Union, that has not stopped bi-lateral trade
from soaring over the past decade, with total EU-
Turkey trade expanding 266% between 2000 and
2014. Total trade between Russia soared 370% over
the same period; trade with Nigeria and its exploding
middle class jumped 452% between 2000 and 2014.
3.2 The China Next Door: Personal Consumption in Developing Europe** Versus China (Billions of U.S. $)
0
500
1,000
1,500
2,000
2,500
3,000
3,500
4,000
90 91 92 93 94 95 96 97 98 99 00 01 02 03 04 05 06 07 08 09 10 11 12 13 14
*Developing Europe includes EU-13 plus Albania, Armenia, Azerbaijan, Belarus, Bosnia and Herzegovina, Georgia, Macedonia, Moldova, Montenegro, Russia, Serbia, Turkey, and Ukraine. Source: United Nations
China
India
Developing Europe*
28 The Case for Investing in Europe 2016
European-based U.S. affiliates have been a part of
this surge in bi-lateral commerce, leveraging Europe
as a springboard to the untapped and undeveloped
markets surrounding mainstream Europe. In most
cases, serving these distance markets from the
United States is too costly; however, the costs and
market opportunities vastly change when U.S. firms
let their European affiliates take the lead. This strategy
allows U.S. firms to be closer to their customers and
competitors, lends itself to greater customization
and localization by market, and promotes greater
economies of scale, among other strategic advantages.
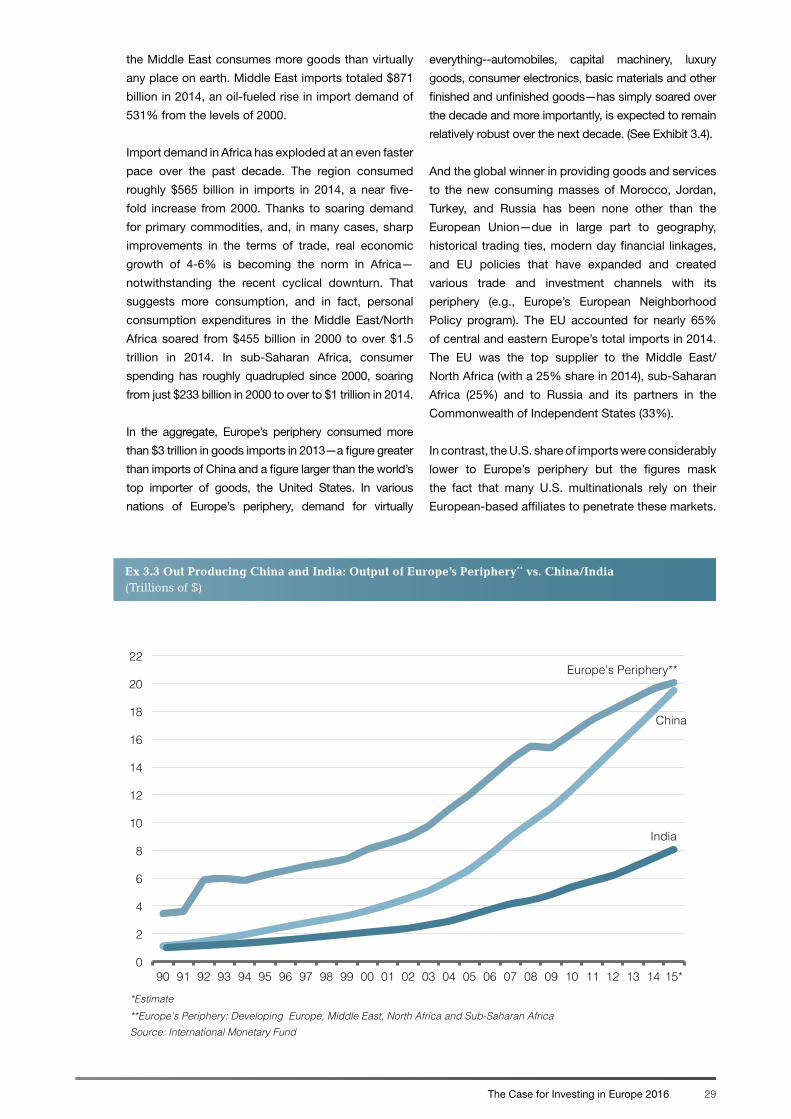
Europe’s extended periphery is massive in size and
scale. Indeed, the total output of this geographic
cohort is slightly larger than China’s total output.
In 2014, by our estimates, the periphery nations
produced $20 trillion in output versus China’s $19
trillion (numbers are based on PPP). Relative to India,
well, it’s not even close, with India’s output just 40% of
Europe’s periphery in 2014. China and India are home
to more people than the periphery but the population
of the latter is a great deal wealthier in most cases.
(See Exhibit 3.3).
Parts of Europe’s periphery are incredibly wealthy—
think of the Middle East and the elevated per incomes
of Saudi Arabia, Kuwait, and the United Arab Emirates.
These nations are under populated, although they
punch above their weight when it comes to consuming
western goods and services. On a per capita basis,
IBM provides technology and consulting services across the globe, employing over 400,000 people in over 170 countries. In Europe it has been operating and investing for over 100 years, starting in Germany in 1910 and then developing a strong presence in central and eastern Europe with the opening of its Czech office in 1932.
In December 2015, IBM announced that it will open its global headquarters for Watson Internet of Things (IoT) in Munich, Germany. Munich will serve as the global headquarters for the new Watson IoT unit, as well as the first European Watson innovation super center. This represents IBM’s largest investment in Europe in more than two decades!
The ‘campus-like’ environment will bring together 1000 IBM developers, consultants, researchers and designers to drive deeper engagement with clients and partners. They will be part of a global team that will include more than 2000 data scientists, developers, researchers, designers, consultants and salespeople
on six continents. It will house a collaborative innovation lab for data scientists, engineers and programmers to work with clients and partners to build a new class of connected solutions at the intersection of cognitive computing and the IoT for new business opportunities.
Germany is widely recognized globally for being at the forefront of the adoption and development of IoT technologies. This is in part due to the German government’s Industry 4.0 initiative. Germany, being home to some of the most innovative automotive, manufacturing, industrial and financial companies, all requiring strategies to deal with the massive amounts of data that their products are creating, is an ideal location from which to foster greater collaboration and accelerate innovation globally.
While IBM will draw talent from around the world, the prospect of tapping into some of the best engineering, design and programming talent in the world is also a huge draw when it comes to investing in Europe.
Company Case Study: IBM
29The Case for Investing in Europe 2016
Ex 3.3 Out Producing China and India: Output of Europe’s Periphery** vs. China/India (Trillions of $)
0
2
4
6
8
10
12
14
16
18
20
22
90 91 92 93 94 95 96 97 98 99 00 01 02 03 04 05 06 07 08 09 10 11 12 13 14 15*
*Estimate **Europe's Periphery: Developing Europe, Middle East, North Africa and Sub-Saharan Africa Source: International Monetary Fund
Europe's Periphery**
China
India
the Middle East consumes more goods than virtually
any place on earth. Middle East imports totaled $871
billion in 2014, an oil-fueled rise in import demand of
531% from the levels of 2000.
Import demand in Africa has exploded at an even faster
pace over the past decade. The region consumed
roughly $565 billion in imports in 2014, a near five-
fold increase from 2000. Thanks to soaring demand
for primary commodities, and, in many cases, sharp
improvements in the terms of trade, real economic
growth of 4-6% is becoming the norm in Africa—
notwithstanding the recent cyclical downturn. That
suggests more consumption, and in fact, personal
consumption expenditures in the Middle East/North
Africa soared from $455 billion in 2000 to over $1.5
trillion in 2014. In sub-Saharan Africa, consumer
spending has roughly quadrupled since 2000, soaring
from just $233 billion in 2000 to over to $1 trillion in 2014.
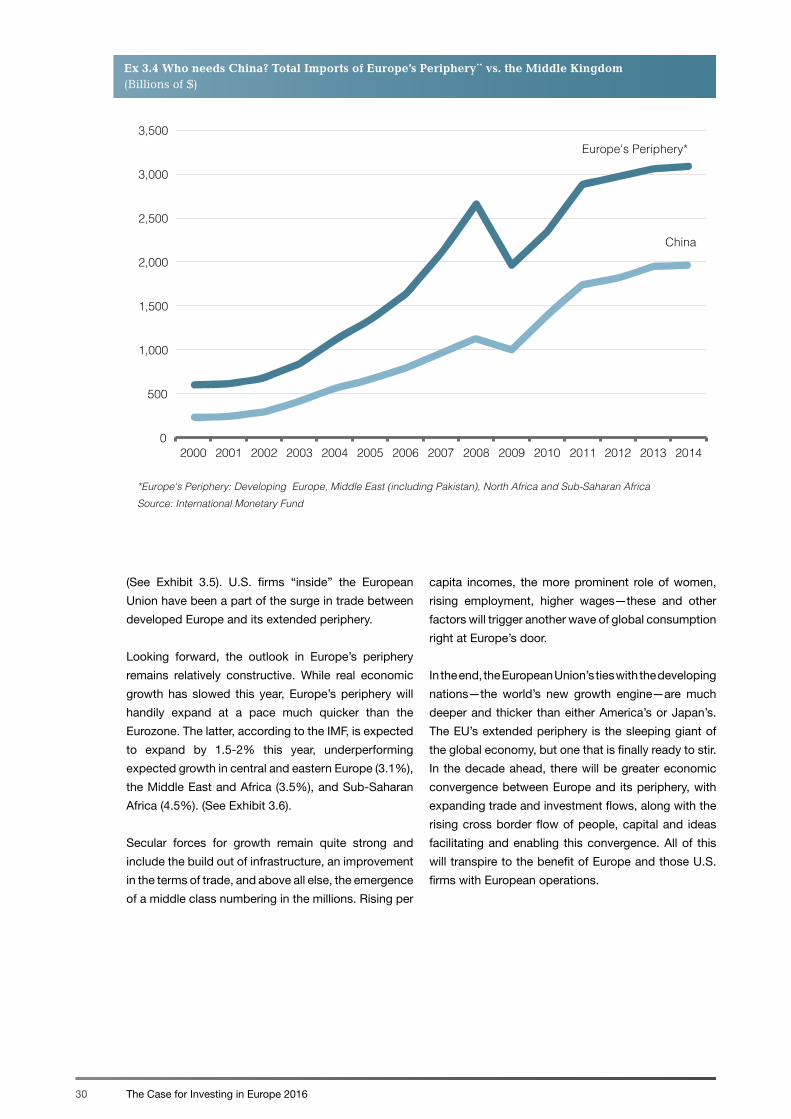
In the aggregate, Europe’s periphery consumed more
than $3 trillion in goods imports in 2013—a figure greater
than imports of China and a figure larger than the world’s
top importer of goods, the United States. In various
nations of Europe’s periphery, demand for virtually
everything--automobiles, capital machinery, luxury
goods, consumer electronics, basic materials and other
finished and unfinished goods—has simply soared over
the decade and more importantly, is expected to remain
relatively robust over the next decade. (See Exhibit 3.4).
And the global winner in providing goods and services
to the new consuming masses of Morocco, Jordan,
Turkey, and Russia has been none other than the
European Union—due in large part to geography,
historical trading ties, modern day financial linkages,
and EU policies that have expanded and created
various trade and investment channels with its
periphery (e.g., Europe’s European Neighborhood
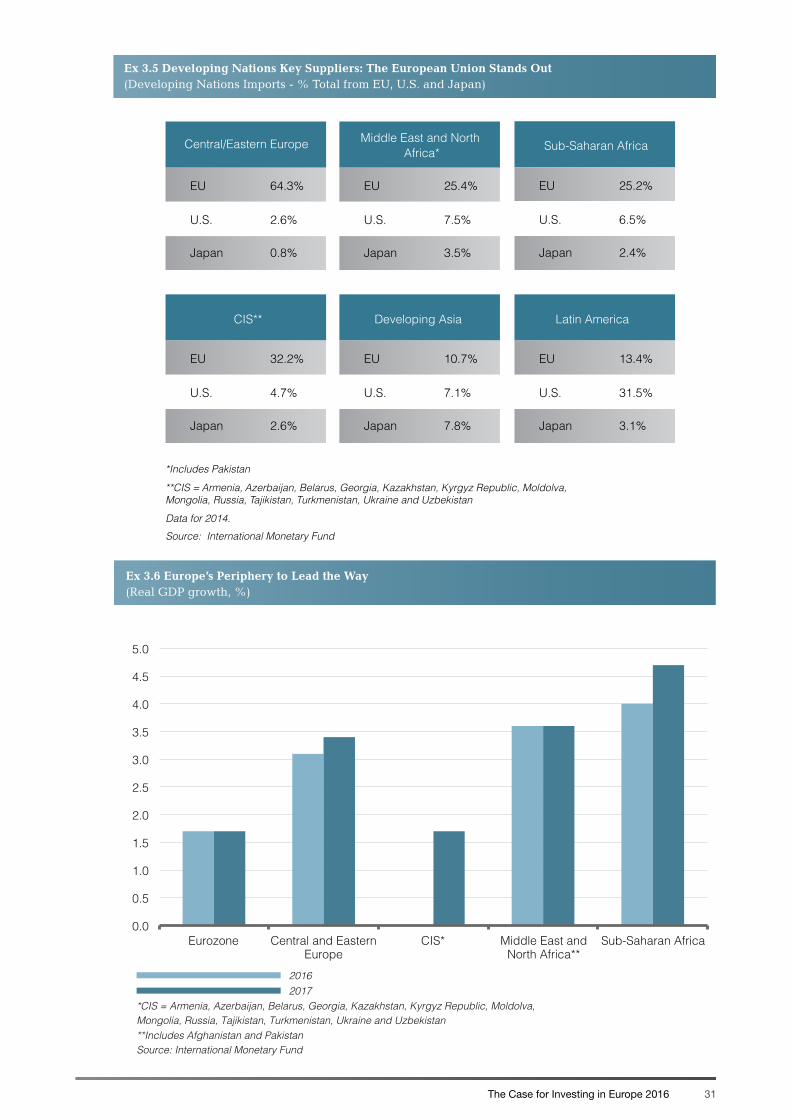
Policy program). The EU accounted for nearly 65%
of central and eastern Europe’s total imports in 2014.
The EU was the top supplier to the Middle East/
North Africa (with a 25% share in 2014), sub-Saharan
Africa (25%) and to Russia and its partners in the
Commonwealth of Independent States (33%).
In contrast, the U.S. share of imports were considerably
lower to Europe’s periphery but the figures mask
the fact that many U.S. multinationals rely on their
European-based affiliates to penetrate these markets.
30 The Case for Investing in Europe 2016
Ex 3.4 Who needs China? Total Imports of Europe’s Periphery** vs. the Middle Kingdom (Billions of $)
0
500
1,000
1,500
2,000
2,500
3,000
3,500
2000 2001 2002 2003 2004 2005 2006 2007 2008 2009 2010 2011 2012 2013 2014
*Europe's Periphery: Developing Europe, Middle East (including Pakistan), North Africa and Sub-Saharan Africa Source: International Monetary Fund
Europe's Periphery*
China
(See Exhibit 3.5). U.S. firms “inside” the European
Union have been a part of the surge in trade between
developed Europe and its extended periphery.
Looking forward, the outlook in Europe’s periphery
remains relatively constructive. While real economic
growth has slowed this year, Europe’s periphery will
handily expand at a pace much quicker than the
Eurozone. The latter, according to the IMF, is expected
to expand by 1.5-2% this year, underperforming
expected growth in central and eastern Europe (3.1%),
the Middle East and Africa (3.5%), and Sub-Saharan
Africa (4.5%). (See Exhibit 3.6).
Secular forces for growth remain quite strong and
include the build out of infrastructure, an improvement
in the terms of trade, and above all else, the emergence
of a middle class numbering in the millions. Rising per
capita incomes, the more prominent role of women,
rising employment, higher wages—these and other
factors will trigger another wave of global consumption
right at Europe’s door.
In the end, the European Union’s ties with the developing
nations—the world’s new growth engine—are much
deeper and thicker than either America’s or Japan’s.
The EU’s extended periphery is the sleeping giant of
the global economy, but one that is finally ready to stir.
In the decade ahead, there will be greater economic
convergence between Europe and its periphery, with
expanding trade and investment flows, along with the
rising cross border flow of people, capital and ideas
facilitating and enabling this convergence. All of this
will transpire to the benefit of Europe and those U.S.
firms with European operations.
31The Case for Investing in Europe 2016
Ex 3.6 Europe’s Periphery to Lead the Way (Real GDP growth, %)
0.0
0.5
1.0
1.5
2.0
2.5
3.0
3.5
4.0
4.5
5.0
Eurozone Central and Eastern Europe
CIS* Middle East and North Africa**
Sub-Saharan Africa
2016 2017
**Includes Afghanistan and Pakistan Source: International Monetary Fund
*CIS = Armenia, Azerbaijan, Belarus, Georgia, Kazakhstan, Kyrgyz Republic, Moldolva,Mongolia, Russia, Tajikistan, Turkmenistan, Ukraine and Uzbekistan
Ex 3.5 Developing Nations Key Suppliers: The European Union Stands Out(Developing Nations Imports - % Total from EU, U.S. and Japan)
*Includes Pakistan
**CIS = Armenia, Azerbaijan, Belarus, Georgia, Kazakhstan, Kyrgyz Republic, Moldolva,Mongolia, Russia, Tajikistan, Turkmenistan, Ukraine and Uzbekistan
Data for 2014.Source: International Monetary Fund
EU 64.3%
Central/Eastern Europe
U.S. 2.6%
Japan 0.8%
EU 25.4%
U.S. 7.5%
Japan 3.5%
Middle East and North Africa* Sub-Saharan Africa
EU 25.2%
U.S. 6.5%
Japan 2.4%
EU 32.2%
U.S. 4.7%
Japan 2.6%
CIS**
EU 10.7%
U.S. 7.1%
Japan 7.8%
Developing Asia
EU 13.4%
U.S. 31.5%
Japan 3.1%
Latin America
32 The Case for Investing in Europe 2016
P&G has been in Europe since 1930, when it opened its first subsidiary in the United Kingdom. Since then, the company has continued to grow, with on-the-ground operations in almost every country in the region. More than one third of P&G’s global employees, of diverse nationalities, work today in Europe, including more than 2,000 scientists and engineers working in four innovation centers. The European Union’s Single Market is an ideal place to design, manufacture and market our products. Thanks to excellent national education systems, Europe offers an invaluable source of skilled talent; advanced infrastructures that allow for efficient trade; and political stability that grants the predictability any business needs for long-term planning. Moreover, the science-based common regulatory framework reduces inefficiencies, cuts duplication of procedures and ultimately enables P&G to present consumers with quality, innovative products. The result is a triple win: for their brands, for their people and of course for their consumers. Europe is also one of the places where it is easiest to innovate. Innovation is the driving force behind P&G’s strategy, as it always has been. The company’s innovation starts with the science of understanding people and their needs. P&G conducts over 20,000 consumer and market research studies annually and invests more than $2 billion per year in developing new products. P&G is committed to innovating and investing in the region to drive growth and create value
for consumers all over the world, as well as creating economic opportunities for local SMEs and start-ups. In France alone, P&G were able to create over 1000 new jobs thanks to innovation in their Fabric Care product portfolio, of which 400 were created in the past 5 years. This in turn led to more than 500 indirect new jobs. Many of P&G’s most significant product innovations were developed in their European innovation centers. For example, the game-changing single unit dose technology was created and developed in P&G’s innovation center in Brussels. From this technology they developed the Ariel 3-in-1 PODS: an ultra-convenient, super-compacted, 3-in-1 action laundry product. In addition, this compacted product helps consumers do their little bit for the planet as it makes them economize detergent as well as energy since it performs brilliant cleaning even at 30C. To develop the Ariel 3-in-1 PODS, it took nearly 10 years, over 100 R&D experts, more than 6000 consumer tests, 8 tons of linen tested and the collaboration with dozens of academic and industry partners. Ariel 3-in-1 PODS are protected by more than 50 patents and IP rights. In fact, single unit dose detergents are the fastest growing fabric care product form today. The most important plant in the globe for the production of this new iconic P&G product is located in Amiens, France. Ariel 3-in-1 PODS produced there touch and improve consumers’ lives in more than 50 countries around the world.
Company Case Study: P&G

33The Case for Investing in Europe 2016
TTIP— A potential global
game changer
Chapter 4
34 The Case for Investing in Europe 2016
However, there are slim odds that the negotiations will be completed before the end of the Obama Administration; that said, the next U.S. administration is expected to embrace and carry on with the TTIP negotiations.
An ambitious agreement would include the harmonization of food safety standards, e-commerce protocols, data privacy issues. It would also encompass the standardization of a myriad of service-related activities in such sectors as aviation, retail trade, architect, engineering, maritime, procurement rules and regulations, and telecommunications. This all equates to more jobs and income for workers on both sides of the pond.
The move towards a more barrier-free transatlantic market would also include product standardization so that, for example, a car tested for safety in Bonn can be sold without further tests in Boston or a drug approved by the Federal Drug Administration in Washington is deemed safe and market-ready in Brussels. Labeling and packaging requirements on both sides of the pond would be standardized, saving companies millions of dollars over the long run.
Technical regulations and safety standards are hardly headline grabbing topics but when these hurdles to doing business are stripped away, the end results are lower costs for companies, reduced prices for consumers and more aggregate demand of goods and services. That in turn spells more transatlantic trade and investment, as well as more jobs and incomes for U.S. and European constituents.
Over the medium term, TTIP would not only drive more trade and FDI (foreign direct investment) between the U.S. and Europe. It would also spur more FDI to both markets from the developing nations; large
firms in India, China, South Korea and others would strategically seek to be “inside” the transatlantic economy, and would most likely accomplish this through mergers and acquisitions. “Losers” would be firms outside the TTIP framework—as an outsider, these firms would find it much harder to compete against the “insiders,” who would enjoy the scale and first mover advantage.
If TTIP evolves as an underlying success, the deal would attract other TTIP-wannabes and help deepen global integration.
In addition, a deal that provides more scale to the global operations of U.S./EU firms; reduces costs in various sectors and activities; and spurs/underwrites more innovation and R&D in the transatlantic economy would serve to enhance the competitiveness of both the United States and Europe. More profit-generating policies would give (theoretically) firms more capital for investment, R&D and other related activities. If TTIP becomes the global golden standard in many industries, this would bestow first mover advantage to U.S./EU firms relative to firms from Japan, South Korea, China and other nations. Firms outside TTIP would have to adjust to the standards and regulations of the transatlantic economy.
If TTIP results in a more integrated transatlantic energy market and harmonized technological standards, both dynamics would help boost the global competitiveness of the U.S. and EU.
Then there are the geo-strategic implications of TTIP since this deal is about more than trade. It is about creating a more strategic, dynamic and holistic U.S.- EU relationship that is more confident, more effective at engaging third countries and addressing regional
The Transatlantic Trade and Investment Partnership (TTIP) currently under negotiation by the United States and the EU promises to unleash significant opportunities to generate jobs, trade and investment across the Atlantic. At the time of going to print thirteen negotiating rounds had been concluded since the talks first commenced in 2013, with more scheduled for 2016.
35The Case for Investing in Europe 2016
and global challenges, and better able to strengthen the ground rules of the international order.
The transatlantic economy, the largest commercial artery in the world, would be revived. The global clout and credibility of the United States and Europe would be restored. By coming together as opposed to drifting apart, the U.S. and Europe would remain the standard bearers of the global economic architecture. Whatever the common standards of a free trade agreement, and whatever the harmonization and standardization of industry/sector regulations, a transatlantic deal could become the template (industry-by-industry) by which the United States and Europe negotiate with various emerging market economies, China and Russia included.
In this sense, a transatlantic free trade agreement would serve notice to developing nations that the world’s two largest economies can still work together, and when they do, they still have a great deal of global economic leverage over most, if not all, developing nations. In addition, TTIP would not only be to the benefit of the U.S. and Europe, but also hugely beneficial to the rest of the global economy in that the world economy still rests on the shoulders of the transatlantic partnership - helping to drive global growth over the past half century - when the U.S. and Europe work together, the world benefits.
The downside - TTIP could intensify the move towards other regional trading blocs as a defensive measure against a U.S./EU deal; China, Russia and Brazil would most likely lead this effort. TTIP could give common ground to the emerging markets to intensify their own efforts at creating exclusionary trading blocs.
Finally, as Exhibit 4.1 highlights, TTIP stacks up far more favorable in many metrics than either TPP or NAFTA. The combined GDP of TTIP members, for instance, is 51% larger than those participants of TPP. TTIP members are also wealthier—with the average per capita of TTIP--$36,294—some more than two-thirds larger than the average for TPP ($21,615). While the latter accounts for 15% of global consumption, TTIP accounts for nearly one-quarter. Whether trade and investment flows, the figures for TTIP are larger than TTP. Finally, note that U.S. FDI income in TTIP was more than double that of TPP, while foreign affiliate sales in TTIP were nearly 27% larger than comparable figures for TPP.
In the end, both trade agreements are important to the economic health of U.S. firms. With any luck, TPP will be finalized and passed by all parties this year, allowing negotiators to turn to an even greater prize: a historic trade agreement with its long standing partner across the Atlantic.
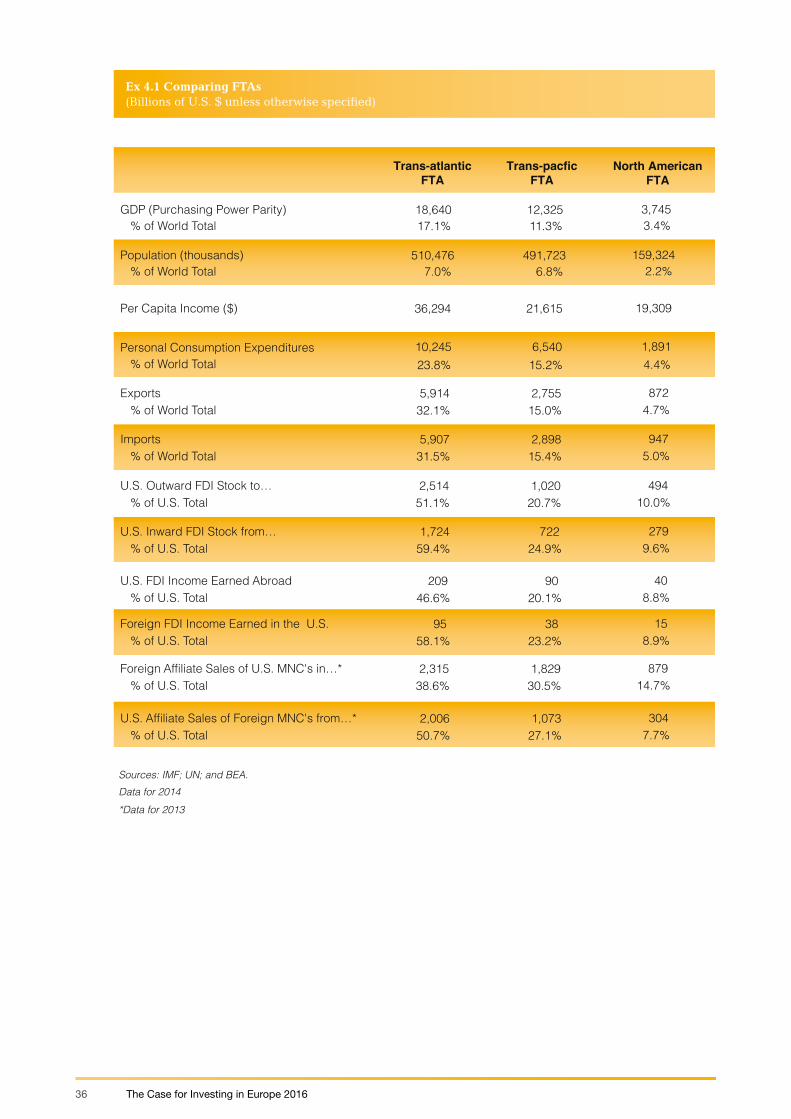
36 The Case for Investing in Europe 2016
Sources: IMF; UN; and BEA.Data for 2014*Data for 2013
GDP (Purchasing Power Parity) % of World Total
Per Capita Income ($)
Personal Consumption Expenditures % of World Total
Exports % of World Total
Imports % of World Total
U.S. Outward FDI Stock to… % of U.S. Total
U.S. FDI Income Earned Abroad % of U.S. Total
Foreign FDI Income Earned in the U.S. % of U.S. Total
Foreign Affiliate Sales of U.S. MNC's in…* % of U.S. Total
U.S. Affiliate Sales of Foreign MNC's from…* % of U.S. Total
Trans-atlanticFTA
Trans-pacficFTA
12,32518,64017.1% 11.3%
3,7453.4%
Population (thousands) % of World Total
510,476 491,7237.0% 6.8%
159,3242.2%
36,294 21,615 19,309
10,245 6,54023.8% 15.2%
1,8914.4%
5,914 2,75532.1% 15.0%
8724.7%
5,907 2,89831.5% 15.4%
9475.0%
2,514 1,02051.1% 20.7%
49410.0%
U.S. Inward FDI Stock from… % of U.S. Total
1,724 72259.4% 24.9%
2799.6%
209 9046.6% 20.1%
408.8%
95 3858.1% 23.2%
158.9%
2,315 1,82938.6% 30.5%
87914.7%
2,006 1,07350.7% 27.1%
3047.7%
North AmericanFTA
Ex 4.1 Comparing FTAs(Billions of U.S. $ unless otherwise specified)

37The Case for Investing in Europe 2016
The Way Forward: The transatlantic partnership is too big to fail
Chapter 5
38 The Case for Investing in Europe 2015
The case for investing in Europe rests squarely on the fact that Europe is a continent of success. It is Europe’s size and wealth, depth in human capital, and respect for the rule of law, among other attributes, that makes the region a natural partner of the United States. Through the transatlantic partnership, the post-WWII global economy has flourished; with the aid and assist of the United States, Europe emerged from the ashes of war to become the largest and wealthiest economic bloc of the global economy. As the Norwegian Noble Committee noted upon awarding the 2012 Nobel Peace Prize to the European Union:
“The stabilizing part played by the EU has helped transform most of Europe from a continent of war to a continent of peace.”
The post-war economic integration of the EU is one of the greatest triumphs of the past sixty five years. It ranks right up there with the rise of China over the past three decades - a fact forgotten by many or mesmerized by China’s rapid ascent. The China story is impressive; so is the European story. At the core of Europe’s peace, reconciliation and prosperity is the fact that no other region of the world has successfully
integrated and grown as a single entity like the EU over the past half century. Over the past few decades, Europe has not only made itself economically stronger, it has also made the world economy sturdier and safer. And a primary beneficiary of this dynamic has been Europe’s long-time strategic partner - the United States.
The previous chapters have highlighted what’s right with Europe amid the daily doom and gloom of what’s wrong with Europe. Yes, the continent faces some formidable challenges in the months and years ahead. The ongoing migration crisis is once again testing the resolve and commitment of the EU. Predicting the demise of the Union is fashionable again. But this report serves as a critical and timely reminder that, notwithstanding the critical stress points of today, Europe still remains among the most attractive long-term places in the world for business.
The case for Europe rests on many building blocks. First, thanks to more proactive and pro-growth policies from the European Central Bank, Europe’s economic recovery is gaining traction. Growth in 2016 should be among the best in years, around 1.5-2%. That’s hardly robust but nevertheless a start towards
The post-crisis global economy is still being reshaped, with the ultimate configuration still unknown. But in a world in perpetual change, one strand of continuity remains the deep integration of the United States and Europe, with each party drawing strength and stability from each other. More broadly speaking, the transatlantic partnership remains the bedrock of the global economy. With many key emerging markets in recession (Russia and Brazil), or struggling to find a new growth path (China) or in the throes of tumult and turmoil (the Middle East and North Africa), the U.S.- EU economic alliance remains critical to the long-term health of the global economy. Simply put: the transatlantic partnership is too big to fail.
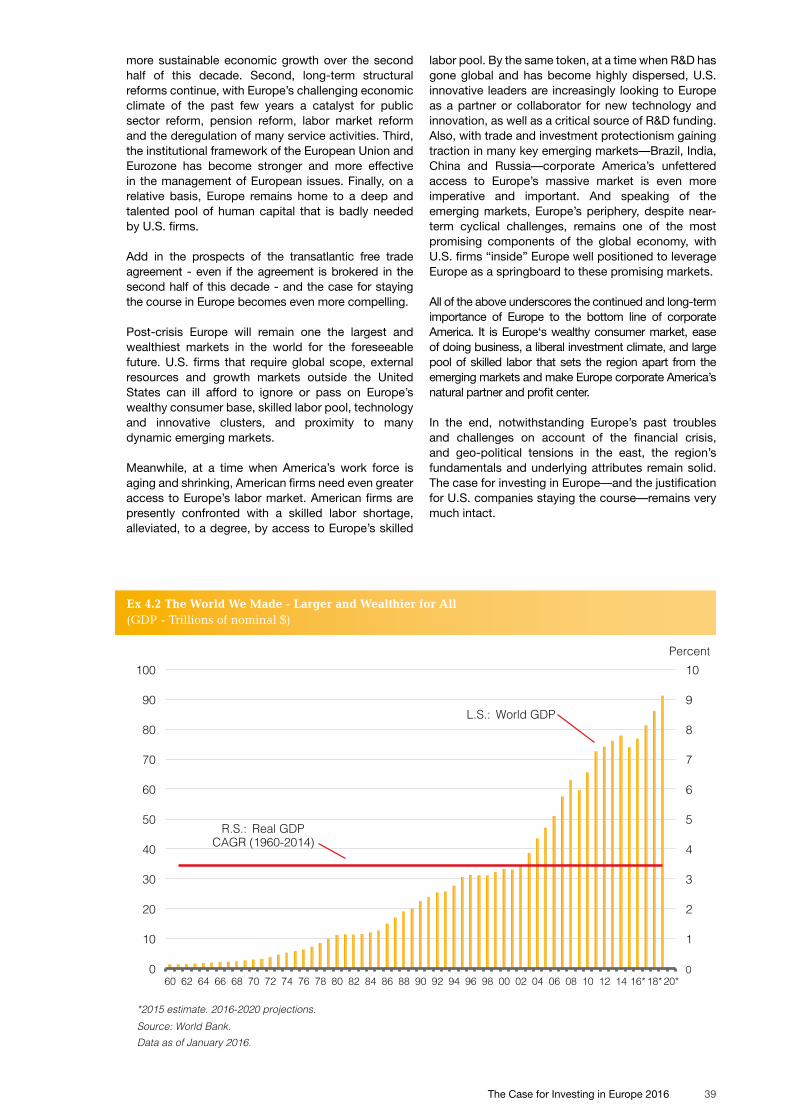
39The Case for Investing in Europe 2016
more sustainable economic growth over the second half of this decade. Second, long-term structural reforms continue, with Europe’s challenging economic climate of the past few years a catalyst for public sector reform, pension reform, labor market reform and the deregulation of many service activities. Third, the institutional framework of the European Union and Eurozone has become stronger and more effective in the management of European issues. Finally, on a relative basis, Europe remains home to a deep and talented pool of human capital that is badly needed by U.S. firms.
Add in the prospects of the transatlantic free trade agreement - even if the agreement is brokered in the second half of this decade - and the case for staying the course in Europe becomes even more compelling.
Post-crisis Europe will remain one the largest and wealthiest markets in the world for the foreseeable future. U.S. firms that require global scope, external resources and growth markets outside the United States can ill afford to ignore or pass on Europe’s wealthy consumer base, skilled labor pool, technology and innovative clusters, and proximity to many dynamic emerging markets.
Meanwhile, at a time when America’s work force is aging and shrinking, American firms need even greater access to Europe’s labor market. American firms are presently confronted with a skilled labor shortage, alleviated, to a degree, by access to Europe’s skilled
labor pool. By the same token, at a time when R&D has gone global and has become highly dispersed, U.S. innovative leaders are increasingly looking to Europe as a partner or collaborator for new technology and innovation, as well as a critical source of R&D funding. Also, with trade and investment protectionism gaining traction in many key emerging markets—Brazil, India, China and Russia—corporate America’s unfettered access to Europe’s massive market is even more imperative and important. And speaking of the emerging markets, Europe’s periphery, despite near-term cyclical challenges, remains one of the most promising components of the global economy, with U.S. firms “inside” Europe well positioned to leverage Europe as a springboard to these promising markets.
All of the above underscores the continued and long-term importance of Europe to the bottom line of corporate America. It is Europe‘s wealthy consumer market, ease of doing business, a liberal investment climate, and large pool of skilled labor that sets the region apart from the emerging markets and make Europe corporate America’s natural partner and profit center.
In the end, notwithstanding Europe’s past troubles and challenges on account of the financial crisis, and geo-political tensions in the east, the region’s fundamentals and underlying attributes remain solid. The case for investing in Europe—and the justification for U.S. companies staying the course—remains very much intact.
0
1
2
3
4
5
6
7
8
9
10
0
10
20
30
40
50
60
70
80
90
100
60 62 64 66 68 70 72 74 76 78 80 82 84 86 88 90 92 94 96 98 00 02 04 06 08 10 12 14 16* 18* 20*
*2015 estimate. 2016-2020 projections. Source: World Bank. Data as of January 2016.
R.S.: Real GDP CAGR (1960-2014)
L.S.: World GDP
Percent
Ex 4.2 The World We Made - Larger and Wealthier for All(GDP - Trillions of nominal $)
40 The Case for Investing in Europe 201640 The Case for Investing in Europe 2015
For over 60 years Ecolab has been investing in Europe. Economics Laboratory, the founding company of Ecolab, was established 123 years ago with the aim of helping customers save time, labor and costs, backed by laboratory research. While Ecolab’s underlying focus is on bringing sustainability and savings to its customers through innovation and exceptional service, since the company’s inception in Europe, much has changed.
In Europe Ecolab’s footprint has dramatically expanded; its associates now operate a total of 23 chemical manufacturing plants, producing more than 6,000 products. Today, about 10,000 associates work across 35 European countries, in pursuit of Ecolab’s goal of making the world cleaner, safer and healthier, protecting people and vital resources.
In Europe, Ecolab’s technology helps to wash more than 25 billion plates a year and clean 133 million laundry loads. Its hygiene products wash approximately 5.5 billion hands a year and clean dairy operations to help produce 57 billion glasses of milk a year. While Ecolab helps customers to save water and energy and improve their carbon footprint, it also focuses inwards, particularly in Europe. At its Celrà plant in Northern Spain Ecolab saved 800,000 gallons of water in 2014 through improved steam generation
processes. Its European operations are leading the way in meeting its own ambitious global sustainability targets, which include a 25% reduction in effluent discharge and waste, a 20% reduction in water use and a 10% reduction in greenhouse gas emissions by 2017 from a 2012 baseline.
Europe is a key driver of innovation for Ecolab globally. In Monheim, Germany, Ecolab has established a global center of excellence for research and development, with more than 200 scientists on site. This campus, Ecolab’s biggest in the region, houses a high-tech European Innovation Center. Ecolab has a total of more than 440 patents in Europe. Innovations which have changed the direction of industry, such as dry lubrication to membrane cleaning, have been spearheaded from Europe.
Consumers, and the corporates who serve their needs, place higher demands in Europe on achieving sustainable and safe results, from the food and beverage industries, to the mining and energy sectors, to hotel and facility cleaning, to laundry. Ecolab leads the way in allowing customers in the food, healthcare, energy, hospitality and industrial markets to promote safe food, maintain clean environments, optimize water and energy use and improve operational efficiencies, creating a better environment for Europeans.
Company Case Study: Ecolab

41The Case for Investing in Europe 2016
42 The Case for Investing in Europe 2016
Joseph Quinlan is a leading expert on the transatlantic economy and a well known economist/strategist on Wall Street. He specializes in global capital flows, foreign direct investment, international trade, and multinational strategies.
Mr. Quinlan lectures on finance and global economics at New York University and Fordham University. In 1998, he was nominated as an Eisenhower Fellow.Presently, he is a Senior Fellow at the Center for Transatlantic Relations and a Fellow at the German Marshall Fund. He served as a Bosch Fellow at the Transatlantic Academy in 2011.
In 2006, the American Chamber of Commerce to the European Union (AmCham EU) awarded Mr. Quinlan the 2006 Transatlantic Business Award for his research on U.S.- Europe economic ties. In 2007, he was a recipient of the European-American Business Council Leadership award for his research on the transatlantic partnership global economy.
Mr. Quinlan regularly debriefs policymakers and legislators on Capitol Hill on global trade and economic issues. He has testified before the European Parliament. He has served as a consultant to the U.S. Department of State and presently serves as the U.S. representative (Economic Policy Committee) to the Organisation for Economic Co-operation and Development in Paris, France for the U.S. Council for International Business. He is also a board member of Fordham University’s Graduate School of Arts and Science and serves on Fordham University’s President Council.
He is the author, co-author, or contributor to twenty books. His most recent book, “The Last Economic Superpower: The Retreat of Globalization, the End of American Dominance, and What We Can Do About It” was released by McGraw Hill in November 2010. He has published more than 125 articles on economics, trade and finance that have appeared in such venues as Foreign Affairs, the Financial Times, The Wall Street Journal and Barron’s. He regularly appears on CNBC, as well as Bloomberg television, PBS and other media venues.
AmCham EU speaks for American companies committed to Europe on trade, investment and competitiveness issues. It aims to ensure a growth-orientated business and investment climate in Europe. AmCham EU facilitates the resolution of transatlantic issues that impact business and plays a role in
creating better understanding of EU and US positions on business matters. Aggregate US investment in Europe totalled more than €2 trillion in 2015, directly supports more than 4.3 million jobs in Europe, and generates billions of euros annually in income, trade and research and development.
About the author
About AmCham EU
42 The Case for Investing in Europe 2015

43The Case for Investing in Europe 2016

AmChams in Europe
AmCham EUAvenue des Arts/Kunstlaan 53,1000 BrusselsBelgium T +32 2 513 68 92E [email protected] www.amchameu.eu
AmCham Albaniawww.amcham.com.al
AmCham Armeniawww.amcham.am
AmCham Austriawww.amcham.at
AmCham Azerbaijanwww.amchamaz.org
AmCham Belgiumwww.amcham.be
AmCham Bulgariawww.amcham.bg
AmCham Croatiawww.amcham.hr
AmCham Cypruswww.amchamcyprus.com.cy
AmCham Denmarkwww.amcham.dk AmCham Estonia www.amcham.ee
AmCham EUwww.amchameu.eu
AmCham Finlandwww.amcham.fi
AmCham Francewww.amchamfrance.org
AmCham Georgiawww.amcham.ge
AmCham Germanywww.amcham.de
American-Hellenic Chamber of Commercewww.amcham.gr AmCham Hungarywww.amcham.hu AmCham Irelandwww.amcham.ie Israel-America Chamber of Commercewww.amcham.co.il AmCham Italywww.amcham.it AmCham Kosovowww.amchamksv.org
AmCham Latviawww.amcham.lv
AmCham Lithuaniawww.amcham.lt AmCham Luxembourgwww.amcham.lu
AmCham Macedoniawww.amcham.com.mk AmCham Maltawww.amcham-malta.org AmCham Moldovawww.amcham.md
AmCham Montenegrowww.amcham.me
AmCham The Netherlandswww.amcham.nl
AmCham Norwaywww.amcham.no
AmCham Polandwww.amcham.pl
AmCham Portugalwww.amcham.org.pt
AmCham Romaniawww.amcham.ro
AmCham Russiawww.amcham.ru
AmCham Serbiawww.amcham.rs
AmCham Slovakia www.amcham.sk
AmCham Sloveniawww.amcham.si
AmCham Spainwww.amchamspain.com
AmCham Swedenwww.amchamswe.se
Swiss-American Chamber of Commercewww.amcham.ch
American Business Forum in Turkey (ABFT) www.abft.net
Turkish-American Business Association (TABA)www.amcham.org
AmCham Ukrainewww.chamber.ua
BritishAmerican Business (BAB)www.babinc.org