the causal effect of labor unions
TRANSCRIPT
The Causal Effect of Labor UnionsIn The U.S. Context
John DiNardo
Outline
IntroductionA Research Design PerspectiveThe PuzzleIn The Beginning
The “Picture” was “Motive but not Method”
Types of Individual Estimates
The DiNardo–Lee ExperimentThe RealityImportant NoteThe DiNardo – Lee Experiment – The EconometricsIs It Even Possible to Estimate a Union Wage Effect?
Did We Have The Most Salient ExperimentHow Did Unions Organize Before World War II“Threat Effect?”
Some Conclusions
A Research Design Perspective
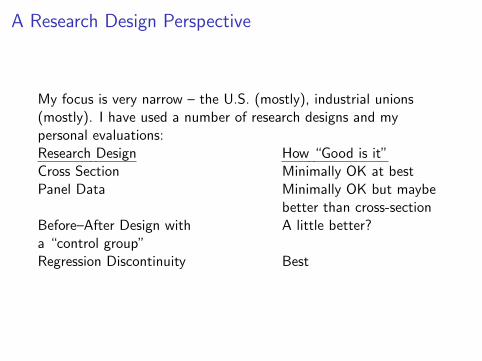
My focus is very narrow – the U.S. (mostly), industrial unions(mostly). I have used a number of research designs and mypersonal evaluations:Research Design How “Good is it”Cross Section Minimally OK at bestPanel Data Minimally OK but maybe
better than cross-sectionBefore–After Design with A little better?a “control group”Regression Discontinuity Best
The Puzzle
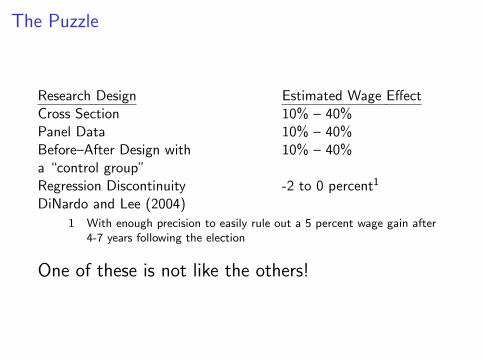
Research Design Estimated Wage EffectCross Section 10% – 40%Panel Data 10% – 40%Before–After Design with 10% – 40%a “control group”Regression Discontinuity -2 to 0 percent1
DiNardo and Lee (2004)
1 With enough precision to easily rule out a 5 percent wage gain after4-7 years following the election
One of these is not like the others!

A Research Design PerspectiveMy Resolution
There are lots of ways to resolve the puzzle.
1. Every published estimate except DiNardo and Lee (2004) isbiased.
2. Every published estimate except DiNardo and Lee (2004) isunbiased.
3. There are easy ways to reconcile such estimates. I would liketo treat both DiNardo and Lee (2004) and the others –“ceteris paribus” comparisons – seriously.
4. One immediate problem is that the interpretation of the“ceteris paribus” estimates are unclear because they are notspecific about the “manipulation” (as in “No CausationWithout Manipulation.”)
5. The ceteris paribus estimates are not merely a chimera butestimate a different (but also interesting) parameter.
6. The conclusions aren’t particularly unique.

A Research Design PerspectiveMy Resolution
Research Design Experiment or InterventionCross Section Who Knows?Panel Data A person lucky enough to
get a union job. A firmeffect. But where do theunionized jobs come from?
Before–After Design with “Abolishing Unions” I.E.a “control group” Card, Lemieux and Riddell
(2003) for Canada, theUK, and the US. DiNardoand Lemieux (1997) forthe U.S. and Canada. The“Reagan” and “Thatcher”Experiments.
Regression Discontinuity Obvious. The effect ofunionizing a singleestablishment.
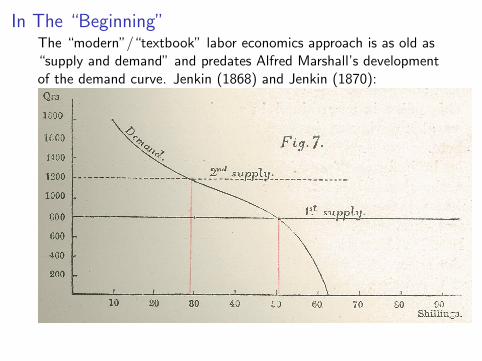
In The “Beginning”The “modern”/“textbook” labor economics approach is as old as“supply and demand” and predates Alfred Marshall’s developmentof the demand curve. Jenkin (1868) and Jenkin (1870):
In The “Beginning”
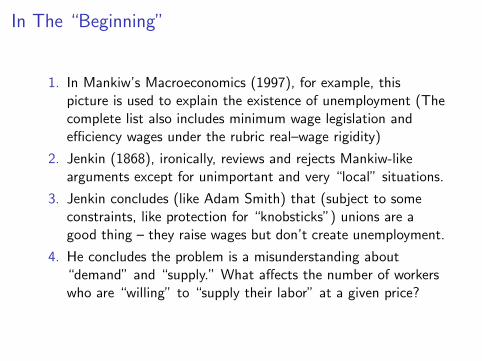
1. In Mankiw’s Macroeconomics (1997), for example, thispicture is used to explain the existence of unemployment (Thecomplete list also includes minimum wage legislation andefficiency wages under the rubric real–wage rigidity)
2. Jenkin (1868), ironically, reviews and rejects Mankiw-likearguments except for unimportant and very “local” situations.
3. Jenkin concludes (like Adam Smith) that (subject to someconstraints, like protection for “knobsticks”) unions are agood thing – they raise wages but don’t create unemployment.
4. He concludes the problem is a misunderstanding about“demand” and “supply.” What affects the number of workerswho are “willing” to “supply their labor” at a given price?

Motive but not Method
1. Although the unit of observation that would seem to be themost appropriate would be the establishment(Pencavel 1994, Freeman and Kleiner 1999) the focus hasbeen on individual level data.
2. Pre-H. Gregg Lewis’ landmark review, Friedman (1950)argued that industrial unions in the main had no effects oneither wages or employment.If they couldn’t affect the supply of labor they couldn’t doanything. They mainly existed to take credit for things thatwould have taken place anyway.
3. Lewis (1963) moved the U.S. consensus to the view thatunion wage gap was on average 15 percent.

Motive but not Method
1. Although with little empirical evidence, Freeman and Medoff(1984) argued on the basis of the overwhelming evidence ofunion wage differentials that the employment effects must besmall, essentially on the basis of Jenkin’s original diagram.
2. Some dissent on the basis that something like the “efficientcontracts” model argued that unions didn’t merely raise wagesbut acted as a way to transfer “rents” from capitalists toworkers.

Types of Individual Estimates
From Kuhn (1987) reviewing Lewis (1986)
Excluding ‘macro’ estimates, which are known to becontaminated by “extent–of–unionism” effects and havenow thankfully been superseded by estimates onindividual data, Lewis reviews three kinds of union wageeffects . . .
I OLS earnings regressions on individual, cross–sectiondata . . .
I panel studies . . .I simultaneous equation studies . . .
. . . [with these latter two studies representing essentially]attempts to solve [the problem] of ‘omitted–variables’bias.
What “Ceteris” is Paribus?
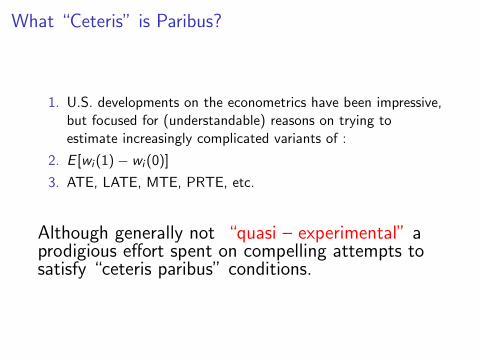
1. U.S. developments on the econometrics have been impressive,but focused for (understandable) reasons on trying toestimate increasingly complicated variants of :
2. E [wi (1) − wi (0)]
3. ATE, LATE, MTE, PRTE, etc.
Although generally not “quasi – experimental” aprodigious effort spent on compelling attempts tosatisfy “ceteris paribus” conditions.

Many, Many, Compelling Ceteris Paribus Comparisons
I Ashenfelter (1978) who constructs control groups based onindustry, race, and worker type (i.e.craftsmen, operatives,laborers)
I Freeman (1984) who compares wage rates for the sameindividual at different points in time. At one point in time theworkers is in a unionized job at a different point in time theworker is in a non–unionized job.
I Lemieux (1998) compares wage rates for the same individualwho holds two jobs, one of which is unionized, the otherwhich is not.
I Krashinsky (2004) compares wage rates of identical twins onewho is unionized and one who is not.
I Card (1992) who constructs control groups based onobservable characteristics which tend to receive the same wagein the non–union sector as well as controlling for differences inpermanent characteristics (i.e. person–specific fixed effects)

Union Wage Gaps – Always 15% – 40%
Interpretation Problem
Ceteris paribus seems to be satisfied, but theproblem is,
What is the experiment?

The DiNardo – Lee Experiment – The Reality
I In the U.S. the right of workers (not previously “unionized”)in an private sector establishment (not a firm or industry) tobargain collectively usually happens as the result of a processwhich results in workers voting in a secret ballot election.
I If fifty–percent plus 1 workers vote in favor the union, theworkers have won the right to bargain collectively. In twopapers DiNardo and Lee (2002), DiNardo and Lee (2004), weanalyze the experiment that comes from this process for theperiod 1984-2001.
I This is how most establishment became unionized since theend of World War II became to unionized.

Naieve Comparisons Look Bad for Unionization
Table II: Means of Establishment and Election Outcomes and Characteristics, by Representation Election Outcome, 1983-1999
N Full Sample Union Loss Union Win Difference
1 Survival (Indicator Variable), 2001 27622 0.417 0.430 0.400 -0.030(0.003) (0.004) (0.005) (0.006)
2 Employment, 2001 26355 83.4 88.3 76.8 -11.5(1.7) (2.2) (2.7) (3.5)
3 Log of Employment, 2001 10265 4.42 4.51 4.30 -0.22(0.01) (0.02) (0.02) (0.03)
4 Sales Volume, 2001 25719 14225 16250 11501 -4750(321) (454) (441) (633)
5 Log of Sales Volume, 2001 9629 9.34 9.48 9.14 -0.35(0.02) (0.02) (0.03) (0.04)
6 Presence of Union Post-Election 11532 0.206 0.097 0.363 0.266(Indicator Variable) (0.004) (0.004) (0.007) (0.005)
7 Presence of Union Pre-Election 11532 0.129 0.095 0.179 0.084(Indicator Variable) (0.003) (0.004) (0.006) (0.005)
8 Number of Eligible Voters 27622 104.1 113.4 91.6 -21.8(0.8) (1.2) (1.1) (1.6)
9 Log of Eligible Voters 27622 4.22 4.29 4.14 -0.15(0.01) (0.01) (0.01) (0.01)
10 Number of Votes Cast 27622 91.7 101.9 78.0 -23.9(0.7) (1.0) (0.9) (1.4)
11 Log of Votes Cast 27622 4.10 4.18 3.99 -0.19(0.01) (0.01) (0.01) (0.01)
12 Manufacturing Sector (Indicator Variable) 27622 0.380 0.421 0.326 -0.094(0.003) (0.004) (0.004) (0.006)
13 Service Sector (Indicator Variable) 27622 0.273 0.218 0.348 0.130(0.003) (0.003) (0.004) (0.005)
14 Trucking Voting Unit (Indicator Variable) 27622 0.150 0.174 0.119 -0.055(0.002) (0.003) (0.003) (0.004)
15 Log of State Employment, Election Year 27622 15.08 15.06 15.10 0.04(0.01) (0.01) (0.00) (0.01)
16 Log of State Employment, 2000 27622 15.19 15.18 15.21 0.04(0.01) (0.01) (0.02) (0.02)
17 Change In Log Emp. (2000 - Election Year) 27622 0.115 0.117 0.113 -0.005(0.001) (0.001) (0.008) (0.008)
18 State Unemployment Rate, Election Year 27622 6.23 6.24 6.22 -0.02(0.01) (0.02) (0.02) (0.02)
19 State Unemployment Rate, 2000 27622 4.14 4.11 4.17 0.06(0.01) (0.01) (0.01) (0.01)
20 Change in UR (2000 - Election Year) 27622 -2.09 -2.13 -2.04 0.08(0.01) (0.01) (0.02) (0.02)
Note: Standard errors in parentheses. Details of the merged data from the NLRB, FMCS, and InfoUSA are in the Data Appendix.Rows 2 and 4 impute 0 for non-surviving establishments (some data are missing for surviving esetablishments). Rows 6 and 7contain only the establishments that survive to the year 2001. Presence of Union post-election (pre-election) indicates whether ornot a union at the location of the establishment filed a contract expiration between the election date and 2001 (between thebeginning of the FMCS data and the date of the election).

Important Note
1. The NLRB is often described as an important “beginning”,but in some ways was it “the end” (Freeman 1998). More onthis later.
2. For example, striker replacement de facto legal since 1938(Mackay decision)
3. Employer under no requirement except to “bargain in goodfaith.” No legal mechanism to “force” employer to changehis/her behavior in any way.
4. With later legislation, essentially limited legal union organizingeffectively to “one (or a few) establishments at a time.”
5. No election is actually required. (Eaton andKriesky 2001, Budd and Heinz 1996)
Sidenote
I A “bizarre provision” (McCulloch and Bornstein 1974) in thelaw creating the National Labor Relations Board (NLRB) (thebody that conducts union recognition elections) is that itmust refrain from employing “individuals for the purpose of. . . economic analysis”!1
I The law also creates “laboratory conditions” for ourexperiment.
1The history of the provision is obscure, but may have to do with allegationsof “communist” influence. (Gross 1974, McCulloch and Bornstein 1974)

The DiNardo – Lee Experiment – The Econometrics
I This reality comes close to an “ideal” randomized controlledtrial for those firms who have a probability of facing a ”close”vote.
I Two sets of otherwise similar firms – one by chance becomesunionized, the other one, by chance, is not.
I Plenty of over–identification tests – all pass.

The Picture
Plot E [Outcome|Vote Share = specific value]
If plot is smooth through 50%, there is no effect.If plot “jumps” at 50 percent, the vertical height at the 50%vote share is the causal effect.
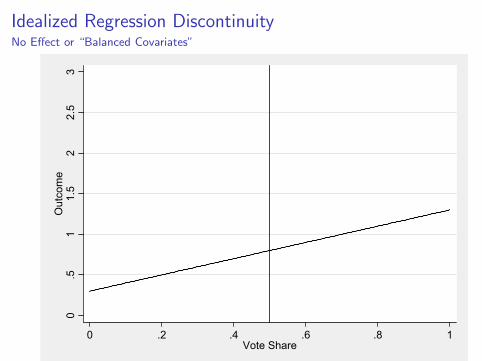
Idealized Regression DiscontinuityNo Effect or “Balanced Covariates”
0.5
11.
52
2.5
3O
utco
me
0 .2 .4 .6 .8 1Vote Share
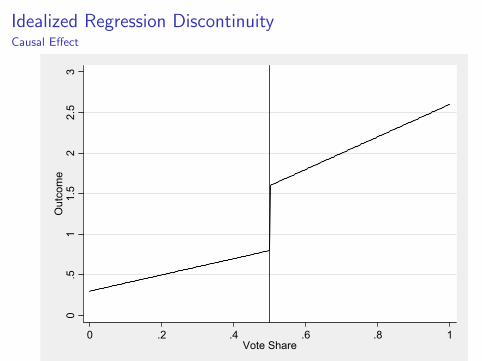
Idealized Regression DiscontinuityCausal Effect
0.5
11.
52
2.5
3O
utco
me
0 .2 .4 .6 .8 1Vote Share

What is identified by the experiment?
B 0 : Law Prohibits UnionsBM : Law Allows Unions, No ElectionB N : Law Allows Unions, Election Held, Union LosesB U : Law Allows Unions, Election Held, Union Wins
B 0 (V)
B M (V)B N (V)
B U (V)
50%Vote Share (How Workers Would Vote)
Bar
gain
ing
Pow
er o
f W
orke
rs
Direct Impact
Indirect Impact(Threat)
Impact of Permitting Unions
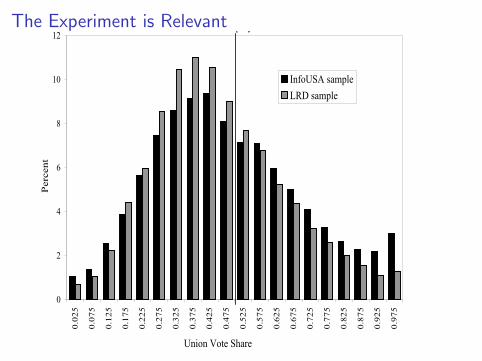
The Experiment is Relevant
0
2
4
6
8
10
12
0.02
5
0.07
5
0.12
5
0.17
5
0.22
5
0.27
5
0.32
5
0.37
5
0.42
5
0.47
5
0.52
5
0.57
5
0.62
5
0.67
5
0.72
5
0.77
5
0.82
5
0.87
5
0.92
5
0.97
5
InfoUSA sampleLRD sample
gTheoretical Relation Between Employer Outcome and Vote Share
Union Vote Share
Perc
ent
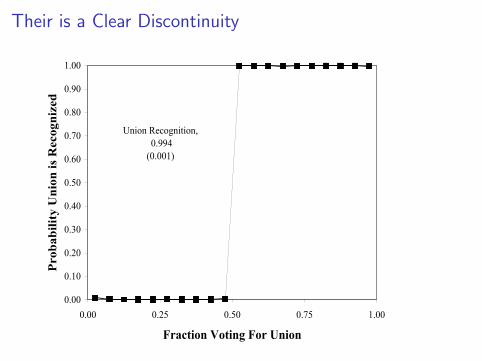
Their is a Clear Discontinuity
Union Recognition, 0.994 (0.001)
0.00
0.10
0.20
0.30
0.40
0.50
0.60
0.70
0.80
0.90
1.00
0.00 0.25 0.50 0.75 1.00
Fraction Voting For Union
Prob
abili
ty U
nion
is R
ecog
nize
d

Is It Even Possible to Estimate a Union Wage Effect? I
In general, the answer is No if the world looks likes a variant ofJenkin’s picture where “above market” rates lead to establishmentfailure.
1. To make this clear, suppose the experiment was randomlyallow a subset of workplaces where the union would win avote if it conducted.
2. In principle, you would like to compare the wages at thoseplants where unions were allowed to those where they werenot.
3. Further suppose unions “kill the goose that lays the goldenegg.”

Is It Even Possible to Estimate a Union Wage Effect? II
4. If that is true, you are only able to estimate the effect ofunionization on survival. You couldn’t estimate a wage effectbecause the remaining unionized firms would be a selectedexample (you might be able to bound the wage premium.)
5. You can only look at the treatment effect on wages if firmshave no impact on survival.
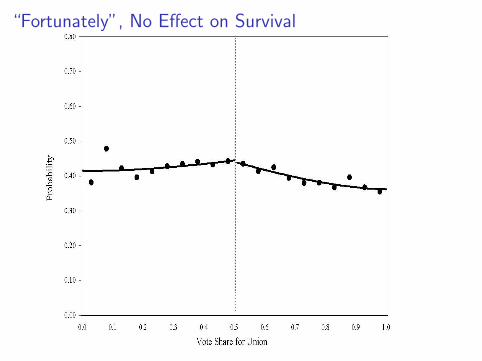
“Fortunately”, No Effect on Survival

No Effect on Output
3.50
3.75
4.00
4.25
4.50
4.75
5.00
5.25
5.50
0.00 0.25 0.50 0.75 1.00-0.50
-0.25
0.00
0.25
0.50
0.75
1.00
1.25
1.50
Pre-ElectionPost-ElectionPost-Election minus Pre-Election Mean
Log
(Out
put/
Hou
r)
Union Vote Share
De-m
eaned Log(O
utput/hour)
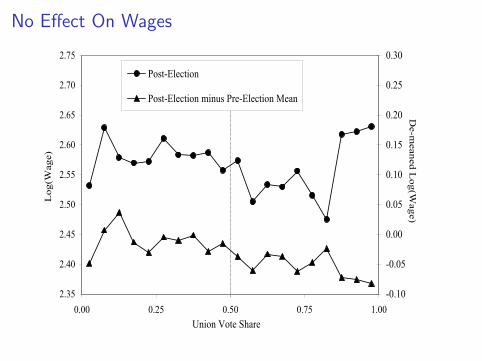
No Effect On Wages
2.35
2.40
2.45
2.50
2.55
2.60
2.65
2.70
2.75
0.00 0.25 0.50 0.75 1.00-0.10
-0.05
0.00
0.05
0.10
0.15
0.20
0.25
0.30
Post-Election
Post-Election minus Pre-Election Mean
Figure IXb: Log(Production Hourly Wage), Pre- and Post-Election, by Union Vote Share, LRD
Log
(Wag
e)
Union Vote Share
De-m
eaned Log(W
age)
election and post-election periods, see note to Figure VIII.

What we should have expected to seewith a 15% differential
2.35
2.40
2.45
2.50
2.55
2.60
2.65
2.70
2.75
0.00 0.25 0.50 0.75 1.00-0.10
-0.05
0.00
0.05
0.10
0.15
0.20
0.25
0.30
Post-Election
Post-Election minusPre-Election Mean
Figure IXb: Log(Production Hourly Wage), Pre- and Post-Election, by Union Vote Share, LRD
Log
(Wag
e)
Union Vote Share
De-m
eaned Log(W
age)
election and post-election periods, see note to Figure VIII.

Surprise?
No effects on:
1. Establishment survival
2. Sales
3. Productivity
4. Total man-hours
5. etc.
6. Wages
Did We Have the Most Salient Experiment
I Arguably yes – at least since the end of World War II.
I Over significant business opposition, unions were “allowed” toorganize under NLRB regime.

Sidenote: Are Unions Less Popular Now

How Did Unions Organize Before World War II
Most unionization before World War II was far less voluntary.
0
5
10
15
20
25
30
35
40
1880
1884
1888
1892
1896
1900
1904
1908
1912
1916
1920
1924
1928
1932
1936
1940
1944
1948
1952
1956
1960
1964
1968
1972
1976
1980
1984
1988
1992
1996
2000
2004
Perc
en
t
DiNardo - Lee Sample Period
Lawrence, MA -- IWW Strike
Ford Hunger March Sitdown Strikes
Steel Strike of 1919
Pearl Harbor Attack
Recognition Without Elections or even “Card Checks”
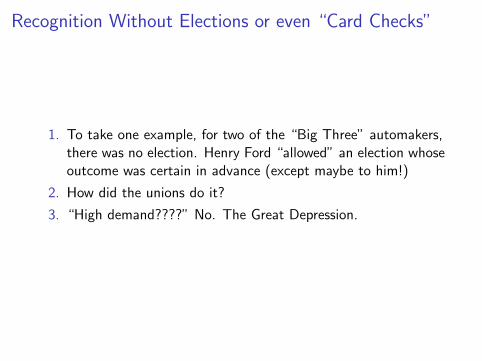
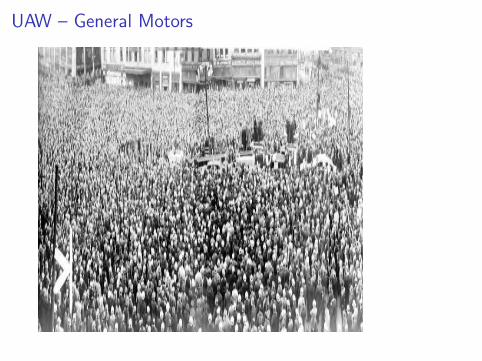
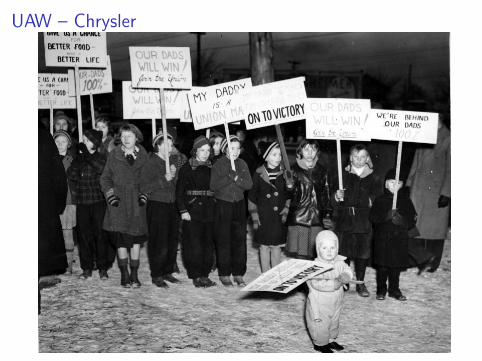
1. To take one example, for two of the “Big Three” automakers,there was no election. Henry Ford “allowed” an election whoseoutcome was certain in advance (except maybe to him!)
2. How did the unions do it?
3. “High demand????” No. The Great Depression.
UAW – General Motors
UAW – Chrysler
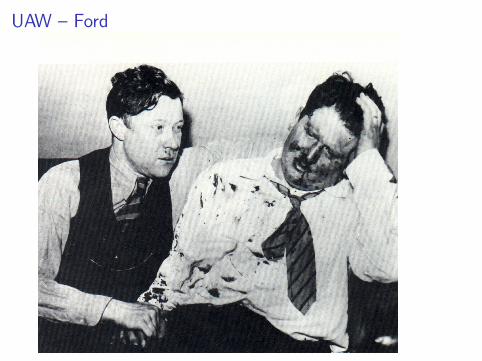
UAW – Ford

A Little Help from World War IIand less help from the NLRB
World War II may have “helped” prevent a quick “slide back” topre–existing expectations.(Freeman 1998)
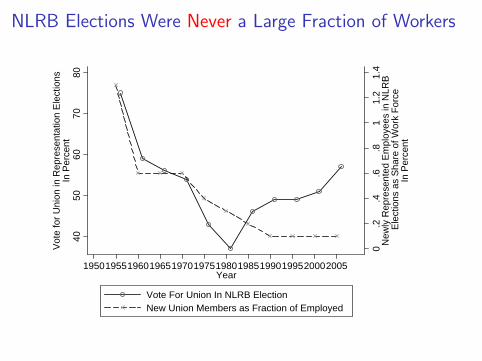
NLRB Elections Were Never a Large Fraction of Workers
0.2
.4.6
.81
1.2
1.4
New
ly R
epre
sent
ed E
mpl
oyee
s in
NLR
B E
lect
ions
as
Shar
e of
Wor
k Fo
rce
In P
erce
nt
4050
6070
80
Vote
for U
nion
in R
epre
sent
atio
n El
ectio
nsIn
Per
cent
195019551960196519701975198019851990199520002005Year
Vote For Union In NLRB ElectionNew Union Members as Fraction of Employed

Threat Effects
1. NLRB elections aren’t/weren’t a serious threat.
2. When we tried assessing whether wages rise in response to anelection, even when the union eventually loses the pointestimates are small and statistically insignificant, ruling out,for example, a 3 percent union wage “threat” effect, 3 yearsafter the election.
3. Perhaps of the action is with “threat” effects but not of thetype usual envisioned.
4. What affects “the willingness to supply labor” at a givenwage?
5. Why has “voluntary recognition” or card–check become morecommon? (Schmitt and Zipperer 2007) To minimize “cost” oforganizing.

Has Management Opposition Technology Gotten Better?
01
23
4
1951
1955
1959
1963
1967
1971
1975
1979
1983
1987
1991
1995
1999
2003
Year
UnadjustedAdjusted for Card Check
In P
erce
ntP
ro−
Uni
on W
orke
rs F
ired
Dur
ing
Cam
paig
n

Lots of Theories
I The traditional models are fragile –(Jenkin 1870, Manning 1994) “Putty–Clay” versus “Putty –Putty.” Other models:
I Skaperdas (1992) — Conflict Technology.
I Acemoglu and Robinson (2000) — Why Did the West Extendthe Franchise?
I How to put these propositions to a “severe” test?

Some Conclusions
1. The effect of unions organizing a single establishment is zeroin terms of wages, productivity, etc. that the firm must pay.(May have other effects – working on these.)
2. One way to think about conventional “ceteris paribus” unionwage effects is that they are “contaminated” by a “firm” or“industry” fixed effect.
3. But where do these fixed effects come from?
4. Labor Unions?
References I
Acemoglu, Daron and James A. Robinson, “Why Did the WestExtend the Franchise? Inequality and Growth in HistoricalPerspective,” Quarterly Journal of Economics, November2000, 115 (4), 1167–1199.
Ashenfelter, Orley, “Union Relative Wage Effects, New Evidence,and a Survey of Their Implications for Wage Inflation,” inR. Stone and W. Peterson, eds., Economic Contributions toPublic Policy, MacMillan Press, 1978.
Budd, John W. and Paul K. Heinz, “Union representationelections and labor law reform: lessons from the MinneapolisHilton,” Labor Studies Journal, Winter 1996, 20 (4), 3–18.
Card, David, “The Effect of Unions on the Distribution of Wages:Redistribution or Relabelling?,” NBER Working Paper 4195,National Bureau of Economic Research, Cambridge, MA.October 1992.
References II
, Thomas Lemieux, and Craig W. Riddell, “Unionizationand Wage Inequality: A Comparative Study of the U.S., U.K.and Canada,” Working Paper 9473, National Bureau ofEconomic Research, Cambridge, MA February 2003.
DiNardo, John and David S. Lee, “The Impact of Unionizationon Establishment Closure: A Regression Discontinuity Analysisof Representation Elections,” Working Paper 8993, NationalBureau of Economic Research June 2002.and , “Economic Impacts of New Unionization on Private
Sector Employers: 1984-2001,” Quarterly Journal ofEconomics, November 2004, 119 (4), 1383 – 1441.and Thomas Lemieux, “Diverging Male Wage Inequality in
the United States and Canada, 1981–1988: Do InstitutionsExplain the Difference?,” Industrial and Labor RelationsReview, August 1997.

References III
Eaton, Adrienne E. and Jill Kriesky, “Union Organizing underNeutrality and Card Check Agreements,” Industrial and LaborRelations Review, October 2001, 55 (1), 42–59.
Freeman, Richard, “Longitudinal Analysis of the Effects of TradeUnions,” Journal of Labor Economics, 1984, 2, 1–26.
Freeman, Richard B., “Spurts in Union Growth: DefiningMoments and Social Processes,” in Michael D.Bordo, ClaudiaGoldin, and Eugene N.White, eds., The Defining Moment:The Great Depression and the American Economy in theTwentieth Century, Chicago and London: University ofChicago Press, 1998, National Bureau of Economic ResearchProject Report Chapter 8, pp. 265–295.and James L. Medoff, What Do Unions Do?, New York:
Basic Books, 1984.and Morris M. Kleiner, “The Impact of New Unionization
on Wages and Working Conditions,” Journal of LaborEconomics, January 1990, 8 (1, Part 2), S8–S25.

References IV
and , “Do Unions Make Enterprises Insolvent,” Industrialand Labor Relations Review, July 1999, 52 (4), 510–527.
Friedman, Milton, “Some Comments on the Significance of LaborUnions for Economic Policy,” in David McCord Wright, ed.,The Impact of the Union: Eight Economic Theorists Evaluatethe Labor Union Movement, New York: Harcourt, Brace andCompany, 1950. Institute on the Structure of the LaborMarket, American University, Washington D.C.
Gross, James A., The Making of the National Labor RelationsBoard; A Study in Economics, Politics, and the Law1933–1937, New York: New York University Press, 1974.
Jenkin, Fleeming, “Trade–unions: how far legitimate?,” in S. C.Colvin and J. A. Ewing, eds., Papers, Literary, Scientific, &cby the late Fleeming Jenkin, Vol. 2, London: Longmans,Green & Co., 1868. Originally published in the North BritishReview March, 1868.
References V
, “The graphic representation of the laws of supply anddemand, and their application to labour,” in S. C. Colvin andJ. A. Ewing, eds., Papers, Literary, Scientific, &c by the lateFleeming Jenkin, Vol. 2, London: Longmans, Green & Co.,1870.
Krashinsky, Harry A., “Do Marital Status and Computer UsageReally Change the Wage Structure?,” Journal of HumanResources, Summer 2004, 3 (3), 774–791.
Kuhn, Peter, “[A Review] of Union Relative Wage Effects: ASurvey,” Canadian Journal of Economics, May 1987, 20 (2),416–419.
LaLonde, Robert J. and Bernard D. Meltzer, “Hard Times forUnions: Another Look at the Significance of EmployerIllegalities,” University of Chicago Law Review, 1991, 58,953–1014.

References VI
Lemieux, Thomas, “Estimating the Effects of Unions on WageInequality in a Panel Data Model with Comparative Advantageand Non–Random Selection,” Journal of Labor Economics,1998, 16, 261–291.
Lewis, H. Gregg, Unionism and relative wages in the UnitedStates, Chicago: University of Chicago Press, 1963., Unionism relative wage effects: A Survey, Chicago:University of Chicago Press, 1986.
Mankiw, N. Gregory, Macroeconomics, 3rd ed., New York:Worth Publishers, 1997.
Manning, Alan, “How Robust Is the Microeconomic Theory ofthe Trade Union?,” Journal of Labor Economics, July 1994, 12(3), 430–459.
McCulloch, Frank W. and Tim Bornstein, The National LaborRelations Board, New York: Praeger, 1974.
Pencavel, John, Labor Markets Under Trade Unionism,Cambridge, MA: Blackwell, 1994.

References VII
Schmitt, John and Ben Zipperer, “Dropping the Ax: IllegalFirings During Union Election Campaigns,” CEPR ResearchReport, Center for Economic and Policy Research,Washington, D.C. January 2007.
Skaperdas, Stergios, “Cooperation, Conflict, and Power in theAbsence of Property Rights,” American Economic Review,September 1992, 82 (4), 720–739.