the challenge of meeting canada’s greenhouse gas reduction targets
TRANSCRIPT

Energy Policy 39 (2011) 1352–1362
Contents lists available at ScienceDirect
Energy Policy
0301-42
doi:10.1
n Corr
E-m
journal homepage: www.elsevier.com/locate/enpol
The challenge of meeting Canada’s greenhouse gas reduction targets
Larry Hughes n, Nikhil Chaudhry
Energy Research Group, Electrical and Computer Engineering, Dalhousie University, Halifax, Nova Scotia, Canada
a r t i c l e i n f o
Article history:
Received 8 July 2010
Accepted 3 December 2010Available online 5 January 2011
Keywords:
Emissions reduction
Resource availability
Climate change
15/$ - see front matter & 2010 Elsevier Ltd. A
016/j.enpol.2010.12.007
esponding author.
ail address: [email protected] (L. Hughes).
a b s t r a c t
In 2007, the Government of Canada announced its medium- and long-term greenhouse gas (GHG) emissions
reduction plan entitled Turning the Corner, proposed emission cuts of 20% below 2006 levels by 2020 and
60–70% below 2006 levels by 2050. A report from a Canadian government advisory organization, the National
Round Table on Environment and Economy (NRTEE), Achieving 2050: A carbon pricing policy for Canada,
recommended ‘‘fast and deep’’ energy pathways to emissions reduction through large-scale electrification of
Canada’s economy by relying on a major expansion of hydroelectricity, adoption of carbon capture and
storage for coal and natural gas, and increasing the use of nuclear.
This paper examines the likelihood of the pathways being met by considering the report’s proposed
energy systems, their associated energy sources, and the magnitude of the changes. It shows that the
pathways assume some combination of technological advances, access to secure energy supplies, or rapid
installation in order to meet both the 2020 and 2050 targets. This analysis suggests that NRTEE’s projections
are optimistic and unlikely to be achieved.
The analysis described in this paper can be applied to other countries to better understand and develop
strategies that can help reduce global greenhouse gas emissions.
& 2010 Elsevier Ltd. All rights reserved.
1. Introduction
In 2008, Canada’s greenhouse gas emissions were 734 Mt CO2e,23.9% above 1990 levels and 31.9% above the country’s Kyoto target(Environment Canada, 2010c). The Canadian federal government,like many others around the world, realizing that achieving its Kyototarget was impossible, changed the rules and introduced new emis-sions reduction targets in 2007 (ecoAction, 2007). The new targets,described in a report entitled Turning the Corner, proposed cuts of20% below 2006 levels by 2020 and 60–70% below 2006 by 2050(ecoAction, 2009, 2008c, 2008b).
In response to these new targets, the National Round Table onthe Environment and the Economy (NRTEE), an arms-lengthCanadian government environmental advisory organization, pro-duced a series of reports outlining how the two proposed emissioncuts could be met; NRTEE chose 65% as the 2050 target. The finaltwo reports focused on implementation, with one report on carbontaxes and cap-and-trade (NRTEE, 2009a) and the second on a set ofenergy pathways with decadal targets culminating in 2050 (NRTEE,2009b). The pathways resulted from an analysis of various non-carbon energy sources for the generation of electricity and theirimplementation between 2010 and 2050 (Nyboer, 2008).
Although NRTEE’s analysis suggests that by 2050 the targets canbe reached, there has been no published assessment of whether the
ll rights reserved.
decadal targets are realistic, either in terms of the energy requiredto meet the expected demand or the time available to implement(and in some cases, develop) the necessary infrastructure. Theseomissions mean that a lack of energy or insufficient time in any ofthe proposed pathways could result in the 2050 reduction targetnot being reached. Furthermore, by employing electricity alone tomeet the end-use energy needs of most energy services (i.e., on-demand electricity, heating and cooling, and transportation), thetechnical analysis overlooks other technologies that could reducegreenhouse gas emissions at potentially lower costs.
This paper examines each of the energy sources in NRTEE’sproposed ‘‘fast and deep’’ pathways, in terms of Canada’s historic useof the energy source (that is, both supply and infrastructure), theplanned growth of the source, and the energy required for the source.Crucial issues unique to each energy source are also discussed in orderto explain any potential limitations or shortcomings. Economic issuesare not considered as these have been discussed at length in theoriginal reports. The objective of the paper is to examine the proposedpathways; economic costs, carbon pricing, and possible alternativesto NRTEE’s pathways are considered only in passing.
2. NRTEE’s ‘‘fast and deep’’ pathways
In addition to carbon taxes and cap-and-trade as a means ofencouraging a reduction in energy consumption, the report’s ‘‘fastand deep’’ energy pathways recognized the need to replace

L. Hughes, N. Chaudhry / Energy Policy 39 (2011) 1352–1362 1353
existing—and restrict new—demand to non-carbon emittingenergy sources (Hughes, 2009b). There are five energy pathwaysproposed: hydroelectricity, wind, other renewables, nuclear, andcoal and natural gas with carbon capture and storage (CCS). Thesepathways are expected to grow over the four decades between2010 and 2050, as non-electric energy sources are replaced withones that are electric. Table 1 shows the historic (that is, actual datafor 2008) generation of electricity from NRTEE for each of thepathways in 2008 and the projected generation for each pathwayevery ten years, starting in 2020 and ending in 2050.
The pathways are based on the assumption that Canada willhave an electric future with electricity coming from a limitednumber of generation sources, over 90% of which will be derivedfrom hydroelectricity, coal and natural gas with CCS, and nuclear.The electricity produced is intended to replace existing demandfrom carbon-emitting energy sources such as fuel oil, natural gas,and biomass, as well as to ensure that new demand is restricted toelectricity generated from non-carbon sources (including carboncapture and storage). By 2020, greenhouse gas emissions are to be20% below 2006 levels and by 2050 they are to be 65% lower than2006 levels; much of this is attributable to changes in the wayexisting non-CCS coal and natural gas generation is replaced withcoal and natural gas generation relying on CCS (see Table 2). Thesechanges are not considered pathways and therefore not listed inTable 1; the generation of electricity from non-CCS sources isdiscussed further in Section 3.5.
There are differences between NRTEE’s 2008 data (Table 1 and 2)and that collected by Statistics Canada for 2008 (Statistics Canada,
Table 1NRTEE’s pathways for electrical generation to 2050 (NRTEE, 2009b, p. 94).
Pathway Historic(TWh)
Total generation (TWh)
2008 2020 2030 2040 2050
Hydroelectricity 373.0 505 633 759 890
Wind 1.8 33 63 91 110
Other renewables 5.4 3 7 10 13
Nuclear 88.6 124 168 204 232
Coal and natural gas with CCS 0 62 193 328 456
Total generation 468.8 868 1166 1445 1712
Table 2NRTEE’s changes in coal and natural gas with and without CCS consumption (NRTEE,
2009b; Nyboer, 2008).
Demand (TWh) Growth (TWh)
2008 2020 2050 2008–2020 2008–2050
Coal without CCS 111 112 5 1 �106
Natural gas without CCS 23 26 6 3 �17
Coal and gas with CCS 0 62 456 62 456
Table 3Differences in 2008 data: NRTEE and Statistics Canada.
Source NRTEE StatisticsCanada
Explanation
Hydroelectric 373 377 NRTEE excludes industrial generation
Nuclear 89 91 NRTEE excludes industrial generation
Non-CCS coal 111 104 NRTEE groups coal (104.6 TWh) with
diesel and light oil (0.6 TWh) and
heavy fuel oil (5.7 TWh)
Non-CCS
natural gas
23 31 NRTEE excludes industrial generation
2010), upon which NRTEE has based its 2008 data; with the exceptionof non-CCS coal, this is attributable to NRTEE’s apparent decision toexclude industrial electrical generation from future pathways (seeTable 3). In the case of non-CCS coal, NRTEE includes coal (capacity,generation, and emissions) with diesel and both light and heavyfuel oils.
3. An analysis of the pathways
Each of NRTEE’s proposed energy pathways is now examinedin detail. For each pathway, the historic growth rates and thenecessary future growth rates to meet the short-term 2020 targetsand long-term 2050 targets are considered. This analysis maintainsthe report’s approach of referring to production (TWh) rather thancapacity (MW).
3.1. Hydroelectricity
Hydroelectricity presently meets about 60% of Canada’s elec-tricity needs (Canadian Hydropower Association, 2003). According toNRTEE’s projections, hydroelectricity will remain the largest con-tributor to electrical supply in Canada by 2050. Fig. 1 shows bothCanada’s historical (1950–2008) and the report’s projected hydro-electric production over four decades between 2010 and 2050.
In 2008, Canada produced 373 TWh from hydroelectricity; by2050, the report expects Canada’s hydroelectric production to reach890 TWh per year, meaning that between 2010 and 2050, Canada’soverall hydroelectric production must increase by 517 TWh. This fallswithin the Canadian Hydropower Association’s ‘‘economically feasi-ble’’ potential new hydroelectric facilities in Canada shown in Table 4.
The largest post-war ten-year period of expansion in Canada’shydroelectric production was between 1965 and 1974, when about93 TWh of hydroelectric production was added. Much of the signi-ficant growth ended in the early 1980s with the completion of projectsstarted in the 1970s. Hydro Quebec’s James Bay projects in the 1980sand 1990s resulted in other periods of decadal growth.
Fig. 1. Historical and projected hydroelectric production (Statistics Canada, 2009a,
2009b).
Table 4Canadian hydroelectric potential (Canadian Hydropower Association, 2003).
Hydroelectric potential Production (TWh/year)
Gross theoretical 1332
Technically feasible 981
Economically feasible 536

L. Hughes, N. Chaudhry / Energy Policy 39 (2011) 1352–13621354
Between 1950 and 2008, the average increase in Canadian hydro-electric production was 50.6 TWh per decade; to meet the greenhouseemissions reduction targets described in its report, NRTEE requiresproduction growth of about 130 TWh per decade. The differencein decadal growth, both historic and projected, is shown in Fig. 2.The proposed increase of 130 TWh of new hydroelectric productionper decade exceeds both the 1950–2008 decadal average and the1965–1974 increase of 93 TWh. Although adding 517 TWh of newhydroelectric production may be economically feasible, whether itcan be achieved over four decades is unclear.
It has been argued that since Canada is a wealthy nation and itsGDP per capita has grown considerably since the Second World War,adding sufficient hydroelectric capacity to supply an additional517 TWh over 40 years should be achievable (Dooley, 2010). Thisargument discounts the rising cost of commodities required for theconstruction of new hydroelectric facilities and does not recognize themyriad of other financial pressures facing both federal and provincialCanadian governments, including rising health care costs, an ageingpopulation, pension shortfalls, and increasing government debt.
A summary of the major hydroelectric projects in Canadaintended for the 2010–2020 timeframe is shown in Table 5.
Fig. 2. Decade-over-decade growth in Canadian hydroelectric production (Statistics
Canada, 2009a).
Table 5Major Canadian hydroelectric projects for 2010–2020 (‘e’—estimate).
Company and projects MW TWh Completion
BC Hydro (BC Hydro, n.d.)
Site C 900 4.6 2020
Revelstoke Unit 5 500 2e 2010
G.M. Shrum 90 1e 2012–2012
Mica units 4 and 5 3.6e 2013–2015
Manitoba Hydro (Adams, 2008)
Keeyask 625 4.43 2017
Conawapa 1250 7 2020
Wuskwatim 200 1.52 2011
Ontario Power Generation (OPG, 2009c)
Beck expansion 1.6 2010
Hydro Quebec (Hydro Quebec, 2009; Lafortune, 2010)
Romaine 1550 8 2009–2020
Eastmain-1-A/Sarcelle/Rupert 918 8.7 2011–2012
Magpie complex 850 3.8 42015
Petit-Mecatina complex 1200 5.5 42015
Tabaret 132 0.6 42015
Newfoundland and Labrador Hydro (Newfoundland and Labrador, 2007)
Lower Churchill 2825 16.7 2015–2017
Total 69.1
A total of 69 TWh of new production from major hydroelectricprojects is to be added this decade; the likelihood of a number ofsmaller projects in British Columbia and Ontario may bring thetotal to about 70 TWh (in its review of new Canadian energysources to 2020, Canada’s National Energy Board projects anincrease of an additional 50 TWh from a number of hydroelectricprojects, which includes those listed in Table 5 (NEB, 2007).
NRTEE’s 2020 target for new hydroelectric production in Canada is132 TWh. If the projects listed in Table 5 can be achieved by theirexpected completion dates, an additional 70 TWh of production willbe added, meaning that there is a shortfall of about 62 TWh. As aresult, rather than requiring an average of 130 TWh of new hydro-electric production per decade between 2020 and 2050, each ensuingdecade will require an average of 150 TWh of new production.
There are other issues that may limit the required growth inhydroelectricity to meet the planned greenhouse gas emissionreduction targets. Perhaps the most serious are the expectedchanges in the hydrological cycle caused by climate change overthe next 40 years (NRCan, 2004). Results from the Coupled GlobalClimate Model developed by Environment Canada show increasesin average annual temperature across Canada, including thosewhere hydroelectric dams are situated; rising temperatures willlead to increased evaporation, reducing the volume of wateravailable for electrical generation. The model has projected thatwith a 2 1C global warming, Ontario’s Niagara and St. Lawrencehydropower generation would decline by 25–35%, resulting inannual losses of $240–350 million (CDN) at 2002 prices (Buttleet al., 2004). In some locations, evaporation losses may be offset byincreased precipitation; however, if winter precipitation falls asrain rather than snow, icepacks may diminish in size, leading to lesswater (from melting ice and snow) available during the summermonths for electrical generation. Other studies suggest that drierand warmer conditions could result in lower electricity exports tothe United States due to a decline in the availability of hydroelec-tricity for export and higher consumption of electricity for airconditioning during the summer (NEB, 2007).
Federal and provincial regulations subject energy projects to moreintensive environmental scrutiny than in previous decades and,unlike in the past, require that Canada’s First Nations be consulted.These regulations, though necessary, can delay the completion ofprojects and result in significant changes to their size and scope.
3.2. Wind
In addition to hydroelectricity, wind-generated electricity is seenby many as a way of reducing greenhouse gas emissions. To date,wind has made limited penetration in Canada and is confined to a fewregions, most prominently southern Alberta, parts of eastern Quebec,and Prince Edward Island. Existing and projected electricity produc-tion from the wind since 1990 in Canada is shown in Fig. 3.
The historic and projected growth in wind-electricity produc-tion is shown in Table 6. The production increase between 1990 and2008 appears large because the starting production (and capacity)was slight; the growth between 2008 and 2020 is over 1700%because of the small production base (about 1.77 TWh) and thelarge target production volume (over 31 TWh). From 2020onwards, the growth appears modest in percentage terms but isstill large in terms of production volume increases. Given that theexpected life of most wind turbines is 20–25 years, it is likely thatmany of the turbines being installed early in this process will needto be replaced in later years; these numbers are not included in thetotals, but will increase the number of turbines required.
NRTEE’s proposed decadal growth in wind electricity produc-tion for Canada should be compared with wind’s decadal increasein other countries in order to obtain an understanding of the size of
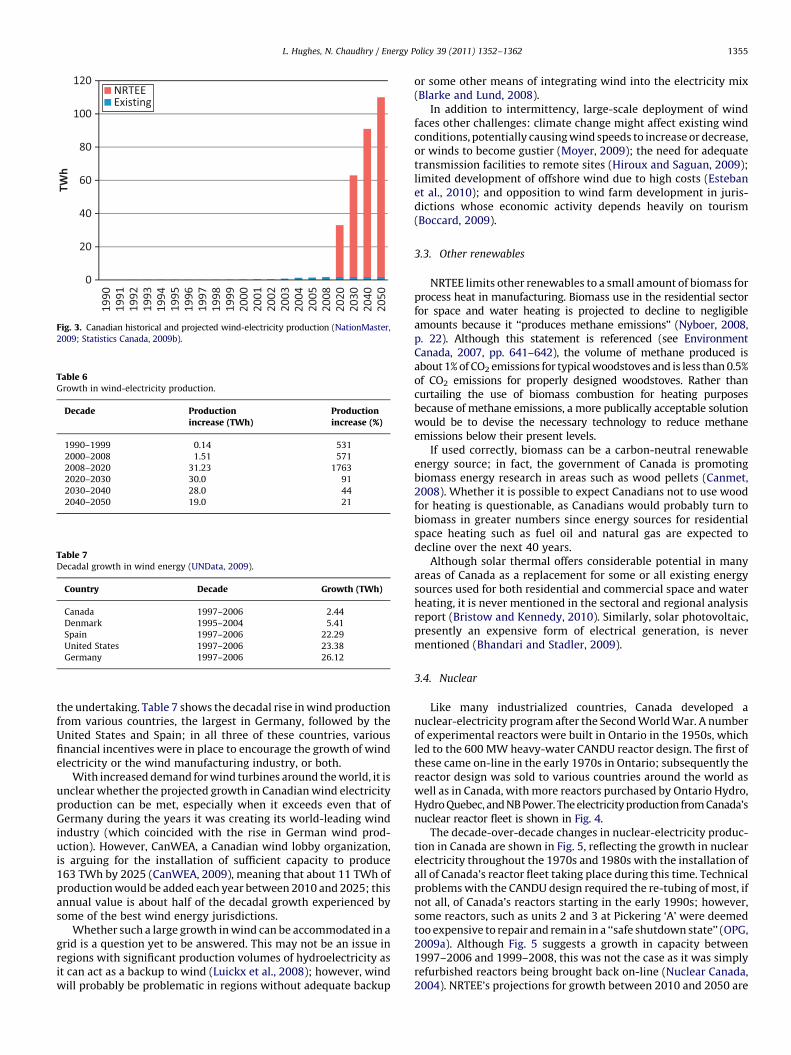
Fig. 3. Canadian historical and projected wind-electricity production (NationMaster,
2009; Statistics Canada, 2009b).
Table 6Growth in wind-electricity production.
Decade Productionincrease (TWh)
Productionincrease (%)
1990–1999 0.14 531
2000–2008 1.51 571
2008–2020 31.23 1763
2020–2030 30.0 91
2030–2040 28.0 44
2040–2050 19.0 21
Table 7Decadal growth in wind energy (UNData, 2009).
Country Decade Growth (TWh)
Canada 1997–2006 2.44
Denmark 1995–2004 5.41
Spain 1997–2006 22.29
United States 1997–2006 23.38
Germany 1997–2006 26.12
L. Hughes, N. Chaudhry / Energy Policy 39 (2011) 1352–1362 1355
the undertaking. Table 7 shows the decadal rise in wind productionfrom various countries, the largest in Germany, followed by theUnited States and Spain; in all three of these countries, variousfinancial incentives were in place to encourage the growth of windelectricity or the wind manufacturing industry, or both.
With increased demand for wind turbines around the world, it isunclear whether the projected growth in Canadian wind electricityproduction can be met, especially when it exceeds even that ofGermany during the years it was creating its world-leading windindustry (which coincided with the rise in German wind prod-uction). However, CanWEA, a Canadian wind lobby organization,is arguing for the installation of sufficient capacity to produce163 TWh by 2025 (CanWEA, 2009), meaning that about 11 TWh ofproduction would be added each year between 2010 and 2025; thisannual value is about half of the decadal growth experienced bysome of the best wind energy jurisdictions.
Whether such a large growth in wind can be accommodated in agrid is a question yet to be answered. This may not be an issue inregions with significant production volumes of hydroelectricity asit can act as a backup to wind (Luickx et al., 2008); however, windwill probably be problematic in regions without adequate backup
or some other means of integrating wind into the electricity mix(Blarke and Lund, 2008).
In addition to intermittency, large-scale deployment of windfaces other challenges: climate change might affect existing windconditions, potentially causing wind speeds to increase or decrease,or winds to become gustier (Moyer, 2009); the need for adequatetransmission facilities to remote sites (Hiroux and Saguan, 2009);limited development of offshore wind due to high costs (Estebanet al., 2010); and opposition to wind farm development in juris-dictions whose economic activity depends heavily on tourism(Boccard, 2009).
3.3. Other renewables
NRTEE limits other renewables to a small amount of biomass forprocess heat in manufacturing. Biomass use in the residential sectorfor space and water heating is projected to decline to negligibleamounts because it ‘‘produces methane emissions’’ (Nyboer, 2008,p. 22). Although this statement is referenced (see EnvironmentCanada, 2007, pp. 641–642), the volume of methane produced isabout 1% of CO2 emissions for typical woodstoves and is less than 0.5%of CO2 emissions for properly designed woodstoves. Rather thancurtailing the use of biomass combustion for heating purposesbecause of methane emissions, a more publically acceptable solutionwould be to devise the necessary technology to reduce methaneemissions below their present levels.
If used correctly, biomass can be a carbon-neutral renewableenergy source; in fact, the government of Canada is promotingbiomass energy research in areas such as wood pellets (Canmet,2008). Whether it is possible to expect Canadians not to use woodfor heating is questionable, as Canadians would probably turn tobiomass in greater numbers since energy sources for residentialspace heating such as fuel oil and natural gas are expected todecline over the next 40 years.
Although solar thermal offers considerable potential in manyareas of Canada as a replacement for some or all existing energysources used for both residential and commercial space and waterheating, it is never mentioned in the sectoral and regional analysisreport (Bristow and Kennedy, 2010). Similarly, solar photovoltaic,presently an expensive form of electrical generation, is nevermentioned (Bhandari and Stadler, 2009).
3.4. Nuclear
Like many industrialized countries, Canada developed anuclear-electricity program after the Second World War. A numberof experimental reactors were built in Ontario in the 1950s, whichled to the 600 MW heavy-water CANDU reactor design. The first ofthese came on-line in the early 1970s in Ontario; subsequently thereactor design was sold to various countries around the world aswell as in Canada, with more reactors purchased by Ontario Hydro,Hydro Quebec, and NB Power. The electricity production from Canada’snuclear reactor fleet is shown in Fig. 4.
The decade-over-decade changes in nuclear-electricity produc-tion in Canada are shown in Fig. 5, reflecting the growth in nuclearelectricity throughout the 1970s and 1980s with the installation ofall of Canada’s reactor fleet taking place during this time. Technicalproblems with the CANDU design required the re-tubing of most, ifnot all, of Canada’s reactors starting in the early 1990s; however,some reactors, such as units 2 and 3 at Pickering ‘A’ were deemedtoo expensive to repair and remain in a ‘‘safe shutdown state’’ (OPG,2009a). Although Fig. 5 suggests a growth in capacity between1997–2006 and 1999–2008, this was not the case as it was simplyrefurbished reactors being brought back on-line (Nuclear Canada,2004). NRTEE’s projections for growth between 2010 and 2050 are
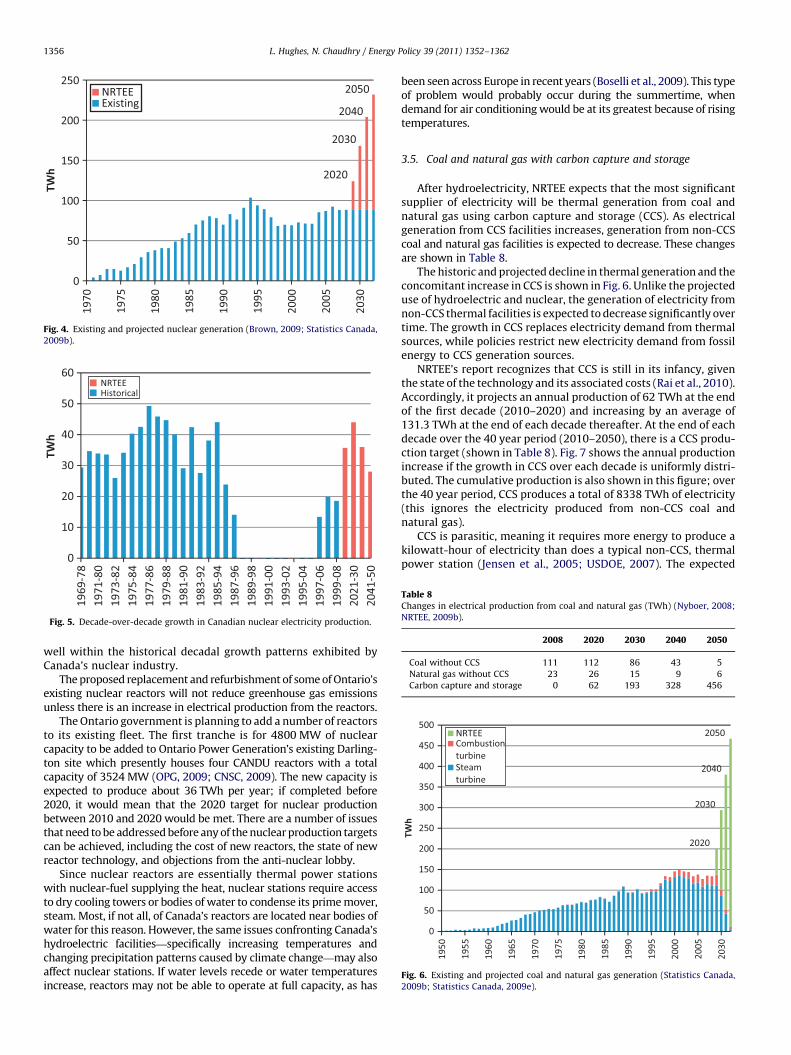
Fig. 4. Existing and projected nuclear generation (Brown, 2009; Statistics Canada,
2009b).
Fig. 5. Decade-over-decade growth in Canadian nuclear electricity production.
Table 8Changes in electrical production from coal and natural gas (TWh) (Nyboer, 2008;
NRTEE, 2009b).
2008 2020 2030 2040 2050
Coal without CCS 111 112 86 43 5
Natural gas without CCS 23 26 15 9 6
Carbon capture and storage 0 62 193 328 456
Fig. 6. Existing and projected coal and natural gas generation (Statistics Canada,
2009b; Statistics Canada, 2009e).
L. Hughes, N. Chaudhry / Energy Policy 39 (2011) 1352–13621356
well within the historical decadal growth patterns exhibited byCanada’s nuclear industry.
The proposed replacement and refurbishment of some of Ontario’sexisting nuclear reactors will not reduce greenhouse gas emissionsunless there is an increase in electrical production from the reactors.
The Ontario government is planning to add a number of reactorsto its existing fleet. The first tranche is for 4800 MW of nuclearcapacity to be added to Ontario Power Generation’s existing Darling-ton site which presently houses four CANDU reactors with a totalcapacity of 3524 MW (OPG, 2009; CNSC, 2009). The new capacity isexpected to produce about 36 TWh per year; if completed before2020, it would mean that the 2020 target for nuclear productionbetween 2010 and 2020 would be met. There are a number of issuesthat need to be addressed before any of the nuclear production targetscan be achieved, including the cost of new reactors, the state of newreactor technology, and objections from the anti-nuclear lobby.
Since nuclear reactors are essentially thermal power stationswith nuclear-fuel supplying the heat, nuclear stations require accessto dry cooling towers or bodies of water to condense its prime mover,steam. Most, if not all, of Canada’s reactors are located near bodies ofwater for this reason. However, the same issues confronting Canada’shydroelectric facilities—specifically increasing temperatures andchanging precipitation patterns caused by climate change—may alsoaffect nuclear stations. If water levels recede or water temperaturesincrease, reactors may not be able to operate at full capacity, as has
been seen across Europe in recent years (Boselli et al., 2009). This typeof problem would probably occur during the summertime, whendemand for air conditioning would be at its greatest because of risingtemperatures.
3.5. Coal and natural gas with carbon capture and storage
After hydroelectricity, NRTEE expects that the most significantsupplier of electricity will be thermal generation from coal andnatural gas using carbon capture and storage (CCS). As electricalgeneration from CCS facilities increases, generation from non-CCScoal and natural gas facilities is expected to decrease. These changesare shown in Table 8.
The historic and projected decline in thermal generation and theconcomitant increase in CCS is shown in Fig. 6. Unlike the projecteduse of hydroelectric and nuclear, the generation of electricity fromnon-CCS thermal facilities is expected to decrease significantly overtime. The growth in CCS replaces electricity demand from thermalsources, while policies restrict new electricity demand from fossilenergy to CCS generation sources.
NRTEE’s report recognizes that CCS is still in its infancy, giventhe state of the technology and its associated costs (Rai et al., 2010).Accordingly, it projects an annual production of 62 TWh at the endof the first decade (2010–2020) and increasing by an average of131.3 TWh at the end of each decade thereafter. At the end of eachdecade over the 40 year period (2010–2050), there is a CCS produ-ction target (shown in Table 8). Fig. 7 shows the annual productionincrease if the growth in CCS over each decade is uniformly distri-buted. The cumulative production is also shown in this figure; overthe 40 year period, CCS produces a total of 8338 TWh of electricity(this ignores the electricity produced from non-CCS coal andnatural gas).
CCS is parasitic, meaning it requires more energy to produce akilowatt-hour of electricity than does a typical non-CCS, thermalpower station (Jensen et al., 2005; USDOE, 2007). The expected

Fig. 7. NRTEE’s annual and cumulative production from CCS facilities.
Table 9Natural gas requirements to produce 8338 TWh (in BCM).
Conversion efficiency Parasitic losses
10% 20% 30%
30% 2969 3239 3509
35% 2545 2777 3008
40% 2227 2430 2632
45% 1980 2160 2340
50% 1782 1944 2106
Fig. 8. Canadian natural gas reserves (Statistics Canada, 2009d).
Table 10Coal requirements to produce 8338 TWh (in gigatons).
Conversionefficiency
Bituminous Sub-bituminous
Parasitic losses Parasitic losses
10% 20% 30% 10% 20% 30%
25% 4.79 5.22 5.66 7.03 7.67 8.31
30% 3.99 4.35 4.72 5.86 6.39 6.92
35% 3.42 3.73 4.04 5.02 5.48 5.93
40% 2.99 3.27 3.54 4.39 4.79 5.19
45% 2.66 2.90 3.14 3.90 4.26 4.61
L. Hughes, N. Chaudhry / Energy Policy 39 (2011) 1352–1362 1357
costs associated with CCS are making some countries with limitedsupplies of coal and natural gas question the justification of theexpenses associated with these facilities (de Coninck et al., 2009).
A recent report from the Canadian government proposes theinstallation of CCS facilities to capture 5 Mt CO2 per year starting in2015 (ecoAction, 2008a). The report gives an example of a typicalwestern-Canadian 600 MW coal-fired thermal electrical-genera-tion station which produces about 3.8 Mt CO2 per year. To capture5 Mt of CO2 per year would require 789 MW of coal capacitywith CCS; assuming a 90% capacity factor and 100% CO2 captureefficiency, the annual electrical production would be 6.2 TWh. Ifthis capacity could be added starting in 2015, by 2020, a total of37.2 TWh would be produced by CCS. This is 60% of NRTEE’s 2020target. Since the technology is in its infancy and can be expected tobe subject to delays, achieving the 2020 target may be optimistic.
The amount of natural gas and coal needed to meet these targetswill depend upon the technology associated with the different CCSsystems. For the purposes of this paper, it is assumed that electricity isused to capture and store the carbon; this electricity is in addition tothe total production expected from the CCS systems. These parasiticlosses increase the electricity requirements of the CCS systems by 10%,20%, and 30%, from 8338 to 9172 TWh, 10,006, and 10,839 TWh,respectively. The percentage of the energy within the natural gas orcoal that is converted to electricity varies from 25% to 45%.
3.5.1. Natural gas
The volume of natural gas necessary to produce 8338 TWh over the40 years is shown in Table 9. In the best case, parasitic losses are 10%and the efficiency of the conversion process is 50%, meaning that only1782 billion cubic meters (BCM) are required. At the other extreme,30% parasitic losses and 30% conversion efficiency calls for 3509 BCM.
Table 9 refers to the volume of natural gas needed to produceelectricity from CCS. However, since NRTEE requires continued elec-trical production from non-CCS natural gas facilities between 2010and 2050 (see Table 8), an additional 150 BCM of natural gas will benecessary (assuming a linear decline in non-CCS natural gas demand).
In 2007, Canada’s natural gas reserves were estimated to be about1534 BCM (Statistics Canada, 2009d). Although the reserves havebeen holding steady at this level for about a decade (see Fig. 8), thelong-term trend shows a marked decline to at least 2030 and probablybeyond (NEB, 2007); even the availability of shale gas from placessuch as Horn River in northern British Columbia are failing to stem thedecline in Canadian natural gas production (NEB, 2010). The NRTEEreport expects annual Canadian natural gas production to peak atabout 200 BCM in 2015, declining to less than 150 BCM in 2050. Not allof the natural gas production may be available to Canadians as Canadaexports more than half its natural gas production to the United Statesand will continue to do so well into the future because of its NAFTAobligations (Laxer and Dillon, 2008).
The report assumes that most of the natural gas presently used forheating purposes in the residential and commercial-institutionalsectors is to be used for electrical generation (this is discussed in moredetail in Section 4, below, on end-use demand). However, decliningreserves, trade commitments, and other possible uses of natural gas(for example, plastics and fertilizers) suggests that coal will have to beemployed if the projected electrical supply from CCS is to be met.
3.5.2. Coal
The method used to determine the amount of natural gasrequired to meet the 8338 TWh from CCS can be applied to coal.There are two categories of coal, bituminous and sub-bituminous(which includes lignite); for the purposes of this paper, their energycontents are 27.6 and 18.8 GJ/t, respectively (NEB, 1999). As withnatural gas, the same three parasitic losses are considered, as are arange of conversion efficiencies.
Table 10 shows the amount of coal needed to produce 8338 TWhof electricity from different CCS plants with diverse efficiencies and

Fig. 9. Canadian coal reserves (Statistics Canada, 2008a; Statistics Canada, 2008b).
Table 11Penetration of electric space heating systems (from Table 16, Nyboer, 2008).
System 2020 2030 2040 2050
Electric baseboards 46% 51% 51% 51%
Air source heat pumps 19% 31% 21% 13%
Ground source heat pumps 0% 6% 22% 33%
Space heating total 65% 88% 94% 97%
L. Hughes, N. Chaudhry / Energy Policy 39 (2011) 1352–13621358
parasitic losses. The higher the coal’s energy content, the less coalrequired. The amount of bituminous coal necessary ranges from 2.66to 5.66 gigatons, while the amount of sub-bituminous coal (includinglignite) varies from 3.90 to 8.31 gigatons.
As with natural gas, it is important to put the amount of coalrequired by the CCS systems into context. In 2008, the total stock ofbituminous coal (both steam and metallurgical) in Canada was 2.25gigatons, while that of sub-bituminous coal was 2.08 gigatons (seeFig. 9). About 98% of the metallurgical (i.e., coking) coal and over75% of the steam bituminous coal was exported in 2008; in total,about 5% of Canada’s bituminous coal was consumed in Canada(Statistics Canada, 2009c). If these export markets are to remainactive into the future, Canada will have very little in the way ofbituminous coal to use for CCS. If considered separately, Canadadoes not have sufficient reserves of bituminous or sub-bituminouscoal to meet the CCS electricity production target.
However, this is only part of the problem as the report projects acontinued use of coal for non-CCS electrical production between2010 and 2050. Assuming a linear decline in consumption, thedemand for coal during this period will be 1.95 gigatons—this isalmost equal to Canada’s present reserves of sub-bituminous coal.
3.6. Enabling policies
As part of its program to reduce greenhouse gas emissions, theGovernment of Canada, through Environment Canada, has pro-posed regulations and performance standards for both existing andnew coal-fired electricity generation plants (Environment Canada,2010b). If the regulations are adopted they are to come into effect inmid-2015 and are expected to specify that by 2025, all coal-firedplants are to have an emissions intensity equivalent to that of aNatural Gas Combined Cycle (NGCC) turbine or an average coal-fired generation unit with CCS capturing 70% of carbon dioxideemissions (Environment Canada, 2010a). When a plant reaches theend of its active life (assumed to be 45 years), it is taken out ofservice if it cannot meet the regulations; the assumption here isthat the gradual withdrawal of these plants will reduce Canada’soverall greenhouse gas emissions or they will be retrofitted tohandle CCS.
The Canadian federal and some provincial governments as well assome energy providers are examining CCS; although not all with theintention of capturing CO2 from the generation of electricity. Forexample, at least three Canadian provinces have CCS programs: Alberta
plans to spend $2 billion on research with the objective of capturing200 Mt of CO2 in abandoned oil and natural gas wells per year by 2050from tar sands and synthetic gas projects (Energy Alberta, 2009; EnergyAlberta, 2010); Saskatchewan and the U.S. state of Montana aredeveloping a CAN $270 million dollar program to capture up to onemillion tons of carbon from a thermal power station in Saskatchewanand ship it to Montana for disposal (Saskatchewan, 2009); and NovaScotia, where $5 million has been allocated to study CCS and raisepublic awareness about CCS (CCS Nova Scotia, 2010).
4. End-use demand
NRTEE proposes a future that relies on electrical productionfrom a growth in hydroelectricity, CCS, and nuclear, resulting in areduction in greenhouse gases. Why and where these reductionstake place will depend upon the state of electrical generation ineach province:
�
In provinces already relying on hydroelectricity for most of theirelectricity supply, the model projects very little reduction ingreenhouse gas emissions from electrical generation. Instead,decline will occur by having energy services either replaceexisting demand for carbon-intensive fuels (such as fuel oil,natural gas, or biomass) with electricity or restrict new demandto electricity (Nyboer, 2008). This also holds true for provincesthat intend to expand their nuclear fleet. � Those provinces relying on coal and natural gas generation forelectricity supply (typically with little or no hydroelectric expan-sion capability) are expected to replace existing thermal facilitieswith, and restrict new facilities to, CCS. In these cases, emissionsreduction is expected to occur because of CCS and the replacementand restriction of demand to non-carbon electricity.
For example, by 2050, NRTEE’s model projects that electricitywill meet 97% of residential space heating, as described in thefollowing paragraph and shown in Table 11 (Nyboer, 2008):
The main action to reduce greenhouse gas emissions in theresidential sector is the adoption of electric space heatingsystems—by 2050 in the policy scenario, over 97% of installedheating systems use electricity (see Table 16). The installation ofelectric baseboards and ground source heat pumps account forthe majority of installations, while air source heat pumps accountfor the remainder.
What is perhaps most surprising about the projected adoptionof electric heating systems is the overwhelming use of electricbaseboard heating. Although it is simple to install, electric base-board heating is one of the worst ways to heat with electricitybecause it typically adds to the winter peak, requiring more gene-ration capacity than the electricity supplier may be able to provideeconomically. There are viable alternatives to electric baseboardheating; for example, electric thermal storage systems can be chargedduring the off-peak hours and allowed to discharge throughoutthe day without adding to the day-time load on system or to theevening peak.
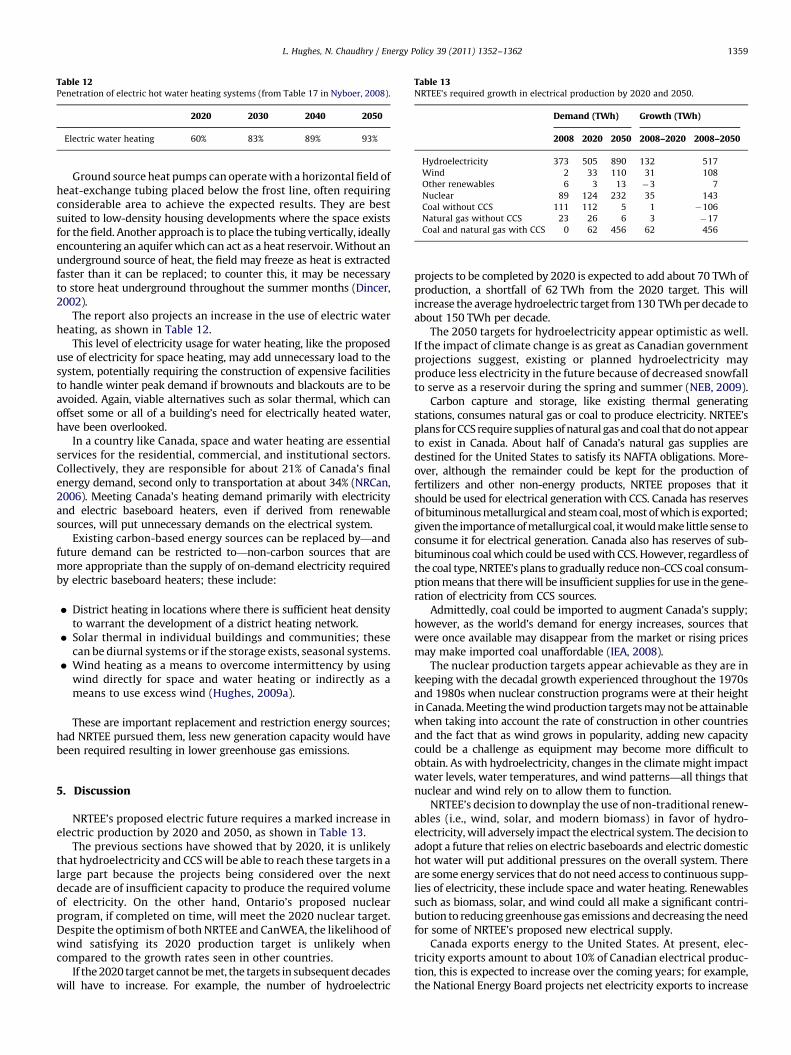
Table 12Penetration of electric hot water heating systems (from Table 17 in Nyboer, 2008).
2020 2030 2040 2050
Electric water heating 60% 83% 89% 93%
Table 13NRTEE’s required growth in electrical production by 2020 and 2050.
Demand (TWh) Growth (TWh)
2008 2020 2050 2008–2020 2008–2050
Hydroelectricity 373 505 890 132 517
Wind 2 33 110 31 108
Other renewables 6 3 13 �3 7
Nuclear 89 124 232 35 143
Coal without CCS 111 112 5 1 �106
Natural gas without CCS 23 26 6 3 �17
Coal and natural gas with CCS 0 62 456 62 456
L. Hughes, N. Chaudhry / Energy Policy 39 (2011) 1352–1362 1359
Ground source heat pumps can operate with a horizontal field ofheat-exchange tubing placed below the frost line, often requiringconsiderable area to achieve the expected results. They are bestsuited to low-density housing developments where the space existsfor the field. Another approach is to place the tubing vertically, ideallyencountering an aquifer which can act as a heat reservoir. Without anunderground source of heat, the field may freeze as heat is extractedfaster than it can be replaced; to counter this, it may be necessaryto store heat underground throughout the summer months (Dincer,2002).
The report also projects an increase in the use of electric waterheating, as shown in Table 12.
This level of electricity usage for water heating, like the proposeduse of electricity for space heating, may add unnecessary load to thesystem, potentially requiring the construction of expensive facilitiesto handle winter peak demand if brownouts and blackouts are to beavoided. Again, viable alternatives such as solar thermal, which canoffset some or all of a building’s need for electrically heated water,have been overlooked.
In a country like Canada, space and water heating are essentialservices for the residential, commercial, and institutional sectors.Collectively, they are responsible for about 21% of Canada’s finalenergy demand, second only to transportation at about 34% (NRCan,2006). Meeting Canada’s heating demand primarily with electricityand electric baseboard heaters, even if derived from renewablesources, will put unnecessary demands on the electrical system.
Existing carbon-based energy sources can be replaced by—andfuture demand can be restricted to—non-carbon sources that aremore appropriate than the supply of on-demand electricity requiredby electric baseboard heaters; these include:
�
District heating in locations where there is sufficient heat densityto warrant the development of a district heating network. � Solar thermal in individual buildings and communities; thesecan be diurnal systems or if the storage exists, seasonal systems.
� Wind heating as a means to overcome intermittency by usingwind directly for space and water heating or indirectly as ameans to use excess wind (Hughes, 2009a).
These are important replacement and restriction energy sources;had NRTEE pursued them, less new generation capacity would havebeen required resulting in lower greenhouse gas emissions.
5. Discussion
NRTEE’s proposed electric future requires a marked increase inelectric production by 2020 and 2050, as shown in Table 13.
The previous sections have showed that by 2020, it is unlikelythat hydroelectricity and CCS will be able to reach these targets in alarge part because the projects being considered over the nextdecade are of insufficient capacity to produce the required volumeof electricity. On the other hand, Ontario’s proposed nuclearprogram, if completed on time, will meet the 2020 nuclear target.Despite the optimism of both NRTEE and CanWEA, the likelihood ofwind satisfying its 2020 production target is unlikely whencompared to the growth rates seen in other countries.
If the 2020 target cannot be met, the targets in subsequent decadeswill have to increase. For example, the number of hydroelectric
projects to be completed by 2020 is expected to add about 70 TWh ofproduction, a shortfall of 62 TWh from the 2020 target. This willincrease the average hydroelectric target from 130 TWh per decade toabout 150 TWh per decade.
The 2050 targets for hydroelectricity appear optimistic as well.If the impact of climate change is as great as Canadian governmentprojections suggest, existing or planned hydroelectricity mayproduce less electricity in the future because of decreased snowfallto serve as a reservoir during the spring and summer (NEB, 2009).
Carbon capture and storage, like existing thermal generatingstations, consumes natural gas or coal to produce electricity. NRTEE’splans for CCS require supplies of natural gas and coal that do not appearto exist in Canada. About half of Canada’s natural gas supplies aredestined for the United States to satisfy its NAFTA obligations. More-over, although the remainder could be kept for the production offertilizers and other non-energy products, NRTEE proposes that itshould be used for electrical generation with CCS. Canada has reservesof bituminous metallurgical and steam coal, most of which is exported;given the importance of metallurgical coal, it would make little sense toconsume it for electrical generation. Canada also has reserves of sub-bituminous coal which could be used with CCS. However, regardless ofthe coal type, NRTEE’s plans to gradually reduce non-CCS coal consum-ption means that there will be insufficient supplies for use in the gene-ration of electricity from CCS sources.
Admittedly, coal could be imported to augment Canada’s supply;however, as the world’s demand for energy increases, sources thatwere once available may disappear from the market or rising pricesmay make imported coal unaffordable (IEA, 2008).
The nuclear production targets appear achievable as they are inkeeping with the decadal growth experienced throughout the 1970sand 1980s when nuclear construction programs were at their heightin Canada. Meeting the wind production targets may not be attainablewhen taking into account the rate of construction in other countriesand the fact that as wind grows in popularity, adding new capacitycould be a challenge as equipment may become more difficult toobtain. As with hydroelectricity, changes in the climate might impactwater levels, water temperatures, and wind patterns—all things thatnuclear and wind rely on to allow them to function.
NRTEE’s decision to downplay the use of non-traditional renew-ables (i.e., wind, solar, and modern biomass) in favor of hydro-electricity, will adversely impact the electrical system. The decision toadopt a future that relies on electric baseboards and electric domestichot water will put additional pressures on the overall system. Thereare some energy services that do not need access to continuous supp-lies of electricity, these include space and water heating. Renewablessuch as biomass, solar, and wind could all make a significant contri-bution to reducing greenhouse gas emissions and decreasing the needfor some of NRTEE’s proposed new electrical supply.
Canada exports energy to the United States. At present, elec-tricity exports amount to about 10% of Canadian electrical produc-tion, this is expected to increase over the coming years; for example,the National Energy Board projects net electricity exports to increase

L. Hughes, N. Chaudhry / Energy Policy 39 (2011) 1352–13621360
from 29.4 TWh in 2008 to 73.4 TWh in 2020 (NEB, 2009). If electricityexports do increase, it will mean less production available for Canadianconsumption.
Although this analysis did not consider the potential effects ofcarbon pricing as a way to discourage consumption or subsidizelow-carbon energy sources, recent events in Canada would suggestthat Canadians are reluctant to embrace carbon pricing, even ifrevenue-neutral. In October 2009, the Ontario Power Authority wasforced to reduce the level of subsidy from $0.82 per kWh to $0.58for its ‘‘micro-fit’’ solar program (feed-in tariffs for projects lessthan 10 kW) in part because of public objections (REW, 2010).During the 2008 Canadian federal election, the federal Liberal partysaw their seat count reduced to its lowest level since 1984, in largepart because of their campaign for revenue-neutral carbon taxes(carbon taxes were to be offset by reductions in income taxes)(Elections Canada, 2010; Hoag, 2008). In June 2010, the provincialgovernment in Nova Scotia was forced to ease its mercury emis-sions standards from coal-fired generation after electricity con-sumers voiced strong opposition to proposed 12–18% rate increases(Canadian Press, 2010; Nova Scotia Power, 2010).
Given the uneven distribution of energy resources throughoutCanada (for example, see Hughes, 2010), it will be necessary todevelop regional policies to reduce greenhouse gas emissions andimprove energy security using energy strategies such as thosediscussed in Mathiesen et al. (2010) might be applicable to parts ofCanada.
6. Concluding remarks
In 2007, the Government of Canada announced its long-termgreenhouse gas emissions reduction targets plan entitled Turning
the Corner, which proposed cuts 20% below 2006 levels by 2020 and65% by 2050. Subsequently, the National Round Table on theEconomy and Environment produced a report proposing a set of‘‘fast and deep’’ CO2 reduction pathways to meet these targets byrelying on a significant expansion of electricity production in threeareas: hydroelectricity, carbon capture and storage, and nuclear.With the possible exception of the proposed expansion of nuclearcapacity, the remaining pathways (including wind) assume somecombination of technological advances, access to secure energysupply, or rapid installation in order to be achieved. Renewables,notably solar and biomass, which are often seen as important elementsin CO2 reduction strategies, are omitted from the list of pathways.
Hydroelectricity is the cornerstone of NRTEE’s greenhouse gasemission reduction plan, with production increasing from 373 TWhin 2008 to 505 TWh in 2020 and rising to 890 TWh in 2050. In the caseof the 2020 target, the number of hydroelectric projects planned forcompletion by this date will produce less than half the 132 TWhrequired. The shortfall in production by 2020 will increase therequirement for new production between 2020 and 2050 from anaverage of 130 TWh per decade to over 150 TWh per decade. Meetingthis level of production increase in such a short period may be achallenge, not only because it is three times the average decadalincrease in hydroelectric production achieved in Canada between1950 and 2008, but because it is expected to occur during a time arising costs in commodities, pensions, and health care. Even if thesetargets could be met, the impact of climate change over the next 40years is projected to reduce hydroelectric production in all parts ofCanada.
Carbon capture and storage relies on technological advance-ments which must prove successful and begin deployment between2010 and 2020. If the technology is successful, it will be necessary forCanada to have adequate supplies of both coal and natural gas tojustify the construction of the large-scale CCS facilities envisaged byNRTEE. The 2020 target of 62 TWh is optimistic, given the state of CCS
technology, while the 2050 target will be limited by supplies ofnatural gas and coal. Without coal imports, it might not be possible toachieve the targets for coal-based CCS.
Of the three major areas of expansion envisaged by NRTEE, itappears that only nuclear has the potential to meet its 2020 and 2050targets. However, like hydroelectricity, nuclear may be affected byclimate change in the coming decades as rising temperatures make itmore difficult to operate reactors that rely on lakes and rivers forcooling.
Wind and other renewables, the non-traditional energy sourcesconsidered by NRTEE, play a limited role in helping to reduce green-house gas emissions. This reflects, in part, the fact that many of thesesources are intermittent generators of electricity. There are ways ofhandling intermittency which were not considered; for example,storage will be central to a renewable future as it will allow energyto be stored as heat or electricity.
It is generally agreed that there are three major energy services(transportation, heating and cooling, and on-demand electricity).Given the importance of electricity, it is necessary to find othersources of energy for heating. Renewables such as modern biomass,solar thermal, and wind heating can make significant contributionsto Canada’s space and water heating needs. By reducing electricaldemand for heating, the need for new capacity (such as hydro-electric, CCS, or nuclear) is also lowered.
This analysis of NRTEE’s work has illustrated some of theproblems that could confront Canada as it attempts to addressclimate change. Moreover, as the paper has shown that, betweennow and 2050, energy policy will need to focus on both climatechange and energy security as the availability of accessible andaffordable energy sources becomes more problematic.
Of course, these problems are not limited to Canada; otherdeveloped countries are facing them as well. The analysis describedin this paper can be applied internationally to better understandand develop strategies that can help reduce global greenhouse gasemissions through the adoption of policies that reduce energyconsumption and replace existing insecure, high-emission sources—
and restrict new demand—to energy sources that are secure, sus-tainable, and environmentally benign.
Acknowledgements
The authors would like to thank David Hughes, Mark Gardner,Anirudh Muralidhar, Jim Parsons, Dave Ron, and Sandy Cook fortheir comments and assistance on this paper. The two anonymousreviewers made a number of valuable suggestions.
References
Adams, K., 2008, April 17. Northern Hydro development in Manitoba. RetrievedDecember 3, 2009, from /http://dnr.wi.gov/environmentprotect/gtfgw/documents/MeTF20080417.pdfS.
BC Hydro, n.d. Re-investing for generations. Retrieved January 4, 2010, fromBC Hydro for generations: /http://www.bchydro.com/etc/medialib/internet/documents/appcontent/your_account/Reinvesting_for_Generations.Par.0001.File.policies55154.pdfS.
Bhandari, R., Stadler, I., 2009. Grid parity analysis of solar photovoltaic systems inGermany using experience curves. Solar Energy 83 (9), 1634–1644, September.
Blarke, M.D., Lund, H., 2008. The effectiveness of storage and relocation options inrenewable energy systems. Renewable Energy 33 (7), 1499–1507.
Boccard, N., 2009. Capacity factor of wind power realized values vs. estimates.Energy Policy, 2679–2688, April.
Boselli, M., Eckert, V., Kahn, M., 2009, June 30. Heatwaves can crimp power outputacross Europe (J. Jukwey, Ed.). Retrieved December 1, 2009, from Reuters:/http://www.reuters.com/article/ELECTU/idUSLU67986320090630?pageNumber=1&virtualBrandChannel=0S.
Bristow, D., Kennedy, C.A., 2010. Potential of building-scale alternative energy toalleviate risk from the future price of energy. Energy Policy 4, 1885–1894, April.
Brown, M., 2009, November 24. Canadian nuclear electrical generation data.Personal communication.
L. Hughes, N. Chaudhry / Energy Policy 39 (2011) 1352–1362 1361
Buttle, J., Muir, J.T., Frain, J., 2004. Economic impacts of climate change on theCanadian Great Lakes hydro-electric power producers: a supply analysis.Canadian Water Resources Journal 29, 89–109.
Canadian Hydropower Association, 2003. Current and planned hydro developmentin Canada. Retrieved November 19, 2009, from Canadian Hydropower Asso-ciation: /http://www.canhydropower.org/hydro_e/pdf/Canada%20Current%20and%20Planned%20Hydro%202003.pdfS.
Canadian Press, 2010, July 22. N.S. to ease mercury emission targets to offsetproposed electricity rate hikes (NS-Emissions-Cap). Retrieved November 15,2010, from Oil Week: N.S. to ease mercury emission targets to offset proposedelectricity rate hikes (NS-Emissions-Cap).
Canmet, 2008, November 14. Bioenergy systems—biofuels and solid biofuels(Natural Resources Canada). Retrieved November 29, 2009, from CanmetEnregy: /http://canmetenergy-canmetenergie.nrcan-rncan.gc.ca/eng/bioenergy/biofuels/solid_biofuels.htmlS.
CanWEA, 2009. Windvision 2025—powering Canada0s future. Retrieved December5, 2009, from Canadian Wind Energy Association: /http://www.canwea.ca/images/uploads/File/Windvision_summary_e.pdfS.
CCS Nova Scotia, 2010. Carbon capture and storage. Retrieved November 14, 2010,from CCS Nova Scotia: /http://www.ccsnovascotia.ca/overview.phpS.
CNSC, (2009, November 16. Status: Ontario Power Generation Darlington NewNuclear Power Plant Project. Retrieved December 4, 2009, from CanadianNuclear Safety Commission: /http://www.cnsc-ccsn.gc.ca/eng/readingroom/newbuilds/opg_darlington/#3S.
de Coninck, H., Flach, T., Curnow, P., Richardson, P., Anderson, J., Shackley, S., et al.,2009. The acceptability of CO2 capture and storage (CCS) in Europe: anassessment of the key determining factors: Part 1. Scientific, technical andeconomic dimensions. International Journal of Greenhouse Gas Control 3 (3),333–343, May.
Dincer, I., 2002. On thermal energy storage systems and applications in buildings.Energy and Buildings. doi:10.1016/S0378-7788(01)00126-8.
Dooley, J., 2010, January 18. Email communication.ecoAction, 2008a, January 9. Canada’s fossil energy future—the way forward on
carbon capture and storage. Retrieved December 6, 2009, from EcoAction TaskForce on Carbon Capture and Storage: /http://www.nrcan-rncan.gc.ca/com/resoress/publications/fosfos/fosfos-eng.pdfS.
ecoAction, 2007, April 26. Canada’s New Government Announces MandatoryIndustrial Targets to Tackle Climate Change and Reduce Air Pollution . RetrievedDecember 5, 2009, from EcoAction—Government of Canada: /http://www.ec.gc.ca/default.asp?lang=En&n=714D9AAE-1&news=4F2292E9-3EFF-48D3-A7E4-CEFA05D70C21S.
ecoAction, 2008b, March 10. Government delivers details of Greenhouse GasRegulatory Framework. Retrieved December 5, 2009, from EcoAction—
Government of Canada:/http://www.ecoaction.gc.ca/news-nouvelles/20080310-eng.cfmS.
ecoAction, 2008c, March. Turning the corner—taking action to fight climate change.Retrieved December 5, 2009, from EcoAction—Government of Canada: /http://www.ec.gc.ca/doc/virage-corner/2008-03/pdf/572_eng.pdfS.
ecoAction, 2009, December 3. Turning the corner: an action plan to reducegreenhouse gases and air pollution. Retrieved December 5, 2009, from Govern-ment of Canada:/http://www.ecoaction.gc.ca/turning-virage/index-eng.cfmS.
Elections Canada, 2010, September 8. Past elections. Retrieved November 17, 2010,from Elections Canada:/http://www.elections.ca/content.aspx?section=ele&dir=pas&document=index&lang=eS.
Energy Alberta. (2010, July 13). Carbon capture and storage. Retrieved November 13,2010, from Government of Alberta - Energy: /http://www.energy.alberta.ca/Initiatives/1901.aspS.
Energy Alberta, 2009, November. Talk about carbon capture and storage. RetrievedNovember 13, 2010, from Governemtn of Alberta: /http://www.energy.alberta.ca/Org/pdfs/FactSheet_CCS.pdfS.
Environment Canada, 2010a, August 10. Backgrounder—key elements of proposedregulatory approach. Retrieved November 13, 2010, from Environment Canada:/http://www.ec.gc.ca/default.asp?lang=En&n=714D9AAE-1&news=55D09108-5209-43B0-A9D1-347E1769C2A5S.
Environment Canada, 2010b, June 23. Government of Canada to regulate emissionsfrom electricity sector. Retrieved November 10, 2010, from Environment Canada:/http://www.ec.gc.ca/default.asp?lang=En&n=714D9AAE-1&news=E5B59675-BE60-4759-8FC3-D3513EAA841CS.
Environment Canada, 2010c. National Inventory Report 1990–2008: GreenhouseGas Sources and Sinks in Canada. Greenhouse Gas Division, EnvironmentCanada, Ottawa.
Environment Canada, 2007. National Inventory Report: 1990–2005, GreenhouseGas Sources and Sinks in Canada. Greenhouse Gas Division, Ottawa.
Esteban, M.D., Diez, J.J., Lopez, J.S., Negro, V., 2010. Why offshore wind energy?Renewable Energy, 444–450, August.
Hiroux, C., Saguan, M., 2009. Large-scale wind power in European electricitymarkets: time for revisiting support schemes and market designs? EnergyPolicy, 3135–3145, August.
Hoag, H., 2008, October 30. Canadian election goes against the ‘green shift’.Retrieved November 2008, 2010, from Nature Reports Climate Change:/http://www.nature.com/climate/2008/0811/full/climate.2008.116.htmlS.
Hughes, L., 2010. Eastern Canadian crude oil supply and its implications for regionalenergy security. Energy Policy (10.1016/j.enpol.2010.01.015).
Hughes, L., 2009a, November. Meeting residential space heating demand with wind-generated electricity, doi:10.1016/j.renene.2009.11.014.
Hughes, L., 2009b. The four ‘R’s of energy security. Energy Policy 37 (6), 2459–2461, June.
Hydro Quebec, 2009. Construction Projects’ Home Page. Retrieved December 3,2009, from /http://www.hydroquebec.com/projects/index.htmlS.
IEA, 2008. World Energy Outlook 2008. International Energy Agency, Paris.Jensen, M.D., Musich, M.A., Ruby, J.D., Steadman, E.N., Harju, J.A., 2005, June. Carbon
separation and capture. Retrieved January 4, 2010, from Plains CO2 reductionpartnership: /http://www.netl.doe.gov/technologies/carbon_seq/partnerships/phase1/pdfs/CarbonSeparationCapture.pdfS.
Lafortune, G., 2010, November 16. Personal commuication. Hydro Quebec.Laxer, G., Dillon, J., 2008. Over a Barrel: Exiting from NAFTA’s Proportionality Clause.
Parkland Institute and Canadian Centre for Policy Alternatives, Edmonton, Alberta.Luickx, P.J., Delarue, E.D., D’haeseleer, W.D., 2008. Considerations on the backup of
wind power: operational backup. Applied Energy 85 (9), 787–799, September.Mathiesen, B., Lund, H., Karlsson, K., 2010. 100% renewable energy systems, climate
mitigation and economic growth. Applied Energy.Moyer, M., 2009. Climate Change May Mean Slower Winds. Scientific American , October.NationMaster, 2009. Energy Statistics—Electricity—Wind—Production—Public—
Canada (historical data). Retrieved October 10, 2009, from NationMaster.com:/http://www.nationmaster.com/time.php?stat=ene_ele_win_pro_pub&country=caS.
NEB, 2009. 2009 Reference Case Scenario: Canadian Energy Demand and Supply to2020. National Energy Board, Calgary, Alberta.
NEB, 2007. Canada’s Energy Future: Reference Case and Scenarios to 2030. NationalEnergy Board, Calgary.
NEB, 1999. Canadian Energy: Supply and Demand to 2025. National Energy Board,Calgary.
NEB, 2010. Short-term Canadian Natural Gas Deliverability 2010–2012—Appendi-cies. National Energy Boad, Calgary, AB, Canada.
Newfoundland and Labrador, 2007. Focusing Our Energy—Provincial Energy Plan.Retrieved December 4, 2009, from Natural Resource—Goverment of Newfound-land and Labrador: /http://www.nr.gov.nl.ca/energyplan/EnergyReport.pdfS.
Nova Scotia Power, 2010, August 16. NS power fuel costs lower as a result ofgovernment decision. Retrieved November 10, 2010, from Nova Scotia Power:/http://www.nspower.ca/en/home/aboutnspi/mediacentre/NewsRelease/2010/fuelcosts/default.aspxS.
NRCan, 2006. Canada’s Energy Outlook: The Reference Case 2006. Natural ResourcesCanada, Ottawa.
NRCan, 2004, June 7. Climate warming (Natural Resources Canada). RetrievedNovember 27, 2009, from The Atlas of Canada: /http://atlas.nrcan.gc.ca/site/english/maps/climatechange/scenariosS.
NRTEE, 2009a. Achieving 2050: A Carbon Pricing Policy for Canada (Advisory Note).National Round Table on the Environment and the Economy.
NRTEE, 2009b. Achieving 2050: a carbon pricing policy for Canada (TechnicalReport). National Round Table on the Environment and the Economy.
Nuclear Canada, 2004. Bruce Unit 3 reconnects to grid after five year layup. CanadianNuclear Association Electronic Newsletter 5 (1), 1, January 9.
Nyboer, 2008. Technology roadmap to low greenhouse gas emissions in theCanadian economy: a sectoral and regional analysis—Final Report. J & C Nyboerand Associates, Surrey, British Columbia.
OPG, 2009. Darlington nuclear. Retrieved December 4, 2009, from Ontario PowerGeneration: /http://www.opg.com/power/nuclear/darlington/S.
OPG, 2009a. Pickering nuclear. Retrieved December 4, 2009, from Ontario PowerGeneration: /http://www.opg.com/power/nuclear/pickering/S.
OPG, 2009c. The new Niagara tunnel project. Retrieved December 4, 2009, fromOntario Power Generation: /http://www.opg.com/power/hydro/new_projects/ntp/index.aspS.
Rai, V., Victor, D.G., Thurber, M.C., 2010. Carbon capture and storage at scale: lessonsfrom the growth of analogous energy technologies. Energy Policy 38 (8),4089–4098, August.
REW, 2010, July 8. Renewable Energy World. Retrieved November 2010, fromwww.renewableenergyworld.com:/http://www.renewableenergyworld.com/rea/news/article/2010/07/ontario-power-authority-proposes-cut-to-fitS.
Saskatchewan, 2009, May 7. Sasjatchewan and Montana join forces on carbon captureand storage. Retrieved November 13, 2010, from Government of Saskatchewan:/http://www.gov.sk.ca/news?newsId=c06068a6-59d6-40ba-a2f7-43d07b24441cS.
Statistics Canada, 2009a. Table 127-0001—electric power generation, by class ofelectricity producer, monthly (megawatt hour). Retrieved July 15, 2009, fromCANSIM (database), using E-STAT (distributor): /http://estat.statcan.gc.ca/cgi-win/cnsmcgi.exe?Lang=E&EST-Fi=EStat/English/CII_1-eng.htmS.
Statistics Canada, 2009b. Table 127-0002—electric power generation, by class ofelectricity producer, monthly (megawatt hour). Retrieved July 15, 2009, fromCANSIM (database), using E-STAT (distributor): /http://estat.statcan.gc.ca/cgi-win/cnsmcgi.exe?Lang=E&EST-Fi=EStat/English/CII_1-eng.htmS.
Statistics Canada, 2010. Table 128-0014, electricity generated from fossil fuels,annual (gigawatt hours), utilities. Retrieved November 5, 2010, from CANSIM(database), using E-STAT (distributor): /http://estat.statcan.gc.ca/cgi-win/cnsmcgi.exe?Lang=E&EST-Fi=EStat/English/CII_1-eng.htmS.
Statistics Canada, 2009c, July 2. Table 135-0002—production and exports of coal,monthly (tonnes). Retrieved January 7, 2010, from CANSIM (database), usingE-STAT (distributor):/http://estat.statcan.gc.ca/cgi-win/cnsmcgi.exe?Lang=E&EST-Fi=EStat/English/CII_1-eng.htmS.
Statistics Canada, 2009d, September 12. Table 153-0014—established natural gasreserves, annual (cubic metres). Retrieved January 7, 2010, from CANSIM (database),using E-STAT (distributor): /http://estat.statcan.gc.ca/cgi-win/cnsmcgi.exe?Lang=E&EST-Fi=EStat/English/CII_1-eng.htmS.
Statistics Canada, 2008a, September 12. Table 153-0017—recoverable reserves ofbituminous coal, annual (tonnes). Retrieved January 7, 2010, from CANSIM

L. Hughes, N. Chaudhry / Energy Policy 39 (2011) 1352–13621362
(database), using E-STAT (distributor): /http://estat.statcan.gc.ca/cgi-win/cnsmcgi.exe?Lang=E&EST-Fi=EStat/English/CII_1-eng.htmS.
Statistics Canada, 2008b, September 12. Table 153-0018—recoverable subbitumi-nous coal and lignite reserves, annual (tonnes). Retrieved January 7, 2010, fromCANSIM (database), using E-STAT (distributor): /http://estat.statcan.gc.ca/cgi-win/cnsmcgi.exe?Lang=E&EST-Fi=EStat/English/CII_1-eng.htmS.
Statistics Canada, 2009e). Table 3030026 - Electric power statistics, monthly. RetrievedNovember 9, 2009, from CANSIM (database), using E-STAT (distributor): /http://
estat.statcan.gc.ca/cgi-win/cnsmcgi.exe?Lang=E&EST-Fi=EStat/English/CII_1-eng.htmS.
UNData, 2009. Wind electricity. Retrieved December 4, 2009, from UN Data—EnergyStatistics Database—United Nations Statistics Division: /http://data.un.org/Data.aspx?d=EDATA&f=cmID%3aEWS.
USDOE, 2007, September 6. Carbon Capture Research. Retrieved January 4,2010, from U.S. Department of Energy: /http://fossil.energy.gov/programs/sequestration/capture/S.