the challenge of state reliance on revenue … · the challenge of state reliance on . ... planned...
TRANSCRIPT

THE CLIMATE AND ENERGY ECONOMICS PROJECT
CLIMATE AND ENERGY ECONOMICS DISCUSSION PAPER | AUGUST 9, 2016
THE CHALLENGE OF STATE RELIANCE ON
REVENUE FROM FOSSIL FUEL PRODUCTION
ADELE C. MORRIS The Brookings Institution
|


THE CHALLENGE OF STATE RELIANCE ON
REVENUE FROM FOSSIL FUEL PRODUCTION ∗
AUGUST 9, 2016
ADELE C. MORRIS The Brookings Institution
∗ The author gratefully acknowledges assistance from the Laura and John Arnold Foundation for Brookings’ work on state mineral production and fiscal conditions. Nicholas Montalbano assisted with the research, and Donald Marron provided helpful comments. The views expressed in the paper are those of the author and should not be interpreted as reflecting the views of the institution with which the author is affiliated.

1
1. INTRODUCTION
"Had we had the good sense to put a few cents aside of every ton of coal ... that has come out of our ground, we'd probably be the richest state in the Union instead of in many respects the poorest," -- West Virginia Senate president, Jeff Kessler, promoting his proposal to create a trust fund with oil and natural gas revenue (Schreiner, 2013). Taxes on oil, natural gas, and coal can be attractive to state governments in part because mineral assets are immobile and because states may be able to pass along some of the tax burden to energy consumers outside their states.1 Despite these taxes’ efficiency and distributional advantages, relying too much on them poses real downside risks for states. First, experience demonstrates mineral-related revenues are subject to wide swings resulting from fluctuations in energy markets. Thus, states must manage the revenues carefully, with due recognition of volatility. Currently, a number of states are facing significant budget shortfalls as a result of their fiscal dependence on fossil fuel production when just a few years ago they experienced a boom in revenue. In some cases, they set the stage for greater problems in those boom times with cuts in other taxes.2 Others states, although important fossil energy producers, are not experiencing the same challenges, either because they have revenue instruments that are relatively insulated from energy market gyrations or because they manage the revenue in a way smooths out the fiscal demands on it.3 A second challenge is less about the kind of revenue volatility that states often experience from commodity price spikes, business cycles, and lumpy capital gains. It derives from the deep, long-term technology- and policy-driven trends in energy markets. The trajectory is uncertain, but analysts suggest that coal and natural gas markets in particular are undergoing rapid structural changes that could affect the tax capacity of some states.4 As a result of new fracking-related supply, low cost gas is supplanting coal at scale, and both fuels face increasing competition from renewables like solar and wind power, which do not generate extraction-related taxes. As this
1 Weber, J. Y. Wang, and M. Chomas, “A quantitative description of state-level taxation of oil and gas production in the continental U.S.” Energy Policy, Volume 96, September 2016, Pages 289–301. https://mpra.ub.uni-muenchen.de/71733/1/MPRA_paper_71733.pdf; Prescott, J. and T. Smith, “The Use of Severance Tax Revenue in Tenth District States,” Economic Review, April 1986. https://www.kansascityfed.org/publicat/econrev/econrevarchive/1985/2q85pres.pdf 2 http://www.taxjusticeblog.org/archive/2016/08/fiscal_policy_shake-up_comes_t.php 3 Many of these challenges arise similarly at the local and county levels. For a useful analysis connecting oil and gas production and local government finance issues, see: Richard Newell and Daniel Raimi, “Shale Public Finance: Local government revenues and costs associated with oil and gas development,” NBER working paper 21542, September 2015. http://www.nber.org/papers/w21542.pdf 4 For example, see The US Coal Crash: Evidence for Structural Change, Carbon Tracker, March 2015. http://www.carbontracker.org/wp-content/uploads/2015/03/US-coal-designed-Web.pdf
2
paper will explore, although natural gas production has swelled, its price has fallen by proportionately more, leading to ad valorem revenues. In the long run, policies to control the risk of climatic disruption and ocean acidification could shrink fossil fuel consumption further. Already in retreat, coal is especially subject to policy-driven declines in the coming decade or so, both because it is the most carbon-intensive of the fossil fuels and because it faces several low-carbon competitors in its major market, the electric power sector. The U.S. Environmental Protection Agency (EPA) projects that its final Clean Power Plan (CPP) rule would reduce carbon emissions from existing fossil-fueled electric power plants by 32 percent relative to 2005 levels by 2030, or about 17 percent relative to 2012 levels.5 In February 2016, the U.S. Supreme Court issued a stay of the implementation of the rule pending further court proceedings, but some states are nonetheless steering their long term electricity planning heavily away from coal.6 The U.S. Department of Energy’s Energy Information Administration (EIA) projects that by 2040, the CPP regulation, if implemented as planned and extended beyond 2030, would shrink the use of coal in the power sector by more than half.7 To hit more ambitious emissions targets by mid-century, policymakers must also cut the use of oil and gas. Thus, barring major technological leaps for carbon capture or the demise of climate change policy initiatives, states that currently rely on fossil fuel production for a disproportionate share of their revenues will eventually need to restructure their revenue systems. Arguably, the sooner they prepare for this transition, the easier it will be. This paper examines the experience of states that rely heavily on fossil fuels for revenue with an eye to learning from the budgeting approaches that states have applied and anticipating the challenges to come. The paper proceeds as follows. Section 2 reviews the trends in fossil energy markets in the United States and shows how fluctuations in the oil, natural gas, and coal sectors have affected state revenues. Section 3 develops measures of how important fossil fuel production is to state revenues. Section 4 reviews the recent experience of states that have disproportionately relied on mineral revenues and examines the strategies and outcomes of those that have endeavored to smooth the fiscal implications of energy production, for example by placing funds in trusts. Section 5 concludes with approaches states can apply to manage the current downturn in mineral revenues and prepare for a lower-carbon future.
5 www.epa.gov/sites/production/files/2015-08/documents/cpp-final-rule-ria.pdf, Table ES-4. 6 http://midwestenergynews.com/2016/03/18/miso-projects-additional-coal-retirements-under-clean-power-plan/ 7 https://www.eia.gov/forecasts/aeo/cpp.cfm

3
2. FOSSIL ENERGY MARKETS AND STATE REVENUES
Both fossil energy production and revenues from it vary widely across states.8 This section explores how fluctuations in the oil, natural gas, and coal sectors have affected severance taxes and royalties, the key state revenues tied directly to those resources. Trends in Oil and Gas Markets Since 2000, developments in natural gas and oil extraction technologies have greatly boosted production of those fuels across the country.9 Figure 1, from EIA, shows that total oil production in the United States has increased by more than 60 percent since 2000; much of the growing volume involves hydraulic fracturing.
Figure 1. Crude oil production in the United States
This increased domestic production, along with international market factors, have reduced oil prices dramatically over the past few years, continuing the history of abrupt price changes illustrated in Figure 2. The chart shows that the real monthly per-barrel price of West Texas Intermediate crude fell by about 67 percent from a high of $144.72 in June 2008 to $47.85 in June 2016, with downturns as low as $30.70 in February 2016. 10
8 Weber et al (2016), Ibid. 9 Relevant technologies include three-dimensional seismic imaging, hydraulic fracturing, and directional drilling. http://www.eia.gov/todayinenergy/detail.cfm?id=25372 10 The overall production value or tax base of a mineral is not necessarily a simple multiple of the well-head or mine-mouth price times gross withdrawal. Some minerals are sold under contract or at prices that vary from benchmark indices, some withdrawals are not marketed, and some states tax different withdrawals differently.

4
Figure 2. Crude oil prices in the United States (West Texas Intermediate, $2015)11
As with oil, natural gas prices have declined and production levels have increased. On the left axis, Figure 3 below shows the monthly inflation-adjusted prices of U.S. natural gas from 1996, at the wellhead and to distributors (a.k.a. citygate prices). The citygate price fell from a spike of $13.42 in July 2008 to $3.14 in April 2016, a decrease of almost 77 percent. The figure (right axis) also shows that the monthly gross withdrawals of gas from wells increased over the same period from 2.2 to 2.7 trillion cubic feet, an increase of about 22 percent. Thus, the increase in production volumes did not fully compensate for the decline in prices, resulting in a lower overall base for ad valorem revenue instruments.
Figure 3: U.S. Natural Gas Prices and Production, 1996 to 2016
11 http://www.eia.gov/dnav/pet/pet_pri_spt_s1_m.htm
020406080
100120140160
1996 1998 2000 2002 2004 2006 2008 2010 2012 2014 2016
2015
$ pe
r Bar
rel
0
500,000
1,000,000
1,500,000
2,000,000
2,500,000
3,000,000
0
2
4
6
8
10
12
14
16
1996 1998 2000 2002 2004 2006 2008 2010 2012 2014 2016
MM
cF
2015
$/ T
hous
and
Cubi
c Fee
t
Natural Gas Price, Wellhead Natural Gas Price, CitygateNatural Gas Gross Withdrawals

5
According to EIA, huge swings in drilling activity have accompanied the shifting prices and volumes.12 Figure 4 below shows the total number of oil and gas drilling rigs in operation in the United States from January 2004 to June 2016.13 It illustrates the extraordinary boom and bust cycle in production activity in the past decade. Drilling activity, including the environmental impacts of hydraulic fracturing, is regulated primarily by states.14 This means that the chart implies enormous fluctuations in both the revenues associated with drilling activity (such as taxes on wages and sales) and the demands on related public services, such as roads, and state oversight authorities.
Figure 4: U.S. Crude Oil and Natural Gas Drilling Activity15
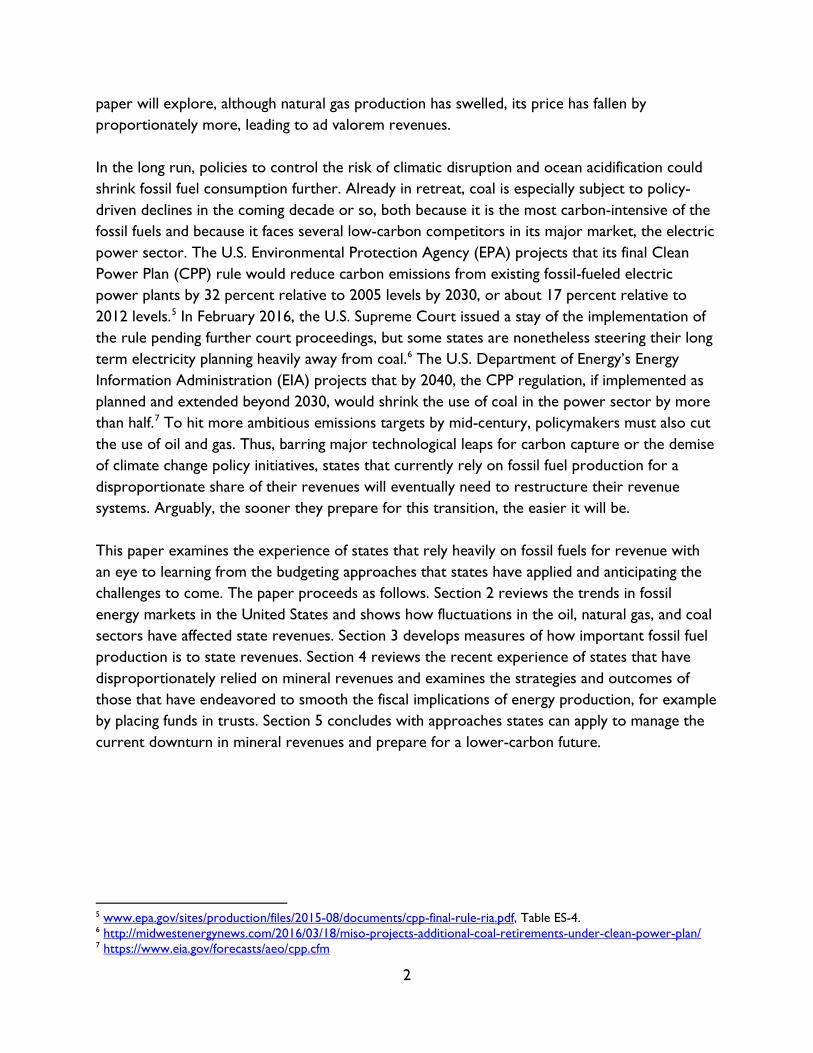
Trends in Coal Markets Coal production in the United States is going through a dramatic downturn. Coal prices have remained steady relative to those of oil and gas, but a combination of market and policy factors have sharply reduced U.S. production of coal. As shown in Figure 5, monthly U.S. coal production peaked in October 2008 at 104 million short tons and fell by 45 percent to 57 million short tons in June 2016; much of the decline has occurred in just the past few months.
12 http://www.eia.gov/naturalgas/weekly/archive/2016/04_28/index.cfm 13 Currently 95 percent of rigs are onshore and 5 percent are offshore. 14A compendium of state regulations on fracking appears here: http://www.alsglobal.com/en/Our-Services/Life-Sciences/Environmental/Capabilities/North-America-Capabilities/USA/Oil-and-Gasoline-Testing/Oil-and-Gas-Production-and-Midstream-Support/Fracking-Regulations-by-State 15 https://www.eia.gov/dnav/ng/ng_enr_drill_s1_m.htm
0
250
500
750
1000
1250
1500
1750
2004 2006 2008 2010 2012 2014 2016
Coun
t
U.S. Crude Oil Rotary Rigs in OperationU.S. Natural Gas Rotary Rigs in Operation
6
Figure 5: Monthly United States Coal Production: January 1973 to June 2016
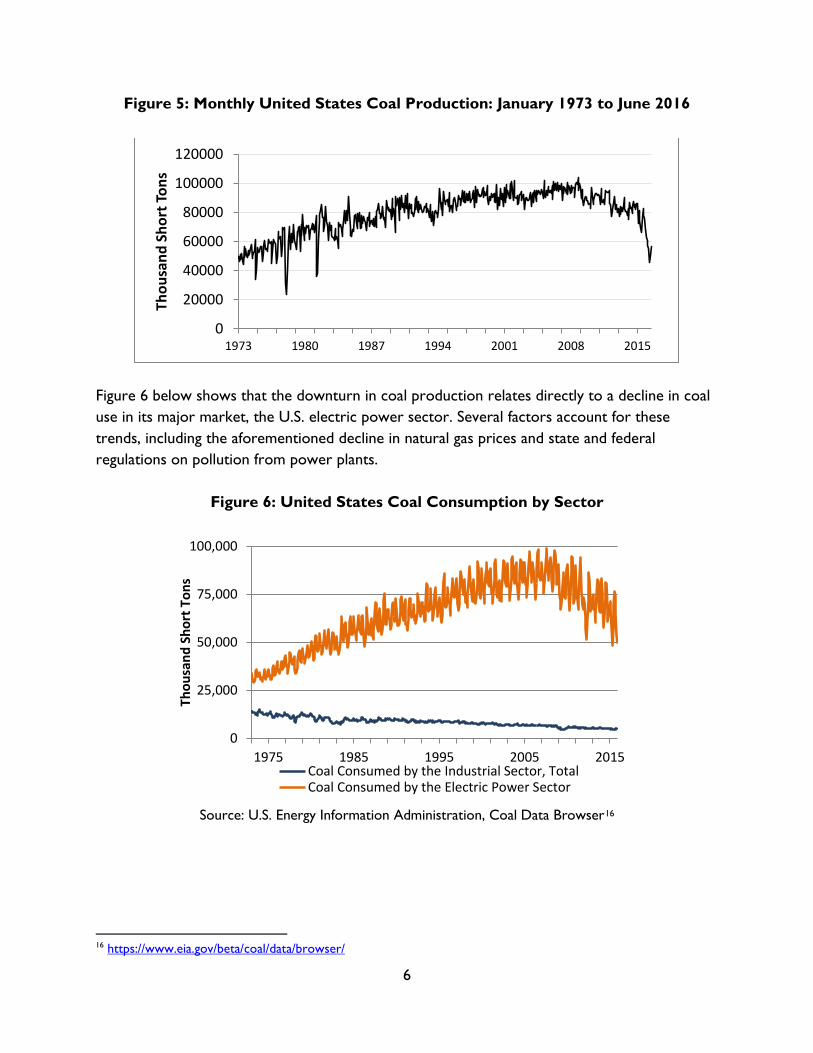
Figure 6 below shows that the downturn in coal production relates directly to a decline in coal use in its major market, the U.S. electric power sector. Several factors account for these trends, including the aforementioned decline in natural gas prices and state and federal regulations on pollution from power plants.
Figure 6: United States Coal Consumption by Sector
Source: U.S. Energy Information Administration, Coal Data Browser16
16 https://www.eia.gov/beta/coal/data/browser/
0
20000
40000
60000
80000
100000
120000
1973 1980 1987 1994 2001 2008 2015
Thou
sand
Sho
rt To
ns
0
25,000
50,000
75,000
100,000
1975 1985 1995 2005 2015
Thou
sand
Sho
rt T
ons
Coal Consumed by the Industrial Sector, TotalCoal Consumed by the Electric Power Sector

7
What energy market fluctuations mean for state revenues The swings in prices and quantities of fossil fuels produced in the United States, along with huge booms and busts in drilling activities, have made for volatile revenue streams for some state and local governments. Here we consider the recent history of the state-level revenues that tie most directly to mineral production: severance taxes and royalty payments. Severance taxes are taxes on extracted nonrenewable resources such as crude oil, natural gas, and coal, and overall they comprise the most significant mineral-related revenue instrument.17 States also receive royalties, lease bonuses, and rents from mineral production on state lands, and the federal government gives them a cut of the royalties from production on federal lands in their jurisdictions. The patterns of ownership vary greatly across states, even ones that are major energy producers. For example, over 61 percent of the land in Alaska is administered by federal government agencies, whereas less than 2 percent of Texas is.18 The applicable tax or royalty provisions differ by state, for different kinds of owners, and by the kind, quantity, and value of the minerals produced. Despite these wide differences, most states with significant fossil fuel production have revenues that depend directly on the total value of minerals produced within their borders, and thus they all face similar challenges that arise from volatile markets. 19 Severance taxes Most states have some version of a severance tax; typically, it is a percent of gross or net value at the point of production, but some states apply it to the volume of production rather than the value.20 Severance tax rates and bases vary widely across and within states, for example by mineral, type of well, or volume of production.21 Severance taxes can apply to production on private and public land. The share of value or production on public lands that firms pay in royalties to governments (and sometime other costs) may not be subject to the severance tax. Figure 7 below shows that total inflation-adjusted quarterly severance tax collections by states have varied widely since 2000, with a peak in nominal terms of almost $8 billion in the second 17 http://www.investopedia.com/terms/s/severance-tax.asp. 18 Hardy Vincent, C., L. Hanson, and J. Bjelopera, “Federal Land Ownership: Overview and Data,” Congressional Research Service, R42346, December 29, 2014. https://www.fas.org/sgp/crs/misc/R42346.pdf. The statistics understate the total federal share as they include only land controlled by five agencies: the Bureau of Land Management, Forest Service, Fish and Wildlife Service, National Park Service, and the Department of the Defense. 19 Brown, C., 2013. State Revenues and the Natural Gas Boom: An Assessment of State Oil and Gas Production Taxes. National Council of State Legislatures, Washington, DC. http://www.ncsl.org/research/energy/state-revenues-and-the-natural-gas-boom.aspx 20 A compendium of state severance tax policies for natural gas appears here: http://www.ncsl.org/research/energy/taxing-natural-gas-production.aspx. Weber et al (2016) also has an appendix that documents state severance tax policies. 21 http://www.ncsl.org/research/energy/oil-and-gas-severance-taxes.aspx#severance

8
quarter of 2008 to a value recently of about $1.5 billion.22 The recent downturn has been especially challenging for fossil-intensive states.
Figure 7: Total State Severance Tax Revenue, Quarterly (Q1 2001 to Q1 2016)
Royalties and related mineral revenue from public lands
Royalties are a percent of the market proceeds of the minerals, often after subtracting some production costs. A lease bonus is a payment to the state upon the signing of the mineral lease. Royalty rates are often set in law, but lease auctions often determine the bonus payments may. Leasees may also be subject to annual administrative fees and rent payments, which are usually a small share of their overall payments to the state.
The typical federal royalty rate is 12.5 percent of the gross value of production.23According to Tax Foundation calculations, state governments receive about 17.5 percent of the royalties the federal government collects, in recent years nearly all of it from onshore operations.24 Most federal mineral revenues come from oil (68 percent), followed by natural gas (18 percent), coal (9 percent), natural gas liquids (3 percent), and other products, from gold to gravel (2 percent).25
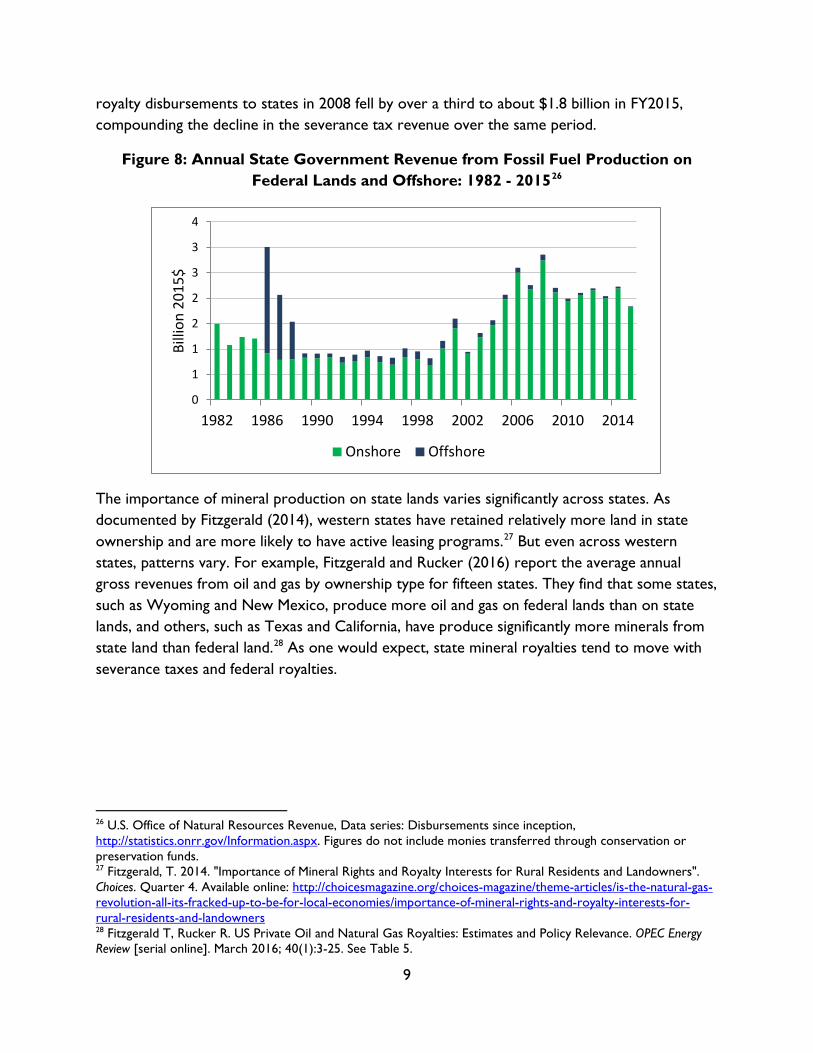
Figure 8 below shows the total inflation-adjusted receipts by state governments from production on federally-controlled areas. Severance tax revenue and states’ share of royalties collected by the federal government move together; the high of over $2.8 billion in federal
22 U.S. Census of Governments, Quarterly Summary of State & Local Taxes; Table 3: State Tax Collection by State and Type of Tax; Not Seasonally Adjusted T53 Severance Taxes. Data extracted July 29, 2016. https://www.census.gov/econ/currentdata/dbsearch?program=QTAX&startYear=1992&endYear=2016&categories=QTAXCAT3&dataType=T53&geoLevel=US¬Adjusted=1&submit=GET+DATA&releaseScheduleId= 23 http://www.blm.gov/wo/st/en/prog/energy/oil_and_gas/questions_and_answers.html 24 http://taxfoundation.org/article/federal-mineral-royalty-disbursements-states-and-effects-sequestration 25 http://statistics.onrr.gov/ReportTool.aspx , data from FY2015, Reported Revenues by Category.
0
2
4
6
8
10
2001 2003 2005 2007 2009 2011 2013 2015
Billi
on 2
015$
9
royalty disbursements to states in 2008 fell by over a third to about $1.8 billion in FY2015, compounding the decline in the severance tax revenue over the same period.
Figure 8: Annual State Government Revenue from Fossil Fuel Production on Federal Lands and Offshore: 1982 - 201526
The importance of mineral production on state lands varies significantly across states. As documented by Fitzgerald (2014), western states have retained relatively more land in state ownership and are more likely to have active leasing programs.27 But even across western states, patterns vary. For example, Fitzgerald and Rucker (2016) report the average annual gross revenues from oil and gas by ownership type for fifteen states. They find that some states, such as Wyoming and New Mexico, produce more oil and gas on federal lands than on state lands, and others, such as Texas and California, have produce significantly more minerals from state land than federal land.28 As one would expect, state mineral royalties tend to move with severance taxes and federal royalties.
26 U.S. Office of Natural Resources Revenue, Data series: Disbursements since inception, http://statistics.onrr.gov/Information.aspx. Figures do not include monies transferred through conservation or preservation funds. 27 Fitzgerald, T. 2014. "Importance of Mineral Rights and Royalty Interests for Rural Residents and Landowners". Choices. Quarter 4. Available online: http://choicesmagazine.org/choices-magazine/theme-articles/is-the-natural-gas-revolution-all-its-fracked-up-to-be-for-local-economies/importance-of-mineral-rights-and-royalty-interests-for-rural-residents-and-landowners 28 Fitzgerald T, Rucker R. US Private Oil and Natural Gas Royalties: Estimates and Policy Relevance. OPEC Energy Review [serial online]. March 2016; 40(1):3-25. See Table 5.
0
1
1
2
2
3
3
4
1982 1986 1990 1994 1998 2002 2006 2010 2014
Billi
on 2
015$
Onshore Offshore

10
Total Revenue Tied Directly to Mineral Production
The overall fiscal challenge of direct mineral-based revenues, then, is best viewed as the combined value of the three receipt streams, as shown in Figure 9 below.29 The graph shows that over the last decade or so, annual changes in these revenues have often amounted to 20 percent or more.
Figure 9. State Revenues Tied Directly to Mineral Production
Other revenues
So far, we have only considered tax revenues directly tied to mineral productions. Other state revenues, particularly in fossil-intensive states, depend on mineral production via taxes on business and personal income, property, and indirect revenues generated by the activity, such as sales taxes. For example, Alaska gets about 10.5 percent of its tax revenue from a tax on oil and gas property.30
These associated revenues vary greatly by state, and the usual cross-state data sources do not separate mineral-related revenue from other revenues for these instruments. Thus it is hard to determine just how important they are. Fitzgerald and Rucker (2016) estimate that the share of total oil and natural gas production in the United States that is attributable to privately-owned resources is about 75 percent. Thus, in addition to incurring severance taxes, mineral
29 State mineral royalties are available from the U.S. Census of Governments. The online database, accessed August 2, 2016, includes data from 2003 to 2013 in the “State by Type of Government - Public Use Format” file. Royalties states generate from state lands appear in Code U41. We estimated state royalties in 2014 and 2015 by applying the average ratio of state to federal royalties in the previous years. 30 http://www.tax.alaska.gov/programs/programs/reports/AnnualReport.aspx?Year=2015
0
5
10
15
20
25
30
35
2003 2004 2005 2006 2007 2008 2009 2010 2011 2012 2013 2014 2015
Billi
on 2
015$
Severance Tax State Share of Federal Royalties
State Royalties State Royalties (Estimated)

11
production generates significant net private income (personal and corporate) that may be taxable in the state in which it is earned (even if the mineral owners reside elsewhere). That suggests that some states may be more dependent on fossil resources than the direct mineral revenues shown above would suggest. 3. FOSSIL-DEPENDENT REVENUES
So far, the discussion has looked at state mineral revenues in aggregate, but the policy challenges really play out within the specific states that rely on them. One way to identify states with the most fossil-intensive economies is by quantifying the role of fossil energy production in the state economy. The U.S. Bureau of Economic Analysis compiles state-level data on gross domestic product (GDP).31 These statistics identify economic activity in mining (production itself and related support activities), which includes the production of oil, natural gas, and coal.32 Mining also includes production of non-fossil minerals, but oil, gas, and coal overwhelmingly dominate the values. The states in which mining provides the greatest share of GDP appear in Figure 10 below. Four states (Wyoming, Alaska, West Virginia, and North Dakota) have economies in which mining is more than 10 percent of GDP; Wyoming takes the lead with more than 20 percent of its economy in mining.
Figure 10. Nine Most Mining-Intensive State Economies
Now let us consider states’ fiscal dependence on mineral-related revenue streams. This is a little more complicated than it sounds, in part because statistical agencies do not count
31 For more on regional economic accounts, see: Measuring the Nation’s Economy: A Guide to the Bureau of Economic Analysis, http://www.bea.gov/agency/pdf/BEA_Customer_Guide.pdf#page=19. 32 http://www.bea.gov/iTable/iTable.cfm?reqid=70&step=1&isuri=1&acrdn=2#reqid=70&step=1&isuri=1
0%
5%
10%
15%
20%
25%
Wyoming Alaska WestVirginia
NorthDakota
Oklahoma NewMexico
Texas Montana Louisiana
Min
ing
GDP
/ To
tal S
tate
G
DP
12
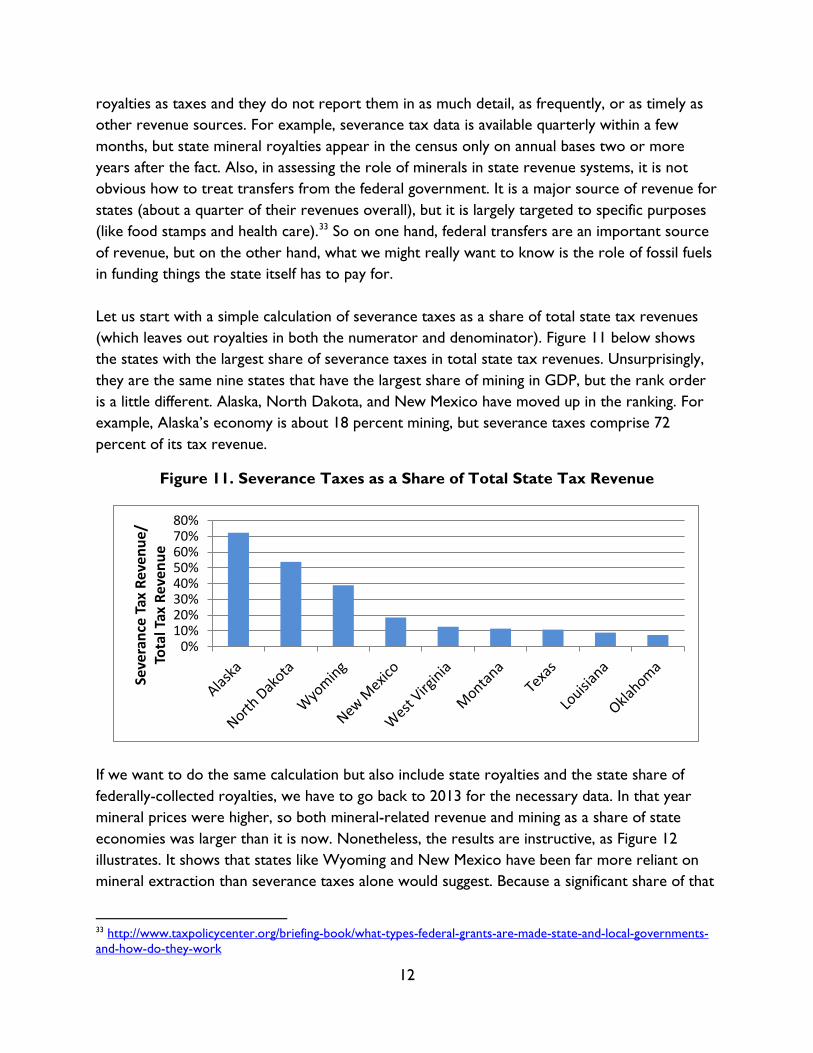
royalties as taxes and they do not report them in as much detail, as frequently, or as timely as other revenue sources. For example, severance tax data is available quarterly within a few months, but state mineral royalties appear in the census only on annual bases two or more years after the fact. Also, in assessing the role of minerals in state revenue systems, it is not obvious how to treat transfers from the federal government. It is a major source of revenue for states (about a quarter of their revenues overall), but it is largely targeted to specific purposes (like food stamps and health care).33 So on one hand, federal transfers are an important source of revenue, but on the other hand, what we might really want to know is the role of fossil fuels in funding things the state itself has to pay for. Let us start with a simple calculation of severance taxes as a share of total state tax revenues (which leaves out royalties in both the numerator and denominator). Figure 11 below shows the states with the largest share of severance taxes in total state tax revenues. Unsurprisingly, they are the same nine states that have the largest share of mining in GDP, but the rank order is a little different. Alaska, North Dakota, and New Mexico have moved up in the ranking. For example, Alaska’s economy is about 18 percent mining, but severance taxes comprise 72 percent of its tax revenue.
Figure 11. Severance Taxes as a Share of Total State Tax Revenue
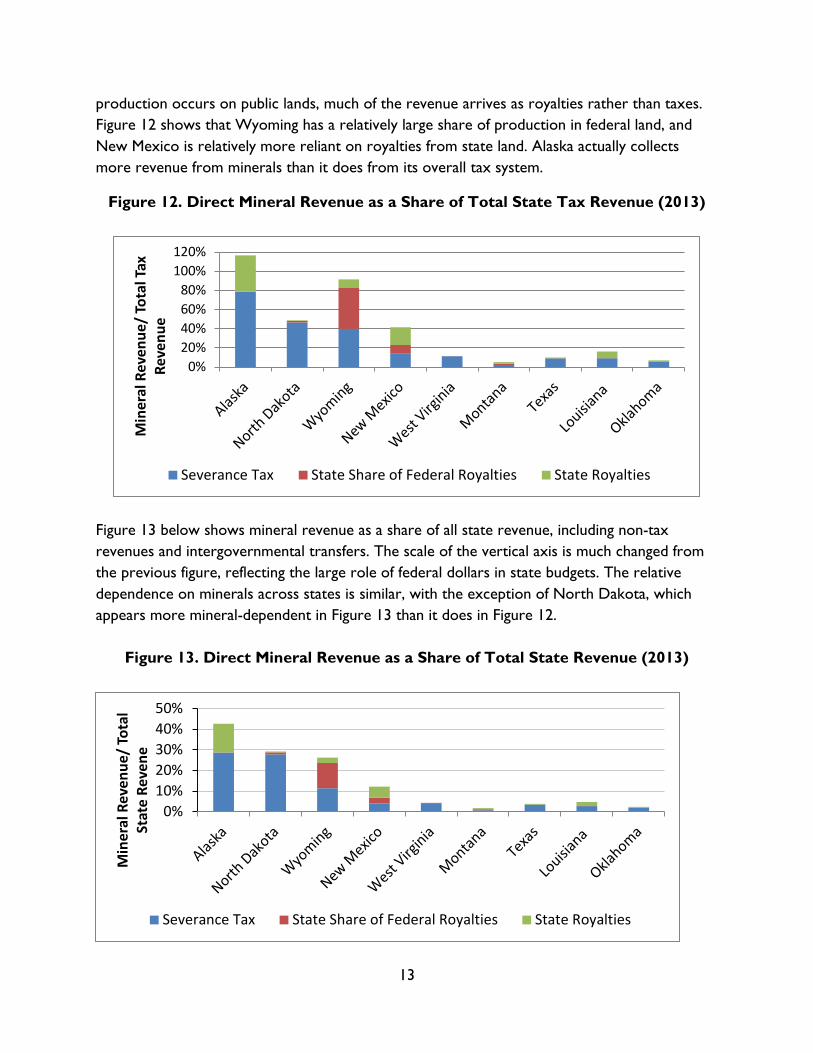
If we want to do the same calculation but also include state royalties and the state share of federally-collected royalties, we have to go back to 2013 for the necessary data. In that year mineral prices were higher, so both mineral-related revenue and mining as a share of state economies was larger than it is now. Nonetheless, the results are instructive, as Figure 12 illustrates. It shows that states like Wyoming and New Mexico have been far more reliant on mineral extraction than severance taxes alone would suggest. Because a significant share of that
33 http://www.taxpolicycenter.org/briefing-book/what-types-federal-grants-are-made-state-and-local-governments-and-how-do-they-work
0%10%20%30%40%50%60%70%80%
Seve
ranc
e Ta
x Re
venu
e/
Tota
l Tax
Rev
enue
13
production occurs on public lands, much of the revenue arrives as royalties rather than taxes. Figure 12 shows that Wyoming has a relatively large share of production in federal land, and New Mexico is relatively more reliant on royalties from state land. Alaska actually collects more revenue from minerals than it does from its overall tax system.
Figure 12. Direct Mineral Revenue as a Share of Total State Tax Revenue (2013)
Figure 13 below shows mineral revenue as a share of all state revenue, including non-tax revenues and intergovernmental transfers. The scale of the vertical axis is much changed from the previous figure, reflecting the large role of federal dollars in state budgets. The relative dependence on minerals across states is similar, with the exception of North Dakota, which appears more mineral-dependent in Figure 13 than it does in Figure 12.
Figure 13. Direct Mineral Revenue as a Share of Total State Revenue (2013)
0%20%40%60%80%
100%120%
Min
eral
Rev
enue
/ To
tal T
ax
Reve
nue
Severance Tax State Share of Federal Royalties State Royalties
0%10%20%30%40%50%
Min
eral
Rev
enue
/ To
tal
Stat
e Re
vene
Severance Tax State Share of Federal Royalties State Royalties
14
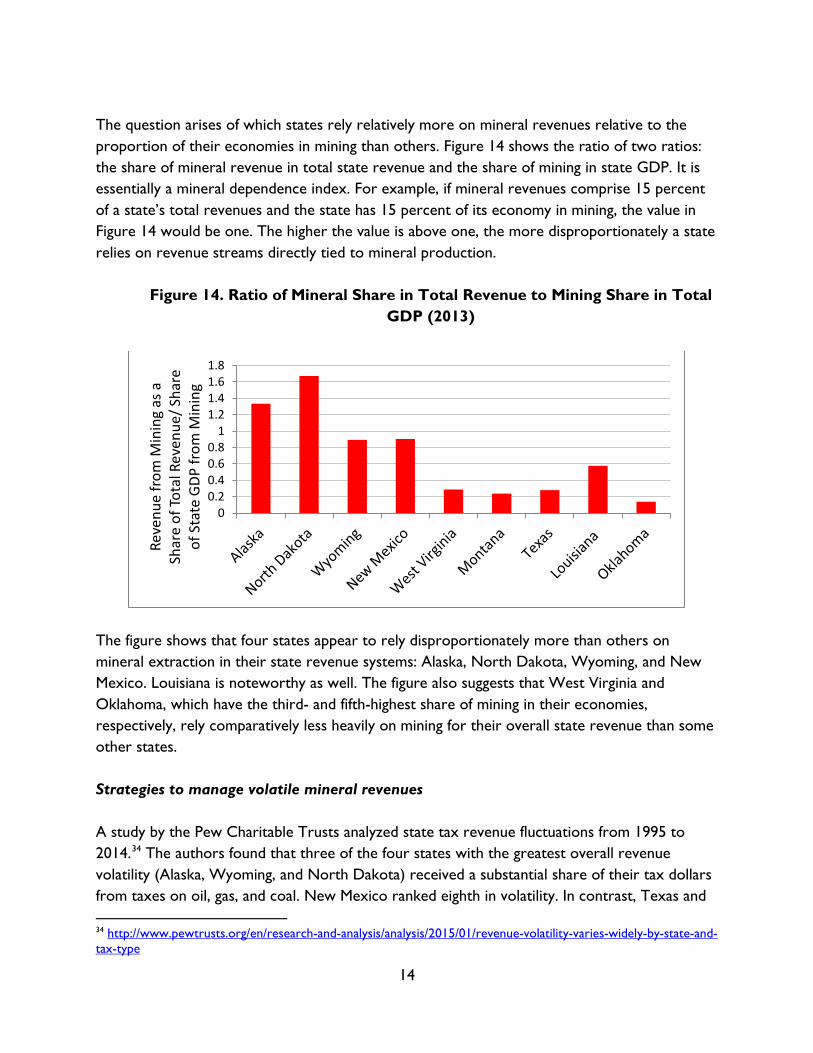
The question arises of which states rely relatively more on mineral revenues relative to the proportion of their economies in mining than others. Figure 14 shows the ratio of two ratios: the share of mineral revenue in total state revenue and the share of mining in state GDP. It is essentially a mineral dependence index. For example, if mineral revenues comprise 15 percent of a state’s total revenues and the state has 15 percent of its economy in mining, the value in Figure 14 would be one. The higher the value is above one, the more disproportionately a state relies on revenue streams directly tied to mineral production.
Figure 14. Ratio of Mineral Share in Total Revenue to Mining Share in Total GDP (2013)
The figure shows that four states appear to rely disproportionately more than others on mineral extraction in their state revenue systems: Alaska, North Dakota, Wyoming, and New Mexico. Louisiana is noteworthy as well. The figure also suggests that West Virginia and Oklahoma, which have the third- and fifth-highest share of mining in their economies, respectively, rely comparatively less heavily on mining for their overall state revenue than some other states. Strategies to manage volatile mineral revenues A study by the Pew Charitable Trusts analyzed state tax revenue fluctuations from 1995 to 2014.34 The authors found that three of the four states with the greatest overall revenue volatility (Alaska, Wyoming, and North Dakota) received a substantial share of their tax dollars from taxes on oil, gas, and coal. New Mexico ranked eighth in volatility. In contrast, Texas and 34 http://www.pewtrusts.org/en/research-and-analysis/analysis/2015/01/revenue-volatility-varies-widely-by-state-and-tax-type
00.20.40.60.8
11.21.41.61.8
Reve
nue
from
Min
ing
as a
Sh
are
of To
tal R
even
ue/ S
hare
of
Sta
te G
DP fr
om M
inin
g

15
Montana, which both have some of the highest share of severance taxes in their total tax revenues, complemented volatile mineral revenues with more stable taxes to achieve a volatility score only very slightly above the average for all states. Other means exist to deal with revenue volatility. In particular, states can channel revenue into permanent trust funds, as Saha and Muro (2016) explain, and spend the earnings of the funds rather than their principle.35 For example, Texas’ constitution established a Permanent University Fund which receives all revenues from onshore minerals and other state-land-related revenues and funds higher education out of the earnings. Texas helps fund public schools with the Permanent School Fund, which receives the proceeds from mineral production in state-controlled offshore areas.36 Texas also has an Economic Stabilization Fund that receives three-quarters of any severance tax revenue above those revenues in a benchmark year (1987).37 Sovereign wealth funds and rainy day funds, such as those in Texas, can indeed stabilize government budgets. Their design is important, however. A report by the Pew Charitable Trusts found that rainy day funds have been key to helping states manage ups and downs in revenue, but some are more effective than others. 38 The study finds that “states often fail to tie deposits to observed patterns of volatility, mistake one-time windfalls for long-term growth, set fund caps that provide inadequate protection against downturns, and make saving for the future a low priority within the budget process.” The good news is that most resource-rich states have saved reasonably well in their boom years. Using 51 years of state-level data, James (2015) finds that “a $1.00 increase in resource revenue reduces non-resource revenue by $0.25 and increases [state] savings by $0.83.”39 This good management means that recent declines in fossil fuel-related revenue have not yet affected cross-state fiscal comparisons. For example, the 2016 edition of the annual ranking by Mercatus Research of states by fiscal condition finds that Alaska, Nebraska, Wyoming, North Dakota, and South Dakota rank as the top five most fiscally solvent states.40 However, the
35 Devashree Saha and Mark Muro, “Permanent Trust Funds: Funding Economic Change with Fracking Revenues,” Brookings, April 2016. https://www.brookings.edu/wp-content/uploads/2016/07/Permanent-Trust-Funds-Saha-Muro-418-1.pdf; Compendia of of state permanent natural trust funds appears here: https://useiti.doi.gov/how-it-works/state-laws-and-regulations/ and here: https://www.brookings.edu/wp-content/uploads/2016/07/Appendix.pdf. 36 Handbook of Texas Online, Vivian Elizabeth Smyrl, "Permanent University Fund," accessed August 04, 2016, https://tshaonline.org/handbook/online/articles/khp02; http://tea.texas.gov/Finance_and_Grants/Permanent_School_Fund/ 37 http://www.texastransparency.org/State_Finance/Budget_Finance/Fiscal_Briefs/pdf/EconomicStabilizationFund.pdf 38 Building State Rainy Day Funds: Policies to Harness Revenue Volatility, Stabilize Budgets, and Strengthen Reserve, July 2014. http://www.pewtrusts.org/~/media/assets/2014/07/sfh_rainy-day-fund-deposit-rules-report_artready_v9.pdf 39 James, A., “US State Fiscal Policy and Natural Resources,” American Economic Journal: Economic Policy 2015, 7(3): 238–257. 40 Norcross, E. and O. Gonzalez, “Ranking the States by Fiscal Condition 2016 Edition,” Mercatus Research, June 2016. http://mercatus.org/sites/default/files/Norcross-Fiscal-Rankings-2-v3_1.pdf

16
study uses data from FY2014, when the states had a record high ratio of cash reserves to short-term liabilities, and focuses on financing short run liabilities. The study notes: “If more emphasis (weight) were given to the long run, these states would fare relatively worse. The individual solvency rankings show that Alaska performs relatively well in the short run but has large pension liabilities and spending levels relative to state income.”41 In addition, the best-designed and managed funds are not necessarily robust to long term structural changes we may be seeing in fossil fuel markets. Thus it bears thinking through what kinds of revenue and budgeting approaches states can adopt now to prepare for the day when carbon emissions end.
4. THE EXPERIENCE OF THE MOST FOSSIL-RELIANT STATES
This section reviews a few brief facts about three states that Figure 14 above suggests rely unusually heavily on mineral extraction for their revenue: Alaska, North Dakota, and Wyoming. This section also illustrates how in states like West Virginia, even if the statewide fiscal exposure to fossil fuels is manageable, local governments may bear far greater risks. Alaska Alaska’s revenue system is an outlier in how disproportionately it is tied to oil production, past and present.42 The state has four main sources of revenue: (1) oil revenue (severance taxes and royalties, for example); 2) income from other taxes and fees; 3) federal revenue; and 4) investment revenue from two funds, the Alaska Permanent Fund (APF) and the Constitutional Budget Reserve Fund (CBRF).43 In 1976, Alaska adopted a constitutional amendment that requires at least 25 percent of all mineral lease rentals, royalties, royalty sales proceeds, federal mineral revenue-sharing payments and bonuses received by the state be placed in a permanent fund, thereby establishing the APF.44 The APF is a diversified portfolio of assets like stocks, bonds and real estate managed by a corporation set up for that purpose. The state government can spend the earnings on the investments (but not the principle) for any public purpose; some of it goes to qualified Alaska residents as dividends. In recent months, this has proved problematic, and Alaska’s revenue officials acknowledge the challenge. An April 2016 press release from Alaska’s Department of Revenue quotes its 41 Ibid. p. 26 42 http://www.alaskabudget.com/revenue/. 43 Alaska Department of Revenue, Tax Division, Revenue Sources Book, 2016 Spring: file:///C:/Users/Home/Dropbox/state%20mineral%20wealth%20project/State%20Specific%20Information/Alaska/2016%20Budget%20and%20Revenue%20report.pdf 44 http://www.apfc.org/home/Content/aboutFund/aboutPermFund.cfm
17
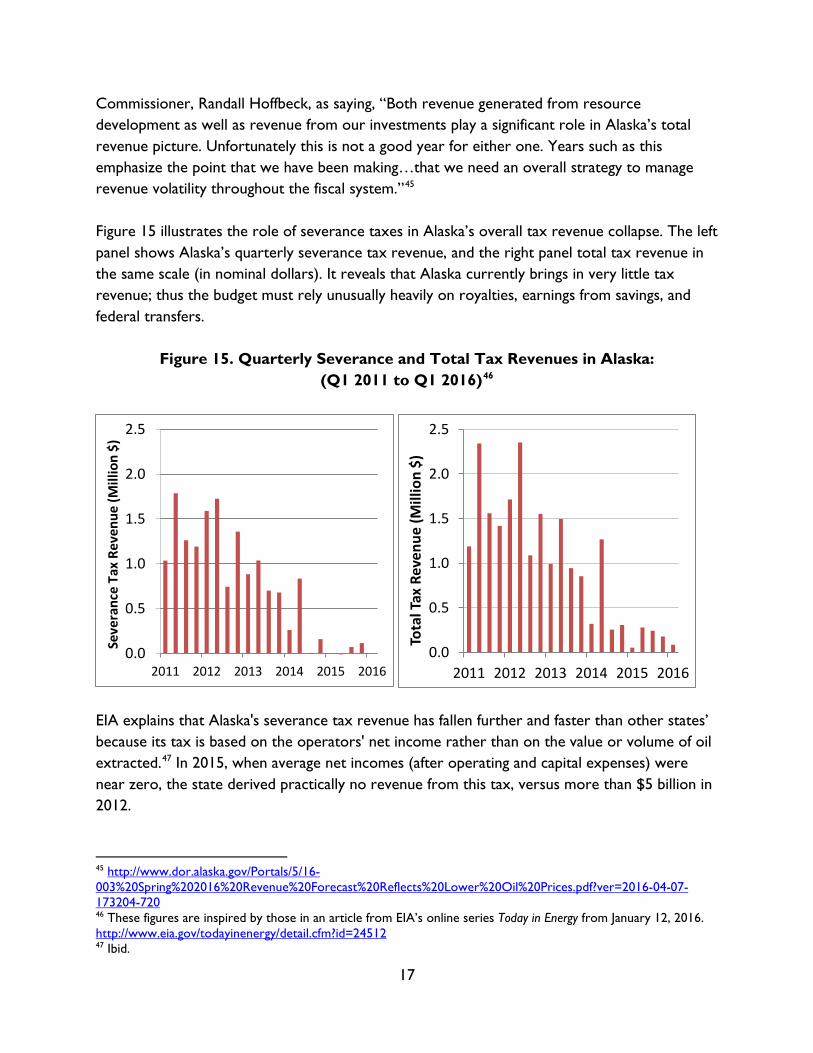
Commissioner, Randall Hoffbeck, as saying, “Both revenue generated from resource development as well as revenue from our investments play a significant role in Alaska’s total revenue picture. Unfortunately this is not a good year for either one. Years such as this emphasize the point that we have been making…that we need an overall strategy to manage revenue volatility throughout the fiscal system.”45 Figure 15 illustrates the role of severance taxes in Alaska’s overall tax revenue collapse. The left panel shows Alaska’s quarterly severance tax revenue, and the right panel total tax revenue in the same scale (in nominal dollars). It reveals that Alaska currently brings in very little tax revenue; thus the budget must rely unusually heavily on royalties, earnings from savings, and federal transfers.
Figure 15. Quarterly Severance and Total Tax Revenues in Alaska: (Q1 2011 to Q1 2016)46
EIA explains that Alaska's severance tax revenue has fallen further and faster than other states’ because its tax is based on the operators' net income rather than on the value or volume of oil extracted.47 In 2015, when average net incomes (after operating and capital expenses) were near zero, the state derived practically no revenue from this tax, versus more than $5 billion in 2012.
45 http://www.dor.alaska.gov/Portals/5/16-003%20Spring%202016%20Revenue%20Forecast%20Reflects%20Lower%20Oil%20Prices.pdf?ver=2016-04-07-173204-720 46 These figures are inspired by those in an article from EIA’s online series Today in Energy from January 12, 2016. http://www.eia.gov/todayinenergy/detail.cfm?id=24512 47 Ibid.
0.0
0.5
1.0
1.5
2.0
2.5
2011 2012 2013 2014 2015 2016
Seve
ranc
e Ta
x Re
venu
e (M
illio
n $)
0.0
0.5
1.0
1.5
2.0
2.5
2011 2012 2013 2014 2015 2016
Tota
l Tax
Rev
enue
(Mill
ion
$)

18
Section 3 showed that in Alaska, state royalty revenue is also important. Figure 16 shows annual data for these revenues (in fiscal years, nominal dollars); royalties are declining but not as severely as severance tax revenue.
Figure 16. Annual Oil and Gas Revenues from Alaska State Lands (Billion $)
North Dakota North Dakota has a number of fiscal strengths. It has far lower debt than most states, and it has managed its mineral wealth in special funds and capital investments. Yet, the recent downturn in oil and crop prices has taken its toll. According to news reports, it recently took “a three-day special session to impose about $152 million in cuts to most government agencies, move up to $100 million from North Dakota's state-owned bank and exhaust the remaining $75 million of a rainy day fund to make up for less-than-forecast revenue.”48 Figure 17 shows severance tax revenues (left panel) and total tax revenues (right panel). Total tax revenues have fallen by more than half from a peak a couple of years ago.
48 http://bismarcktribune.com/news/state-and-regional/north-dakota-s-senate-passes-budget-shortfall-bill/article_c0e6e782-651a-5e58-8641-8bfb94317bcd.html
$0.0
$1.0
$2.0
$3.0
$4.0
2000
2001
2002
2003
2004
2005
2006
2007
2008
2009
2010
2011
2012
2013
2014
2015

19
Figure 17. Quarterly Severance and Total Tax Revenues in North Dakota: (Q1 2011 to Q1 2016)
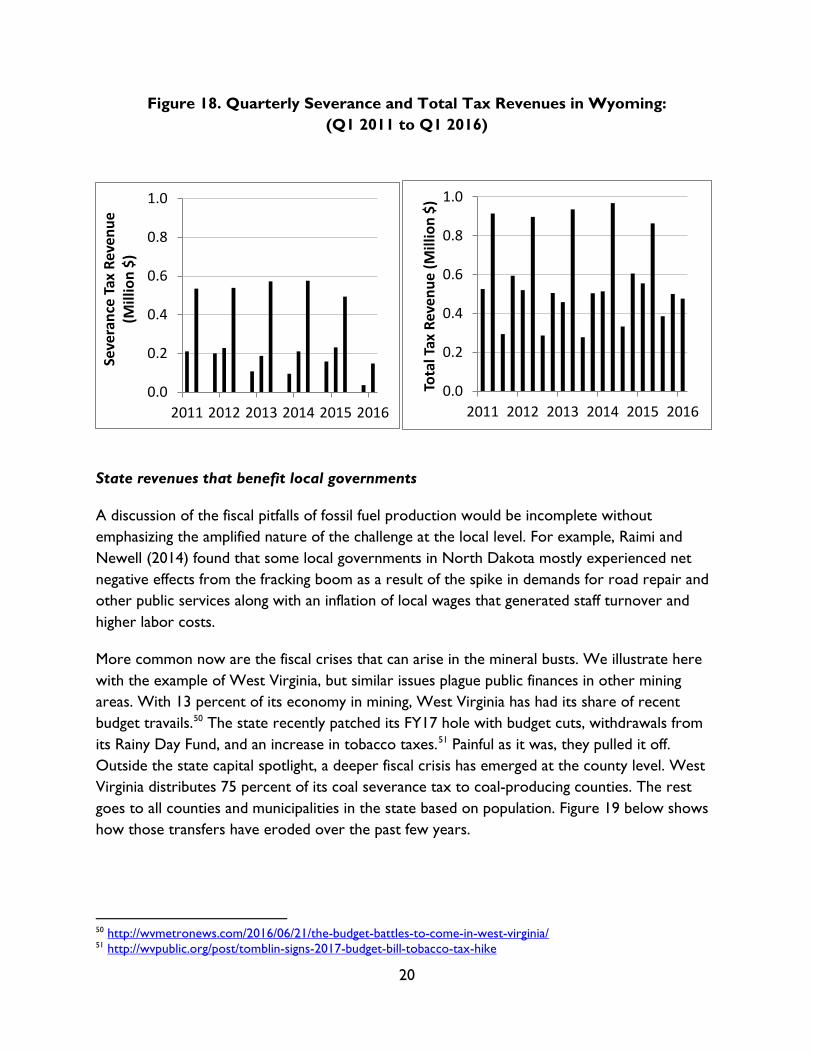
Wyoming Wyoming produces oil, natural gas, and coal, so the state currently faces a harsh confluence of market conditions for its tax base. Fossil fuels provide four direct sources of revenue: severance taxes, Federal mineral royalties, assessed valuation taxes (effectively property taxes), and lease bonus payments. In addition, extractive industries provide wages, which generate sales tax revenues and other revenue-producing spillovers.49 Figure 18 reports the severance tax situation there with highly seasonal quarterly data.
49 http://eadiv.state.wy.us/creg/Revenue_Update_April2016.pdf
0.0
0.5
1.0
1.5
2.0
2011 2012 2013 2014 2015 2016
Seve
ranc
e Ta
x (M
illio
n $)
0.0
0.5
1.0
1.5
2.0
2011 2012 2013 2014 2015 2016
Tota
l Tax
Rev
(Mill
ion
$)
20
Figure 18. Quarterly Severance and Total Tax Revenues in Wyoming: (Q1 2011 to Q1 2016)
State revenues that benefit local governments
A discussion of the fiscal pitfalls of fossil fuel production would be incomplete without emphasizing the amplified nature of the challenge at the local level. For example, Raimi and Newell (2014) found that some local governments in North Dakota mostly experienced net negative effects from the fracking boom as a result of the spike in demands for road repair and other public services along with an inflation of local wages that generated staff turnover and higher labor costs.
More common now are the fiscal crises that can arise in the mineral busts. We illustrate here with the example of West Virginia, but similar issues plague public finances in other mining areas. With 13 percent of its economy in mining, West Virginia has had its share of recent budget travails.50 The state recently patched its FY17 hole with budget cuts, withdrawals from its Rainy Day Fund, and an increase in tobacco taxes.51 Painful as it was, they pulled it off. Outside the state capital spotlight, a deeper fiscal crisis has emerged at the county level. West Virginia distributes 75 percent of its coal severance tax to coal-producing counties. The rest goes to all counties and municipalities in the state based on population. Figure 19 below shows how those transfers have eroded over the past few years.
50 http://wvmetronews.com/2016/06/21/the-budget-battles-to-come-in-west-virginia/ 51 http://wvpublic.org/post/tomblin-signs-2017-budget-bill-tobacco-tax-hike
0.0
0.2
0.4
0.6
0.8
1.0
2011 2012 2013 2014 2015 2016
Seve
ranc
e Ta
x Re
venu
e (M
illio
n $)
0.0
0.2
0.4
0.6
0.8
1.0
2011 2012 2013 2014 2015 2016To
tal T
ax R
even
ue (M
illio
n $)

21
Figure 19: West Virginia Coal Severance Tax Paid to Counties, Quarterly52
Just as severance tax revenue has dwindled for southern West Virginia coalfield counties, their property tax revenues have plunged; unemployment has soared to 10 percent or more in some counties, as illustrated in Figure 20.53
Figure 20: West Virginia Unemployment Rates by County, June 201654
The abrupt collapse of its tax base has hit Boone County, West Virginia, especially hard. The budget crisis has forced wage and benefit cuts for teachers, and the county faces lawsuits from
52 http://www.wvtreasury.com/Banking-Services/Revenue-Distributions/Coal-Severance-Tax 53 Bureau of Labor Statistics , Unemployment Rates by Count, Not Seasonally Adjusted, June 2016. http://data.bls.gov/map/MapToolServlet?survey=la&map=county&seasonal=u&datatype=unemployment&year=2016&period=M06&state=54 54 http://www.wvtreasury.com/Banking-Services/Revenue-Distributions/Coal-Severance-Tax
0
2
4
6
8
10
12
Q1-2005 Q1-2007 Q1-2009 Q1-2011 Q1-2013 Q1-2015
Mill
ions
of D
olla
rs
22
the teachers unions.55 Although the state has stepped in with some supplemental appropriations for the county, the severity of the fiscal challenges there will take years to resolve.56
5. CONCLUSION
On one hand, efficiency and distributional advantages make it sensible for states to tax resource rents. Ad valorem taxes, like royalties and severance taxes based on gross production values, are naturally inflation adjusted, and state residents should rightfully benefit from production on their public lands.57 On the other hand, both mineral production levels and real mineral prices can fluctuate dramatically, even from one quarter to the next, making severance and royalty revenues hard to forecast and budget around. In the most fossil-intensive areas, other revenues are correlated with mineral revenue, arguably leaving tax bases irresponsibly undiversified. Moreover, structural trends in fossil energy markets and growing climate concerns suggest a cloudy future for some resources, especially coal, over the coming decades.
A detailed discussion of exactly what to do about these challenges is beyond the scope here, but a few standard good-government principles apply. For example, as Elizabeth McNichol observes, “[n]o matter when a state decides to replenish its reserves, now is a reasonable time for states to improve the design of their rainy day funds to remove barriers to adequate funding, since such improvements cost nothing.”58 This can involve loosening overly restrictive caps on their size, easing rules on making deposits in good times, and integrating rainy day fund transfers into the budget as part of an overall process that prioritizes saving.59 Many of the same principles apply to the design and management of permanent funds.
And, as Cornia and Nelson (2010) note, although states cannot alter the volatility of their economies in the short run, they can change their tax portfolios to minimize the effects of economic fluctuations on their fiscal conditions.60 A literature describes the inevitable tradeoffs involved in constructing these portfolios, but emphasizes the utility in thinking deliberately about revenue stability.61 For example, sales taxes--and consumption taxes more generally—are likely to move with the broader economy, which is subject to business cycles, but in most areas would be less correlated with the gyrations of mineral markets. However, consumption taxes
55 http://www.wvgazettemail.com/gazette-editorials/20160719/gazette-editorial-boone-countys-painful-adjustment 56 http://www.wsaz.com/content/news/WVa-Senate-passes-bill-to-help-fund-Boone-County-Schools-382856441.html 57 This advantage was noted in analysis from the 1970’s: https://naldc.nal.usda.gov/naldc/download.xhtml?id=CAT79709477&content=PDF 58 McNichol, Elizabeth. 2014. “When and How Should States Strengthen Their Rainy Day Funds.” Washington, DC: Center on Budget and Policy Priorities. http://www.cbpp.org/research/state-budget-and-tax/when-and-how-states-should-strengthen-their-rainy-day-funds 59 http://www.taxpolicycenter.org/briefing-book/what-are-state-rainy-day-funds-and-how-do-they-work 60 Gary C. Cornia and Ray D. Nelson, “State Tax Revenue Growth and Volatility,” Federal Reserve Bank of St. Louis Regional Economic Development, 2010, 6(1), pp. 23-58. https://core.ac.uk/download/files/153/6366033.pdf 61 http://www.cbpp.org/research/strategies-to-address-the-state-tax-volatility-problem

23
tend to be regressive and their revenue may grow more slowly than from an income tax. The individual income tax is relatively efficient, but revenues vary with the business cycle and can themselves be volatile if they are skewed towards capital gains and other investment earnings of high income individuals. Although property taxes are most typically imposed by local governments, states could consider adopting one to complement their other taxes. What is certain is that states should resist the temptation, and set up commitment devices like rainy day funds to help them do so, to justify permanent tax cuts with unsustainable revenue spikes.
Some observe that mineral-rich states could raise more revenue by promoting greater mineral production, such as by opening up new areas for exploration and drilling and approving new pipelines.62 This approach may expand the expected revenue base, but it does not reduce its variance. Further, as we saw in Section 2, increasing quantities do not necessarily make up for decreasing prices. Finally, expanding production may also rely on policy changes that may be even more controversial than other options to increase revenue or reduce spending.
Another approach would be to adjust the formulas for severance tax rates to vary less with real price swings. For example, states could shift from a pure ad valorem tax on mineral production value (gross or net of certain production costs) to an inflation-adjusted excise tax on the volume of production. An even more efficient approach would be to base the fossil fuel tax rate on the carbon-intensity of the minerals produced, thus helping internalize the external costs of their environmental damages. This would involve a tax that is about twice as high on coal than natural gas, per British thermal unit of energy; the tax on oil would be about midway between the two.63
A related option would be an excise tax on greenhouse gas emissions, which would price carbon from fossil fuel consumption rather than production. In this case, the tax base could include emissions generated in the mineral production process (such as carbon dioxide (CO2) emitted in the flaring of natural gas at wells and by fuel burned by fracking-water trucks) as well as emissions from electricity production, industrial processes, home heating, and the like. Because mineral production activities are emissions-intensive, not even counting the carbon embedded in the fuels themselves, such a tax would raise proportionately more revenue in mining states. For example, according to Morris et al (2016), a carbon tax of $20 per ton of CO2 emissions would raise only 0.5 percent of GDP in North Carolina or Florida, but in Alaska, North Dakota, and Wyoming, it could raise about 1.3, 2.2, and 3.3 percent of GDP, respectively.64
62 http://www.alaskabudget.com/fiscal-gap/ 63 EIA, How much carbon dioxide is produced when different fuels are burned? https://www.eia.gov/tools/faqs/faq.cfm?id=73&t=11 64 Morris, A., Y. Bauman, and D. Bookbinder, “State-Level Carbon Taxes: Options and Opportunities for Policymakers,” Brookings, July 28, 2016. https://www.brookings.edu/research/state-level-carbon-taxes-options-and-opportunities-for-policymakers/

24
Some states are already raising revenue through a cap-and-trade program for greenhouse gases by auctioning emission allowances. Carl and Fedor (2016) document the revenue from a range of cap-and-trade systems around the world.65 They report that the AB 32 program in California and the Regional Greenhouse Gas Initiative in mid-Atlantic and northeastern states brought in 0.05 and 0.01 percent of GDP in revenue respectively in 2013. Much of that revenue is currently targeted to environmental priorities. If expanded to cover more emissions at higher prices and revised to allow more flexible revenue use, such programs could play larger fiscal roles.
Finally, rainy day planning is an entirely different endeavor if you suddenly find yourself in a rain forest. Research shows that revenue diversification only reduces the revenue instability of a state that has a stable economic base.66 Beyond a certain level of economic instability, revenue diversification cannot help improve revenue stability. This means that the undeniably best long-run strategy for some state and local governments, particularly for the most coal-reliant areas, is to diversify their overall economy, not just their tax portfolio. Of course, this is easier said than done, but betting that the industry will rebound once pending regulations are defeated is not only a reckless economic strategy, but it is unwarranted by objective market projections.67
65 J. Carl, D.Fedor, Energy Policy, 96(2016)50–77 66 Yan, Wenli, “The Impact of Revenue Diversification and Economic Base on State Revenue Stability,” Journal of Public Budgeting, Accounting, and Financial Management, 24 (1), 58-81, Spring 2012. http://pracademics.com/attachments/article/837/Article%203_Yan.pdf 67 For this author’s perspective on this topic, see: Morris, Adele, “Build a Better Future for Coal Workers and Their Communities,” Brookings, April 25, 2016. https://www.brookings.edu/research/build-a-better-future-for-coal-workers-and-their-communities/