the challenges of hospital payment systems
TRANSCRIPT

The challenges of hospital payment systems
Jonathan Cylus and Rachel Irwin
Spending on hospital services has historicallybeen one of the largest shares of total healthcare expenditures for the majority of coun-tries in Europe and the developed world.1
According to the OECD, hospital spendingon average accounted for approximately one-third of total current expenditure on healthcare in European OECD countries in 2008,ranging from 26.7% in Slovakia to 46.9% inSweden (See Table 1). In some countries inthe WHO European region, particularly inCIS countries, inpatient expenditures as ashare of total health care expenditures has attimes been over 70%.2 As hospitals continueto consume a considerable share of healthcare resources, policymakers have looked tonew payment strategies to ensure that care isdelivered efficiently. Hospital financiers arefaced with the difficult task of designing systems aligning patient needs and providerincentives in order to obtain the best possiblevalue for money.
Varying payment methods
The financial incentives underlying hospitalpayment systems ultimately affect providers’organizational structure and treatment patterns. In the past, most European coun-tries paid for hospital care through paymentsystems such as global fixed budgets, fixedrates per admission or per diem rates basedon the number of bed days. Each of thesesystems encourages different approaches toproviding hospital care. For example, fixedpayments per admission incentivize hospitalsto increase the number of admissions, whilefixed payments per diem encourage lengthierhospital stays. Hospitals paid under both of
these systems also become more profitable byincreasing their capacity and reducing thequantity of inputs per patient. Additionally,global fixed budgets tend to induce providersto under-provide services; however, they maypromote more efficient care as providers aimnot to waste their fixed resources and subse-quent profits.3 These flat-rate or fixed budgetpayment systems have contributed to performance issues and declining health outcomes in some countries. For example, incountries where hospitals were given exces-sively large budgetary resources relative tothe rest of the health system, patients withminor health conditions often were referredto hospitals when they could have been more effectively and efficiently treated in outpatient or primary care settings.4 For themost part, these payment systems do not reflect the varying intensity associated withtreating different types of patients. In response, many European countries now incorporate case-based payments into theirhospital payment structures (Table 1).
Case-based payments
To deal with high cost growth, in 1983 the USdeveloped a hospital case-based payment sys-tem known as the Prospective Payment Sys-tem (PPS) to pay hospitals to treat Medicarebeneficiaries, thereby replacing the previousfee-for-service system. Such case-based payment systems are intended to categorizehospital interventions according to their intensity. Each episode of care is grouped intowhat is typically called a diagnostic relatedgroup (DRG). Box 1 outlines the main characteristics of DRG-type systems.
Contents
The challenges of 1 hospital payment systems
DRG-type hospital 4payment in Germany: The G-DRG system
Structural reforms 7 and hospital payment in the Netherlands
Financing of hospital 10care in Finland
Euro ObserverThe Health Policy Bulletinof the European Observatory on Health Systems and Policies
Autumn 2010
Volume 12, Number 3
The Observatory is a partnership between the WHO Regional Office for Europe, the Governments of Belgium, Finland,Ireland, the Netherlands, Norway, Slovenia, Spain, Sweden and the Veneto Region of Italy, the European Commission, the European Investment Bank, the World Bank, UNCAM (French National Union of Health Insurance Funds), the London School of Economics and Political Science and the London School of Hygiene & Tropical Medicine.

Eu r o Ob s e r v e rEu r o Ob s e r v e r Vo l ume 12 , N umbe r 3Vo l ume 12 , N umbe r 3
2
Originally, case categorization approaches like DRGs were developed to monitor quality and utilization ofservices.5 In essence, a case-based pay-ment system such as this aims to reim-burse hospitals based on the approximatecosts of treating certain types of patientsassuming standardized efficient practices.Most countries in Europe base their classifications to some extent on the USDRG or Australian refined DRG systems, although data collection methods and reimbursement rates differamong countries.6 Busse et al6 have argued that if we see hospital paymentmechanisms on a continuum, case-basedpayments may appear to fit in the middle
between the European and US startingpoints, with Europe and the US converg-ing towards DRGs from very differentperspectives.
Relative advantages and disadvantages
The main advantage of incorporatingcase-based payments into a hospital pay-ment system is to incentivize hospitals toprovide more efficient care. Because case-based payment systems reimburse hospi-tals based on the approximate inputs thatare needed to treat a specific case, it is notprofitable for hospitals to provide unnec-essary services or to encourage long
lengths of stay. Hospitals are financiallymotivated to use more appropriate meansof care to treat patients and to eliminatewaste. To that end, hospitals also are incentivized to constrain their capacity(ie. number of hospital beds, size or number of departments) to a reasonablelevel to satisfy patient demand. The useof tools such as DRGs also allows forcomparison of hospital performance.
However, as with all payment systems,case-based payment systems have the potential for unintended consequences.For one, they can lead to what is termedDRG creep or upcoding, where hospitalscategorize patients into DRGs that offer
Table 1. Hospital Spending in Selected European Countries, 2008
Hospital spending as a% share of total currentexpenditure on health
Hospital spending per capita, US$, Purchasing
Power ParityHospital payment scheme
Austriaa 38.8 1393 Payment per case/DRG (47%)/retrospective reimbursement of costs (48%)
Belgium 31.2 1147 Payment per case (45%) + payment per procedure (41%) + payments for drugs (14%)
Czech Republic 45.8 796 Prospective global budget (75%) + per case (15%) + per procedure (8%)
Denmarka 46.2 1567 Prospective global budget (80%) + payment per case/DRG (20%)
Estonia 46.5 563 Case-based payment
Finland 35.3 1010 Payment per case/DRG
France 35.0 1259 Payment per case/DRG
Germany 29.4 1061 Global budgets and payment per case/DRG
Hungary 33.1 463 Payment per case/DRG
Iceland 40.6 1363 Prospective global budget
Luxembourgc 33.4 1322 Prospective global budget
Netherlands 37.0 1378 Adjusted global budget (80%) + payment per case/DRG (20%)
Norwayb 38.2 1613 Prospective global budget (60%) + payment per procedure (40%)
Poland 34.5 391 Payment per case/DRG
Portugala 37.5 796 Prospective global budget
Slovakia 26.7 442 Payment per case/DRG
Slovenia 41.6 918 Global budgets and case-based payment
Spain 39.8 1117 Line-item budget
Sweden 46.9 1545 Payment per case/DRG (55%) + global budget
Switzerlanda 35.1 1567 Payment per case/DRG (2/3 cantons) + global budget
United Kingdom n/a n/a Payment per case/DRG (70%) + global budgets (30%)
Sources: OECD Health Data 2010; Paris V, Devaux M, Wei L. OECD Health Working Papers No. 50, Health Systems Institutional Characteristics: A Survey of 29 OECD Countries.Paris, 2010; Thomson S, Foubister T, Mossialos, E. Financing Health Care in the European Union: Challenges and Policy Responses, World Health Organization on behalf of theEuropean Observatory on Health Systems and Policies, 2009.
Notes: a = 2007 data, b = 2006 data, c = 2005 data, n/a = data not available
Vo l ume 12 , N umbe r 3Vo l ume 12 , N umbe r 3 E u r o Ob s e r v e rEu r o Ob s e r v e r
3
higher payment rates. For example, Serden et al found that the introductionof case-based systems in Sweden led to a comparatively greater increase in thenumber of secondary diagnoses amonghospitals paid under prospective paymentsystems.7 At the same time, the use ofDRGs can lead to skimping on the quality and intensity of treatment given,which may later lead to re-admission.8
There is also the need for an appropriaterisk-adjustment mechanism to reducecream-skimming, or the preference to-wards low-risk patients. Another disad-vantage of DRGs is that they are complexfrom an administrative perspective, bothin paperwork for hospitals and also incollecting the data used to calculate DRGweights. Other related issues to the effec-tive use of DRG-type systems are the extent to which hospitals really knowtheir costs, the extent to which reliabledata is collected and how capital andoverhead costs can be appropriately in-corporated into DRG ‘prices’. Also, it isnot always clear if efficiency and qualitygains in particular hospitals’ performancecan be fully attributable to the introduc-tion of DRGs within in a system. That is,it is difficult to disentangle the direct
effects of introducing DRGs on qualityand efficiency from other reforms such asintroducing chronic disease managementprogrammes, shifting services to othersettings (such as primary care) or fromthe introduction of targets and othermethods of managing performance.
The European experience
Hospital payment system development inEurope over the past 20 years has beendirected at improving efficiency and con-taining costs.9 DRGs must be viewed inthe context of wider health system reforms within a country, an increasingneed to deal with technological innova-tion and the increasing complexity ofcases. These last two factors in particularpose continuing challenges to the devel-opment of countries’ DRG systems,which need to be dynamic: the systemsmust be updated to reflect changes inclinical practice and must, accordingly be designed so that they can easily incorporate these changes.
As Table 1 highlights, DRG-type hospitalpayment systems are now employed tovarying degrees within European coun-tries, representing different health care
system structures. In particular, recentchanges in how hospitals are paid in Germany, The Netherlands and Finlandare highlighted in more detail in this issue(see case studies).
Briefly, Germany is moving from using astate (Länder) to a national base ratewhen assessing the structural variable forprice-setting in its DRG payment system.The country also is working on includingpsychiatric care in its DRG system andon developing a monistic payer system.
In the Netherlands, overall health care re-forms in 2005 and 2006 saw the merger ofsocial and private insurance schemes, achange from a supply to a demand-ledsystem and the introduction of the Diagnosis Treatment Combination(DBC) case mix system. The aim of theDBCs is to encourage negotiation onquality, but this goal is still in progressand to date it seems there is more negoti-ation on price and production volumethan quality. Another main limitation isthat there is not yet use of demographicdata in the new hospital payment systemwhen using patient variables to set prices.
Finally, in Finland we have an example ofa very decentralized system in whichonly 13 out of 21 districts use DRGs.Moreover, amongst these 13 districtsthere is wide variation in price-setting because there are no national guidelines.However, despite this, the Finnish havefound them to be useful in benchmarkingquality and efficiency (see case study).
Concluding remarks
Although most case-based hospital pay-ment systems across Europe were mod-elled after the US Medicare Hospital PPSsystem, there is now wide variation –both in the methods of price setting andthe wider health systems in which theyare used. Many European countries havenot replaced their earlier hospital payment systems, but instead have incorporated case-based systems intotheir existing payment structures, all withthe common goal of promoting more efficient, better quality health care. Ascertaining more precisely the extent towhich DRG-type systems can contributeto this goal and seeing which models
Box 1: DRG-type hospital payment systems*
In general, DRG-type hospital payment systems consist of two fundamental building blocks: (1) a patient classification system (i.e. the DRG system), and (2) a payment rate-setting mechanism that defines costweights or prices per DRG.
The patient classification system defines ‘diagnosis related’ groups of patients (mostly based on diagnoses,procedures, and demographic characteristics,) that have (a) similar resource consumption patterns and thatare (b) clinically meaningful. By relating patient characteristics to resource consumption, DRGs provide a concise measure of hospital activity or, in other words, they define hospital products.
The payment rate setting mechanism determines resource requirements for treating patients grouped intospecific DRGs and sets payment rates (e.g. cost weights, or average prices) accordingly. The objective is to givesufficient resources to hospitals enabling them to provide all necessary services. Otherwise, if payment rateswere too low, hospitals may cut down necessary services. On the other hand, if payment rates were too high,hospitals are not encouraged to use resources efficiently. Therefore, often information about average costs oftreating patients in a sample of hospitals is used to determine cost weights or prices for a specific DRG.
Besides these two fundamental building blocks, DRG-type hospital payment systems require the establish-ment of data collection processes for clinical data and cost data. Clinical data is needed in order to grouppatients into DRGs. Cost data is necessary in order to calculate payment rates. Both, clinical and cost data areused to readjust the patient classification system in order to assure that it achieves its goal to assign patientsto clinically meaningful groups of patients with homogenous resource consumption.
Furthermore, mechanisms have to be developed to determine hospital payment based on calculated costweights or prices. These mechanisms need to account for the fact that some cases treated in hospitals are significantly more costly than the average case. Therefore, DRG-type hospital payment systems usuallyrequire adjustments to the payment rate for these so-called ‘outlier’ cases.
* Scheller-Kreinsen D, Geissler A, Busse R. The ABC of DRGs. Euro Observer 2009;11:1–5.
Since the first use of diagnosis relatedgroups (DRGs) for hospital payment in the United States in the early 1980s,1
DRG-type hospital payment systemshave become the main method of hospitalpayment in the majority of OECD coun-tries.2 In Germany, a national German-DRG (G-DGR) system was gradually in-troduced over a ten year period followinga legislative decision in 2000.
The G-DRG system
In Germany, there are about 2100 hospi-tals providing care for about 17 millioninpatient cases per year.3 Hospitals are financed through a system of ‘dual financing’, which means that they receivefunds from two different sources: infra-structure investments are covered directlyby tax-funded state budgets, whereas operating costs are paid mostly by sick-ness funds and private health insurers.4
The introduction of DRG-type hospitalpayment goes back to the StatutoryHealth Insurance Reform Act of 2000,which reformed hospital financing foroperating costs. The main objective of thereform was to replace previously existinghistorically-based hospital budgets (using per diem charges as the unit for reimbursement) with a more activity-oriented payment system assuming that it would promote efficiency, quality andtransparency in the hospital sector.5
The reform legislation outlined the fundamental characteristics of the newpayment system but delegated the responsibility for developing and manag-ing the future G-DRG system to the self-governing corporatist bodies (the thenfederal associations of sickness funds, theAssociation of Private Health Insurance,and the German Hospital Federation).The legislation further specified that thesystem should apply to all hospitals irre-
spective of ownership status. Psychiatricservices were excluded since DRG-typepayment was perceived to be inadequateat that time. For the technical manage-ment of the system, the self-governingbodies founded the Institute for the Pay-ment system in Hospitals (InEK). Cur-rently, about 1700 hospitals (80% of allhospitals but accounting for 97% of alldischarges) receive reimbursementsthrough DRG-type hospital payment.3
Figure 1 illustrates three phases in the in-troduction process of DRG-type hospitalpayment in Germany. During the prepar-atory phase, the fundamental characteris-tics of the system were defined. This wasfollowed by a budget-neutral phase, dur-ing which the payment units within thebudgets were changed from per-diemsinto DRGs. In the ‘convergence phase’the relevance of the budgets was reducedstep by step in favour of a uniform state-wide price system for DRGs.
Preparation phasePatient classification system
In June 2000, the self-governing bodiesdecided to use the Australian RefinedDRGs (AR-DRGs) as the starting pointfor developing the G-DRG system. Inorder to adapt AR-DRGs to the Germancontext, Australian codes for proceduresand diagnoses were transformed to Ger-man procedure classification codes (OPS)and ICD-10-GM (German Modification)codes for diagnoses. After pilot testingthe system in hospitals in 2001, a firstversion with 664 DRGs was prepared bythe end of the year 2002. According toG-DRG coding rules, all discharged hos-pital patients are assigned to a specificDRG based on a grouping algorithm us-ing the inpatient hospital dischargedataset. In very high cost cases like trans-plantations or extended intensive care
Eu r o Ob s e r v e rEu r o Ob s e r v e r Vo l ume 12 , N umbe r 3Vo l ume 12 , N umbe r 3
4
work best requires further research andmonitoring of those payment systemscurrently being used and developed.
REFERENCES
1. Organization for Economic Cooperation and Development, OECD Health Data 2010.
2. World Health Organization, Healthfor All Database.http://data.euro.who.int/hfadb/ [accessed 31 August 2010].
3. Kutzin J. A descriptive framework forcountry-level analysis of health care financing arrangements, Health Policy2001;56(3):171–204.
4. Langenbrunner JC, Wiley MC. Hospital payment mechanisms: theoryand practice in transition countries. In: M McKee, J Healy (eds). Hospitals ina Changing Europe, Open UniversityPress, 2002.http://www.euro.who.int/__data/assets/pdf_file/0004/98401/E74486.pdf
5. Schreyoegg J, Stargardt T, Tiemann O,Busse R. Methods to determine reim-bursement rates for diagnosis relatedgroups (DRG): A comparison of nineEuropean countries Health Care Management Science, 2006;9:215–23.
6. Busse R, Schreyogg J, Smith P. Editorial: Hospital case payment systemsin Europe. Health Care ManagementScience 2006;9:211–13.
7. Serden L, Lindqvist R, Rosen M. HaveDRG-based prospective payment sys-tems influenced the number of secondarydiagnoses in health care administrativedata? Health Policy 2003;65:101–7.
8. Kjerstad E. Prospective funding ofGeneral Hospitals in Norway –incentives for higher production? International Journal of Health Care Fi-nance and Economics 2003;3:231–51.
9. Tan SS et al. This volume, p.7.
Jonathan Cylus is Technical Officer/Research Fellow at the European Obser-vatory on Health Systems and Policies.
Rachel Irwin is Research Assistant at LSEHealth, The London School of Economics& Political Science.
DRG-type hospital payment in Germany: The G-DRG system
Wilm Quentin, Alexander Geissler, David Scheller-Kreinsen, Reinhard Busse

Vo l ume 12 , N umbe r 3Vo l ume 12 , N umbe r 3 E u r o Ob s e r v e rEu r o Ob s e r v e r
unit treatment, the DRG is determineddirectly by the procedure. In most othercases, the algorithm considers major diag-nosis, procedures, secondary diagnoses,and patient characteristics (age, sex andweight of newborns) in order to deter-mine the DRG. Since the first version for2003, the G-DRG catalogue has been up-dated annually based on data analyses (ofclinical and cost data) and consideringsuggestions from hospitals and profes-sional medical associations. The numberof DRGs has increased continuously to1200 in 2010. Hospital outpatient servicesare not included in the system.
Data collection
Clinical patient data of the hospital discharge dataset grouped into DRGs arecollected from all German hospitals andtransmitted to sickness funds and privatehealth insurers for payment of hospitals.Before payments are made by sicknessfunds, their medical review boards checkthe received data in order to detect anyfraudulent actions by hospitals, such asinappropriate discharges of patients orclassification of patients into higher paying DRGs. In addition, clinical datafrom all hospitals, supplemented withhospital-related structural data (for example, number of beds, number of personnel and total costs), are sent to a
Data Centre (operated by 3M Medica),which performs data checks before for-warding data on to InEK for the develop-ment of the new G-DRG catalogue.
Cost data are collected from a sample ofabout 250 hospitals conforming to a standardized cost accounting system developed by InEK.6 Participating hospi-tals must be able to calculate costs at thepatient level by collecting informationabout individual services delivered toeach patient. Similar to clinical and struc-tural data from hospitals, cost data arefirst sent to the Data Center before beingforwarded to InEK for calculation of costweights and for developing the new G-DRG catalogue. Last but not least, information about technological innova-tions is needed in order to update the diagnosis and procedure classificationsystems (done by the German Institutefor Medical Documentation and Information, DIMDI) and to supportthe introduction of new technologies intohospitals through additional payments.
Payment rate setting mechanism
German DRG-type hospital payment relies on a cost weight approach, meaningthat hospital payment for a treated patient is calculated by multiplying thecost weight of the patient’s DRG with a
base rate. Cost weights for each DRG areupdated annually by InEK using patient-level cost data from the above mentionedsample of hospitals.7 In order to calculatecost weights for each DRG, ‘in-lier cases’are defined by excluding cases with extremely long (more than two standarddeviations from the mean length of stay)or short (less than one-third of the mean)hospital stays. Average costs of the remaining in-lier cases are then dividedby a reference value that is conceptuallyrelated to the average costs of treating allcases in German hospitals. The resultingcost weight of any DRG is equal to one ifits costs are equal to average costs of allcases in German hospitals. They will bemuch higher (for example, maximum costweight in 2010: 74 – for transplantationof liver and >999 hours of intensive caretreatment) or lower (minimum: 0.13 – foruterine contractions without delivery) ifcases are much more or much less resource-consuming than the average.There is always a time lag of two yearsbetween the year of the data used to calculate cost weights and the year forwhich the G-DRG case fee catalogue wasdeveloped. For example, the 2010 versionof G-DRGs is based on data from theyear 2008; hence, 2009 was used for datachecks and DRG catalogue development.
DRG-type hospital payment
G-DRGs are meant to cover medicaltreatment, nursing care, the provision ofpharmaceuticals and therapeutic appliances, as well as board and accom-modation. Since 2010, each patient’sDRG cost weight is multiplied with auniform state-wide base rate in order tocalculate hospital payment. For long-stayoutlier cases, hospitals receive DRG-specific surcharges for every day that thepatient stays above the upper length ofthe stay threshold. Similarly, if patientsare discharged earlier than the lowerlength of stay threshold, the DRG payment is reduced by per diem baseddeductions. DRG-type hospital paymentconstitutes about 80% of hospital revenues.8 The rest is made up by supplementary payments for certain procedures, additional payments fortechnological innovations, apprenticeshipand quality assurance surcharges etc.
5
Figure 1: Three phases of introducing DRG-type hospital payment in Germany
2000 to 2002 2003 to 2004 2005 to 2009
Preparation phase Budget-neutral phase Convergence to state-wide base rates phase
Decision about fundamental building blocks
1. Patient classification system
2. Data collection
3. Payment rate setting mechanism
4. DRG-type hospital payment
Historical budget (2003)
Hospital-specific base rate
15%
20%
20%
20%
25%Statewide
base rate25%
20%
20%
20%
15%
Hospital-specific base rate
Transformation
DRG budget (2004)
Eu r o Ob s e r v e rEu r o Ob s e r v e r Vo l ume 12 , N umbe r 3Vo l ume 12 , N umbe r 3
6
Budget neutral introductionphase
When DRG-type hospital payment wasfirst introduced in Germany, it happenedon a budget-neutral basis. Hospitals stillreceived historically-based budgets as inprevious years but started classifyingtheir patients into DRGs. In 2003, hospi-tals could voluntarily group their patientsinto DRGs, with the incentive that it waspossible to negotiate higher budgets. In2004 all hospitals were mandated to doso. Based on information about DRGs of patients treated in each hospital, it became possible to calculate the ‘casemix’ of hospitals. The case mix of a hos-pital is the sum of all DRG cost weightsof patients treated in that hospital. Thecase mix can be used as an indicator ofhospital activity. The derived case mix index (case mix divided by the number of patients) is an indicator of the averagecomplexity of treated patients.
Prior to 2002 hospital budgets were divided by the negotiated number of annual patient days in order to calculateper-diem charges. During the budgetneutral transformation phase negotiatedhospital budgets were divided by the hospitals’ case mix in order to calculate a hospital-specific base rate. Using thehospital specific base rate for DRG-payments assured that the sum of allDRG-payments would amount to thesame budget as negotiated for previousyears. Initially, hospital-specific baserates varied considerably from ~€2200(mostly in small rural hospitals) up to~€3200 (for major hospitals in urban areas),9 which reflected historical differ-ences in budget negotiations and possiblythat the data basis for calculation of costweights was not sufficiently representa-tive in the first G-DRG version.10
Convergence phase
During the convergence phase from 2005to 2010, hospitals’ individual base rateswere gradually adjusted towards state-wide base rates (one for each of the 16Länder). State-wide base rates were nego-tiated for the first time in 2005 and wereused as a benchmark for hospital baserates in each state. Negotiated hospital
budgets were still used to calculate hospital-specific base rates but each yearactual base rates used to calculate hospitalpayments progressively approached thestate-wide base rate. In 2005, actual baserates were set at 15% of the differencebetween the hospital specific base ratesand the state-wide base rate; in 2006 at35% (15% plus 20%) etc. – until in 2009actual base rates were programmed toconverge at state-wide base rates (see Figure 1).
In order to make the reform politicallymore acceptable, hospitals were shelteredfrom excessive budget cuts by limitinglosses in 2005 to 1% (compared to 2004budgets) and increasing this percentage to3% in 2009 (compared to 2008). In 2010,budget losses are no longer limited andall hospitals are paid using the state-widebase rates. However, hospital budgetscontinue to be negotiated for each yearbased on the expected case mix volume. If a hospital treats more cases than nego-tiated, the DRG payment rate is reducedby a certain percentage (and vice versa, itis increased if the number of treated casesis lower).
Conclusion: current developments and results
The 2009 Hospital Financing Reform Act (KHRG) further modifies hospital financing in Germany:11
1. state-wide base rates are programmedto converge to a nation-wide base rateby the year 2015;
2. the self-governing bodies are mandated to develop and introduce aDRG-like payment system for psychiatric services by 2013, whichwill be special in that it will be basedon per diem payments adjusted for patient characteristics and treatmentefforts; and
3. starting in 2012, state governments aregiven the choice to abandon the exist-ing system of ‘dual financing’ for amonistic (single payer) system by adjusting DRG-type hospital paymentusing investment cost weights.
All three developments show that the importance of DRG-type hospital
payment in Germany is continuing to increase. At the end of a ten-year processof careful introduction of G-DRGs, thesystem is widely accepted and generallyseen as a success.
The G-DRG impact evaluation concludesthat the system has increased trans-parency in the hospital sector.12 DRG-type hospital payment is perceived tohave contributed to greater efficiencywhile maintaining or improving the quality of care.13 In particular, the annualupdates of G-DRGs based on robust dataanalyses by InEK working in close co-operation with key stakeholders is seen asa strength of the system. However, avail-able data are still insufficient to answerthe question of whether changes in qual-ity and efficiency of the hospital sectorcan be attributed to the introduction ofDRG-type hospital payment.
REFERENCES
1. Fetter RB. Diagnosis Related Groups –understanding hospital performance. Interfaces 1991;21:6–26.
2. Paris V, Devaux M, Wei L. Health Systems institutional characteristics: Asurvey of 29 OECD countries, OECDHealth working papers No. 50. Organisation of Economic Cooperationand Development (OECD). Paris, 2010.
3. Destatis. Gesundheit. Fallpauschalen-bezogene Krankenhausstatistik (DRG-Statistik) Diagnosen, Prozeduren undFallpauschalen der vollstation„ren Patientinnen und Patienten in Kranken-häusern 2008. Wiesbaden: StatistischesBundesamt, 2009.
4. Busse R, Riesberg A. Health Care Systems in Transition: Germany. Copenhagen: World Health Organization, Regional Office for Europe, European Observatory onHealth Care Systems, 2004.
5. Braun T, Rau F, Tuschen KH. DieDRG-Einführung aus gesundheits-politischer Sich. Eine Zwischenbilanz. In: Klauber J, Robra BP, SchellschmidtH, eds. Krankenhaus-Report 2007.Stuttgart, New York: Schattauer, 2008:3–22.

Vo l ume 12 , N umbe r 3Vo l ume 12 , N umbe r 3 E u r o Ob s e r v e rEu r o Ob s e r v e r
Over the past 20 years, structural reformsof national healthcare sectors have takenplace in many European countries. Themost common reason for such reforms isto improve the efficiency of hospital care,with the aim of containing or reducinghospital costs. Secondarily, the aim is toincrease transparency of hospital costsand to introduce fundamental incentivemechanisms to improve efficiency, suchas systematic benchmarking and managedcompetition.
Structural reforms in the Netherlandswere implemented in 2005/6. During theprevious decades, hospitals were mainlyfinanced based on prospective globalbudgets, i.e. hospitals received a fixedpayment for treating a pre-specified volume of activity. Thus, incentives to increase production or to produce moreefficiently were mainly absent. The structural reforms entailed substantialchanges in the financing, budgeting andreimbursement of healthcare organizations.
A central element of the reforms was thetransition from a supply-led system to ademand-led system.1 It was the govern-ment’s intent to shape the healthcare system primarily according to the needsof patients (i.e. the demand side) by:
– increasing competition between healthinsurers
– increasing competition betweenhealthcare providers
– financing the core/main care chainbased on quality
Integration of health insuranceschemes
Since January 2006, statutory and privatehealth insurance have been integratedinto a single and mandatory scheme that
provides coverage to the whole popula-tion, including care provided by hospitals, medical specialists and generalpractitioners and uninsurable risks suchas those related to chronic illnesses.2,3
Each health insurer has to accept eachcustomer, regardless of age or medicalhistory, at a standard premium applicableto all its customers. A risk equalizationfund compensates insurers for an over-representation of bad risks. The expectedexpense associated with each customer isestimated on the basis of predictive mod-elling, and the risk equalization fund paysappropriately more to insurers whosecustomers’ care is predicted to cost morethan average, while insurers whose customers’ care is expected to cost lessthan average must pay the fund.4
Insurers are to compete by purchasinghigh-quality care for their customers.Consequently, the market power of insurers would be determined by thewillingness of customers to switch between insurers and the willingness ofcustomers to go to those hospitals thatare contracted by their insurer.4,5
Free access to the hospital caremarket
In 2007, there were 8 university hospitals,86 general hospitals, 35 specialized hospitals and 17 rehabilitation centers inthe Netherlands.6 All hospitals work on a not-for-profit basis and provide carewhich is covered by the mandatory insur-ance scheme. Where hospital care waspreviously only provided by hospitals,independent treatment centers (ITCs)and private clinics have been allowed tofreely access the hospital care marketsince 2006. Similar to hospitals, ITCswork on a not-for-profit basis and delivercare which is covered by the mandatory
7
Structural reforms and hospital payment in the Netherlands
Siok Swan Tan, Martin van Ineveld, Ken Redekop, Leona Hakkaart-van Roijen
6. Institut für das Entgeldsystem imKrankenhaus (eds). Kalkulation von Fallkosten, Handbuch zur Anwendung in Krankenhäusern. Version 3, seccondedition. Düsseldorf: Deutsche Krankenhaus-Verl.-Ges., 2007:265.
7. Institut für das Entgeldsystem imKrankenhaus. Abschlussbericht Weiterentwicklung des G-DRG-Systemsfür das Jahr 2010. Siegburg: InEK, 2009.
8. Schreyögg J, Tiemann O, Busse R.Cost accounting to determine prices:How well do prices reflect costs in theGerman DRG-system. Health CareManagement Science 2006;9:269–80.
9. Friedrich J, Leclerque G, Paschen K.Die Krankenhausbudgets 2004–2006unter dem Einfluss der Konvergenz. In: Klauber J, Robra BP, SchellschmidtH, eds. Krankenhaus-Report 2007.Stuttgart, New York: Schattauer, 2008.
10. Institut für das Entgeldsystem imKrankenhaus. Abschlussbericht Weiterentwicklung des G-DRG-Systemsfür das Jahr 2004. Siegburg: InEK, 2003.
11. BMG. Bundesministerium fürGesundheit (BMG): Krankenhaus-finanzierungsreformgesetz, KHRG, 2009.
12. Fürstenberg T, Zich K, Nolting H,Laschat M, Klein S, Häussler B. G-DRGimpact evaluation, Final report of the firstresearch cycle (2004-2006): IGES Institut,Institut für das Entgeldsystem inKrankenhaus, 2010.
13. Sens B, Wenzlaff P, Pommer G, vonder Hardt H. Die Qualität hat nicht gelitten: Auswirkungen der DRG-Einführung. Deutsches Ärzteblatt2010;107:A25-A27.
Wilm Quentin, Alexander Geissler andDavid Scheller-Kreinsen are research fellows, and Reinhard Busse is professor inthe Department of Health Care Management at the Berlin University ofTechnology which coordinates the project“EuroDRG: Diagnosis-related groups inEurope: towards efficiency and quality”,funded under the 7th EU FrameworkProgramme from 2009 to 2011. The other case study authors in this issuealso participate in the EuroDRG project.
Eu r o Ob s e r v e rEu r o Ob s e r v e r Vo l ume 12 , N umbe r 3Vo l ume 12 , N umbe r 3
8
scheme. However, ITCs focus onstraightforward, non-acute outpatientcare. Private clinics work on a for-profitbasis and focus on non-insured care.
The DBC casemix system
The third instrument to support the transition from a supply-led system to ademand-led system was the introductionof the national Diagnosis TreatmentCombination (DBC) casemix system forthe registration and reimbursement ofcare provided by medical specialists andhospitals. DBC includes the whole set ofhospital services provided by the medicalspecialist and hospital resulting from thefirst consultation and diagnosis of themedical specialist at the hospital. This implies that the codification processstarts at the beginning of the care processand ends after treatment completionwhen the care process has finished.
Patients are classified according to medical specialty, type of care, demandfor care, and diagnosis and treatment setting and nature. The DBC system nowcomprises about 30000 DBCs with the‘medical specialty’ dimension as the primary basis for the classification of patients. In the near future, the numberof DBCs will be substantially reduced to3,000 by means of discarding the ‘medicalspecialty’ dimension and excluding ex-pensive/orphan drugs and intensive care.7
The information used to classify patientsincludes clinical and resource use data.However, resource use care intensity isnot used in the current classification sys-tem because demographic data, co-mor-bidities, secondary diagnoses, grading ofseverity and secondary procedures andoperations are not yet registered. All hos-pitals and ITCs are paid for all of theirinpatient and outpatient care according tothe system’s logic. In addition, the systemis implemented in mental healthcare.
All DBCs are exhaustively assigned toone of two lists – either List A or List B.The distinction between List A and ListB DBCs is especially interesting in thelight of the transition from a supply-ledsystem to a demand-led system. List ADBCs have fixed national prices and are(still) largely financed according to the financing system in place before 2005
(based on production volume rather thanon quality).8 In contrast, the prices ofList B result from negotiations betweenhealth insurers and hospitals. Any deficitsor earnings on List B DBCs are the re-sponsibility of the hospital. List B DBCsare meant to encourage insurers and hos-pitals to negotiate on quality rather thanon production volume. Insurers are notobliged to contract all hospitals, may em-ploy different DBC prices for differenthospitals and may set a maximum on thenumber of DBCs they want to reimburseto a hospital. Likewise, hospitals are notobliged to contract with all insurers andmay employ different DBC prices fordifferent insurers. In addition, insurersand hospitals may agree upon a lower orhigher DBC price if production exceeds apredetermined figure and may determinethe frequency and terms of agreements.4,1
The DBC casemix system aims to achievea situation in which the core care chain is predominantly financed based on thequality of delivered care, i.e. by List BDBCs. Currently, about 33% of DBCsare in List B, but it is the government’sintention to gradually increase this shareto 70% over time. Major List B diagnosesinclude hip and knee replacement, diabetes mellitus, cataracts and inguinalhernia repair. List B DBCs are sufficiently medically coherent and cost-homogeneous and should have a sufficiently high incidence/ productionvolume. In addition, List B DBCs con-cern predictable, non-acute outpatientcare and are freely accessible for (new)healthcare providers. A List A DBC is eligible for transfer to List B when itmeets these criteria, when the transfer issupported by the medical profession andwhen it is technically realisable.7
Evaluation of structural reforms
Integration of insurance schemes
The integration of social and private insurance schemes created strong pricecompetition among health insurers.5
Many insurers tried to attract customersby offering low-priced contracts, in particular by discounts on group contracts (on average these were about7% cheaper). In 2006, 18% of the population switched to another insurer.
As a result of the heavy price competi-tion, health insurers incurred annuallosses of about 2% of total premium rev-enue. Since 2007 insurers started to cutoperating costs, premiums converged andswitching rates dropped to about 4%.1,5
However, insurers have been quite reluc-tant to selectively contract with hospitalsand to offer preferred hospital contractsto their customers. There are several reasons for this.5 Firstly, there is limitedavailability of high-quality information.Insurers often do not have sufficient information to selectively contract withgood-quality providers. In addition, thelimited availability of high-quality information makes it difficult for insurersto explain to (potential) customers thatpreferred providers are selected becausethey offer good-quality care. When thereis already a free choice of health insurerfor customers, insurers fear a loss of reputation if they restrict choice to a limited network of preferred hospitals. A third reason why insurers do not havean incentive to selectively contract with hospitals is that most of the DBCs arestill in List A and (still) largely financedaccording to the financing system in placebefore 2005. However, with ongoing improvements to the DBC system, themethod of risk equalization in place and the increasing share of List B, the financial risk on hospital expenses hassubstantially increased since 2009.9,5
Free access to the hospital care market
In order to remain competitive, manyhospitals have established ITCs over recent years. Consequently, the numberof these centers has increased rapidlyfrom 79 to 135 in 2007.6 The introductionof ITCs to the hospital market has lead tohigher accessibility for patients, espe-cially when it comes to straightforwardnon-acute outpatient care (List B DBCs).ITCs are an attractive alternative to hospitals because they provide relativelyhigh-quality care due to the routine delivery of specific treatments and theymore easily respond to changes in theneeds of the patients. Moreover, the introduction of ITCs reduce the waitinglists of competing hospitals and encourage competitors to improve thequality and efficiency of care.10
Vo l ume 12 , N umbe r 3Vo l ume 12 , N umbe r 3 E u r o Ob s e r v e rEu r o Ob s e r v e r
The DBC casemix system
Although negotiations were intended to be based on quality, insurers and hospitals currently predominantly nego-tiate on price and/or production volume.8
Since 2006, prices for List B have increased at a lower rate than those forlist A and the health insurers increasinglyput pressure on hospitals to charge evenlower prices. On the other hand, the production volume of List B has grownfaster than that of list A, but it is unknown whether this is due to supplier-induced demand or to a learning effect inthe new coding and registration system.5
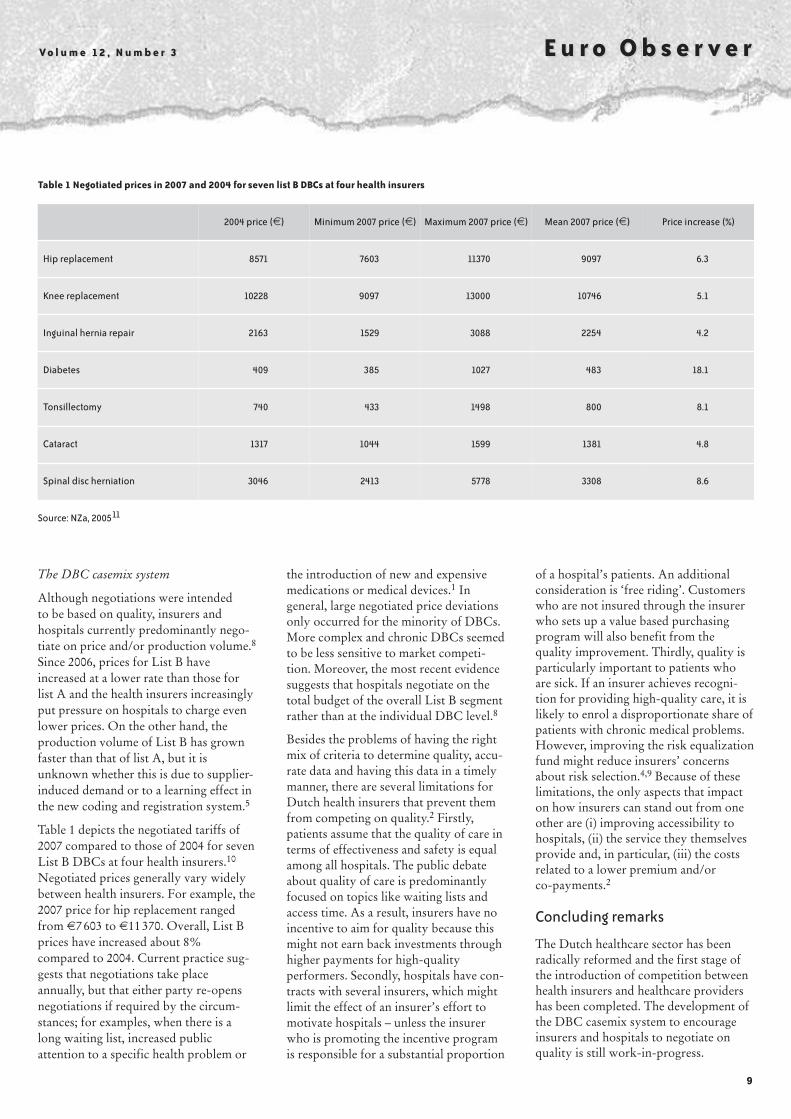
Table 1 depicts the negotiated tariffs of2007 compared to those of 2004 for sevenList B DBCs at four health insurers.10
Negotiated prices generally vary widelybetween health insurers. For example, the2007 price for hip replacement rangedfrom €7603 to €11370. Overall, List Bprices have increased about 8% compared to 2004. Current practice sug-gests that negotiations take place annually, but that either party re-opensnegotiations if required by the circum-stances; for examples, when there is along waiting list, increased public attention to a specific health problem or
the introduction of new and expensivemedications or medical devices.1 In general, large negotiated price deviationsonly occurred for the minority of DBCs.More complex and chronic DBCs seemedto be less sensitive to market competi-tion. Moreover, the most recent evidencesuggests that hospitals negotiate on thetotal budget of the overall List B segmentrather than at the individual DBC level.8
Besides the problems of having the rightmix of criteria to determine quality, accu-rate data and having this data in a timelymanner, there are several limitations forDutch health insurers that prevent themfrom competing on quality.2 Firstly, patients assume that the quality of care interms of effectiveness and safety is equalamong all hospitals. The public debateabout quality of care is predominantlyfocused on topics like waiting lists andaccess time. As a result, insurers have noincentive to aim for quality because thismight not earn back investments throughhigher payments for high-quality performers. Secondly, hospitals have con-tracts with several insurers, which mightlimit the effect of an insurer’s effort tomotivate hospitals – unless the insurerwho is promoting the incentive programis responsible for a substantial proportion
of a hospital’s patients. An additionalconsideration is ‘free riding’. Customerswho are not insured through the insurerwho sets up a value based purchasingprogram will also benefit from the quality improvement. Thirdly, quality isparticularly important to patients whoare sick. If an insurer achieves recogni-tion for providing high-quality care, it islikely to enrol a disproportionate share ofpatients with chronic medical problems.However, improving the risk equalizationfund might reduce insurers’ concernsabout risk selection.4,9 Because of theselimitations, the only aspects that impacton how insurers can stand out from oneother are (i) improving accessibility tohospitals, (ii) the service they themselvesprovide and, in particular, (iii) the costsrelated to a lower premium and/or co-payments.2
Concluding remarks
The Dutch healthcare sector has beenradically reformed and the first stage ofthe introduction of competition betweenhealth insurers and healthcare providershas been completed. The development ofthe DBC casemix system to encourageinsurers and hospitals to negotiate onquality is still work-in-progress.
9
Table 1 Negotiated prices in 2007 and 2004 for seven list B DBCs at four health insurers
2004 price (€) Minimum 2007 price (€) Maximum 2007 price (€) Mean 2007 price (€) Price increase (%)
Hip replacement 8571 7603 11370 9097 6.3
Knee replacement 10228 9097 13000 10746 5.1
Inguinal hernia repair 2163 1529 3088 2254 4.2
Diabetes 409 385 1027 483 18.1
Tonsillectomy 740 433 1498 800 8.1
Cataract 1317 1044 1599 1381 4.8
Spinal disc herniation 3046 2413 5778 3308 8.6
Source: NZa, 200511

In its institutional structure, financing andgoals, the Finnish health care system isclosest to those of other Nordic countriesand the United Kingdom in that it coversthe whole population and its services aremainly produced by the public sector andfinanced through general taxation. However, compared to the other Nordiccountries the Finnish system is more decentralized; in fact, it can be describedas one the most decentralized in theworld. Even the smallest of the 342 mu-nicipalities (local government authorities)are responsible for arranging and takingfinancial responsibility for a whole rangeof ‘municipal health services’. Anotherunique characteristic of the system is theexistence of a secondary public financescheme (the National Health Insurancescheme, NHI), which partly reimbursesthe same services as the tax based system,but also services which are provided bythe private sector. NHI also partly reim-burses the use of private hospital care.
Specialized care (psychiatric and acutenon-psychiatric) is provided by hospitaldistricts which correspond to the federa-tions of municipalities. Each municipalityis obliged to be a member of a hospital
district. In addition to services providedthrough health centres and hospital districts, municipalities may purchaseservices from a private provider. In 2008specialized care comprised 33% of totalhealth care expenditure.
There are 21 hospital districts in thecountry. Each hospital district has a central hospital and in some districts careis supplemented by small local hospitals.There are 15 local hospitals in the coun-try. Tertiary care is given in five univer-sity hospitals, which also act as centralhospitals for their hospital district.
Hospital districts are managed andfunded by the member municipalities.Funding is mainly based on municipalpayments to hospital districts accordingto the services used. In 2008, 4.2% offunding came from user charges.1 In ad-dition, governments subsidize hospitals’teaching and research activities, which are mainly undertaken in university hospitals. The funding of Finnish hospitals is illustrated in Figure 1.
As purchasers, municipalities negotiateannually the provision of services withtheir hospital district. There are different
Eu r o Ob s e r v e rEu r o Ob s e r v e r Vo l ume 12 , N umbe r 3Vo l ume 12 , N umbe r 3
10
REFERENCES
1. Oostenbrink JB Rutten FF. Cost Assessment and Price Setting of InpatientCare in the Netherlands. The DBC Case-Mix System. Health Care ManagementScience 2006;9:287–94.
2. Custers T, Arah OA, Klazinga NS. Isthere a business case for quality in theNetherlands? A critical analysis of the recent reforms of the health care system.Health Policy 2007;82:226–39.
3. Stolk EA, Rutten FF. The ‘Health Benefit Basket’ in the Netherlands. Eur JHealth Econ 2005;Suppl:53–57.
4. Enthoven AC,van de Ven WP. GoingDutch – managed-competition health insurance in the Netherlands. New England Journal of Medicine 2007;357:2421–23.
5. Van de Ven WP, Schut FT. Managedcompetition in the Netherlands: stillwork-in-progress. Health Economics2009;18:253–55.
6. Prismant. Kengetallen NederlandseZiekenhuizen 2008. Dutch Hospital Data, 2009.
7. DBC Onderhoud. http://www.dbconderhoud.nl/
8. Van Ineveld BM, Dohme P, RedekopWK. De Startende Marktwerking in DeGezondheidszorg. ESB, September 2006.
9. Van de Ven WP, Schut FT. Universalmandatory health insurance in theNetherlands: a model for the UnitedStates? Health Aff (Millwood)2008;27:771–81.
10. NZa. Monitor Special: De Rol VanZBC’s in De Ziekenhuiszorg. Utrecht,January 2007.
11. NZa. Oriënterende Monitor Zieken-huis Zorg: Analyse Van De Onderhan-delingen Over Het B-Segment in 2005.Utrecht, September 2005.
Siok Swan Tan, Martin van Ineveld, Ken Redekop and Leona Hakkaart-van Roijen are health economists at the Institute for Medical Technology Assessment, Erasmus Universiteit Rotterdam, the Netherlands.
Financing of hospital care in Finland Unto Häkkinen
Figure 1 Hospital funding flows in Finland
State Municipalities
Hospitals NHI
Population/employers
Patients
subsidies
co-payments
tax
contributions
reimbursement
tax
subsidies touniversityhospitals
funding viahospital
districts

Vo l ume 12 , N umbe r 3Vo l ume 12 , N umbe r 3 E u r o Ob s e r v e rEu r o Ob s e r v e r
11
contractual or negotiation mechanismsbetween hospital districts and municipali-ties for agreeing target volumes and payments which comprise elements ofpurchaser and provider separation. Boththe volumes and costs are planned basedon the previous year. In many cases viewson the right size of the resource alloca-tions differ between the municipalitiesand the hospital districts. There is a tendency for budgets to be too low andagreements are therefore sometimes revised during the year according to theactual amount and type of services provided by hospital districts. Usually,there are no explicit sanctions if there isdeviation from agreed plans and targets,and municipalities cover any deficits andretain any savings in their accounts. Thenegotiation mechanisms are under continuous change and development.
The budget of each hospital district isbased on these negotiations and is for-mally decided by a Council, whose mem-bers are appointed by each municipality.The council also approves the financialstatements (such as payment methods andlevels of payments (prices)) and makesdecisions about major investments. If thebudget is exceeded, the municipalitiesmust cover the deficit from their ownrevenues, usually by paying higher pricesfor services. In the case of budgetary surplus, the prices paid by municipalitiescan be lowered. Thus, the major purposeof hospital pricing systems has been tocover the costs of production and to allocate hospital costs fairly between themunicipalities financing the provision ofservices within a hospital district.
Thus, in the absence of nationally set reg-ulations or even guidelines, each hospitaldistrict determines the payment methodsused to reimburse its hospitals. Becausepayment methods are district based, theymay vary from district to district. Thepricing trend has been consistently mov-ing away from the bed-per-day price to-wards case-based prices. Presently, 13 outof 21 districts use DRG-based pricing.The principles and rules for DRG usagevary greatly between hospital districtsbecause there are no national guidelines.
There is now increasing evidence thatFinnish hospitals are more efficient than
hospitals in other Nordic countries. According to a recent study, Finnish hospitals were somewhat more efficientthan Danish ones, about 10% more efficient than Norwegian hospitals andalmost 20% more efficient than Swedishhospitals.2 The reason for these differ-ences have not been fully analysed, butone explanation may be that cost controlby municipalities (financed mainly by local taxes) is much more effective thanthat of counties or national governments.
Current issues
Government involvement and monitoring
Under current legislation the power ofthe Ministry of Social Affairs and Healthis very weak, and it does not have effec-tive means to affect decisions made at thelocal level. However, in recent years thegovernment’s involvement in providinghealth care has increased. In 2005 the government implemented two reforms.The first was the introduction of clinicalguidelines for a wide range of treatments,aimed partly at bringing about some convergence across Finland in rates ofelective surgical procedures and settingthresholds for admission to waiting listsfor procedures. The second was the intro-duction of a set of maximum waiting-timetargets for non-urgent examinations andtreatments at health centres and hospitals.The hospital districts must pay a fine ifthey do not meet waiting-time targets.
Scale and scope
There is a clear trend towards increasingthe size of the hospital providers as wellas purchasers, which has happened on avoluntary basis following governmentrecommendations. One example is themerging of three hospitals (Helsinki University, Jorvi and Peijas hospitals) in2007 into one big unit, which producesabout 25% of all acute somatic care in thecountry. The new unit is organized undermedical specialities so that the same specialties in the former three hospitalswere merged. A current initiative fromthe Ministry will centralize the care ofdiseases requiring highly demandingtreatment to five special responsibilityhospital districts (government legislation
2010; implementation 2011). On the purchasing side, in 2009 the number ofmunicipalities decreased from 415 to 342.
Vertical integration
During the last ten years several local reforms have integrated service provisionto a single organization. The purpose ofthese reforms is to enhance cooperationbetween primary and secondary healthcare and social welfare services .The reforms include merging of health centresand regional hospitals into one organiza-tion, creating a new regional, self-regulat-ing administrative body for all municipalservices (including health care, social serv-ices, upper secondary schools and voca-tional services) with regional councils andhospital districts also taking responsibilityfor primary health care. In 2008 about10% of the Finnish population lived in areas where most primary and secondarycare is provided by the same organization.Another current initiative from the ministry includes greater integration ofcare between health centres and non-university hospital districts throughoutthe country (government legislation in2010; implementation expected in 2011).
Patient choice
In the municipal health care system, patients are not free to choose betweenhospitals. A current government proposalinvolves the idea that patients can choose(public) hospitals from their own specialresponsibility hospital districts (govern-ment legislation presented to parliamentin 2010; implementation is expected in2011). However, so far, it has not beendecided (or indeed proposed) how municipalities would pay hospitals undersuch a framework.
Hospital benchmarking
In 1996, the National Research and Development Centre for Health and Wel-fare (STAKES) launched a project, calledthe Hospital Benchmarking project, inco-operation with the hospital districts.The main purpose was to provide hospi-tal managers with benchmarking data toimprove and direct hospital activities.The project designed and implemented aninternet-based information system thatsupports continuous data gathering andprocessing, as well as displays benchmark
World Health
Organization
Regional Office
for Europe
Government
of Finland
Government
of Norway
Government
of Ireland
UNCAM
Government
of the
Netherlands
European
Commission
Government
of Spain
Government
of Slovenia
European
Investment
Bank
Veneto
Region of
Italy
World Bank
London School
of Economics
and Political
Science
London School
of Hygiene &
Tropical
Medicine
THE EUROPEAN OBSERVATORY ONHEALTH SYSTEMS ANDPOLICIES PARTNERS
Government
of Belgium
EditorAnna Maresso
Editorial TeamJosep FiguerasMartin McKee
Elias MossialosSarah Thomson
To join the mailing list, please contact
Anna MaressoObservatory – London HubEmail: [email protected]
Euro Observer is published quarterly by the European
Observatory on Health Systems and Policies, with major
funding provided by a grantfrom Merck & Co., Inc.,
Whitehouse Station, New Jersey, USA.
The views expressed inEuro Observer are those of the authors alone and not
necessarily those of the European Observatory on
Health Systems and Policies orits participating organizations.
© European Observatory onHealth Systems and Policies
2010.
No part of this document maybe copied, reproduced, stored
in a retrieval system or transmitted in any form without
the express written consent ofthe European Observatory on
Health Systems and Policies.
For information and orderingdetails on any of the Observa-
tory publications mentioned inthis issue, please contact:
The European Observatory onHealth Systems and Policies
WHO ECHPRue de l’Autonomie, 4
B - 1070 Brussels, Belgium Tel: +32 2 525 09 33Fax: +32 2 525 0936
Email: [email protected] www.euro.who.int/observatory
Design and production by Westminster European
ISSN: 1020-7481
Government
of Sweden
12
E u r o Ob s e r v e rEu r o Ob s e r v e r Vo l ume 12 , N umbe r 3Vo l ume 12 , N umbe r 3
measures at the desired level of ag-gregation. The project has taken ad-vantage of the existing informationsystems in hospitals (the patient administration systems, cost ac-counting and pricing/ reimburse-ment data and cost administration)to collect patient-level data on pro-duced services and their costs.Nowadays, annual data is collectedroutinely. Productivity and effi-ciency calculations are made withtraditional activity measures, such asDRG admissions and outpatient vis-its, and with a more advanced DRG-weighted episode of care measure.
The quality as well as efficiency ofspecialized care has been evaluatedin a PERFECT project (PERFor-mance, Effectiveness and Cost ofTreatment episodes, (www.thl.fi/fi_FI/web/fi/tutkimus/hankkeet/perfect) since 2004. In this project,protocols for eight diseases/healthproblems (acute myocardial infarc-tion (AMI), revascular procedures(percutanous transluminal coronaryangioplasty (PTCA), coronary artery bypass grafting (CABG)), hipfracture, breast cancer, hip and kneejoint replacements, very low birthweight infants, schizophrenia, andstroke) have been developed. Thedevelopment has been undertaken inseven separate expert groups, whosemembers (approximately 50 experts)are leading clinical experts in the disease areas. DRGs are used for calculating the costs of diseases.
At present, register-based indicators(both at the regional and hospitallevels) on the content of care, costsand outcomes between 1998 and2007 are available for seven healthproblems. The indicators are freelyavailable on the internet, and theywill be routinely updated using morerecent information. They have beenwidely used in local decision-makingand also have been discussed in themedia. The Ministry of Social Affairs and Health uses the informa-tion in its strategic planning: the indicators developed in the projectwill be used to evaluate the develop-ment of regional differences in the
effectiveness of specialized care. The ministry also has used the information in its recommendationconcerning the centralization of certain services (such as care of lowbirth infants) to university hospitalswith adequate resources.
Conclusion
Internationally, the Finnish decen-tralized hospital system seems to berather effective in producing serv-ices, but we do not yet have infor-mation on its performance in termsof outcomes. There exist great re-gional and hospital-level differencesin efficiency, cost and outcomeswhich indicate great potential to improve performance. New govern-ment initiatives (such as introducingpatient choice) have been proposedwithout considering how financingwill be arranged. On the other hand,benchmarking of hospital efficiencyand outcomes is well developed.Originally, this activity was initiatedby researchers and later imple-mented, together with producers(hospitals districts) using financialsupport from research funds. The in-formation has been increasingly usedin local and national decision making
REFERENCES
1. THL.Terveydenhuollon menot jarahoitus vuonna 2008 [Health expenditure and financing 2008]Tilastoraportti 12/2010, 2 June 2010.Suomen virallinen tilasto, terveys2010. [www.stakes.fi/FI/Tilastot/Aiheittain/Terveyspalvelut/terveysmenot.htm]
2. Miika L et al. Measuring cost efficiency in the Nordic hospitals – across-sectional comparison of publichospitals in 2002. Health CareManag Sci, 2010. [www.springerlink.com/content/847601873533p635/]
Unto Häkkinen is Research Professor and Director (Head ofUnit) of the Centre for Health andSocial Economics at the National Institute for Health and Welfare(THL) in Finland.