the changing competitive landscape h&m likely to be a
TRANSCRIPT

KEY CONCLUSIONS
CREDIT SUISSE SECURITIES RESEARCH & ANALYTICS BEYOND INFORMATION®
Client-Driven Solutions, Insights, and Access
Equity Research EMEA
Apparel
23 July 2015
South African Apparel Retail INDUSTRY OVERVIEW/ANALYSIS
The Ideas Engine
series showcases
Credit Suisse’s unique
insights and investment ideas.
Please contact your
Sales person to
access the
supplemental
analysis behind this
report.
The changing competitive landscape
Drivers of change
The South African apparel retail market has undergone significant change over the past
five years, and we view most of these changes as structural rather than cyclical. Credit
provided by retailers does not appear to be a meaningful driver of overall apparel sales,
and reduced credit from retailers has been replaced by other credit providers. This
provides consumers with more choice and the ability to take advantage of lower price
points from fast/value fashion, which remains underpenetrated in South Africa. New
entrants are likely to continue to take share from higher-priced domestic players, with
H&M posing a meaningful threat, in our view.
Introducing the Credit Suisse Apparel Price Monitor
We introduce the Credit Suisse Apparel Price Monitor to help assess the relative price
positioning of companies within the industry, track changes in pricing and monitor the
price points of new entrants. Our pricing analysis leaves us with significant concerns over
the sustainability of Truworths' currently world-leading margins as well as the potential
competitive threat from H&M's entry into the South African market later this year.
Key stock calls
In our view, Truworths is most exposed to the structural challenges facing the industry,
and we downgrade our rating to Underperform from Neutral (new TP R65 from R78).
Mr Price (Outperform, new TP R283 from R272) provides the best exposure to global
trends in fast/value fashion and lower consumer reliance on credit provided by retailers.
The Foschini Group's (Neutral, new TP R150 from R165) and Woolworths' (Neutral, new
TP R94 from R86) more diversified income streams and lower price points suggest to us
that they are less at risk than Truworths.
This note replaces the version published earlier in which the company Financial Summaries on pages 6 to 9 showed only historic data. These have now been replaced to include our forecasts.
Figure 1: H&M likely to be a meaningful threat; Mr Price
competitive: Combined men's and women's basket comparison,
Apr-Jun '15, H&M estimated entry point=100
Source: Retailpricewatch.co.za, Credit Suisse research
Figure 2: Truworths' margins in line with TFG's at similar
price points
Source: Company data, Credit Suisse research
RESEARCH ANALYSTS
Pieter Vorster 44 20 7883 2607 [email protected]
Rishay Dhanraj 27 11 012 80 63 [email protected]
DISCLOSURE APPENDIX AT THE BACK OF THIS REPORT CONTAINS IMPORTANT DISCLOSURES, ANALYST CERTIFICATIONS, AND THE STATUS OF NON-U.S ANALYSTS. US Disclosure: Credit Suisse does and seeks to do business with companies covered in its research reports. As a result, investors should be aware that the Firm may have a conflict of interest that could affect the objectivity of this report. Investors should consider this report as only a single factor in making their investment decision.
183
168
141
122117
106 105 104 100
83
55 52 47 4534
0
20
40
60
80
100
120
140
160
180
200
Dan
iel H
echt
er
Zara
Truw
orth
s
Fosc
hini
/ M
arkh
am
Cot
ton
On
Edga
rs
Iden
tity
Woo
lwor
ths
H&M
est
imat
e
Exac
t!
Acke
rman
s
Legi
t
Jet
Mr P
rice
Pep
Year to Jun 2014 R'm Reported
At Foschini
prices % change
Retail Turnover 10 458 8 715 -16.7
Gross profit 5 841 4 098 -29.8
Gross margin (%) 55.9 47.0
EBITDA 3 273 1 530 -53.3
Operating costs -2 568 -2 568 0.0
Retail profit 3 089 1 346 -56.4
Trade receivable interest income 828 690 -16.7
Debtors cost -916 -763 -16.7
Trading profit 3 236 1 508 -53.4
Trading margin (%) 30.9 17.3
Net profit 2 406 1 167 -51.5
Fully diluted EPS (cents) 568 275 -51.5
IDEAS ENGINE SERIES

IDEAS ENGINE 2
South African Apparel Retail
Key charts
Figure 3: Superior growth should continue at Mr Price; we expect Truworths'
growth to be modest owing to margin pressure
Source: Credit Suisse estimates
Figure 4: Edcon's weakness appears to have shielded other retailers from
structural trends
Source: Company data, Euromonitor, Stats SA, Credit Suisse estimates
Figure 5: Fast/value fashion growing globally, underpenetrated in South Africa
Source: Euromonitor
Figure 6: Other, non-bank, credit providers have filled the gap left by credit
retailers, giving consumers the ability to take advantage of lower prices
elsewhere
Source: NCR
Turnover growth CY15 CY16 CY17 CY18
Mr Price 14.4% 15.0% 15.0% 14.9%
TFG 24.5% 15.1% 10.9% 11.1%
Truworths 9.5% 9.8% 8.8% 8.6%
Woolworths 31.6% 9.1% 9.2% 8.8%
Gross margin (%)
Mr Price 42.9% 43.5% 43.5% 43.5%
TFG (South Africa) 47.3% 47.1% 46.8% 46.6%
Truwroths 54.5% 53.5% 52.2% 50.7%
Woolworths 38.4% 38.4% 38.4% 38.3%
EBIT growth
Mr Price 20.7% 19.1% 18.9% 18.8%
TFG 17.7% 13.4% 11.2% 9.6%
Truworths 5.7% 6.7% 4.7% 3.7%
Woolworths 30.6% 15.7% 14.6% 12.3%
EBIT margin
Mr Price 18.5% 19.1% 19.8% 20.5%
TFG 16.5% 16.3% 16.3% 16.1%
Truworths 29.2% 28.3% 27.3% 26.1%
Woolworths 10.4% 11.0% 11.6% 11.9%
EPS growth
Mr Price 17.8% 17.1% 18.1% 18.0%
TFG 13.6% 12.5% 12.2% 10.6%
Truworths 6.4% 7.6% 5.7% 4.4%
Woolworths 7.7% 15.0% 18.3% 15.3%
% market share 2008 2009 2010 2011 2012 2013 2014 Trend
Edcon 22.3 22.4 21.2 20.9 19.8 18.6 17.7
Edgars 12.5 12.5 12.0 11.8 11.3 10.5 10.0
Discount 9.8 9.9 9.2 9.1 8.4 8.1 7.7
Pepkor 13.9 13.5 13.9 14.3 14.6 14.6 14.5
Mr. Price 6.1 6.8 7.0 7.1 7.2 7.5 8.0
Mr. Price 5.0 5.6 6.0 6.1 6.1 6.5 7.0
Milady's 1.2 1.1 1.1 1.1 1.1 1.1 1.0
Truworths 6.9 7.6 7.8 8.1 8.2 8.1 7.9
Woolworths 8.6 8.5 8.5 8.5 8.7 8.6 8.6
TFG 6.0 6.2 6.5 7.0 7.2 7.2 7.3
Sub-total 63.8 65.0 64.9 65.9 65.8 64.6 64.0
Other 36.2 35.0 35.1 34.1 34.2 35.4 36.0
Total 100.0 100.0 100.0 100.0 100.0 100.0 100.0
0
5
10
15
20
25
30
2005 2006 2007 2008 2009 2010 2011 2012 2013 2014
% m
arke
t sha
re
France Germany Italy South Africa
Spain Sweden United Kingdom
0%
2%
4%
6%
8%
10%
12%
2007
Q4
2008
Q1
2008
Q2
2008
Q3
2008
Q4
2009
Q1
2009
Q2
2009
Q3
2009
Q4
2010
Q1
2010
Q2
2010
Q3
2010
Q4
2011
Q1
2011
Q2
2011
Q3
2011
Q4
2012
Q1
2012
Q2
2012
Q3
2012
Q4
2013
Q1
2013
Q2
2013
Q3
2013
Q4
2014
Q1
2014
Q2
2014
Q3
2014
Q4
2015
Q1
Retailers Other credit providers

IDEAS ENGINE 3
South African Apparel Retail
Investment summary
The South African apparel retail market has undergone significant change over the past five
years and we view most of these changes as structural rather than cyclical. We have
analysed the drivers of these changes and look at how these factors might play out over the
next three-to-five years.
In this report we also introduce the Credit Suisse Apparel Price Monitor to help us assess the
relative price positioning of companies within the industry, track changes in pricing and
monitor the price points of new entrants. Our pricing analysis leaves us with significant
concerns over the sustainability of Truworths' currently world-leading margins as well as the
potential competitive threat from H&M's entry into the South African market later this year.
We highlight four major drivers of change in the market:
− Weak credit sales growth – our analysis shows that although its origin may be cyclical,
its effect is likely lasting and structural.
− Strong cash sales growth – on the face of it, the flipside of weak credit sales growth,
but continued growth in fast/value fashion has a strong global trend underpin and in South
Africa this is likely to be further supported by what we view as structural change in the
credit retail sales market.
− The rising presence of multinational players – we see continued growth in market
share from foreign entrants, which is likely to accelerate significantly with the entry of
H&M in October 2015; this trend will also add downward pressure on margins, particularly
of the credit retailers.
− Edcon as a source of market share – in our view the consistent market share declines
of market leader Edcon have softened the near-term structural negative effects of the
traditional domestic players. The recently announced subordinated debt renegotiation
provides the group with a near-term buffer, while further restructuring could position it
better, potentially making it a more effective competitor.
Weak credit sales – a structural change in the way consumers fund their spending
Whilst the state of the consumer credit market may be an important revenue driver for those
retailers whose sales are predominantly on credit, it does not appear to have a meaningful
impact on the overall level of Apparel and Footwear sales in South Africa. Furthermore,
consumers now have access to a larger variety of credit sources and have become less reliant
on store credit, in our view. This has enabled traditional store credit customers to access still
aspirational, but substantially lower-priced, retailers such as Mr Price. We believe that consumer
behaviour has changed and that, even when credit conditions ease, we are unlikely to see the
same uptick in credit sales as one might have expected based on previous cycles.
Cash sales – the new credit sales, supported by global trends in fast/value fashion
Although Mr Price's strong performance over the past five years could be attributed to a
combination of weak sales at competitor Edcon and its value for money offering resonating with
a consumer under pressure on multiple fronts, including restricted availability of credit, we
believe the development is structural and in line with global trends which has seen significant
growth in the fast/value fashion segment of the market.
Multinationals – a rising threat to domestic players
In 2011, both Cotton On and Inditex entered the South African market and H&M is set to open
its first store in the country in October 2015. In addition, Edcon has introduced Topshop into
its Edgars stores in 2012 and opened its first standalone Topshop store in 2013.
We expect Cotton On to continue to grow from its current base of 118 stores and view H&M as
a major risk to the likes of Truworths and Foschini and, to some extent, Edgars and
Woolworths, given its likely price points, whereas we expect Zara's relatively high price points to
keep it a relatively small, albeit growing participant.
Both Inditex and H&M have shown that they can operate successfully in southern hemisphere
markets and we believe their success in Australia is of particular relevance in South Africa.
H&M stands out, capturing c.1.7% of the Australian market after only one year. We are not
forecasting the same rate of market share capture in South Africa given differences in the
geographic distribution of retail sales, but nonetheless view it as a meaningful threat to
domestic players, particularly with respect to pricing and margins.
Assuming H&M positions its price points in South Africa relative to Zara in line with where it is
in the UK, we think this would place it at the low end of fashion retailers in South Africa, with
Woolworths' and Edgars' price points at a premium to H&M of 4% and 6%, respectively,
Cotton On at a 17% premium, Foschini at 22% and Truworths 41% more expensive. Mr Price
would be at a 55% discount to H&M, which is not dissimilar to the relative price positioning of
Primark to H&M in the UK.
Our key stock calls
In our view, Truworths is most exposed to the structural challenges facing the industry, and we
downgrade our rating to Underperform from Neutral (new TP R65 from R78). Mr Price
(Outperform, new TP R283 from R272) provides the best exposure to global trends in
fast/value fashion, in our view, as well as lower consumer reliance on credit provided by
retailers. TFG's (Neutral, new TP R150 from R165) and Woolworths' (Neutral, new TP R94
from R86) more diversified income streams and lower price points suggest to us that they are
less at risk than Truworths.
Truworths International – Downgrade to Underperform, reducing target price by 15%
We downgrade our rating on Truworths to Underperform from Neutral and reduce our DCF-
based target price by 15% to R65 (from R78), indicating potential downside of 26%. We cut
our FY16-18 fully diluted adjusted EPS estimates by 5-16%, leaving us 11% below
I/B/E/S consensus in FY18.
Truworths currently generates the highest operating margin in our global apparel coverage
universe. Our analysis shows that, relative to its closest domestic peer, TFG, this is largely a
function of higher and, in our view, unsustainable price points.

IDEAS ENGINE 4
South African Apparel Retail
While Truworths' CY16E PE multiple appears to offer value, we show that on a pro forma
basis, at TFG's price points, it would generate operating margins in line with TFG and EPS
some 50% below current levels.
With some 70% of group sales on credit, Truworths has by far the highest exposure to the
changing credit market dynamics outlined in this report. Not only does it potentially restrict
sales growth, but as alternative sources of consumer credit provide credit customers with the
ability to make cash purchases and more choice, the high price premiums charged by
Truworths look increasingly unsustainable.
We believe Truworths also faces the largest threat from international competition. Although
its average price points are currently below those of Zara, it is likely to lose higher-end
customers to it. Cotton On's average pricing is c.17% lower than Truworths', with an
offering that appears to be resonating well with the under 25-year-old, mid-to-high LSM
segment. We view H&M as a key risk for Truworths.
Excluding acquisitions, we expect revenue growth to remain below 9% p.a. with like-for-like
growth at 4% p.a. (1.3% in FY15) over the next five reporting years and forecast gross
margins to decline from 55.9% in FY14 to 50.0% in FY19 owing to pricing pressure. This
margin would still be higher than the 47.3% achieved by TFG in FY15E and the 46.5% we
forecast for TFG in FY19.
At the EPS level, we forecast growth of only 5.5% per annum over the next five years, with
improved bad debts more than offset by gross margin and other cost pressures.
Although Truworths' recent trading statement surprised positively, we believe the implied
margin reductions may signal a change in the company's long-standing philosophy of not
sacrificing margin for growth and we expect this trend to accelerate under new management.
In its trading statement covering the period to 28 June 2015, Truworths announced that it
expects growth in HEPS of 2-4%, in line with our estimate of 3.8%, but ahead of consensus
growth of 1.9%. However, its revenue growth of 8.2% exceeded our estimate of 6.7%.
Excluding the recently acquired Naartjie and Earthchild brands, growth amounted to 7.2%.
Owing to the stable cash flow growth of the retail industry, we believe it is appropriate to
value Truworths using the discounted cash flow (DCF) methodology. We forecast explicit
cash flows for five years, after which the growth rate free cash flow return in invested capital
is faded to the final year growth rate and WACC respectively over the competitive advantage
period (CAP). Our DCF fair value is adjusted by the WACC to determine our 12-month
target price of R65. For Truworths, we use a 13.25% WACC, 10-year CAP and a final year
growth rate of 6%. Our target price change largely reflects our lower earnings estimates (our
FY19 earnings estimates are 23% below our previous forecast).
Mr Price Group Limited – Retain Outperform, raise target price
We retain our recently upgraded rating at Outperform (Mr Price Group Limited - Upgrade
to Outperform) and increase our DCF-based target price to R283 from R272.
Mr Price has shown strong growth in market share over the past five years, rising from 5.6%
in 2009 to 7.0% in 2014. In our view, this growth has resulted from a combination of global
trends favouring fast/value fashion, supported by structural change in the South African retail
credit market and attractive price points that are currently only about one third of Truworths'.
Our analysis shows that the South African fast/value segment remains underpenetrated and
we expect Mr Price, the leading player in this segment, to continue to gain share.
With Mr Price's average basket currently at 27% of Zara, 38% of Cotton On and 45% of
where we estimate H&M will likely enter the market, we do not view increased participation
by multinational players as a meaningful threat to Mr Price's growth prospects in the apparel
segment.
With its full-year results, Mr Price has announced that it intends to enter the Australian
market with two trial stores and indicated that it would have pricing relative to Cotton On
similar to its position in South Africa, i.e. some 60% below. We have not factored in any
contribution from Australia, but estimate that it can contribute between 5% and 10% of
group earnings over the next 3-5 years.
Over the next five years, we expect Mr Price to deliver diluted EPS growth of 17.6% p.a.,
which is the highest in our coverage universe by some margin.
Owing to the stable cash flow growth of the retail industry, we believe it is appropriate to
value Mr Price using the discounted cash flow (DCF) methodology. We forecast explicit cash
flows for five years, after which the growth rate free cash flow return in invested capital is
faded to the final year growth rate and WACC respective over the competitive advantage
period (CAP). Our DCF fair value is adjusted by the WACC to determine our 12-month
target price of R283. For Mr Price, we use a 12.02% WACC, 23-year CAP and a final year
growth rate of 7.5%. Our target price increase reflects a one-year increase in our CAP
assumption owing to our increased confidence in the sustainability of Mr Price's growth and
returns, partly offset by an increase in the number of shares issued under the group's share
incentive schemes.
The Foschini Group – Retain Neutral, reduce estimates and target price
We reduce our DCF-based target price by 9% from R165 to R150 and retain our Neutral
rating and cut our FY16-18 diluted HEPS estimates 2-7%, leaving us 7% below consensus
in FY18.
TFG's credit fashion apparel businesses, Foschini and Markham, face the same competitive
pressures as Truworths, except that TFG's average basket is priced 13-17% below that of
Truworths'. These two divisions made up 42% of TFG's FY14 revenue, with this likely to fall
to below 35% in FY16 when the Phase Eight acquisition is included for a full year.
For the South African Clothing division (56% of FY16E group turnover), we forecast growth
of 10% p.a. over the next five years, with LFL growth of 5% in FY16, rising to 6% in
subsequent years. This is ahead of the 4% we forecast for Truworths partly because we
expect less price pressure at TFG's fashion apparel businesses given lower price points, and
partly because we expect higher growth from its sports businesses that make up around
30% of divisional revenue.
From FY16-20 we expect group gross margins in South Africa to decline by some 100bps,
which implies a reduction at Foschini and Markham of around 250bps, which is less than half
the decline we are forecasting at Truworths owing to its lower relative price points.
At the EPS level, we forecast growth of 12% p.a. over the next five years, which is more
than double the rate we expect at Truworths.

IDEAS ENGINE 5
South African Apparel Retail
Owing to the stable cash flow growth of the retail industry, we believe it is appropriate to
value TFG using the discounted cash flow (DCF) methodology. We forecast explicit cash
flows for five years, after which the growth rate free cash flow return in invested capital is
faded to the final year growth rate and WACC respective over the competitive advantage
period (CAP). Our DCF fair value is adjusted by the WACC to determine our 12-month
target price of R150. For TFG, we use a 12.1% WACC, 11-year CAP and a final year
growth rate of 6.% Our target price reduction is largely a function of our lower earnings
estimates.
Woolworths Holdings Limited – Retain Neutral, raise target price
We retain our Neutral rating on Woolworths and raise our DCF-based target price to R94
from R86.
Although Woolworths' South African apparel business is not immune to the threat of
international competition and fast/value fashion trends, it operates at lower price points than
the credit retailers.
Furthermore, Clothing and General Merchandise accounts for only 20% of FY16E group
revenue and 34% of operating profit. We are cautious on this division and forecast turnover
growth of around 9% p.a. over the next five years, modestly above Truworths'. We are not
forecasting margin declines, but believe the group's FY17 margin target of 19% for this
division is at risk – we forecast 18.25%.
Offsetting this is continued good, albeit slowing growth in Food—at 13.5% in FY15E to slow
moderately to 13.1% by FY17E and restructuring benefits from David Jones in Australia.
Over the next five years we expect EPS growth of 14.5% p.a., which is second only to
Mr Price in our South African Apparel retail universe.
Owing to the stable cash flow growth of the retail industry, we believe it is appropriate to
value Woolworths using the discounted cash flow (DCF) methodology. We forecast explicit
cash flows for five years, after which the growth rate free cash flow return in invested capital
is faded to the final year growth rate and WACC respectively over the competitive advantage
period (CAP). Our DCF fair value is adjusted by the WACC to determine our 12-month target
price of R94. For Woolworths, we use a 12.25% WACC, 15-year CAP and a final year
growth rate of 5%. Our target price increase reflects an increase in invested capital used for
our terminal value to incorporate the David Jones acquisition, partly offset by a lower CAP
assumption.
IDEAS ENGINE 6
South African Apparel Retail
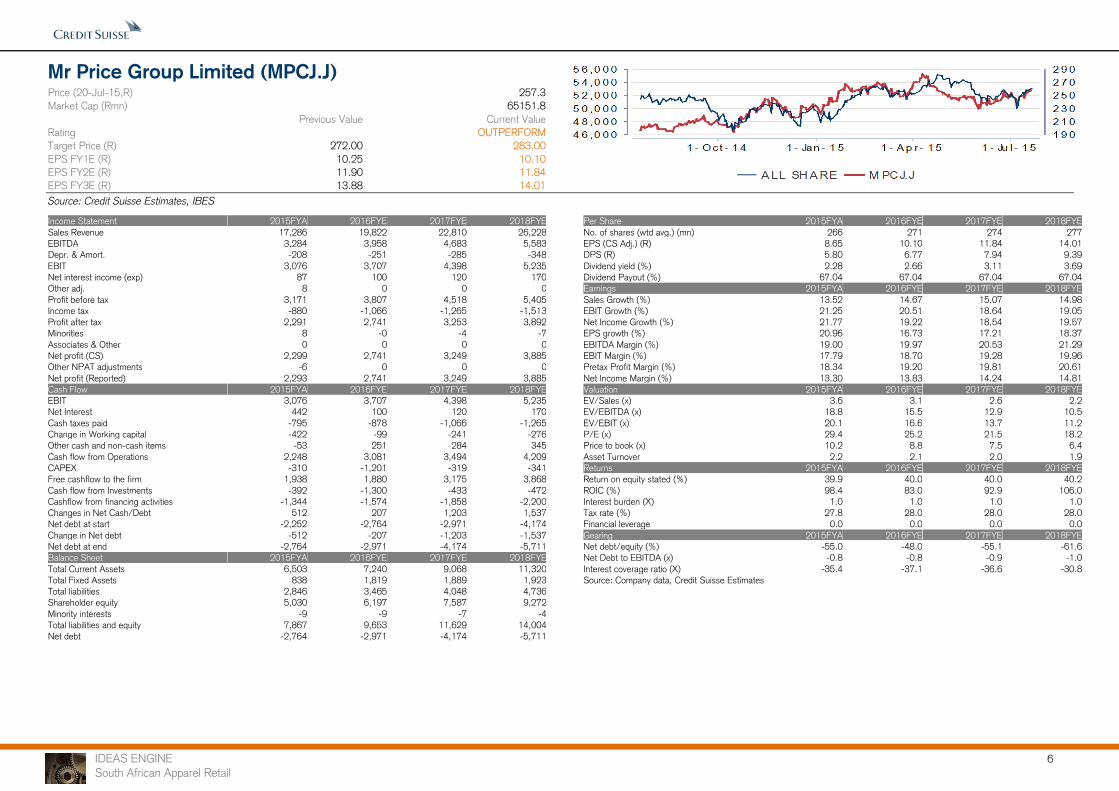
Mr Price Group Limited (MPCJ.J)
Price (20-Jul-15,R) 257.3
Market Cap (Rmn) 65151.8
Previous Value Current Value
Rating OUTPERFORM
Target Price (R) 272.00 283.00
EPS FY1E (R) 10.25 10.10
EPS FY2E (R) 11.90 11.84
EPS FY3E (R) 13.88 14.01
Source: Credit Suisse Estimates, IBES
Income Statement 2015FYA 2016FYE 2017FYE 2018FYE
Sales Revenue 17,286 19,822 22,810 26,228
EBITDA 3,284 3,958 4,683 5,583
Depr. & Amort. -208 -251 -285 -348
EBIT 3,076 3,707 4,398 5,235
Net interest income (exp) 87 100 120 170
Other adj. 8 0 0 0
Profit before tax 3,171 3,807 4,518 5,405
Income tax -880 -1,066 -1,265 -1,513
Profit after tax 2,291 2,741 3,253 3,892
Minorities 8 -0 -4 -7
Associates & Other 0 0 0 0
Net profit (CS) 2,299 2,741 3,249 3,885
Other NPAT adjustments -6 0 0 0
Net profit (Reported) 2,293 2,741 3,249 3,885
Cash Flow 2015FYA 2016FYE 2017FYE 2018FYE
EBIT 3,076 3,707 4,398 5,235
Net Interest 442 100 120 170
Cash taxes paid -795 -878 -1,066 -1,265
Change in Working capital -422 -99 -241 -276
Other cash and non-cash items -53 251 284 345
Cash flow from Operations 2,248 3,081 3,494 4,209
CAPEX -310 -1,201 -319 -341
Free cashflow to the firm 1,938 1,880 3,175 3,868
Cash flow from Investments -392 -1,300 -433 -472
Cashflow from financing activities -1,344 -1,574 -1,858 -2,200
Changes in Net Cash/Debt 512 207 1,203 1,537
Net debt at start -2,252 -2,764 -2,971 -4,174
Change in Net debt -512 -207 -1,203 -1,537
Net debt at end -2,764 -2,971 -4,174 -5,711
Balance Sheet 2015FYA 2016FYE 2017FYE 2018FYE
Total Current Assets 6,503 7,240 9,068 11,320
Total Fixed Assets 838 1,819 1,889 1,923
Total liabilities 2,846 3,465 4,048 4,736
Shareholder equity 5,030 6,197 7,587 9,272
Minority interests -9 -9 -7 -4
Total liabilities and equity 7,867 9,653 11,629 14,004
Net debt -2,764 -2,971 -4,174 -5,711
Per Share 2015FYA 2016FYE 2017FYE 2018FYE
No. of shares (wtd avg.) (mn) 266 271 274 277
EPS (CS Adj.) (R) 8.65 10.10 11.84 14.01
DPS (R) 5.80 6.77 7.94 9.39
Dividend yield (%) 2.28 2.66 3.11 3.69
Dividend Payout (%) 67.04 67.04 67.04 67.04
Earnings 2015FYA 2016FYE 2017FYE 2018FYE
Sales Growth (%) 13.52 14.67 15.07 14.98
EBIT Growth (%) 21.25 20.51 18.64 19.05
Net Income Growth (%) 21.77 19.22 18.54 19.57
EPS growth (%) 20.96 16.73 17.21 18.37
EBITDA Margin (%) 19.00 19.97 20.53 21.29
EBIT Margin (%) 17.79 18.70 19.28 19.96
Pretax Profit Margin (%) 18.34 19.20 19.81 20.61
Net Income Margin (%) 13.30 13.83 14.24 14.81
Valuation 2015FYA 2016FYE 2017FYE 2018FYE
EV/Sales (x) 3.6 3.1 2.6 2.2
EV/EBITDA (x) 18.8 15.5 12.9 10.5
EV/EBIT (x) 20.1 16.6 13.7 11.2
P/E (x) 29.4 25.2 21.5 18.2
Price to book (x) 10.2 8.8 7.5 6.4
Asset Turnover 2.2 2.1 2.0 1.9
Returns 2015FYA 2016FYE 2017FYE 2018FYE
Return on equity stated (%) 39.9 40.0 40.0 40.2
ROIC (%) 98.4 83.0 92.9 106.0
Interest burden (X) 1.0 1.0 1.0 1.0
Tax rate (%) 27.8 28.0 28.0 28.0
Financial leverage 0.0 0.0 0.0 0.0
Gearing 2015FYA 2016FYE 2017FYE 2018FYE
Net debt/equity (%) -55.0 -48.0 -55.1 -61.6
Net Debt to EBITDA (x) -0.8 -0.8 -0.9 -1.0
Interest coverage ratio (X) -35.4 -37.1 -36.6 -30.8
Source: Company data, Credit Suisse Estimates

IDEAS ENGINE 7
South African Apparel Retail
The Foschini Group (TFGJ.J)
Price (20-Jul-15,R) 155.0
Market Cap (Rmn) 32705.8
Previous Value Current Value
Rating NEUTRAL
Target Price (R) 165.00 150.00
EPS FY1E (R) 10.44 10.26
EPS FY2E (R) 12.01 11.47
EPS FY3E (R) 13.84 12.89
Source: Credit Suisse Estimates, IBES
Income Statement 2015FYA 2016FYE 2017FYE 2018FYE
Sales Revenue 16,086 20,616 22,850 25,349
EBITDA 2,913 3,993 4,448 4,950
Depr. & Amort. -428 -650 -727 -815
EBIT 2,786 3,343 3,721 4,135
Net interest income (exp) -198 -300 -267 -252
Other adj. 302 0 0 0
Profit before tax 2,890 3,043 3,454 3,883
Income tax -754 -855 -971 -1,091
Profit after tax 2,137 2,188 2,484 2,792
Minorities -0 -31 -37 -44
Associates & Other -292 0 0 0
Net profit (CS) 1,844 2,157 2,446 2,748
Other NPAT adjustments 24 0 0 0
Net profit (Reported) 1,867 2,157 2,446 2,748
Cash Flow 2015FYA 2016FYE 2017FYE 2018FYE
EBIT 2,786 3,343 3,721 4,135
Net Interest -228 -320 -290 -280
Cash taxes paid -766 -749 -855 -971
Change in Working capital -998 -560 -521 -560
Other cash and non-cash items 300 654 731 821
Cash flow from Operations 1,095 2,368 2,786 3,146
CAPEX -670 -660 -663 -760
Free cashflow to the firm 425 1,709 2,123 2,386
Cash flow from Investments -1,780 -660 -663 -760
Cashflow from financing activities -2,898 -609 -1,809 -2,018
Changes in Net Cash/Debt -3,583 1,100 314 367
Net debt at start 2,659 6,242 5,142 4,828
Change in Net debt 3,583 -1,100 -314 -367
Net debt at end 6,242 5,142 4,828 4,461
Balance Sheet 2015FYA 2016FYE 2017FYE 2018FYE
Total Current Assets 11,608 12,488 13,521 14,629
Total Fixed Assets 2,197 2,331 2,409 2,516
Total liabilities 10,400 9,726 10,039 10,340
Shareholder equity 8,131 9,679 10,316 11,046
Minority interests 3 18 37 59
Total liabilities and equity 18,533 19,423 20,392 21,445
Net debt 6,242 5,142 4,828 4,461
Per Share 2015FYA 2016FYE 2017FYE 2018FYE
No. of shares (wtd avg.) (mn) 206 210 213 213
EPS (CS Adj.) (R) 8.95 10.26 11.47 12.89
DPS (R) 5.88 6.78 7.58 8.51
Dividend yield (%) 3.87 4.46 4.99 5.61
Dividend Payout (%) 65.71 66.04 66.04 66.04
Earnings 2015FYA 2016FYE 2017FYE 2018FYE
Sales Growth (%) 13.61 28.16 10.83 10.94
EBIT Growth (%) 10.62 19.98 11.30 11.12
Net Income Growth (%) 9.57 16.97 13.43 12.33
EPS growth (%) 10.31 14.67 11.81 12.33
EBITDA Margin (%) 18.11 19.37 19.47 19.53
EBIT Margin (%) 17.32 16.22 16.29 16.31
Pretax Profit Margin (%) 17.97 14.76 15.12 15.32
Net Income Margin (%) 11.46 10.46 10.71 10.84
Valuation 2015FYA 2016FYE 2017FYE 2018FYE
EV/Sales (x) 2.4 1.8 1.6 1.4
EV/EBITDA (x) 13.1 9.3 8.3 7.4
EV/EBIT (x) 13.7 11.1 9.9 8.8
P/E (x) 17.0 14.8 13.2 11.8
Price to book (x) 3.8 3.3 3.1 2.9
Asset Turnover 0.9 1.1 1.1 1.2
Returns 2015FYA 2016FYE 2017FYE 2018FYE
Return on equity stated (%) 24.3 24.2 24.5 25.7
ROIC (%) 13.0 16.2 17.6 19.1
Interest burden (X) 1.0 0.9 0.9 0.9
Tax rate (%) 32.8 28.1 28.1 28.1
Financial leverage 0.9 0.6 0.6 0.5
Gearing 2015FYA 2016FYE 2017FYE 2018FYE
Net debt/equity (%) 76.7 53.0 46.6 40.2
Net Debt to EBITDA (x) 2.1 1.3 1.1 0.9
Interest coverage ratio (X) 14.1 11.1 13.9 16.4
Source: Company data, Credit Suisse Estimates

IDEAS ENGINE 8
South African Apparel Retail
Truworths International Limited (TRUJ.J)
Price (20-Jul-15,R) 88.2
Market Cap (Rmn) 37866.7
Previous Value Current Value
Rating NEUTRAL UNDERPERFORM
Target Price (R) 78.00 65.00
EPS FY1E (R) 5.91 5.90
EPS FY2E (R) 6.76 6.41
EPS FY3E (R) 7.63 6.83
Source: Credit Suisse Estimates, IBES
Income Statement 2014FYA 2015FYE 2016FYE 2017FYE
Sales Revenue 10,458 11,314 12,526 13,642
EBITDA 3,424 3,566 3,868 4,103
Depr. & Amort. -203 -241 -277 -316
EBIT 3,240 3,344 3,610 3,807
Net interest income (exp) 89 110 147 195
Other adj. 36 0 0 0
Profit before tax 3,365 3,454 3,757 4,002
Income tax -952 -978 -1,064 -1,134
Profit after tax 2,413 2,475 2,693 2,868
Minorities -0 -0 -0 -0
Associates & Other -4 0 0 0
Net profit (CS) 2,409 2,475 2,693 2,868
Other NPAT adjustments -3 0 0 0
Net profit (Reported) 2,406 2,475 2,693 2,868
Cash Flow 2014FYA 2015FYE 2016FYE 2017FYE
EBIT 3,240 3,344 3,610 3,807
Net Interest 917 1,104 1,235 1,326
Cash taxes paid -984 -951 -978 -1,064
Change in Working capital -105 -264 -170 -180
Other cash and non-cash items -527 -772 -830 -834
Cash flow from Operations 2,541 2,461 2,867 3,054
CAPEX -275 -430 -376 -409
Free cashflow to the firm 2,266 2,031 2,491 2,645
Cash flow from Investments -287 -445 -393 -428
Cashflow from financing activities -1,991 -1,616 -1,677 -1,824
Changes in Net Cash/Debt 263 400 797 803
Net debt at start -1,325 -1,588 -1,988 -2,785
Change in Net debt -263 -400 -797 -803
Net debt at end -1,588 -1,988 -2,785 -3,587
Balance Sheet 2014FYA 2015FYE 2016FYE 2017FYE
Total Current Assets 6,716 7,472 8,571 9,674
Total Fixed Assets 934 1,151 1,279 1,403
Total liabilities 1,434 1,554 1,771 1,962
Shareholder equity 6,642 7,501 8,517 9,561
Minority interests 0 0 0 0
Total liabilities and equity 8,076 9,056 10,288 11,522
Net debt -1,588 -1,988 -2,785 -3,587
Per Share 2014FYA 2015FYE 2016FYE 2017FYE
No. of shares (wtd avg.) (mn) 424 420 420 420
EPS (CS Adj.) (R) 5.68 5.90 6.41 6.83
DPS (R) 3.85 4.00 4.35 4.63
Dividend yield (%) 4.39 4.56 4.95 5.28
Dividend Payout (%) 67.75 67.75 67.75 67.75
Earnings 2014FYA 2015FYE 2016FYE 2017FYE
Sales Growth (%) 7.10 8.18 10.72 8.91
EBIT Growth (%) -0.98 3.21 7.95 5.45
Net Income Growth (%) 0.04 2.76 8.77 6.52
EPS growth (%) 1.36 3.77 8.77 6.52
EBITDA Margin (%) 32.74 31.52 30.88 30.08
EBIT Margin (%) 30.98 29.56 28.82 27.90
Pretax Profit Margin (%) 32.18 30.53 29.99 29.33
Net Income Margin (%) 23.03 21.88 21.50 21.02
Valuation 2014FYA 2015FYE 2016FYE 2017FYE
EV/Sales (x) 3.4 3.2 2.8 2.5
EV/EBITDA (x) 10.5 10.0 9.0 8.3
EV/EBIT (x) 11.1 10.7 9.7 8.9
P/E (x) 15.4 14.9 13.7 12.8
Price to book (x) 5.0 4.5 4.0 3.6
Asset Turnover 1.3 1.2 1.2 1.2
Returns 2014FYA 2015FYE 2016FYE 2017FYE
Return on equity stated (%) 31.0 32.0 31.1 29.6
ROIC (%) 45.9 43.5 45.1 45.7
Interest burden (X) 1.0 1.0 1.0 1.1
Tax rate (%) 28.4 28.3 28.3 28.3
Financial leverage 0.0 0.0 0.0 0.0
Gearing 2014FYA 2015FYE 2016FYE 2017FYE
Net debt/equity (%) -23.9 -26.5 -32.7 -37.5
Net Debt to EBITDA (x) -0.5 -0.6 -0.7 -0.9
Interest coverage ratio (X) -36.4 -30.4 -24.6 -19.5
Source: Company data, Credit Suisse Estimates

IDEAS ENGINE 9
South African Apparel Retail
Woolworths Holdings Limited (WHLJ.J)
Price (20-Jul-15,R) 98.6
Market Cap (Rmn) 100234.5
Previous Value Current Value
Rating NEUTRAL
Target Price (R) 86.00 94.00
EPS FY1E (R) 3.96 3.96
EPS FY2E (R) 4.76 4.66
EPS FY3E (R) 5.70 5.58
Source: Credit Suisse Estimates, IBES
Income Statement 2014FYA 2015FYE 2016FYE 2017FYE
Sales Revenue 39,707 61,521 66,758 73,200
EBITDA 5,117 7,741 8,924 10,256
Depr. & Amort. -872 -1,559 -1,772 -1,977
EBIT 4,245 6,183 7,152 8,279
Net interest income (exp) -24 -1,210 -1,090 -990
Other adj. 185 204 224 246
Profit before tax 4,406 5,177 6,286 7,535
Income tax -1,114 -1,450 -1,810 -2,170
Profit after tax 3,292 3,727 4,476 5,365
Minorities -102 -0 -0 -0
Associates & Other -172 -149 0 0
Net profit (CS) 3,018 3,578 4,476 5,365
Other NPAT adjustments -233 -512 0 0
Net profit (Reported) 2,785 3,066 4,476 5,365
Cash Flow 2014FYA 2015FYE 2016FYE 2017FYE
EBIT 4,245 6,183 7,152 8,279
Net Interest -2 -1,220 -1,100 -1,000
Cash taxes paid -1,047 -1,114 -1,450 -1,810
Change in Working capital -407 13 102 126
Other cash and non-cash items 1,287 1,016 1,782 1,987
Cash flow from Operations 4,076 4,878 6,487 7,582
CAPEX -1,314 -2,615 -2,670 -2,562
Free cashflow to the firm 2,762 2,263 3,817 5,020
Cash flow from Investments -1,710 -26,162 -2,670 -2,562
Cashflow from financing activities -1,936 5,966 -2,744 -3,228
Changes in Net Cash/Debt 130 -15,426 1,072 1,792
Net debt at start -750 -880 14,546 13,474
Change in Net debt -130 15,426 -1,072 -1,792
Net debt at end -880 14,546 13,474 11,682
Balance Sheet 2014FYA 2015FYE 2016FYE 2017FYE
Total Current Assets 14,077 8,095 8,683 9,406
Total Fixed Assets 3,404 14,665 15,563 16,147
Total liabilities 15,317 27,909 27,888 27,304
Shareholder equity 6,629 14,906 16,637 18,774
Minority interests 323 107 107 107
Total liabilities and equity 22,269 42,922 44,632 46,186
Net debt -880 14,546 13,474 11,682
Per Share 2014FYA 2015FYE 2016FYE 2017FYE
No. of shares (wtd avg.) (mn) 801 903 961 961
EPS (CS Adj.) (R) 3.77 3.96 4.66 5.58
DPS (R) 2.72 2.86 3.36 4.03
Dividend yield (%) 2.80 2.94 3.46 4.15
Dividend Payout (%) 72.11 72.11 72.11 72.11
Earnings 2014FYA 2015FYE 2016FYE 2017FYE
Sales Growth (%) 12.72 54.94 8.51 9.65
EBIT Growth (%) 19.61 45.64 15.68 15.75
Net Income Growth (%) 16.44 18.54 25.10 19.86
EPS growth (%) 21.20 5.14 17.61 19.86
EBITDA Margin (%) 12.89 12.58 13.37 14.01
EBIT Margin (%) 10.69 10.05 10.71 11.31
Pretax Profit Margin (%) 11.10 8.41 9.42 10.29
Net Income Margin (%) 7.60 5.82 6.70 7.33
Valuation 2014FYA 2015FYE 2016FYE 2017FYE
EV/Sales (x) 2.5 1.8 1.7 1.5
EV/EBITDA (x) 19.1 14.6 12.6 10.8
EV/EBIT (x) 23.0 18.3 15.7 13.3
P/E (x) 25.8 24.5 20.8 17.4
Price to book (x) 9.7 5.3 5.1 4.6
Asset Turnover 1.8 1.4 1.5 1.6
Returns 2014FYA 2015FYE 2016FYE 2017FYE
Return on equity stated (%) 37.2 25.4 26.2 28.2
ROIC (%) 50.9 14.4 16.9 19.3
Interest burden (X) 1.0 0.8 0.9 0.9
Tax rate (%) 27.1 31.4 28.8 28.8
Financial leverage 1.1 0.9 0.8 0.6
Gearing 2014FYA 2015FYE 2016FYE 2017FYE
Net debt/equity (%) -12.7 96.9 80.5 61.9
Net Debt to EBITDA (x) -0.2 1.9 1.5 1.1
Interest coverage ratio (X) 176.9 5.1 6.6 8.4
Source: Company data, Credit Suisse Estimates

IDEAS ENGINE 10
South African Apparel Retail
Figure 7: Global apparel retail valuation comparison
Source: Company data, Credit Suisse estimates, IBES estimates for Not Covered stocks, Priced as at 21 July 2014
Rating Ticker CCYShare price
Target
price
Upside /
(Downside) CY2015E CY2016E CY2015E CY2016E CY2015E CY2016E CY2015E CY2016E CY2015E CY2016E
South Africa
Mr Price Group Limited OUTPERFORM MPCJ.J ZAR 260.7 283.0 9% 26.8x 22.9x 24.8x 20.73x 16.7x 14.0x 2.9% 4.3% 2.5% 2.9%
The Foschini Group NEUTRAL TFGJ.J ZAR 156.2 150.0 -4% 15.7x 14.0x 16.9x 14.71x 10.3x 8.8x 4.2% 6.1% 4.2% 4.7%
Truworths International Limited UNDERPERFORM TRUJ.J ZAR 89.7 65.0 -28% 14.5x 13.5x 14.7x 13.57x 9.9x 9.0x 5.9% 6.7% 4.7% 5.0%
Woolworths Holdings Limited NEUTRAL WHLJ.J ZAR 99.3 94.0 -5% 23.0x 19.4x 23.1x 20.9x 12.9x 12.0x 3.0% 4.4% 3.1% 3.7%
Average 20.0x 17.4x 19.9x 17.5x 12.4x 11.0x 4.0% 5.4% 3.6% 4.1%
Latam
Marisa S.A. UNDERPERFORM AMAR3 BRL 9.1 17.0 88% 8.3x 5.6x 8.4x 6.00x 4.0x 3.5x 10.0% 9.0% 2.1% 3.0%
Arezzo Industria e Comercio SA NEUTRAL ARZZ3 BRL 22.2 33.0 49% 13.5x 11.1x 12.8x 10.9x 8.5x 7.2x -4.5% -5.6% 3.7% 4.3%
CIA Hering S.A. NEUTRAL HGTX3 BRL 11.9 25.0 110% 6.0x 5.2x 5.9x 5.0x 3.8x 3.2x 13.9% 13.3% 11.8% 13.4%
Restoque Comércio e Confecções de NEUTRAL LLIS3 BRL 5.6 7.0 25% 25.7x 19.1x 26.4x 24.6x 11.4x 9.9x 5.7% 6.2% 0.6% 1.0%
Lojas Renner S.A. OUTPERFORM LREN3 BRL 111.6 100.0 -10% 24.9x 20.6x 24.2x 20.2x 12.7x 10.7x 3.8% 6.3% 1.3% 2.0%
GRUPO SANBORNS, S.A.B. DE CV OUTPERFORM GSNBRB1.MX MXN 25.6 31.0 21% 18.7x 16.5x 15.5x 14.1x 9.6x 8.7x 4.0% 5.8% 4.1% 4.1%
El Puerto de Liverpool, S.A.B. de C.V. OUTPERFORM LIVEPOLC1.MX MXN 193.0 175.0 -9% 30.1x 25.5x 30.0x 25.9x 18.3x 15.9x 0.8% 0.7% 0.2% 0.5%
S.A.C.I. FALABELLA NEUTRAL FALAB CLP 4400.0 4500.0 2% 20.1x 18.1x 20.1x 18.1x 12.2x 10.9x 1.1% 1.8% 1.3% 1.5%
Average 18.4x 15.2x 17.9x 15.6x 10.1x 8.8x 4.4% 4.7% 3.1% 3.7%
Europe
Hennes & Mauritz NEUTRAL HMb.ST SEK 339.4 360.0 6% 26.0x 24.0x 22.4x 20.7x 14.1x 13.0x 3.4% 3.5% 3.1% 3.4%
Inditex UNDERPERFORM ITX.MC EUR 31.0 20.0 -35% 34.6x 31.4x 33.6x 30.2x 20.1x 18.1x 3.1% 3.4% 1.5% 1.6%
Marks & Spencer UNDERPERFORM MKS.L GBp 531.5 500.0 -6% 15.5x 15.2x 18.8x 18.3x 7.7x 7.6x 7.5% 7.7% 3.5% 3.5%
Next NEUTRAL NXT.L GBp 7665.0 7450.0 -3% 18.0x 17.3x 18.2x 17.5x 12.7x 12.2x 5.6% 5.9% 2.0% 2.1%
OVS Spa NEUTRAL OVS.MI EUR 6.0 5.0 -16% 22.1x 19.6x 18.2x 17.5x 10.3x 9.6x 2.4% 5.8% 0.9% 1.5%
XXL ASA NEUTRAL XXLA.OL NOK 89.8 81.0 -10% 26.2x 20.3x 18.2x 17.5x 17.9x 14.2x 2.1% 3.3% 2.5% 3.0%
Average 23.7x 21.3x 21.6x 20.3x 13.8x 12.5x 4.0% 5.0% 2.2% 2.5%
US
Francesca's Not Covered FRAN.OQ USD 12.4 14.8x 13.0x 1.4x 1.5x 6.6x 5.8x
Ralph Lauren OUTPERFORM RL.N USD 130.3 146.0 12% 18.1x 17.1x 16.1x 15.8x 8.4x 8.2x 4.6% 4.8% 1.5% 1.7%
The Gap, Inc. UNDERPERFORM GPS.N USD 36.9 35.0 -5% 13.3x 12.5x 13.7x 13.1x 6.5x 6.2x 12.5% 12.3% 2.5% 2.5%
Abercrombie & Fitch Co. UNDERPERFORM ANF.N USD 21.0 15.0 -28% 24.2x 25.0x 18.4x 18.5x 3.8x 3.9x 17.9% 7.1% 4.7% 5.2%
Amer Eagle Out Not Covered AEO.N USD 18.0 19.2x 17.1x 1.3x 1.4x 7.0x 6.5x
Phillips-Van Heusen OUTPERFORM PVH.N USD 114.3 131.0 15% 16.4x 15.4x 18.6x 17.3x 11.4x 10.7x 5.9% 6.2% 0.2% 0.3%
Average 17.6x 16.7x 11.6x 11.3x 7.3x 6.9x 10.2% 7.6% 2.2% 2.4%
Asia
Fast Retailing NEUTRAL 9983.T JPY 58790.0 45000.0 -23% 43.3x 42.2x 40.9x 37.2x 23.3x 22.1x 2.0% 1.8% 0.8% 0.8%
PE EV/EBITDA FCF YieldEV/NOPAT Dividend Yield

IDEAS ENGINE 11
South African Apparel Retail
Figure 8: Global apparel growth and margin comparison
Source: Company data, Credit Suisse estimates, IBES estimates for Not Covered stocks indicated with *
FY1e FY2e FY3e 3yr CAGR FY1e FY2e FY3e 3yr CAGR FY1e FY2e FY3e 3yr CAGR FY1e FY2e FY3e 3yr CAGRLast
ActualFY1e FY2e FY3e
South Africa
Mr Price Group Limited 14.7% 15.1% 15.0% 14.9% 20.5% 18.3% 19.2% 19.4% 20.5% 18.6% 19.0% 19.4% 16.7% 17.2% 18.4% 17.4% 17.8% 18.7% 19.3% 20.0%
The Foschini Group 28.2% 10.8% 10.9% 16.4% 37.1% 11.4% 11.3% 19.3% 20.0% 11.3% 11.1% 14.1% 14.7% 11.8% 12.3% 12.9% 17.3% 16.2% 16.3% 16.3%
Truworths International Limited 8.2% 10.7% 8.9% 9.3% 4.1% 8.5% 6.1% 6.2% 3.2% 8.0% 5.5% 5.5% 3.8% 8.8% 6.5% 6.3% 31.0% 29.6% 28.8% 27.9%
Woolworths Holdings Limited 54.9% 8.5% 9.6% 22.6% 51.3% 15.3% 14.9% 26.1% 45.6% 15.7% 15.8% 24.9% 5.1% 17.6% 19.9% 14.0% 10.7% 10.0% 10.7% 11.3%
Latam
Marisa S.A. 9.1% 8.4% 8.4% 8.7% 31.7% 16.1% 11.1% 19.3% 42.7% 22.0% 35.7% 33.2% 61.3% 47.6% 48.6% 52.4% 6.7% 8.7% 9.8% 12.3%
Arezzo Industria e Comercio SA 11.3% 9.6% 9.8% 10.2% 15.7% 14.7% 16.1% 15.5% 17.7% 14.0% 15.6% 15.7% 15.0% 15.0% 21.5% 17.1% 15.4% 16.2% 16.9% 17.8%
Restoque Comércio e Confecções de
Roupas S.A. 12.1% 8.1% 8.1% 9.4% 12.2% 10.8% 12.0% 11.7% 17.8% 14.3% 16.5% 16.2% 317.6% 59.7% 29.6% 105.2% 10.8% 11.3% 12.0% 12.9%
Lojas Renner S.A. 13.5% 13.5% 10.8% 12.6% 14.6% 19.0% 18.2% 17.3% 12.7% 18.6% 24.0% 18.3% 21.1% 20.7% 30.2% 23.9% 15.4% 15.3% 16.0% 17.9%
GRUPO SANBORNS, S.A.B. DE CV 7.9% 9.0% 9.1% 8.7% 11.2% 12.7% 12.7% 12.2% 8.7% 13.0% 13.0% 11.6% 9.6% 12.9% 13.7% 12.0% 10.7% 10.8% 11.2% 11.6%
El Puerto de Liverpool, S.A.B. de C.V. 10.9% 12.5% 12.5% 12.0% 10.6% 16.7% 14.4% 13.9% 10.8% 17.7% 15.0% 14.4% 11.0% 17.8% 15.6% 14.8% 13.7% 13.7% 14.3% 14.6%
S.A.C.I. FALABELLA 9.3% 9.4% 9.3% 9.3% 9.0% 11.4% 11.0% 10.5% 9.9% 11.6% 11.3% 11.0% 14.7% 11.0% 11.7% 12.4% 10.7% 10.8% 11.0% 11.2%
Europe
Hennes & Mauritz 20.5% 11.3% 9.7% 13.7% 9.8% 7.9% 15.1% 10.9% 7.4% 7.7% 16.0% 10.3% 7.5% 7.7% 16.0% 10.3% 16.9% 15.1% 14.6% 15.4%
Inditex 12.7% 8.7% 8.2% 9.9% 13.5% 9.5% 8.8% 10.6% 14.2% 10.0% 9.5% 11.2% 13.3% 10.0% 9.5% 10.9% 17.7% 17.9% 18.1% 18.3%
Marks & Spencer 2.9% 3.0% 1.7% 2.5% 5.5% 0.6% 1.9% 2.6% 5.5% 1.1% 3.2% 3.3% 5.9% 0.2% 5.0% 3.7% 7.4% 7.6% 7.4% 7.6%
Next 6.2% 4.1% 3.7% 4.7% 4.5% 3.7% 3.0% 3.7% 4.8% 3.9% 3.1% 3.9% 2.1% 4.1% 3.3% 3.2% 20.3% 20.0% 20.0% 19.9%
OVS Spa 6.3% 7.2% 7.1% 6.9% 6.4% 3.5% 19.8% 9.7% 8.6% 3.7% 29.2% 13.3% 220.3% 6.4% 29.5% 64.0% 7.7% 7.8% 7.6% 9.2%
XXL ASA 25.9% 18.6% 18.0% 20.8% 17.0% 26.9% 22.2% 22.0% 17.0% 27.8% 22.8% 22.4% 52.3% 28.9% 22.9% 34.1% 10.7% 9.9% 10.7% 11.1%
US
Francesca's * 10.9% 11.4% 11.7% 11.3% -18.1% 4.6% 10.2% -1.9% -24.5% 1.7% 13.1% -4.6% -21.0% 1.6% 14.9% -2.6% 22.4% 15.2% 13.9% 14.1%
Ralph Lauren 0.4% 4.5% 5.8% 3.6% -9.3% 7.3% 9.2% 2.0% -14.3% 8.0% 10.7% 0.8% -11.1% 11.4% 13.6% 4.0% 13.6% 11.6% 12.0% 12.5%
The Gap, Inc. -0.4% 3.9% 5.6% 3.0% -3.4% 5.6% 5.6% 2.5% -6.0% 6.1% 5.7% 1.8% 1.1% 6.8% 6.4% 4.7% 12.4% 11.7% 12.0% 12.0%
Abercrombie & Fitch Co. -0.5% -0.5% -0.5% -0.5% -2.6% -2.7% -2.7% -2.6% -4.7% -5.0% -5.0% -4.9% -5.2% -5.5% -5.6% -5.5% 4.2% 4.0% 3.8% 3.6%
Amer Eagle Out * -0.7% 5.4% 1.9% 2.2% -1.6% 30.1% 8.3% 11.5% -11.4% 47.7% 12.0% 13.6% -14.9% 53.7% 9.5% 12.7% 7.1% 6.3% 8.8% 9.7%
Phillips-Van Heusen -3.5% 3.4% 4.4% 1.3% -5.2% 4.1% 6.8% 1.8% -6.7% 4.9% 8.3% 2.0% -4.9% 7.7% 12.2% 4.7% 11.2% 10.8% 11.0% 11.4%
Asia
Fast Retailing 19.7% 15.0% 9.9% 14.8% 51.3% 3.6% 4.4% 17.9% 60.3% 3.3% 4.2% 19.9% 85.5% 0.1% 7.9% 26.1% 9.4% 12.6% 11.3% 10.8%
EBIT marginSales growth EBITDA growth EBIT growth EPS growth

IDEAS ENGINE 12
South African Apparel Retail
Companies Mentioned (Price as of 20-Jul-2015)
Abercrombie & Fitch Co. (ANF.N, $21.54) Amer Eagle Out (AEO.N, $18.01) American Apparel (APP.A, $0.3) Arezzo Industria e Comercio SA (ARZZ3.SA, R$22.55) Associated British Foods (ABF.L, 3202.0p) CIA Hering S.A. (HGTX3.SA, R$12.2) El Puerto de Liverpool, S.A.B. de C.V. (LIVEPOLC1.MX, MXN193.02) Etam Develop (TAM.PA, €53.0) Fast Retailing (9983.T, ¥57,220) Francesca's (FRAN.OQ, $12.52) GRUPO SANBORNS, S.A.B. DE CV (GSNBRB1.MX, MXN25.03) Hennes & Mauritz (HMb.ST, Skr341.8) Inditex (ITX.MC, €31.14) Lojas Renner S.A. (LREN3.SA, R$112.4) Marisa S.A. (AMAR3.SA, R$9.02) Marks & Spencer (MKS.L, 534.0p) Mr Price Group Limited (MPCJ.J, R257.33, OUTPERFORM, TP R283.0) Next (NXT.L, 7640.0p) OVS Spa (OVS.MI, €5.91) Phillips-Van Heusen (PVH.N, $114.43) Ralph Lauren (RL.N, $130.51) Restoque Comércio e Confecções de Roupas S.A. (LLIS3.SA, R$5.75) S.A.C.I. FALABELLA (FAL.SN, CLP$4400.0) The Foschini Group (TFGJ.J, R155.0, NEUTRAL, TP R150.0) The Gap, Inc. (GPS.N, $37.61) Tom Tailor Hldg (TTIGn.DE, €9.679) Truworths International Limited (TRUJ.J, R88.2, UNDERPERFORM, TP R65.0) Woolworths Holdings Limited (WHLJ.J, R98.6, NEUTRAL, TP R94.0) XXL ASA (XXLA.OL, Nkr90.25)
Disclosure Appendix
Important Global Disclosures
The analysts identified in this report each certify, with respect to the companies or securities that the individual analyzes, that (1) the views expressed in this report accurately reflect his or her personal views about all of the subject companies and securities and (2) no part of his or her compensation was, is or will be directly or indirectly related to the specific recommendations or views expressed in this report.
3-Year Price and Rating History for Mr Price Group Limited (MPCJ.J)
MPCJ.J Closing Price Target Price
Date (R) (R) Rating
13-Aug-12 129.29 116.00 N
04-Dec-12 132.80 136.00
20-Feb-13 121.00 NR
28-Aug-13 119.98 129.00 N *
29-Nov-13 155.00 147.50
02-Jun-14 169.20 165.00
19-Nov-14 238.84 235.00
23-Feb-15 265.00 259.00
11-Jun-15 244.50 272.00 O
* Asterisk signifies initiation or assumption of coverage.
N EU T RA L
N O T RA T ED
O U T PERFO RM

IDEAS ENGINE 13
South African Apparel Retail
3-Year Price and Rating History for The Foschini Group (TFGJ.J)
TFGJ.J Closing Price Target Price
Date (R) (R) Rating
13-Aug-12 139.90 154.00 O
04-Dec-12 132.60 158.00
20-Feb-13 114.60 NR
28-Aug-13 95.31 88.50 U *
29-Nov-13 101.50 90.50
03-Jun-14 108.10 105.00 N
12-Nov-14 132.00 145.00 O
23-Feb-15 171.00 162.00 N
01-Jun-15 157.00 165.00
* Asterisk signifies initiation or assumption of coverage.
O U T PERFO RM
N O T RA T ED
U N D ERPERFO RM
N EU T RA L
3-Year Price and Rating History for Truworths International Limited (TRUJ.J)
TRUJ.J Closing Price Target Price
Date (R) (R) Rating
13-Aug-12 104.00 102.00 N
04-Dec-12 97.99 109.00
20-Feb-13 99.80 NR
28-Aug-13 80.00 96.50 O *
29-Nov-13 81.01 92.50
25-Feb-14 69.95 84.00
12-Nov-14 68.86 73.00 N
23-Feb-15 94.35 78.00
* Asterisk signifies initiation or assumption of coverage. N EU T RA L
N O T RA T ED
O U T PERFO RM

IDEAS ENGINE 14
South African Apparel Retail
3-Year Price and Rating History for Woolworths Holdings Limited (WHLJ.J)
WHLJ.J Closing Price Target Price
Date (R) (R) Rating
01-Aug-12 50.94 57.13 O
03-Sep-12 57.79 63.79
04-Dec-12 67.60 69.03 N
20-Feb-13 63.02 NR
28-Aug-13 56.98 72.36 O *
28-Nov-13 70.42 NR
02-Dec-13 70.16 83.31 O *
20-Feb-14 59.03 76.17
18-Jul-14 78.08 80.00 N
03-Sep-14 76.58 81.00
16-Feb-15 92.25 85.00
23-Feb-15 94.00 86.00
* Asterisk signifies initiation or assumption of coverage.
O U T PERFO RM
N EU T RA L
N O T RA T ED
The analyst(s) responsible for preparing this research report received Compensation that is based upon various factors including Credit Suisse's total revenues, a portion of which are generated by Credit Suisse's investment banking activities
As of December 10, 2012 Analysts’ stock rating are defined as follows:
Outperform (O) : The stock’s total return is expected to outperform the relevant benchmark*over the next 12 months.
Neutral (N) : The stock’s total return is expected to be in line with the relevant benchmark* over the next 12 months.
Underperform (U) : The stock’s total return is expected to underperform the relevant benchmark* over the next 12 months.
*Relevant benchmark by region: As of 10th December 2012, Japanese ratings are based on a stock’s total return relative to the analyst's coverage universe which consists of all companies covered by the analyst within the relevant sector, with Outperforms representing the most attractive, Neutrals the less attractive, and Underperforms the least attractive investment opportunities. As of 2nd October 2012, U.S. and Canadian as well as European ratings are based on a stock’s total return relative to the analyst's coverage universe which consists of all companies covered by the analyst within the relevant sector , with Outperforms representing the most attractive, Neutrals the less attractive, and Underperforms the least attractive investment opportunities. For Latin American and non-Japan Asia stocks, ratings are based on a stock’s total return relative to the average total return of the relevant country o r regional benchmark; prior to 2nd October 2012 U.S. and Canadian ratings were based on (1) a stock’s absolute total return potential to its current share price and (2) the relative attractiveness of a stock’s total return potential within an analyst’s coverage universe. For Australian and New Zealand s tocks, the expected total return (ETR) calculation includes 12-month rolling dividend yield. An Outperform rating is assigned where an ETR is greater than or equal to 7.5%; Underperform wh ere an ETR less than or equal to 5%. A Neutral may be assigned where the ETR is between -5% and 15%. The overlapping rating range allows analysts to assign a rating that puts ETR in the context of associated risks. Prior to 18 May 2015, ETR ranges for Outperform and Underperform ratings did not overlap with Neutral thresholds between 15% and 7.5%, which was in operation from 7 July 2011.
Restricted (R) : In certain circumstances, Credit Suisse policy and/or applicable law and regulations preclude certain types of communications, including an investment recommendation, during the course of Credit Suisse's engagement in an investment banking transaction and in certain other circumstances.
Volatility Indicator [V] : A stock is defined as volatile if the stock price has moved up or down by 20% or more in a month in at least 8 of the past 24 months or the analyst expects significant volatility going forward.
Analysts’ sector weightings are distinct from analysts’ stock ratings and are based on the analyst’s expectations for the fundamentals and/or valuation of the sector* relative to the group’s historic fundamentals and/or valuation:
Overweight : The analyst’s expectation for the sector’s fundamentals and/or valuation is favorable over the next 12 months.
Market Weight : The analyst’s expectation for the sector’s fundamentals and/or valuation is neutral over the next 12 months.
Underweight : The analyst’s expectation for the sector’s fundamentals and/or valuation is cautious over the next 12 months.
*An analyst’s coverage sector consists of all companies covered by the analyst within the relevant sector. An analyst may cover multiple sectors.

IDEAS ENGINE 15
South African Apparel Retail
Credit Suisse's distribution of stock ratings (and banking clients) is:
Global Ratings Distribution
Rating Versus universe (%) Of which banking clients (%)
Outperform/Buy* 48% (25% banking clients)
Neutral/Hold* 36% (44% banking clients)
Underperform/Sell* 13% (38% banking clients)
Restricted 3%
*For purposes of the NYSE and NASD ratings distribution disclosure requirements, our stock ratings of Outperform, Neutral, an d Underperform most closely correspond to Buy, Hold, and Sell, respectively; however, the meanings are not the same, as our stock ratings are determined on a relative basis. (Please refer to definitions above.) An investor's decision to buy o r sell a security should be based on investment objectives, current holdings, and other individual factors.
Credit Suisse’s policy is to update research reports as it deems appropriate, based on developments with the subject company, the sector or the market that may have a material impact on the research views or opinions stated herein.
Credit Suisse's policy is only to publish investment research that is impartial, independent, clear, fair and not misleading. For more detail please refer to Credit Suisse's Policies for Managing Conflicts of Interest in connection with Investment Research: http://www.csfb.com/research-and-analytics/disclaimer/managing_conflicts_disclaimer.html
Credit Suisse does not provide any tax advice. Any statement herein regarding any US federal tax is not intended or written to be used, and cannot be used, by any taxpayer for the purposes of avoiding any penalties.
Price Target: (12 months) for Mr Price Group Limited (MPCJ.J)
Method: Owing to the stable cash flow growth of the retail industry, we believe it is appropriate to value it using the discounted cash flow (DCF) methodology. We forecast explicit cash flows for five years, after
which the growth rate free cash flow return in invested capital is faded to the final year growth rate and WACC respectively over the competitive advantage period (CAP). Our DCF fair value is adjusted by the WACC to determine our 12-month target price of R283. For Mr Price, we use a 12.02% WACC, 23-year CAP and a final year growth rate of 7.5%.
Risk: Risks to our target price include: (i) Cotton price volatility in (ii) Competition from foreign entrants with similar value proposition; (iii) Brand perception; (iv) Chinese supply chain pressures; and (v) Rand exchange
rate weakness / volatility.
Price Target: (12 months) for The Foschini Group (TFGJ.J)
Method: Owing to the stable cash flow growth of the retail industry, we believe it is appropriate to value it using the discounted cash flow (DCF) methodology. We forecast explicit cash flows for five years, after
which the growth rate free cash flow return in invested capital is faded to the final year growth rate and WACC respectively over the competitive advantage period (CAP). Our DCF fair value is adjusted by the WACC to determine our 12-month target price of R150. For TFG, we use a 12.1% WACC, 11-year CAP and a final year growth rate of 6%.
Risk: Risks to our target price include: (i) bad debts (ii) exposure to credit sales (iii) Competition from foreign entrants (iv) imported inflation on the back of currency fluctuations (v) fashion trends
Price Target: (12 months) for Truworths International Limited (TRUJ.J)
Method: Owing to the stable cash flow growth of the retail industry, we believe it is appropriate to value it using the discounted cash flow (DCF) methodology. We forecast explicit cash flows for five years, after
which the growth rate free cash flow return in invested capital is faded to the final year growth rate and WACC respectively over the competitive advantage period (CAP). Our DCF fair value is adjusted by the WACC to determine our 12-month target price of R65. For Truworths, we use a 13.25% WACC, 10-year CAP and a final year growth rate of 6%.
Risk: Risks to our target price include: (i) bad debts (ii) high exposure to credit sales (iii) competition from foreign entrants (iv) imported inflation on the back of currency fluctuations (v) new management strategy (vi)
excess cash on balance sheet (vii) fashion trends

IDEAS ENGINE 16
South African Apparel Retail
Price Target: (12 months) for Woolworths Holdings Limited (WHLJ.J)
Method: Owing to the stable cash flow growth of the retail industry, we believe it is appropriate to value it using the discounted cash flow (DCF) methodology. We forecast explicit cash flows for five years, after
which the growth rate free cash flow return in invested capital is faded to the final year growth rate and WACC respectively over the competitive advantage period (CAP). Our DCF fair value is adjusted by the WACC to determine our 12-month target price of R94. For Woolworths, we use a 12.25% WACC, 15-year CAP and a final year growth rate of 5%.
Risk: Risks include (i) execution risk in Australia, (ii) significant currency movements, (iii) poor fashion calls, (iv) increased competition from foreign entrants, (v) weak macro economic environment.
Please refer to the firm's disclosure website at https://rave.credit-suisse.com/disclosures for the definitions of abbreviations typically used in the target price method and risk sections.
See the Companies Mentioned section for full company names
The subject company (ABF.L, GSNBRB1.MX, LIVEPOLC1.MX) currently is, or was during the 12-month period preceding the date of distribution of this report, a client of Credit Suisse.
Credit Suisse provided investment banking services to the subject company (ABF.L) within the past 12 months.
Credit Suisse has received investment banking related compensation from the subject company (ABF.L) within the past 12 months
Credit Suisse expects to receive or intends to seek investment banking related compensation from the subject company (ABF.L, 9983.T, ANF.N, GPS.N, GSNBRB1.MX, MKS.L, FAL.SN) within the next 3 months.
As of the date of this report, Credit Suisse makes a market in the following subject companies (ANF.N, GPS.N, PVH.N, RL.N).
As of the end of the preceding month, Credit Suisse beneficially own 1% or more of a class of common equity securities of (OVS.MI).
For other important disclosures concerning companies featured in this report, including price charts, please visit the website at https://rave.credit-suisse.com/disclosures or call +1 (877) 291-2683.
Important Regional Disclosures
Singapore recipients should contact Credit Suisse AG, Singapore Branch for any matters arising from this research report.
The analyst(s) involved in the preparation of this report have not visited the material operations of the subject company (MPCJ.J, TFGJ.J, TRUJ.J, WHLJ.J, HMb.ST, ITX.MC, ABF.L, 9983.T, AMAR3.SA, ANF.N, ARZZ3.SA, GPS.N, GSNBRB1.MX, HGTX3.SA, LIVEPOLC1.MX, LLIS3.SA, LREN3.SA, MKS.L, NXT.L, OVS.MI, PVH.N, RL.N, FAL.SN) within the past 12 months
Restrictions on certain Canadian securities are indicated by the following abbreviations: NVS--Non-Voting shares; RVS--Restricted Voting Shares; SVS--Subordinate Voting Shares.
Individuals receiving this report from a Canadian investment dealer that is not affiliated with Credit Suisse should be advised that this report may not contain regulatory disclosures the non-affiliated Canadian investment dealer would be required to make if this were its own report.
For Credit Suisse Securities (Canada), Inc.'s policies and procedures regarding the dissemination of equity research, please visit https://www.credit-suisse.com/sites/disclaimers-ib/en/canada-research-policy.html.
Credit Suisse Securities (Europe) Limited (Credit Suisse) acts as broker to (ABF.L).
The following disclosed European company/ies have estimates that comply with IFRS: (HMb.ST, ITX.MC, ABF.L, MKS.L, NXT.L).
Credit Suisse has acted as lead manager or syndicate member in a public offering of securities for the subject company (GSNBRB1.MX, PVH.N) within the past 3 years.
As of the date of this report, Credit Suisse acts as a market maker or liquidity provider in the equities securities that are the subject of this report.
Principal is not guaranteed in the case of equities because equity prices are variable.
Commission is the commission rate or the amount agreed with a customer when setting up an account or at any time after that.
To the extent this is a report authored in whole or in part by a non-U.S. analyst and is made available in the U.S., the following are important disclosures regarding any non-U.S. analyst contributors: The non-U.S. research analysts listed below (if any) are not registered/qualified as research analysts with FINRA. The non-U.S. research analysts listed below may not be associated persons of CSSU and therefore may not be subject to the NASD Rule 2711 and NYSE Rule 472 restrictions on communications with a subject company, public appearances and trading securities held by a research analyst account.
Credit Suisse Securities Johannesburg (PTY) Ltd ................................................................................................. Pieter Vorster ; Rishay Dhanraj

IDEAS ENGINE 17
South African Apparel Retail
Important Credit Suisse HOLT Disclosures
With respect to the analysis in this report based on the Credit Suisse HOLT methodology, Credit Suisse certifies that (1) the views expressed in this report accurately reflect the Credit Suisse HOLT methodology and (2) no part of the Firm’s compensation was, is, or will be directly related to the specific views disclosed in this report.
The Credit Suisse HOLT methodology does not assign ratings to a security. It is an analytical tool that involves use of a set of proprietary quantitative algorithms and warranted value calculations, collectively called the Credit Suisse HOLT valuation model, that are consistently applied to all the companies included in its database. Third-party data (including consensus earnings estimates) are systematically translated into a number of default algorithms available in the Credit Suisse HOLT valuation model. The source financial statement, pricing, and earnings data provided by outside data vendors are subject to quality control and may also be adjusted to more closely measure the underlying economics of firm performance. The adjustments provide consistency when analyzing a single company across time, or analyzing multiple companies across industries or national borders. The default scenario that is produced by the Credit Suisse HOLT valuation model establishes the baseline valuation for a security, and a user then may adjust the default variables to produce alternative scenarios, any of which could occur.
Additional information about the Credit Suisse HOLT methodology is available on request.
The Credit Suisse HOLT methodology does not assign a price target to a security. The default scenario that is produced by the Credit Suisse HOLT valuation model establishes a warranted price for a security, and as the third-party data are updated, the warranted price may also change. The default variable may also be adjusted to produce alternative warranted prices, any of which could occur.
CFROI®, HOLT, HOLTfolio, ValueSearch, AggreGator, Signal Flag and “Powered by HOLT” are trademarks or service marks or registered trademarks or registered service marks of Credit Suisse or its affiliates in the United States and other countries. HOLT is a corporate performance and valuation advisory service of Credit Suisse.
For Credit Suisse disclosure information on other companies mentioned in this report, please visit the website at https://rave.credit-suisse.com/disclosures or call +1 (877) 291-2683.

IDEAS ENGINE 21
South African Apparel Retail
References in this report to Credit Suisse include all of the subsidiaries and affiliates of Credit Suisse operating under its investment banking division. For more information on our structure, please use the following link: https://www.credit-suisse.com/who-we-are This report may contain material that is not directed to, or intended for distribution to or use by, any person or entity who is a citizen or resident of or located in any locality, state, country or other jurisdiction where such distribution, publication, availability or use would be contrary to law or regulation or which would subject Credit Suisse AG or its affiliates ("CS") to any registration or licensing requirement within such jurisdiction. All material presented in this report, unless specifically indicated otherwise, is under copyright to CS. None of the material, nor its content, nor any copy of it, may be altered in any way, transmitted to, copied or distributed to any other party, without the prior express written permission of CS. All trademarks, service marks and logos used in this report are trademarks or service marks or registered trademarks or service marks of CS or its affiliates. The information, tools and material presented in this report are provided to you for information purposes only and are not to be used or considered as an offer or the solicitation of an offer to sell or to buy or subscribe for securities or other financial instruments. CS may not have taken any steps to ensure that the securities referred to in this report are suitable for any particular investor. CS will not treat recipients of this report as its customers by virtue of their receiving this report. The investments and services contained or referred to in this report may not be suitable for you and it is recommended that you consult an independent investment advisor if you are in doubt about such investments or investment services. Nothing in this report constitutes investment, legal, accounting or tax advice, or a representation that any investment or strategy is suitable or appropriate to your individual circumstances, or otherwise constitutes a personal recommendation to you. CS does not advise on the tax consequences of investments and you are advised to contact an independent tax adviser. Please note in particular that the bases and levels of taxation may change. Information and opinions presented in this report have been obtained or derived from sources believed by CS to be reliable, but CS makes no representation as to their accuracy or completeness. CS accepts no liability for loss arising from the use of the material presented in this report, except that this exclusion of liability does not apply to the extent that such liability arises under specific statutes or regulations applicable to CS. This report is not to be relied upon in substitution for the exercise of independent judgment. CS may have issued, and may in the future issue, other communications that are inconsistent with, and reach different conclusions from, the information presented in this report. Those communications reflect the different assumptions, views and analytical methods of the analysts who prepared them and CS is under no obligation to ensure that such other communications are brought to the attention of any recipient of this report. Some investments referred to in this report will be offered solely by a single entity and in the case of some investments solely by CS, or an associate of CS or CS may be the only market maker in such investments. Past performance should not be taken as an indication or guarantee of future performance, and no representation or warranty, express or implied, is made regarding future performance. Information, opinions and estimates contained in this report reflect a judgment at its original date of publication by CS and are subject to change without notice. The price, value of and income from any of the securities or financial instruments mentioned in this report can fall as well as rise. The value of securities and financial instruments is subject to exchange rate fluctuation that may have a positive or adverse effect on the price or income of such securities or financial instruments. Investors in securities such as ADR's, the values of which are influenced by currency volatility, effectively assume this risk. Structured securities are complex instruments, typically involve a high degree of risk and are intended for sale only to sophisticated investors who are capable of understanding and assuming the risks involved. The market value of any structured security may be affected by changes in economic, financial and political factors (including, but not limited to, spot and forward interest and exchange rates), time to maturity, market conditions and volatility, and the credit quality of any issuer or reference issuer. Any investor interested in purchasing a structured product should conduct their own investigation and analysis of the product and consult with their own professional advisers as to the risks involved in making such a purchase. Some investments discussed in this report may have a high level of volatility. High volatility investments may experience sudden and large falls in their value causing losses when that investment is realised. Those losses may equal your original investment. Indeed, in the case of some investments the potential losses may exceed the amount of initial investment and, in such circumstances, you may be required to pay more money to support those losses. Income yields from investments may fluctuate and, in consequence, initial capital paid to make the investment may be used as part of that income yield. Some investments may not be readily realisable and it may be difficult to sell or realise those investments, similarly it may prove difficult for you to obtain reliable information about the value, or risks, to which such an investment is exposed. This report may provide the addresses of, or contain hyperlinks to, websites. Except to the extent to which the report refers to website material of CS, CS has not reviewed any such site and takes no responsibility for the content contained therein. Such address or hyperlink (including addresses or hyperlinks to CS's own website material) is provided solely for your convenience and information and the content of any such website does not in any way form part of this document. Accessing such website or following such link through this report or CS's website shall be at your own risk. This report is issued and distributed in Europe (except Switzerland) by Credit Suisse Securities (Europe) Limited, One Cabot Square, London E14 4QJ, England, which is authorised by the Prudential Regulation Authority and regulated by the Financial Conduct Authority and the Prudential Regulation Authority. This report is being distributed in Germany by Credit Suisse Securities (Europe) Limited Niederlassung Frankfurt am Main regulated by the Bundesanstalt fuer Finanzdienstleistungsaufsicht ("BaFin"). This report is being distributed in the United States and Canada by Credit Suisse Securities (USA) LLC; in Switzerland by Credit Suisse AG; in Brazil by Banco de Investimentos Credit Suisse (Brasil) S.A or its affiliates; in Mexico by Banco Credit Suisse (México), S.A. (transactions related to the securities mentioned in this report will only be effected in compliance with applicable regulation); in Japan by Credit Suisse Securities (Japan) Limited, Financial Instruments Firm, Director-General of Kanto Local Finance Bureau (Kinsho) No. 66, a member of Japan Securities Dealers Association, The Financial Futures Association of Japan, Japan Investment Advisers Association, Type II Financial Instruments Firms Association; elsewhere in Asia/ Pacific by whichever of the following is the appropriately authorised entity in the relevant jurisdiction: Credit Suisse (Hong Kong) Limited, Credit Suisse Equities (Australia) Limited, Credit Suisse Securities (Thailand) Limited, regulated by the Office of the Securities and Exchange Commission, Thailand, having registered address at 990 Abdulrahim Place, 27th Floor, Unit 2701, Rama IV Road, Silom, Bangrak, Bangkok 10500, Thailand, Tel. +66 2614 6000, Credit Suisse Securities (Malaysia) Sdn Bhd, Credit Suisse AG, Singapore Branch, Credit Suisse Securities (India) Private Limited (CIN no. U67120MH1996PTC104392) regulated by the Securities and Exchange Board of India (registration Nos. INB230970637; INF230970637; INB010970631; INF010970631), having registered address at 9th Floor, Ceejay House, Dr.A.B. Road, Worli, Mumbai - 18, India, T- +91-22 6777 3777, Credit Suisse Securities (Europe) Limited, Seoul Branch, Credit Suisse AG, Taipei Securities Branch, PT Credit Suisse Securities Indonesia, Credit Suisse Securities (Philippines ) Inc., and elsewhere in the world by the relevant authorised affiliate of the above. Research on Taiwanese securities produced by Credit Suisse AG, Taipei Securities Branch has been prepared by a registered Senior Business Person. Research provided to residents of Malaysia is authorised by the Head of Research for Credit Suisse Securities (Malaysia) Sdn Bhd, to whom they should direct any queries on +603 2723 2020. This report has been prepared and issued for distribution in Singapore to institutional investors, accredited investors and expert investors (each as defined under the Financial Advisers Regulations) only, and is also distributed by Credit Suisse AG, Singapore branch to overseas investors (as defined under the Financial Advisers Regulations). By virtue of your status as an institutional investor, accredited investor, expert investor or overseas investor, Credit Suisse AG, Singapore branch is exempted from complying with certain compliance requirements under the Financial Advisers Act, Chapter 110 of Singapore (the "FAA"), the Financial Advisers Regulations and the relevant Notices and Guidelines issued thereunder, in respect of any financial advisory service which Credit Suisse AG, Singapore branch may provide to you. This information is being distributed by Credit Suisse AG, Dubai Branch, duly licensed and regulated by the Dubai Financial Services Authority (DFSA), and is directed at Professional Clients or Market Counterparties only, as defined by the DFSA. The financial products or financial services to which the information relates will only be made available to a client who meets the regulatory criteria to be a Professional Client or Market Counterparty only, as defined by the DFSA, and is not intended for any other person. This research may not conform to Canadian disclosure requirements. In jurisdictions where CS is not already registered or licensed to trade in securities, transactions will only be effected in accordance with applicable securities legislation, which will vary from jurisdiction to jurisdiction and may require that the trade be made in accordance with applicable exemptions from registration or licensing requirements. Non-U.S. customers wishing to effect a transaction should contact a CS entity in their local jurisdiction unless governing law permits otherwise. U.S. customers wishing to effect a transaction should do so only by contacting a representative at Credit Suisse Securities (USA) LLC in the U.S. Please note that this research was originally prepared and issued by CS for distribution to their market professional and institutional investor customers. Recipients who are not market professional or institutional investor customers of CS should seek the advice of their independent financial advisor prior to taking any investment decision based on this report or for any necessary explanation of its contents. This research may relate to investments or services of a person outside of the UK or to other matters which are not authorised by the Prudential Regulation Authority and regulated by the Financial Conduct Authority and the Prudential Regulation Authority or in respect of which the protections of the Prudential Regulation Authority and Financial Conduct Authority for private customers and/or the UK compensation scheme may not be available, and further details as to where this may be the case are available upon request in respect of this report. CS may provide various services to US municipal entities or obligated persons ("municipalities"), including suggesting individual transactions or trades and entering into such transactions. Any services CS provides to municipalities are not viewed as "advice" within the meaning of Section 975 of the Dodd-Frank Wall Street Reform and Consumer Protection Act. CS is providing any such services and related information solely on an arm's length basis and not as an advisor or fiduciary to the municipality. In connection with the provision of the any such services, there is no agreement, direct or indirect, between any municipality (including the officials, management, employees or agents thereof) and CS for CS to provide advice to the municipality. Municipalities should consult with their financial, accounting and legal advisors regarding any such services provided by CS. In addition, CS is not acting for direct or indirect compensation to solicit the municipality on behalf of an unaffiliated broker, dealer, municipal securities dealer, municipal advisor, or investment adviser for the purpose of obtaining or retaining an engagement by the municipality for or in connection with Municipal Financial Products, the issuance of municipal securities, or of an investment adviser to provide investment advisory services to or on behalf of the municipality. If this report is being distributed by a financial institution other than Credit Suisse AG, or its affiliates, that financial institution is solely responsible for distribution. Clients of that institution should contact that institution to effect a transaction in the securities mentioned in this report or require further information. This report does not constitute investment advice by Credit Suisse to the clients of the distributing financial institution, and neither Credit Suisse AG, its affiliates, and their respective officers, directors and employees accept any liability whatsoever for any direct or consequential loss arising from their use of this report or its content. Principal is not guaranteed. Commission is the commission rate or the amount agreed with a customer when setting up an account or at any time after that.
Copyright © 2015 CREDIT SUISSE AG and/or its affiliates. All rights reserved.
Investment principal on bonds can be eroded depending on sale price or market price. In addition, there are bonds on which investment principal can be eroded due to changes in redemption amounts. Care is required when investing in such instruments. When you purchase non-listed Japanese fixed income securities (Japanese government bonds, Japanese municipal bonds, Japanese government guaranteed bonds, Japanese corporate bonds) from CS as a seller, you will be requested to pay the purchase price only.
XX6623EU.docx