the changing population of texas and west texas counties 10 th annual west texas legislative summit...
TRANSCRIPT
The Changing Population of Texas and West Texas Counties
10th Annual West Texas Legislative Summit
Immigration Issues: Our Future Texas Workforce
August 8, 2013San Angelo, TX
2000Population*
2010Population*
NumericalChange
2000-2010
PercentChange
2000-2010
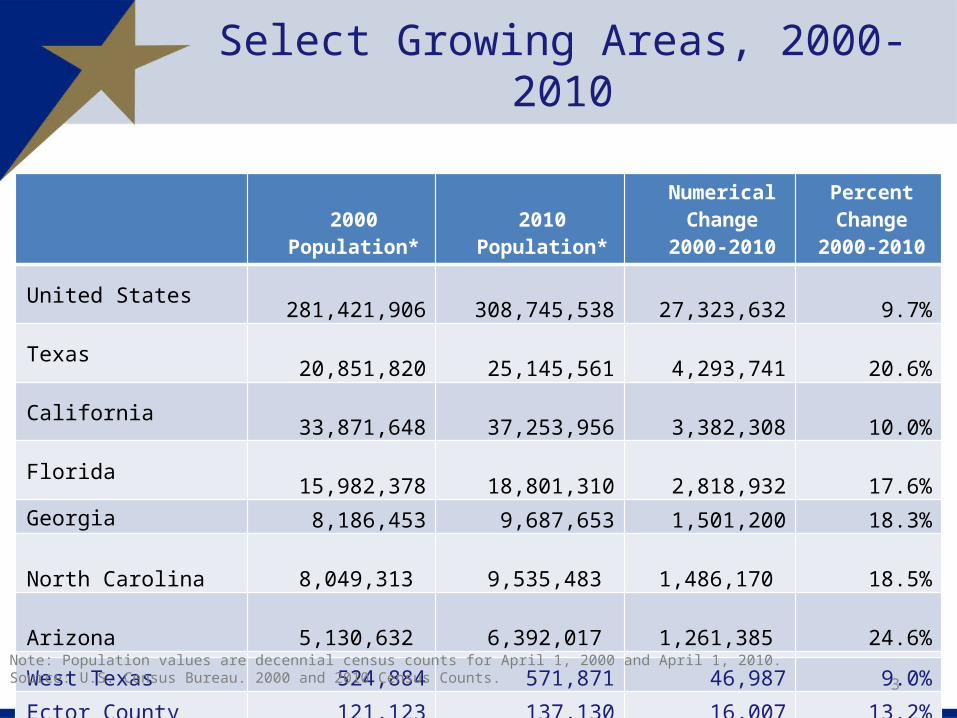
United States 281,421,906 308,745,538 27,323,632 9.7%
Texas 20,851,820 25,145,561 4,293,741 20.6%
California 33,871,648 37,253,956 3,382,308 10.0%
Florida 15,982,378 18,801,310 2,818,932 17.6%
Georgia 8,186,453 9,687,653 1,501,200 18.3%
North Carolina 8,049,313 9,535,483 1,486,170 18.5%
Arizona 5,130,632 6,392,017 1,261,385 24.6%
West Texas 524,884 571,871 46,987 9.0%
Ector County 121,123 137,130 16,007 13.2%
Midland County 116,009 136,872 20,863 18.0%
Tom Green County 104,010 110,224 6,214 6.0%Note: Population values are decennial census counts for April 1, 2000 and April 1, 2010.Source: U.S. Census Bureau. 2000 and 2010 Census Counts.
Select Growing Areas, 2000-2010
3
4
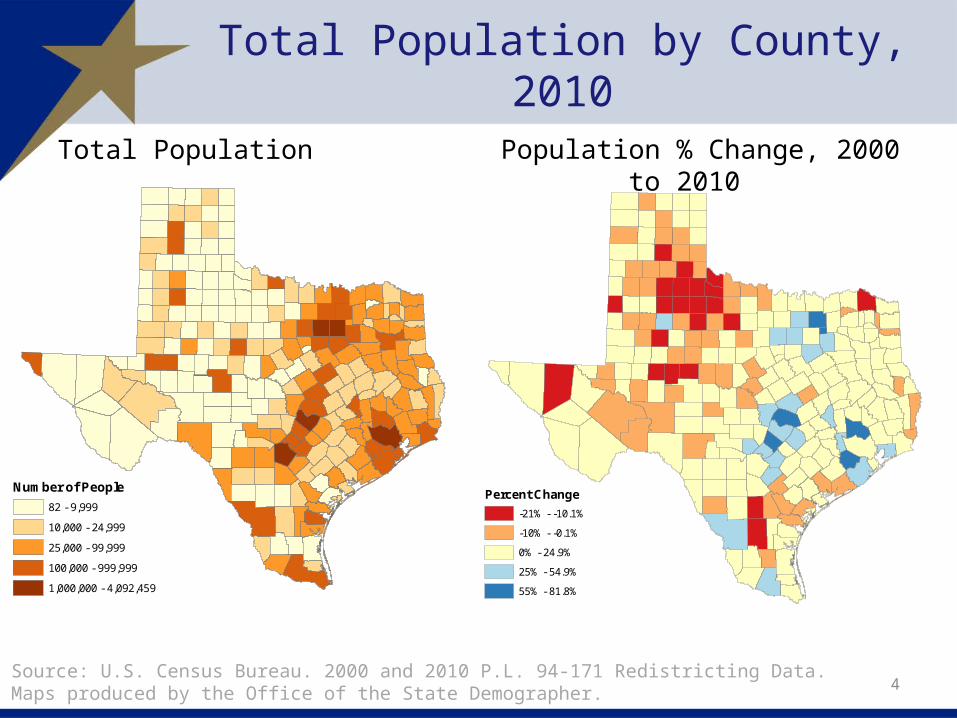
Percent Change
-21% - -10.1%
-10% - -0.1%
0% - 24.9%
25% - 54.9%
55% - 81.8%
Number of People
82 - 9,999
10,000 - 24,999
25,000 - 99,999
100,000 - 999,999
1,000,000 - 4,092,459
Total Population by County, 2010
Total Population Population % Change, 2000 to 2010
Source: U.S. Census Bureau. 2000 and 2010 P.L. 94-171 Redistricting Data.Maps produced by the Office of the State Demographer.
5
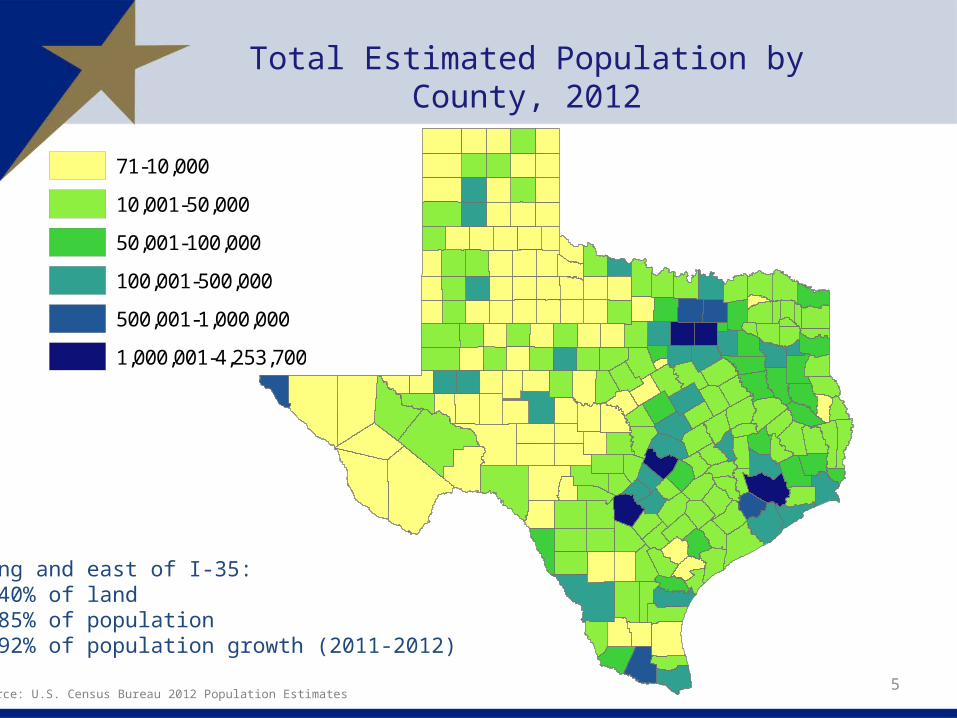
Total Estimated Population by County, 2012
Source: U.S. Census Bureau 2012 Population Estimates
Along and east of I-35: 40% of land 85% of population 92% of population growth (2011-2012)
Legend
POPESTIMATE2012
71-10,000
10,001-50,000
50,001-100,000
100,001-500,000
500,001-1,000,000
1,000,001-4,253,700
6
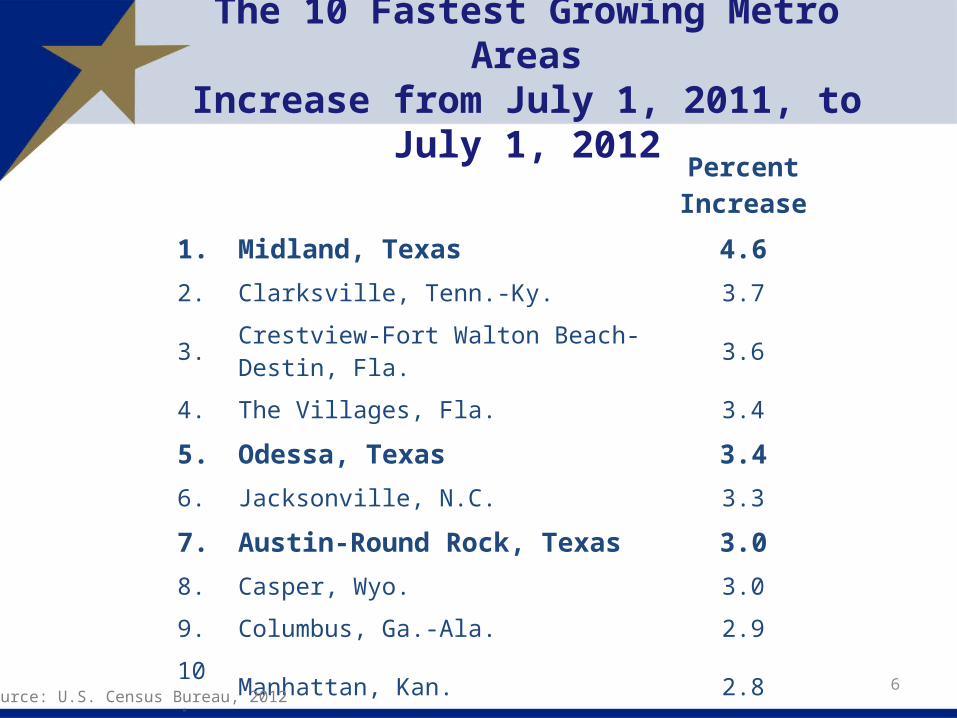
The 10 Fastest Growing Metro AreasIncrease from July 1, 2011, to July 1, 2012
PercentIncrease
1. Midland, Texas 4.62. Clarksville, Tenn.-Ky. 3.7
3. Crestview-Fort Walton Beach-Destin, Fla. 3.6
4. The Villages, Fla. 3.4
5. Odessa, Texas 3.46. Jacksonville, N.C. 3.3
7. Austin-Round Rock, Texas 3.08. Casper, Wyo. 3.0
9. Columbus, Ga.-Ala. 2.9
10. Manhattan, Kan. 2.8
Source: U.S. Census Bureau, 2012
Note: Residual values are not presented in this table.Source: Derived from U.S. Census Bureau Estimates for dates indicated by the Texas State Data Center.
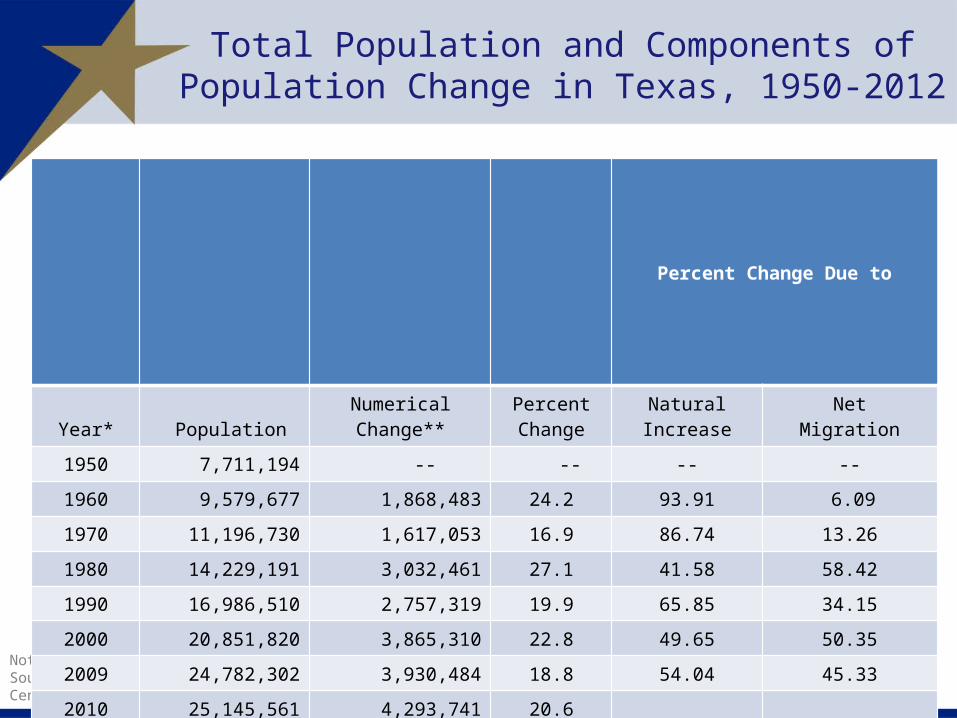
Total Population and Components of Population Change in Texas, 1950-2012
7
Percent Change Due to
Year* PopulationNumericalChange**
PercentChange
NaturalIncrease
NetMigration
1950 7,711,194 -- -- -- --
1960 9,579,677 1,868,483 24.2 93.91 6.09
1970 11,196,730 1,617,053 16.9 86.74 13.26
1980 14,229,191 3,032,461 27.1 41.58 58.42
1990 16,986,510 2,757,319 19.9 65.85 34.15
2000 20,851,820 3,865,310 22.8 49.65 50.35
2009 24,782,302 3,930,484 18.8 54.04 45.33
2010 25,145,561 4,293,741 20.6
2011 25,674,681 529,120 2.1 54.79 44.99
2012 26,102,106 427,425 1.7 50.31 49.27
* All values for the decennial dates are for April 1st of the indicated census year. Values for 2009, 2011, and 2012 are for July 1, as estimated by the U.S. Census Bureau. ** Change is from previous decade/time period
8
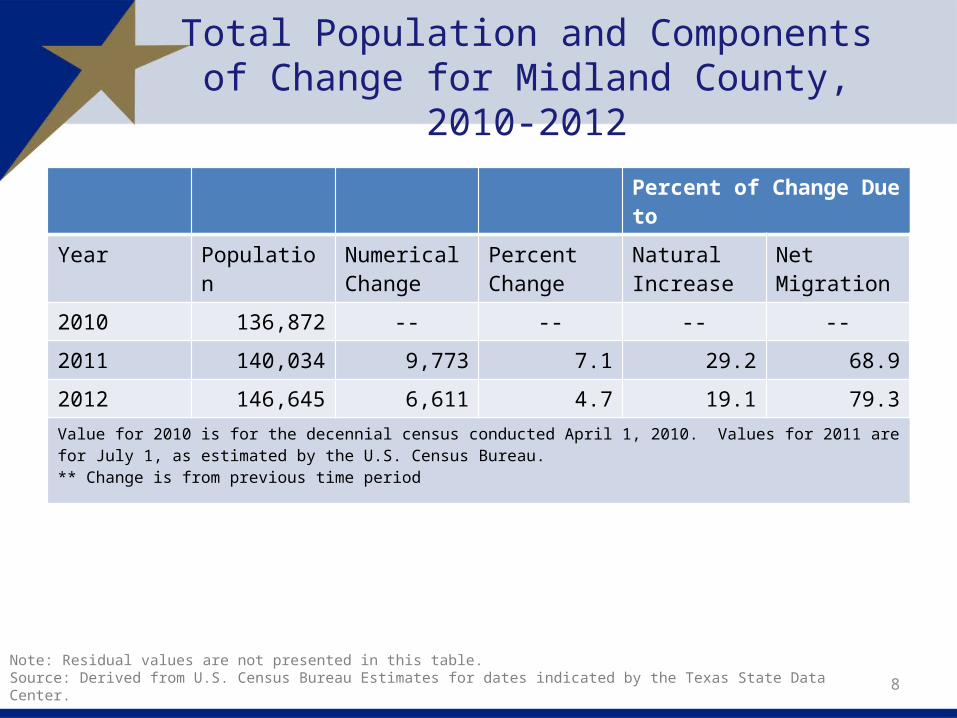
Total Population and Components of Change for Midland County, 2010-2012
Percent of Change Due to
Year Population Numerical Change
Percent Change
Natural Increase
Net Migration
2010 136,872 -- -- -- --
2011 140,034 9,773 7.1 29.2 68.9
2012 146,645 6,611 4.7 19.1 79.3
Value for 2010 is for the decennial census conducted April 1, 2010. Values for 2011 are for July 1, as estimated by the U.S. Census Bureau. ** Change is from previous time period
Note: Residual values are not presented in this table.Source: Derived from U.S. Census Bureau Estimates for dates indicated by the Texas State Data Center.
9
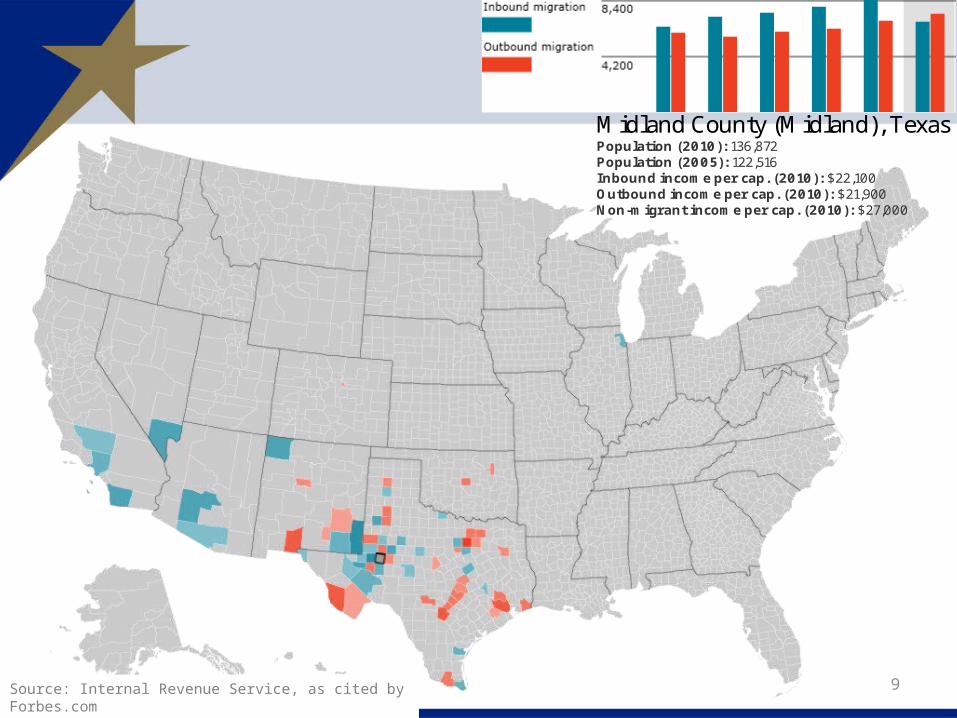
Midland County (Midland), Texas Population (2010): 136,872 Population (2005): 122,516 Inbound income per cap. (2010): $22,100 Outbound income per cap. (2010): $21,900 Non-migrant income per cap. (2010): $27,000
Source: Internal Revenue Service, as cited by Forbes.com
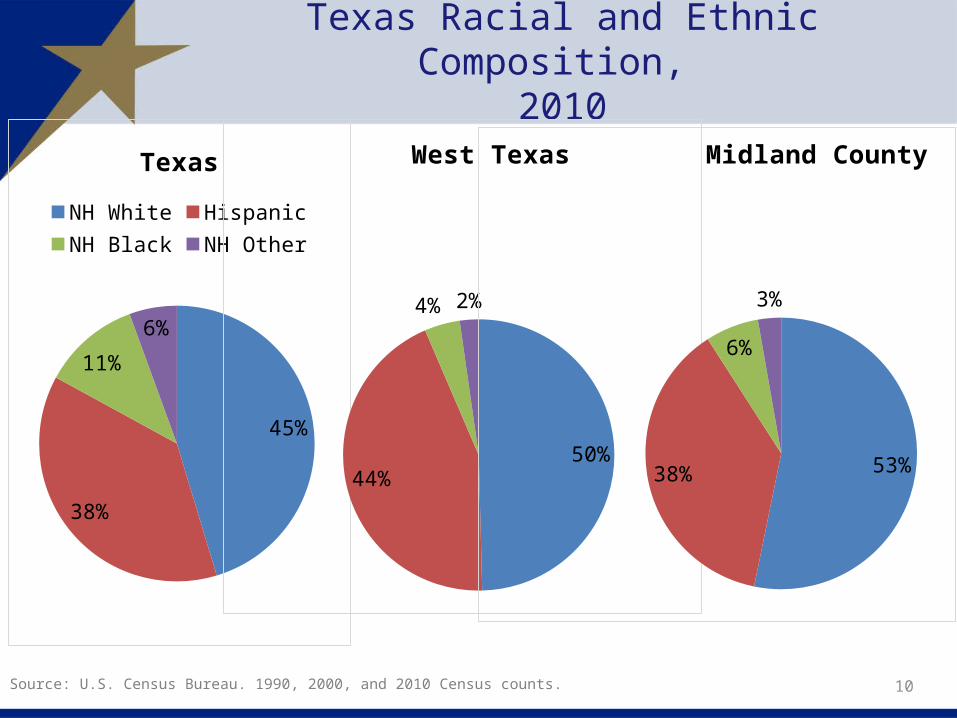
Texas Racial and Ethnic Composition, 2010
Source: U.S. Census Bureau. 1990, 2000, and 2010 Census counts. 10
45%
38%
11%
6%
Texas
NH White HispanicNH Black NH Other
50%44%
4% 2%
West Texas
53%38%
6%
3%
Midland County
11
Under 5
05-09 years
10-14 years
15-19 years
20-24 years
25-29 years
30-34 years
35-39 years
40-44 years
45-49 years
50-54 years
55-59 years
60-64 years
65-69 years
70-74 years
75-79 years
80-84 years
85 plus
600,000 400,000 200,000 0 200,000 400,000 600,000
NH White Male NH White Female
Age
Under 5
05-09 years
10-14 years
15-19 years
20-24 years
25-29 years
30-34 years
35-39 years
40-44 years
45-49 years
50-54 years
55-59 years
60-64 years
65-69 years
70-74 years
75-79 years
80-84 years
85 plus
600,000 400,000 200,000 0 200,000 400,000 600,000
Hispanic Male Hispanic Female
Age
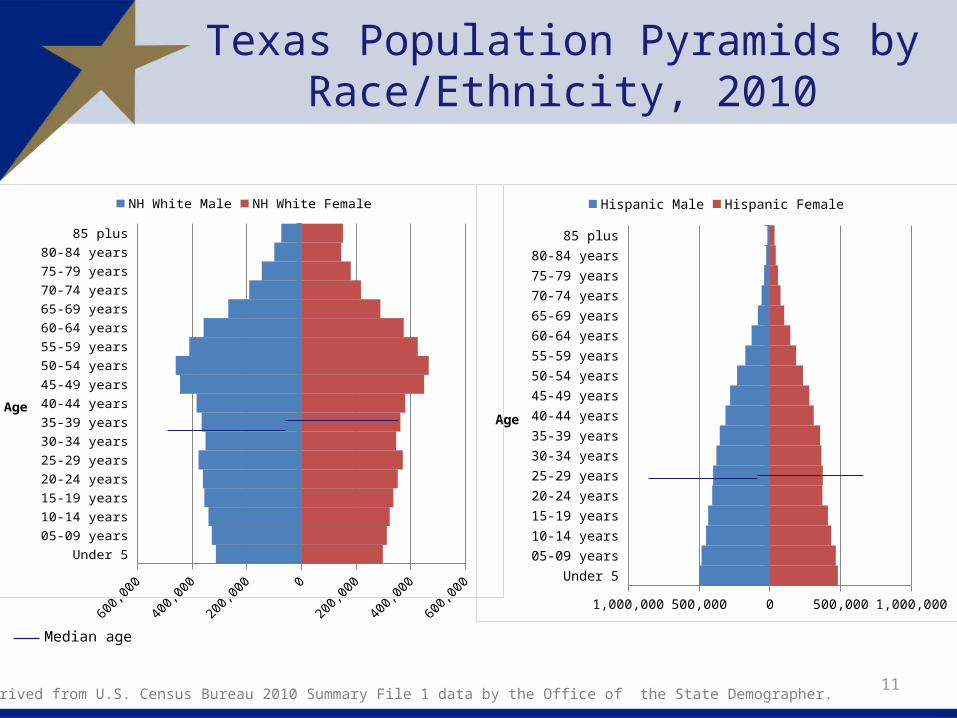
Texas Population Pyramids by Race/Ethnicity, 2010
Median age
Source: Derived from U.S. Census Bureau 2010 Summary File 1 data by the Office of the State Demographer.
12
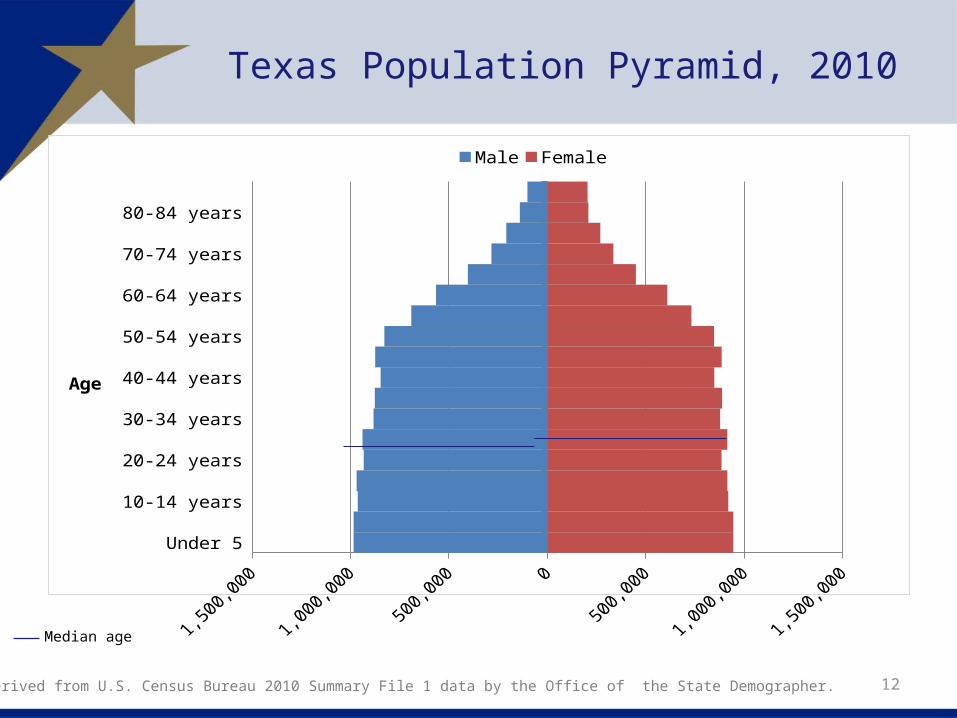
Under 505-09 years10-14 years15-19 years20-24 years25-29 years30-34 years35-39 years40-44 years45-49 years50-54 years55-59 years60-64 years65-69 years70-74 years75-79 years80-84 years
85 plus
1,500,000 1,000,000 500,000 0 500,000 1,000,000 1,500,000
Male Female
Age
Texas Population Pyramid, 2010
Source: Derived from U.S. Census Bureau 2010 Summary File 1 data by the Office of the State Demographer.
Median age
13
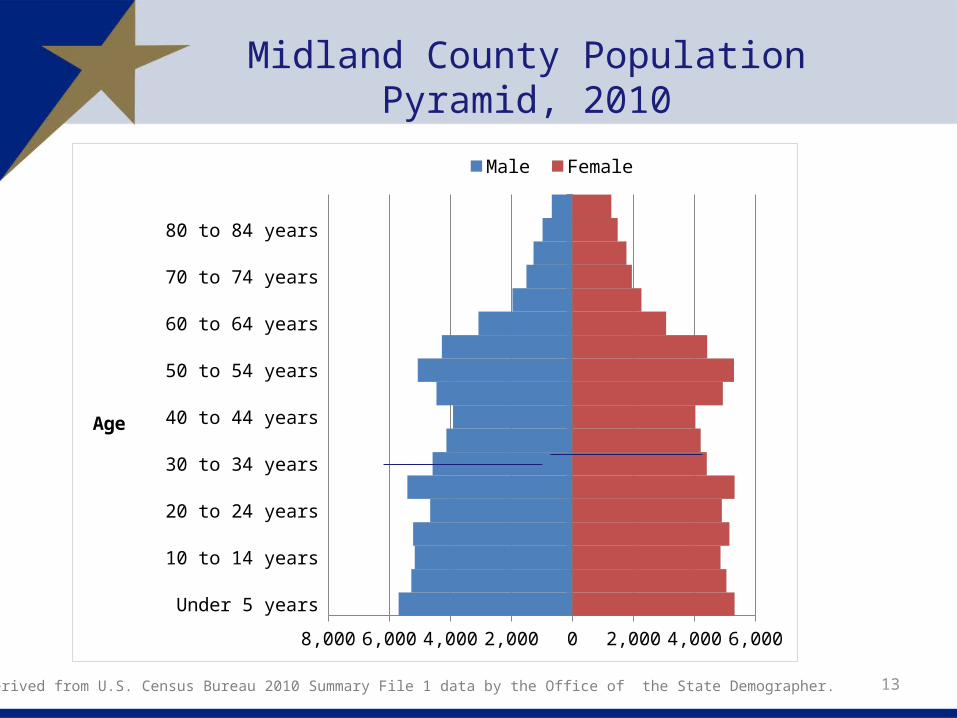
Midland County Population Pyramid, 2010
Under 5 years 5 to 9 years
10 to 14 years 15 to 19 years 20 to 24 years 25 to 29 years 30 to 34 years 35 to 39 years 40 to 44 years 45 to 49 years 50 to 54 years 55 to 59 years 60 to 64 years 65 to 69 years 70 to 74 years 75 to 79 years 80 to 84 years
85 plus
8,000 6,000 4,000 2,000 0 2,000 4,000 6,000
Male Female
Age
Source: Derived from U.S. Census Bureau 2010 Summary File 1 data by the Office of the State Demographer.

14
20102012
20142016
20182020
20222024
20262028
20302032
20342036
20382040
20422044
20462048
205020,000,000
25,000,000
30,000,000
35,000,000
40,000,000
45,000,000
50,000,000
55,000,000
60,000,000
Zero.5 of 2000-20102000-2010
Migration Scenarios
Projected Population Growth in Texas, 2010-2050
Source: Texas State Data Center 2012 Population Projections
15
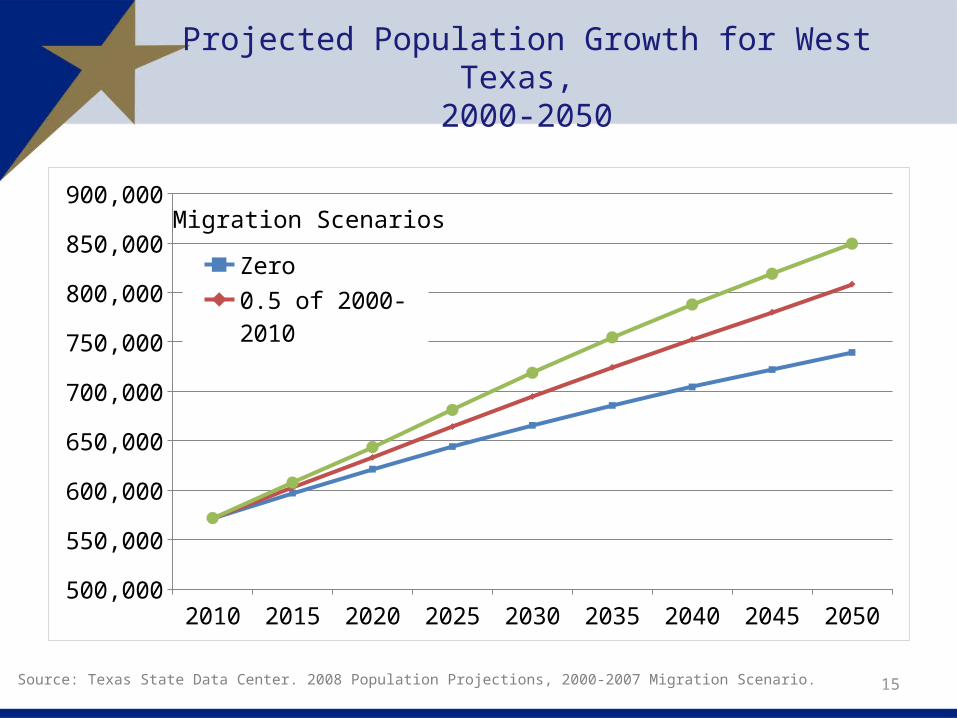
Projected Population Growth for West Texas, 2000-2050
Source: Texas State Data Center. 2008 Population Projections, 2000-2007 Migration Scenario.
2010 2015 2020 2025 2030 2035 2040 2045 2050500,000
550,000
600,000
650,000
700,000
750,000
800,000
850,000
900,000
Zero0.5 of 2000-20102000-2010
Migration Scenarios

16
Projected Racial and Ethnic Percent, Texas, 2010-2050
20102013
20162019
20222025
20282031
20342037
20402043
20462049
0
5,000,000
10,000,000
15,000,000
20,000,000
25,000,000
30,000,000
35,000,000
NH-WhiteNH-BlackHispanicNH-Other
Source: Texas State Data Center 2012 Population Projections , 2000-2010 Migration Scenario
17
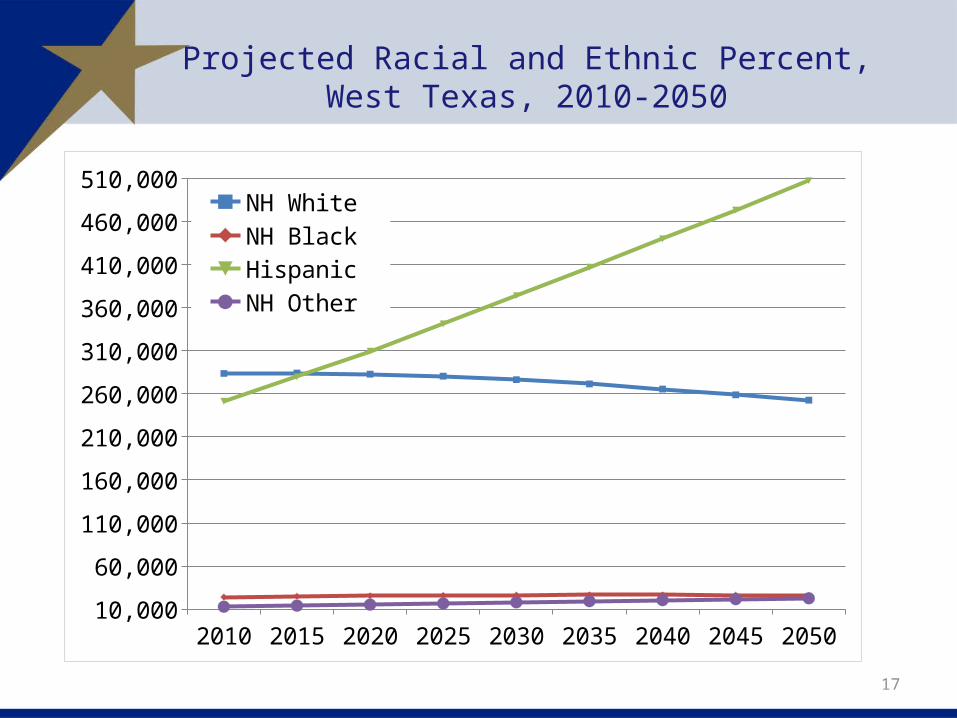
Projected Racial and Ethnic Percent, West Texas, 2010-2050
2010 2015 2020 2025 2030 2035 2040 2045 205010,000
60,000
110,000
160,000
210,000
260,000
310,000
360,000
410,000
460,000
510,000NH WhiteNH Black Hispanic NH Other
18
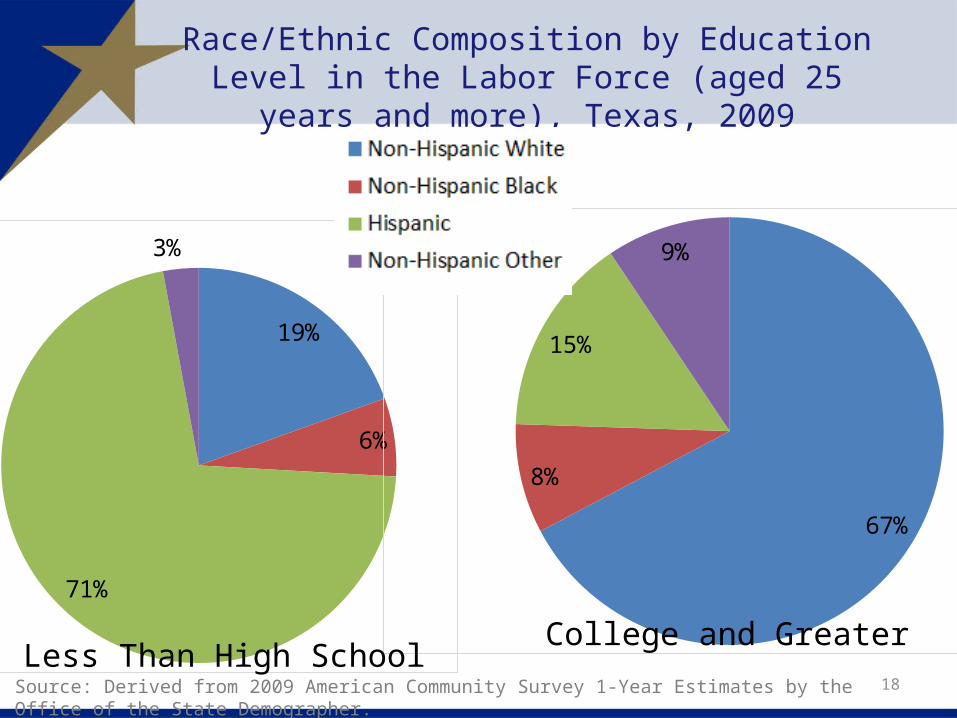
Race/Ethnic Composition by Education Level in the Labor Force (aged 25 years and more), Texas, 2009
19%
6%
71%
3%
67%
8%
15%
9%
Source: Derived from 2009 American Community Survey 1-Year Estimates by the Office of the State Demographer.Less Than High School
College and Greater
19
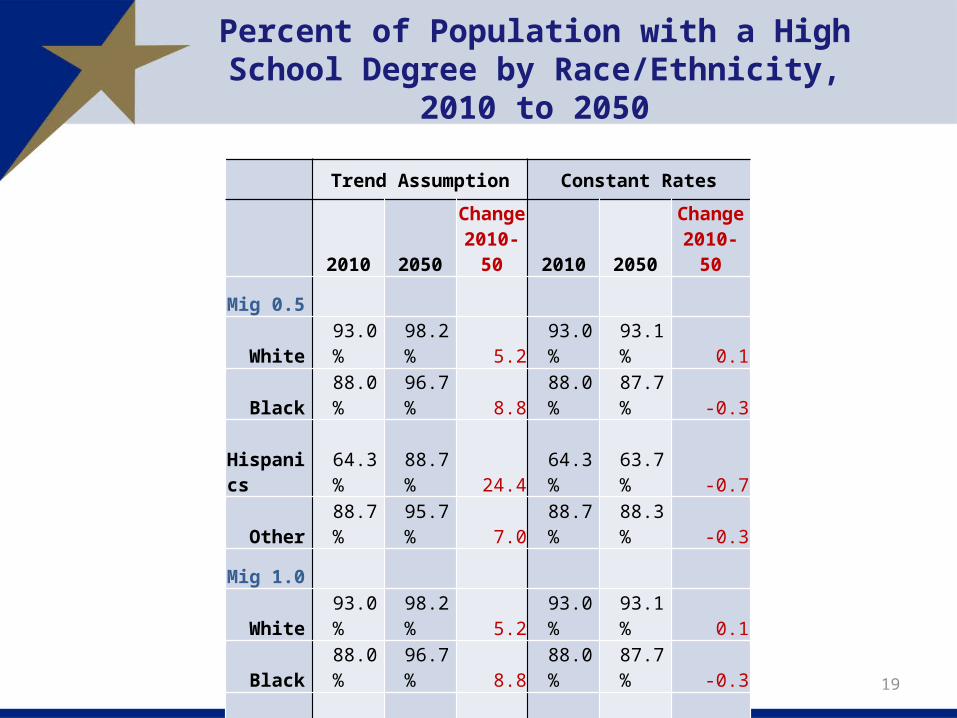
Percent of Population with a High School Degree by Race/Ethnicity, 2010 to 2050
Trend Assumption Constant Rates
2010 2050Change 2010-50 2010 2050
Change 2010-50
Mig 0.5
White 93.0% 98.2% 5.2 93.0% 93.1% 0.1
Black 88.0% 96.7% 8.8 88.0% 87.7% -0.3
Hispanics 64.3% 88.7% 24.4 64.3% 63.7% -0.7
Other 88.7% 95.7% 7.0 88.7% 88.3% -0.3
Mig 1.0
White 93.0% 98.2% 5.2 93.0% 93.1% 0.1
Black 88.0% 96.7% 8.8 88.0% 87.7% -0.3
Hispanics 64.3% 88.7% 24.3 64.3% 63.6% -0.7
Other 88.7% 95.7% 0.1 88.7% 88.4% -0.3
20
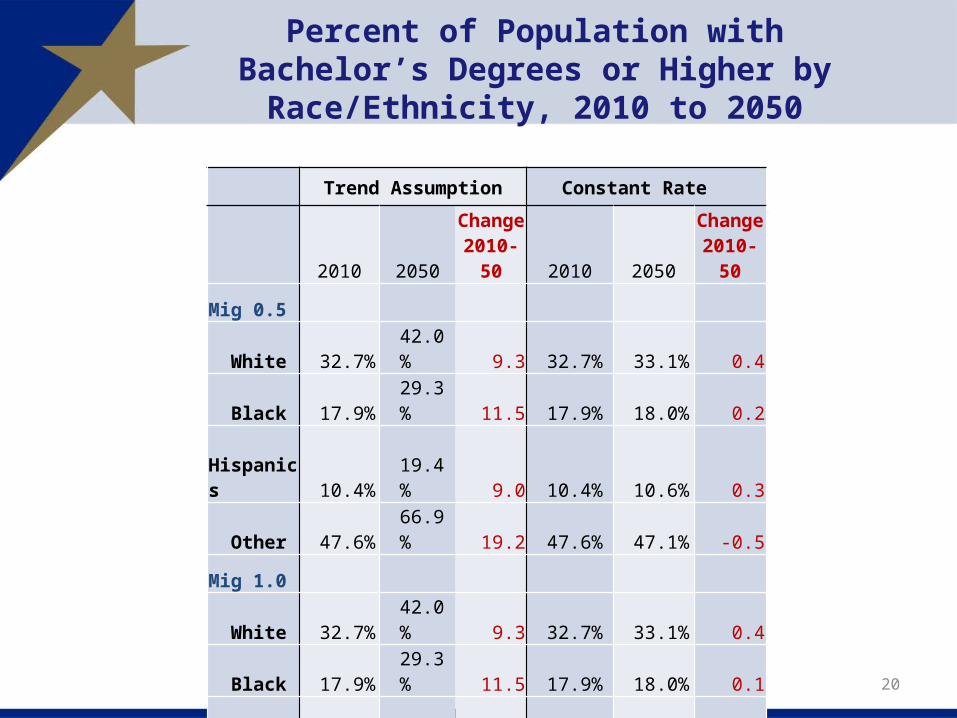
Percent of Population with Bachelor’s Degrees or Higher by Race/Ethnicity, 2010 to 2050
Trend Assumption Constant Rate
2010 2050Change 2010-50 2010 2050
Change 2010-50
Mig 0.5
White 32.7% 42.0% 9.3 32.7% 33.1% 0.4
Black 17.9% 29.3% 11.5 17.9% 18.0% 0.2
Hispanics 10.4% 19.4% 9.0 10.4% 10.6% 0.3
Other 47.6% 66.9% 19.2 47.6% 47.1% -0.5
Mig 1.0
White 32.7% 42.0% 9.3 32.7% 33.1% 0.4
Black 17.9% 29.3% 11.5 17.9% 18.0% 0.1
Hispanics 10.4% 19.4% 9.1 10.4% 10.6% 0.3
Other 47.6% 66.9% 19.3 47.6% 47.2% -0.4

21
Demographics & Destiny

22
Contact
Office: (512) 463-8390 or (210) 458-6530E-mail: [email protected]: http://osd.state.tx.us
Office of the State Demographer