the ''checkerboard method'' a new way to estimate the ... · the...
TRANSCRIPT
The ''Checkerboard Method''A New Way to Estimate the Numbers of Undiscovered Hydrocarbon Accumulations in Sparsely Drilled Areas
U.S. GEOLOGICAL SURVEY BULLETIN 2120

AVAILABILITY OF BOOKS AND MAPS OF THE U.S. GEOLOGICAL SURVEY
Instructions on ordering publications of the U.S. Geological Survey, along with prices of the last offerings, are given in the currentyear issues of the monthly catalog "New Publications of the U.S. Geological Survey." Prices of available U.S. Geological Survey publications released prior to the current year are listed in the most recent annual ''Price and Availability List." Publications that are listed in various U.S. Geological Survey catalogs (see back inside cover) but not listed in the most recent annual "Price and Availability List" are no longer available.
Reports released through the NTIS may be obtained by writing to the National Technical Information Service, U.S. Department of Commerce, Springfield, VA 22161; please include NTIS report number with inquiry.
Order U.S. Geological Survey publications by mail or over the counter from the offices given below.
BY MAIL
Books
Professional Papers, Bulletins, Water-Supply Papers, Techniques of Water-Resources Investigations, Circulars, publications of general interest (such as leaflets, pamphlets, booklets), single copies of Earthquakes & Volcanoes, Preliminary Determination of Epicenters, and some miscellaneous reports, including some of the foregoing series that have gone out of print at the Superintendent of Documents, are obtainable by mail from
U.S. Geological Survey, Information Services Box 25286, Federal Center
Denver, CO 80225
Subscriptions to periodicals (Earthquakes & Volcanoes and Preliminary Determination of Epicenters) can be obtained ONLY from the
Superintendent of Documents Government Printing Office
Washington, DC 20402
(Check or money order must be payable to Superintendent of Documents.)
Maps
For maps, address mail orders to
U.S. Geological Survey, Map Distribution Box 25286, Bldg. 810, Federal Center
Denver, CO 80225
Residents of Alaska may order maps from
U.S. Geological Survey, Earth Science Information Center 101 Twelfth Ave., Box 12
Fairbanks, AK 99701
OVER THE COUNTER
Books and Maps
Books and maps of the U.S. Geological Survey are available over the counter at the following U.S. Geological Survey offices, all of which are authorized agents of the Superintendent of Documents.
• ANCHORAGE, Alaska--4230 University Dr., Rm. 101
• LAKEWOOD, Colorado-Federal Center, Bldg. 810
• MENLO PARK, California-Bldg. 3, Rm. 3128, 345 Middlefield Rd.
• RESTON, Virginia-National Center, Rm. 1C402, 12201 Sunrise Valley Dr.
• SALT LAKE CITY, Utah-Federal Bldg., Rm. 8105, 125 South State St.
• SPOKANE, Washington-U.S. Post Office Bldg., Rm. 135, W. 904 Riverside Ave.
• WASHINGTON, D.C.-Main Interior Bldg., Rm. 2650, 18th and C Sts., NW.
Maps Only
Maps may be purchased over the counter at the U.S. Geological Survey offices:
• FAIRBANKS, Alaska-New Federal Building, 101 Twelfth Ave.
• ROLLA, Missouri-1400 Independence Rd.
• STENNIS SPACE CENTER, Mississippi-Bldg. 3101

The ''Checkerboard Method''A New Way to Estimate the Numbers of Undiscovered Hydrocarbon Accumulations in Sparsely Drilled Areas
By Richard G. Stanley
U.S. GEOLOGICAL SURVEY BULLETIN 2120
UNITED STATES GOVERNMENT PRINTING OFFICE, WASHINGTON : 1995

U.S. DEPARTMENT OF THE INTERIOR
BRUCE BABBITT, Secretary
U.S. GEOLOGICAL SURVEY
Gordon P. Eaton, Director
For sale by U.S. Geological SuiVey, Infonnation SeiVices
Box 25286, Federal Center Denver, CO 80225
Any use of trade, product, or finn names in this publication is for descriptive purposes only and does not imply endorsement by the U.S. Government.
Library of Congress Cataloging-in-Publication Data
Stanley, Richard G. The "checkerboard method., : a new way to estimate the numbers of undiscovered hydrocarbon accummulations in sparsely
drilled areas I R.G. Stanley. p. an.-(U.S. Geological Survey bulletin; 2120)
Includes bibliographical references. Supt of Docs. no.: I 19.3:2120 1. Petroleum-Prospecting-Statistical methods. 2. Petroleum reserves-California-Pacific Coast. I. Title II. Series.
QE75.B9 No.2120 [1N271.P4] 551.3 s--dc20 (622'.1828] 95-2317
CIP

CONTENTS
Abstract........................................................................................................................ 1 Introduction ....... ... ............ .. . .. ... .. . . ...... .. .......... ... . . . .. .......... ...... .. .. ........ .. . . . . ...... .. . . . . ....... 1 Procedure..................................................................................................................... 2 Examples..................................................................................................................... 2
Example 1: Salinas basin.................................................................................... 2 Example 2: Eel River basin ................................................................................ 4 Example 3: Sargent-Hollister basin.................................................................... 4
Discussion.................................................................................................................... 6 Conclusions .......... ........... ... ......... ....... ............ ... . ............ .. ...... ............ .. . . . ....... .. . . . . ....... 8 Acknowledgments....................................................................................................... 8 References cited . . . ............ .. . .. ... .. . . ...... ... . ........ ... . . . ......... .. . ...... .. .. .. .. . . . . .. . . . . ..... .... ... ....... 8
FIGURES
1. Map showing locations of certain oil and gas basins (shaded areas)........................................................................... 1 2. Checkerboard map of the Salinas basin........................................................................................................................ 3 3. Checkerboard map of the Eel River basin.................................................................................................................... 5 4. Checkerboard map of the Sargent-Hollister basin........................................................................................................ 6
m


The ''Checkerboard Method''-A New Way to Estimate the Numbers of Undiscovered Hydrocarbon Accumulations in Sparsely -Drilled Areas
By Richard G. Stanley
ABSTRACT
The "checkerboard method" is a simple and quick way of estimating the numbers of undiscovered hydrocarbon accumulations in areas that are sparsely drilled but have at least one discovered oil or gas field. The area to be evaluated is partitioned into many sectors of equal area (for example, 1 mi2), and each sector is classified as producing (P), drilled but not producing (D), or undrilled (U). Then, a success ratio (S) is calculated using the equation S=PI(P+D). The number of sectors with undiscovered hydrocarbon accumulations (A) is calculated from the relation A=US. If one assumes that most undiscovered accumulations are small and occupy surface areas smaller than one sector, then the quantity A may be about the same or somewhat less than the number of undiscovered accumulations. Alternatively, if one believes that there are several large undiscovered accumulations that occupy many sectors each, then the quantity A may be significantly larger than the number of undiscovered accumulations.
The checkerboard method was developed during the course of a U.S. Geological Survey assessment of the undiscovered petroleum resources of oil and gas basins in coastal onshore California. The method might also be useful in other parts of California and the world where alternative techniques-such as prospect counting, statistical analysis of discovered fields, and comparison with analog basins-are inadequate or unsuitable.
INTRODUCTION
Periodically, the U.S. Geological Survey assesses the undiscovered petroleum resources of the domestic onshore United States (Miller and others, 1975; Dolton and others 1981; Mast and others, 1989). During the most recent assessment (Gautier and others, 1985; U.S. Geological Sur-
Manuscript approved for publication December 30, 1994.
vey National Oil and Gas Resource Assessment Team, 1995), the nation was divided into 72 provinces. Each province was assigned a geologist who was responsible for dividing the province into oil and gas plays, and for providing pertinent information on the geology and petroleum resource potential of each play.
The province geologists were asked, among other things, to estimate the sizes and number of undiscovered hydrocarbon accumulations larger than a minimum size ( 1 million barrels of oil or 6 billion cubic feet of gas) in each play. Such estimates are essential to the assessment process (for details, see Houghton and others, 1993), and various methods were used to obtain them. In well-explored regions such as the San Joaquin and Sacramento basins of California (fig. 1), where many oil and gas fields have been found, the sizes and numbers of undiscovered accumulations were determined by extrapolation from statistical analyses of the
0 100 MILES I 1
1 11
I 0 100 200 KILOMETERS
Figure 1. Map showing locations of certain oil and gas basins (shaded areas). SF, San Francisco.
1

2 "CHECKERBOARD METHOD"-ESTIMATING UNDISCOVERED HYDROCARBON ACCUMULATIONS
sizes and numbers of known accumulations. However, in sparsely-drilled areas like the Salinas, Eel River, and SargentHollister basins (fig. 1), where only a few oil and gas fields have been found, the available data are insufficient for statistics to be helpful. In these areas, the sizes of the undiscovered accumulations were estimated by analogy with previously discovered fields in the same areas, and the numbers of undiscovered accumulations were inferred using a simple type of spatial analysis called the "checkerboard method." The purpose of this report is to describe the checkerboard method, show how the method was applied to three examples in central and northern California, and discuss the method's limitations and underlying assumptions.
PROCEDURE
The checkerboard method uses the following routine:
Step 1.-A map of the territory to be assessed is partitioned into many small sectors of equal area. In some areas, it may be possible to use sections of 1 mi2 from the U.S. Public Land Survey Grid, as shown on published topographic maps. However, in the three California examples discussed below, I used an arbitrary grid with sectors of 1 mi2 because the areas to be assessed include many surveyed sections and townships that are irregular in shape and size.
Step 2.-The sectors are arranged into three categories with the symbols P, D, and U, according to the following scheme:
P = Producing sectors, which are defined as those with petroleum production from discovered accumulations larger than a minimum size of 1 million barrels of oil or 6 billion cubic feet of gas. In the California examples discussed below, each accumulation larger than the minimum size is assigned at least one sector; smaller accumulations were completely ignored. For large accumulations (for example, the San Ardo oil field of the Salinas basin), I counted only those sectors in which at least half the sector fell within the field outline shown on maps published by the California Division of Oil and Gas.
D = Drilled sectors, including those with at least one exploratory well but no discovered accumulations larger than a minimum size of 1 million barrels of oil or 6 billion cubic feet of gas. In the California examples discussed below, sectors assigned to this category include several commercial oil and gas fields smaller than the minimum size.
U = Undrilled sectors, with no wells or discovered accumulations larger than 1 million barrels of oil or 6 billion cubic feet of gas.
I color-coded my working maps using red for producing sectors, blue for drilled ones, and white for undrilled
sectors. Some of the resulting maps vaguely resemble checkerboards, suggesting the name of the method.
Step 3.-A "success ratio," with the symbol S, is calculated by dividing the number of producing sectors by the sum of the producing and drilled sectors:
S=PI(P+D)
Step 4.-The success ratio is then multiplied by the number of undrilled sectors to calculate the quantity A, the number of sectors with undiscovered hydrocarbon accumulations:
A=US
Step 5.-The number of undiscovered accumulations is inferred from the quantity A. If one assl!mes that most undiscovered accumulations are likely to be small and to occupy surface areas of 1 mi2 or less, then the quantity A may also be nearly the same as the number of undiscovered accumulations. However, in some sparsely explored areas, there may be large undiscovered accumulations that occupy more than one sector (for example, the San Ardo oil field, which covers approximately 8 sectors). Therefore, if the area being assessed includes one or more very large accumulations covering several sectors, the number of undiscovered accumulations could be smaller than the quantity A.
In the California examples discussed below, I assume that the checkerboard method provides the median number of undiscovered accumulations. The maximum number of accumulations is estimated by analogy with the most densely drilled and productive parts of the Powder River basin of Wyoming, where there is approximately one discovered accumulation per 4 mi2, on the basis of inspection of the map of DeBruin and Boyd (1990). Estimates of the minimum numbers of undiscovered accumulations in the California examples are outright guesses.
EXAMPLES
The following paragraphs describe application of the checkerboard method to the Salinas, Eel River, and Sargent-Hollister basins of onshore coastal California (fig. 1). In these discussions, estimates of discovered field sizes are very approximate and based on several sources, including the sum of cumulative production plus estimated reserves (California Division of Oil and Gas, 1993), an unpublished database (NRG Associates, Inc., 1992), and informal communications from professionals in the oil industry.
EXAMPLE 1: SALINAS BASIN
The Salinas basin is located in central California, about 240 km (150 mi) southeast of San Francisco (figs. 1,

EXAMPLES 3
2). The area includes known and hypothetical accumulations of oil and associated gas in gently to moderately deformed Tertiary rocks more than 5,800 m (19,000 ft) thick. All commercial production to date has been from sandstone reservoirs of middle and late Miocene age. The produced oil is heavy (generally 10-19 ° API), contains 1-2 percent sulfur and minor amounts of associated gas, and is accompanied by very large volumes of water (California Division of Oil and Gas, 199'1).
Several commercial oil fields occur in the Salinas basin, including the giant San Ardo field, with a size of about 530-860 million barrels; the much smaller King City field, with a size of about 2.1-3.3 million barrels; and five
121"15'
fields smaller than 1 million barrels (fig. 2). In addition, accumulations of very heavy oil and bituminous rock much larger than 1 million barrels of oil occur southeast of Lockwood, southeast of the Paris Valley field, and southwest of Bradley (fig. 2; see also Durham, 1974, and Hallmark, 1980). Attempts to obtain commercial production from these deposits have been economically unsuccessful (R.A. Brunetti, California Division of Oil and Gas, oral communication, 1993).
Most of the commercial oil fields occur in a moderately well explored tract along the northeastern side of the Salinas basin, between Greenfield and Bradley (fig. 2). However, much of the remaining area of the Salinas basin.
121" 00' 120" 45'
0 Soledad 0
Bitterwater
36" 15'
EXPLANATION
o Town
' Fault 'X_ Axis of syncline
• Producing sector
lliTI Drilled sector
0 Undrilled sector
-. Oil accumulation larger • than 1 million barrels
* Oil accumulation smaller than 1 million barrels
0 10
I I I
0 I
10 I I I
20
Figure 2. Checkerboard map of the Salinas basin.
I
Boundary of area evaluated by the Checkerboard method
20 MILES I
30 KILOMETERS

4 "CHECKERBOARD METHOD"-ESTIMATING UNDISCOVERED HYDROCARBON ACCUMULATIONS
is only lightly explored, with the potential for many more field discoveries. Some geologists believe that one or more very large accumulations (perhaps comparable in size to the San Ardo field) may lie hidden in the sparsely drilled area to the west and northwest of San Miguel (fig. 2). On the basis of informal conversations with several oil industry geologists, I conclude that there is about a 5 percent chance of the occurrence of an undiscovered accumulation as large as 500 million barrels of oil. The median undiscovered accumulation size, in my subjective judgment, is probably about 2 million barrels of oil, somewhat smaller than the King City field.
I applied the checkerboard method to the part of the Salinas basin that, in my opinion, is most highly prospective for oil and gas (fig. 2). I counted 14 producing sectors (from the San Ardo, King City, Paris Valley, Bradley, and Lockwood accumulations only), 245 drilled sectors, and about 530 undrilled sectors. I calculated a success ratio of 0.052, and about 28 sectors with undiscovered accumulations. Rounding upward from the latter number, I inferred a median number of about 30 undiscovered accumulations, which in my opinion may include about 25 conventional oil fields and 5 subeconomic deposits of very heavy oil and bituminous rock. The maximum number of undiscovered accumulations is estimated to be about 130, or about one accumulation for every four undrilled sectors, by analogy with the most densely drilled and productive parts of the Powder River basin of Wyoming. The least number of undiscovered accumulations is estimated at ten, an outright guess.
EXAMPLE 2: EEL RIVER BASIN
The Eel River basin is located on the California coast about 350 km (220 mi) north of San Francisco (figs. 1, 3). The area assessed is mainly onshore, but also includes the adjacent state waters out to the 3-mi limit. The Eel River basin includes discovered and undiscovered accumulations of nonassociated gas in Neogene strata more than 3,300 m (11,000 ft) thick. All commercial production to date has been from sandstone reservoirs of Pliocene age. The produced gas is accompanied by very little condensate or water and is believed to be of thermogenic origin on the basis of unpublished isotopic evidence obtained by the petroleum industry.
Three gas fields have been discovered in the Eel River basin, but only the Tompkins Hill field (with a size of about 112-139 billion cubic feet) has been commercial. The much smaller Table Bluff field was originally believed to contain about 8.5 billion cubic feet of gas (R.A. Reid, California Division of Oil and Gas, oral communication, 1994 ), but was abandoned in 1968 after producing only 109 million cubic feet. The size of the third field, Grizzly Bluff, is uncertain; unconfirmed oil industry ru-
mors suggest about 2-3 billion cubic feet of gas, much smaller than the minimum size (6 billion cubic feet) considered in this assessment.
Away from the Tompkins Hill field, drilling density in the Eel River basin is low (Hopps and Horan, 1983; Horan and Hopps, 1987). Exploration to date has focused mainly on structural traps, but there may also be stratigraphic traps involving lenticular sandstone reservoirs (Crouch and Bachman, 1987). Most undiscovered accumulations are probably small; the median undiscovered accumulation size is estimated to be about 12 billion cubic feet of gas. However, there may be one or more larger accumulations concealed by alluvium in the central part of the basin, or hidden beneath the northeast-dipping Little Salmon fault. The largest accumulation expected at a 5-percent chance in this play is estimated to be about 300 billion cubic feet of gas, or about twice the size of the Tompkins Hill field.
I applied the checkerboard ·method to the part of the Eel River basin that, in my opinion, is most highly prospective for gas (fig. 3). I counted 4 producing sectors (from the Tompkins Hill and Table Bluff fields), about 40 drilled sectors, and about 280 undrilled sectors. I calculated a success ratio of 0.09, and about 25 sectors with undiscovered accumulations. Assuming that at least two of the undiscovered accumulations are comparable in size to Tompkins Hill and large enough to occupy 2 or 3 sectors, I inferred a probable median of 20 undiscovered accumulations. The maximum number of undiscovered accumulations is estimated to be 70, or one accumulation for every four undrilled sectors, by analogy with the most densely explored parts of the Powder River basin of Wyoming. The least number of undiscovered accumulations is estimated at ten, an outright guess.
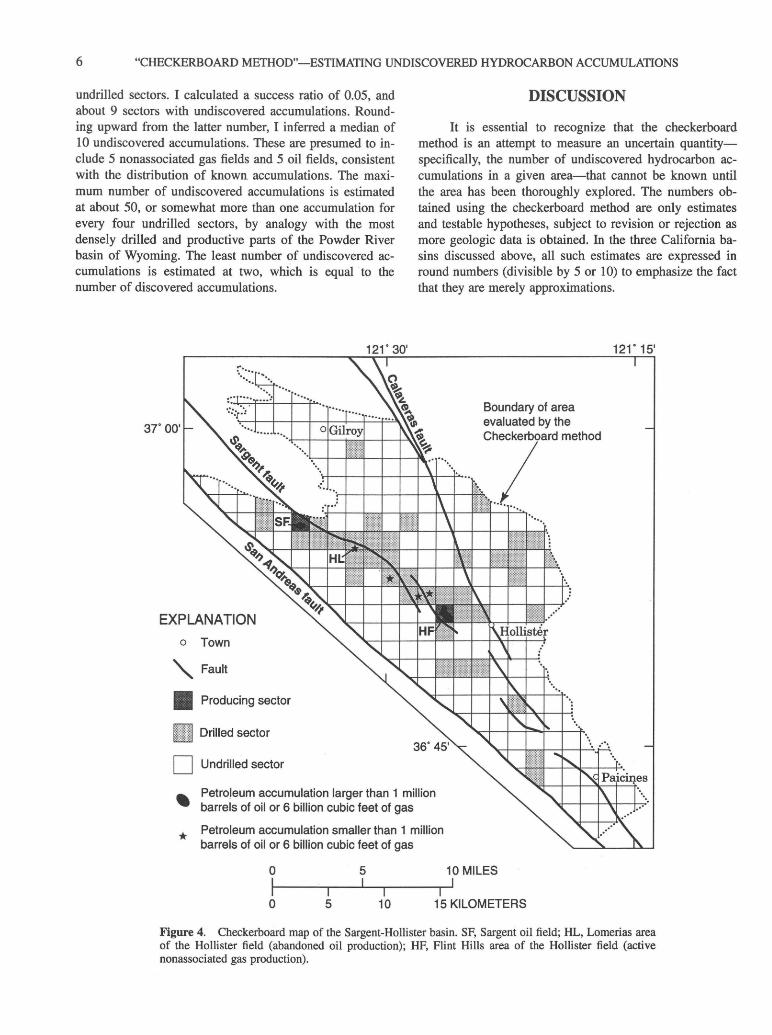
EXAMPLE 3: SARGENT-HOLLISTER BASIN
The Sargent-Hollister basin is located in the southern Santa Clara Valley about 130 km (80 mi) southeast of San Francisco (figs. 1, 4). This area is unusual in the California Coast Ranges in that commercial production is obtained from accumulations of nonassociated, dry gas as well as from separate accumulations of oil and associated gas. These hydrocarbons occur in gently to moderately deformed Terti~ sedimentary rocks as thick as 4,900 m (16,000 ft), and in fractured rocks of the underlying Franciscan Complex.
Nonassociated gas is produced from sandstone reservoirs of presumed Pliocene age in the Flint Hills area of the Hollister field, which has an estimated size of about 8-12 billion cubic feet of gas. The gas contains no C02 or H2S and is produced with almost no condensate (R.F. Curtin, California Division of Oil and Gas, oral communication, 1994 ). Oil and associated gas are produced from
EXAMPLES 5
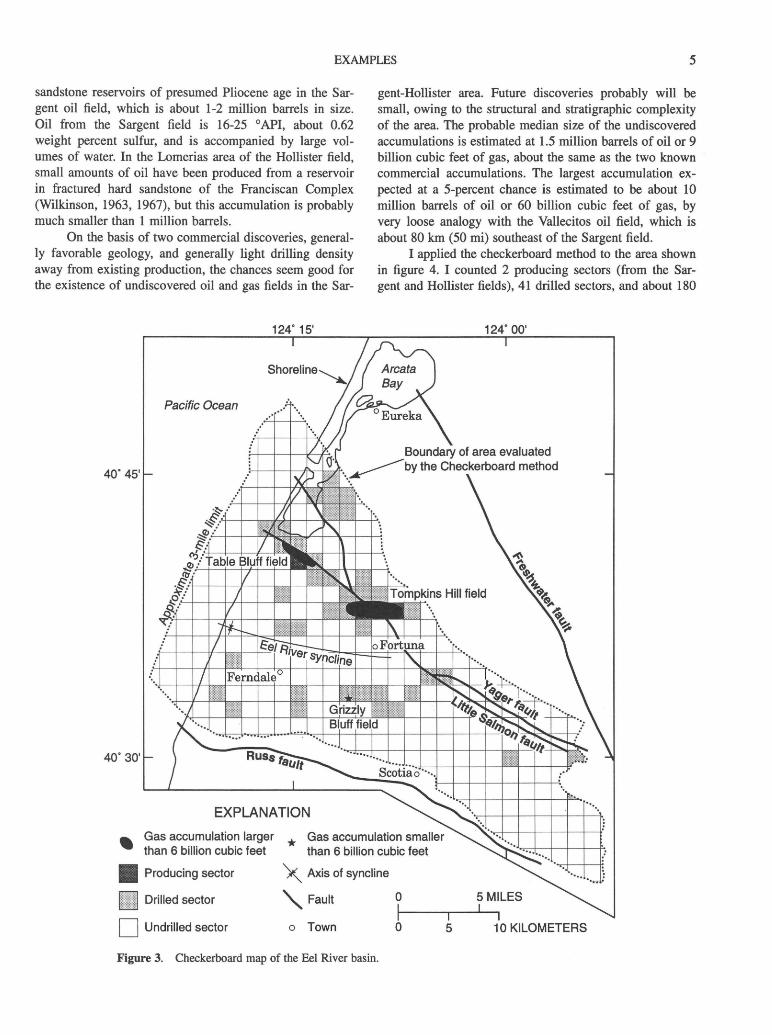
sandstone reservoirs of presumed Pliocene age in the Sargent oil field, which is about 1-2 million barrels in size. Oil from the Sargent field is 16-25 ° API, about 0.62 weight percent sulfur, and is accompanied by large volumes of water. In the Lomerias area of the Hollister field, small amounts of oil have been produced from a reservoir in fractured hard sandstone of the Franciscan Complex (Wilkinson, 1963, 1967), but this accumulation is probably much smaller than 1 million barrels.
On the basis of two commercial discoveries, generally favorable geology, and generally light drilling density away from existing production, the chances seem good for the existence of undiscovered oil and gas fields in the Sar-
Pacific Ocean
gent-Hollister area. Future discoveries probably will be small, owing to the structural and stratigraphic complexity of the area. The probable median size of the undiscovered accumulations is estimated at 1.5 million barrels of oil or 9 billion cubic feet of gas, about the same as the two known commercial accumulations. The largest accumulation expected at a 5-percent chance is estimated to be about 10 million barrels of oil or 60 billion cubic feet of gas, by very loose analogy with the Vallecitos oil field, which is about 80 km (50 mi) southeast of the Sargent field.
I applied the checkerboard method to the area shown in figure 4. I counted 2 producing sectors (from the Sargent and Hollister fields), 41 drilled sectors, and about 180
124. 00'
40. 45'
Boundary of area evaluated ~by the Checkerboard method
40. 30'
EXPLANATION
• Gas accumulation larger * Gas accumulation smaller than 6 billion cubic feet than 6 billion cubic feet
II Producing sector
Drilled sector
D Undrilled sector
~ Axis of syncline
'Fault
o Town
Figure 3. Checkerboard map of the Eel River basin.
0
I 0
I 5
5 MILES I
I 10 KILOMETERS
6 "CHECKERBOARD METHOD"-ESTIMATING UNDISCOVERED HYDROCARBON ACCUMULATIONS
undrilled sectors. I calculated a success ratio of 0.05, and about 9 sectors with undiscovered accumulations. Rounding upward from the latter number, I inferred a median of 10 undiscovered accumulations. These are presumed to include 5 nonassociated gas fields and 5 oil fields, consistent with the distribution of known accumulations. The maximum number of undiscovered accumulations is estimated at about 50, or somewhat more than one accumulation for every four undrilled sectors, by analogy with the most densely drilled and productive parts of the Powder River basin of Wyoming. The least number of undiscovered accumulations is estimated at two, which is equal to the number of discovered accumulations.
3TOO'
EXPLANATION
o Town
'Fault
II Producing sector
Drilled sector
D Undrilled sector
121° 30'
DISCUSSION
It is essential to recognize that the checkerboard method is an attempt to measure an uncertain quantityspecifically, the number of undiscovered hydrocarbon accumulations in a given area-that cannot be known until the area has been thoroughly explored. The numbers obtained using the checkerboard method are only estimates and testable hypotheses, subject to revision or rejection as more geologic data is obtained. In the three California basins discussed above, all such estimates are expressed in round numbers (divisible by 5 or 10) to emphasize the fact that they are merely approximations.
Boundary of area evaluated by the Ch1eck:ert10a1rd method
121° 15'
.. Petroleum accumulation larger than 1 million barrels of oil or 6 billion cubic feet of gas
* Petroleum accumulation smaller than 1 million barrels of oil or 6 billion cubic feet of gas
0
I 5 I
I
10 MILES I
0 I 5
I 10 15 KILOMETERS
Figure 4. Checkerboard map of the Sargent-Hollister basin. SF, Sargent oil field; HL, Lomerias area of the Hollister field (abandoned oil production); HF, Flint Hills area of the Hollister field (active nonassociated gas production).

DISCUSSION 7
The three California examples illustrate how the checkerboard method requires the geologist to make many subjective judgments, often on the basis of limited data. In addition, the method relies on several assumptions, discussed below.
Assumption 1: Most undiscovered accumulations are small and occupy suiface areas of 1 mi2 or less. This assumption seems reasonable for many basins in central and northern coastal California, where most (but not all) of the discovered traps and corresponding accumulations are of modest size, owing to the common occurrences of closely spaced faults, tight folds, and rapid lateral changes in reservoir quality and thickness.
Assumption 2: Large accumulations, if present, are likely to occupy more space than small ones. An example of a large accumulation is the San Ardo oil field of the Salinas basin, which has an estimated size of about 530-860 million barrels and occupies about 8 sectors. If large undiscovered accumulations occupying two or more sectors are expected in a basin, then the number of undiscovered accumulations may be significantly less than the quantity A, the number of sectors with undiscovered accumulations. This requires a subjective judgment on the part of the geologist; an example of how such an judgment can be made and applied is given in the discussion of the Eel River basin, above.
Assumption 3: Large sparsely drilled areas are likely to have more undiscovered accumulations than small sparsely drilled areas of similar geology, geologic history, and exploration intensity. To me, this seems self-evident.
Assumption 4: A sector with exploratory wells but no discovered accumulations is unlikely to have any undiscovered accumulations. This is probably true for sectors with several unsuccessful wells that drilled deep enough to penetrate economic basement. However, it may not be true for sectors that have been tested by only one well if that well was located along one edge or near a comer of the sector, was too shallow to test the entire thickness of prospective strata, or was improperly tested or completed.
Assumption 5: Within the area being assessed, andrilled sectors have roughly the same potential for success as did both the drilled and producing sectors prior to drilling. This a~sumption is critical and relies heavily on the ability of the geologist to draw the boundaries of the assessment area in such a way that every sector has approximately the same potential for the occurrence of an undiscovered hydrocarbon accumulation. In the Salinas basin, for example, I drew the assessment boundaries to include areas of thick Miocene strata and to exclude areas where Miocene strata are thin, absent, or believed to lack petroleum source rocks of sufficient thermal maturity to generate oil. It can be argued that, in some areas, most of the sectors that are geologically most favorable for petroleum-for example, sectors with large surface anticlineshave already been drilled, while the undrilled sectors are
less favorable and of lower potential. However, experience in coastal California shows that sectors with seemingly unfavorable surface geology may harbor subtle traps whose location cannot readily be predicted ahead of drilling. Common examples of subtle traps in coastal California include many stratigraphic traps as well as old, deep anticlinal structures concealed beneath buried unconformities, thrust faults, or shallow disharmonic folds. The San Ardo field, for example, is a buried anticlinal trap concealed by a younger surface syncline. Finally, many undrilled sectors may be in areas that are geologically favorable but closed to drilling by landowners, governmental restrictions, or difficult terrain. In the Salinas basin, for example, a large but highly prospective area located west and northwest of San Miguel has been almost entirely closed to drilling because it is on the Camp Roberts military base.
The preceding five assumptions seem reasonable for several oil and gas basins in coastal California and may also apply to basins elsewhere in the world. However, even in seemingly favorable basins, the checkerboard method should be used with caution. The method may overestimate the number of undiscovered petroleum accumulations in a given basin if there are unexpectedly large fields that occupy more than one sector; if the assessment area includes sectors with little or no petroleum potential; or if it appears that all the "good" (geologically most favorable) sectors have already been thoroughly explored, leaving only the unfavorable ones. Alternatively, the checkerboard method may underestimate the number of undiscovered accumulations if the boundaries of the assessment area are drawn too conservatively or if many of the drilled but nonproducing sectors are harboring undiscovered subtle traps.
At least three alternative methods of estimating the numbers of urttliscovered petroleum accupmlations are available, but cannot be applied to any of the three California basins discussed above. (1) Clearly, the most desirable approach would be to incorporate all available geological and geophysical information into detailed maps of surface and subsurface geology, and map all conceivable prospects. Such mapping is time consuming and expensive, and clearly beyond the current capability of the U.S. Geological Survey. (2) Statistical analysis of the numbers and sizes of discovered accumulations, while used with some success in well-explored areas like the San Joaquin and Sacramento basins, is clearly not applicable in the Salinas, Eel River, and Sargent-Hollister basins because so few accumulations have been found. (3) Comparison with analog basins-in other words, well-explored areas that are geologically similar to those in coastal California and in which the sizes and numbers of hydrocarbon accumulations are known to a high degree of certaintywas rejected because appropriate analogs could not be identified.

8 "CHECKERBOARD METHOD"-ESTIMATING UNDISCOVERED HYDROCARBON ACCUMULATIONS
CONCLUSIONS
The checkerboard method is a simple, fast way of estimating the numbers of undiscovered accumulations of oil and gas in sparsely drilled areas. However, the applicability of the method is limited, for it is based on several assumptions that may apply to some basins but not all. Additionally, the method depends heavily on subjective judgments on the part of the geologist, who must exercise care in drawing the boundaries of the area to be assessed, guess the likely sizes of undiscovered accumulations, and decide whether numerical estimates resulting from the method are geologically reasonable. The accuracy of the checkerboard method is uncertain, but could be tested by analysis of the drilling and discovery histories of completely explored oil and gas basins elsewhere in the world, or (over the long run) by thorough exploration of basins that previously were assessed by the method.
ACKNOWLEDGMENTS
I thank K.J. Bird, G.L. Dolton, D.L. Gautier, L.B. Magoon, and M.E. Tennyson for helpful discussions, and Bird and Tennyson for reviewing an early draft of this report.
REFERENCES CITED
California Division of Oil and Gas, 1991, California oil and gas fields, southern, central, coastal, and offshore California [3d ed.]: Sacramento, California Division of Oil and Gas Publication TR 12, 689 p.
--1993, 78th annual report of the State Oil and Gas Supervisor, 1992: Sacramento, California Division of Oil and Gas Publication PR06, 159 p.
Crouch, J.K., and Bachman, S.B., 1987, Geology and Cenozoic history of the northern California margin: Point Arena to Eel River, in Ingersoll, R.V., and Ernst, W.G., eds., Cenozoic basin development of coastal California: Prentice-Hall, Inc., Rubey Volume VI, p. 124-145.
DeBruin, R.H., and Boyd, C.S., 1990, Oil and gas fields map of the Powder River basin, Wyoming: Geological Survey of Wyoming Map Series 31, scale 1:316,800.
Dolton, G.L., Carlson, K.H., Charpentier, R.R., Coury, A.B., Crovelli, R.A., Frezon, S.E., Khan, A.S., Lister, J.H., McMullin, R.H., Pike, R.S., Powers, R.B., Scott, E.W., and Varnes, K.L., 1981, Estimates of undiscovered recoverable conventional resources of oil and gas in the United States: U.S. Geological Survey Circular 860, 870 p.
Durham, D.L., 1974, Geology of the southern Salinas Valley area, California: U.S. Geological Survey Professional Paper 819, 111 p.
Gautier, D.L., Dolton, G.L., Takahashi, K.l., and Varnes, K.L., eds., 1995, 1995 National assessment of United States oil and gas resources~results, methodology, and supporting data: U.S. Geological Survey Digital Data Series 30 [CD-ROM].
Hallmark, F.O., 1980, Unconventional petroleum resources in California: California Division of Oil and Gas Publication TR25, 17 p.
Horan, E.P., Ill, and Hopps, T.E., 1987, Exploration potential: onshore Eel River basin, Humboldt County, California, in Schymiczek, Herman, and Suchsland, Reinhard, eds., Tectonics, sedimentation, and evolution of the Eel River and associated coastal basins of northern California: Bakersfield, San Joaquin Geological Society Miscellaneous Publication 37, p. 73-82.
Hopps, T.E., and Horan, E.P., III, 1983, Subsurface stratigraphy: Eel River basin, Humboldt, County, California, in Hester, R.L., and Hallinger, D.E., eds., Selected papers of the Pacific Section 1983 annual meeting, Sacramento, California: Los Angeles, Pacific Section, American Association of Petroleum Geologists, p. 1-29.
Houghton, J.C., Dolton, G.L., Mast, R.F., Masters, C.D., and Root, D.H., 1993, U.S. Geological Survey estimation procedure for accumulation size distributions by play: American Association of Petroleum Geologists Bulletin, v. 77, no. 3, p. 454-466.
Mast, R.F., Dolton, G.L., Crovelli, R.A., Root, D.H., Attanasi, E.D., Martin, P.E., Cooke, L.W., Carpenter, G.B., Pecora, W.C., and Rose, M.B., 1989, Estimates of undiscovered conventional oil and gas resources in the United States-a part of the nation's energy endowment: United States Department of the Interior, U.S. Geological Survey and Minerals Management Service, 44 p.
Miller, B.M., Thomsen, H.L., Dolton, G.L., Coury, A.B., Hendricks, T.A., Lennartz, F.E., Powers, R.B., Sable, E.G., and Varnes, K.L., 1975, Geological estimates of undiscovered recoverable oil and gas resources in the United States: U.S. Geological Survey Circular 725, 78 p.
NRG Associates, Inc., 1992, The significant oil and gas fields of the United States (through December 31, 1990): available from Nehring Associates, Inc., P.O. Box 1655, Colorado Springs, CO 80901.
U.S. Geological Survey National Oil and Gas Resource Assessment Team, 1995, 1995 National assessment of United States oil and gas resources: U.S. Geological Survey Circular 1118, 20 p.
Wilkinson, E.R., 1963, Hollister field: California Division of Oil and Gas Summary of Operations, California oil fields, v. 49, no. 1, p. 27-37.
--1967, Hollister field, in Gabilan Range and adjacent San Andreas fault: Pacific Sections, American Association of Petroleum Geologists and Society of Economic Paleontologists, Field Trip Guidebook, p. 95-98.
*U.S. ~ PRIN.l'DI; OFFICE: 1995- 673-046/86092

SELECTED SERIES OF U.S. GEOLOGICAL SURVEY PUBLICATIONS
Periodicals
Earthquakes & Volcanoes (issued bimonthly). Preliminary Determination of Epicenters (issued monthly).
Technical Books and Reports
Professional Papers are mainly comprehensive scientific reports of wide and lasting interest and importance to professional scientists and engineers. Included are reports on the results of resource studies and of topographic, hydrologic, and geologic investigations. They also include collections of related papers addressing different aspects of a single scientific topic.
Bulletins contain significant data and interpretations that are of lasting scientific interest but are generally more limited in scope or geographic coverage than Professional Papers. They include the results of resource studies and of geologic and topographic investigations, as well as collections of short papers related to a specific topic.
Water-Supply Papers are comprehensive reports that present significant interpretive results of hydrologic investigations of wide interest to professional geologists, hydrologists, and engineers. The series covers investigations in all phases of hydrology, including hydrogeology, availability of water, quality of water, and use of water.
Circulars present administrative information or important scientific information of wide popular interest in a format designed for distribution at no cost to the public. Information is usually of short-term interest.
Water-Resource Investigations Reports are papers of an interpretive nature made available to the public outside the formal USGS publications series. Copies are reproduced on request unlike formal USGS publications, and they are also available for public inspection at depositories indicated in USGS catalogs.
Open-File Reports include unpublished manuscript reports, maps, and other material that are made available for public consultation at depositories. They are a nonpermanent form of publication that may be cited in other publications as sources of information.
Maps
Geologic Quadrangle Maps are multicolor geologic maps on topographic bases in 7 ~-or 15-minute quadrangle formats (scales mainly 1:24,000 or 1 :62,500) showing bedrock, surficial, or engineering geology. Maps generally include brief texts; some maps include structure and columnar sections only.
Geophysical Investigations Maps are on topographic or planimetric bases at various scales; they show results of surveys using geophysical techniques, such as gravity, magnetic, seismic, or radioactivity, which reflect subsurface structures that are of economic or geologic significance. Many maps include correlations with the geology.
Miscellaneous Investigations Series Maps are on planimetric or topographic bases of regular and irregular areas at various scales; they present a wide variety of format and subject matter. The series also includes 7 ~-minute quadrangle photogeologic maps on planimetric bases that show geology as interpreted from aerial photographs. Series also includes maps of Mars and the Moon.
Coal Investigations Maps are geologic maps on topographic or planimetric bases at various scales showing bedrock or surficial geology, stratigraphy, and structural relations in certain coal-resource areas.
Oil and Gas Investigations Charts show stratigraphic information for certain oil and gas fields and other areas having petroleum potential.
Miscellaneous Flield Studies Maps are multicolor or black-andwhite maps on topographic or planimetric bases on quadrangle or irregular areas at various scales. Pre-1971 maps show bedrock geology in relation to specific mining or mineral-deposit problems; post-1971 maps are primarily black-and-white maps on various subjects, such as environmental studies or wilderness mineral investigations.
Hydrologic Investigations Atlases are multicolor or black-andwhite maps on topographic or planimetric bases presenting a wide range of geohydrologic da1ta of both regular and irregular areas; principal scale is 1:24,000, and regional studies are at 1:250,000 scale or smaller.
Catalogs
Permanent catalogs, as well as some others, giving comprehensive listings of U.S. Geological Survey publications are available under the conditions indicated below from the U.S. Geological Survey, Books and Open-File Reports Sales, Federal Center, Box 25286, Denver, CO 80225. (See latest Priice and Availability List.)
"Publications of the Geological Survey, 1879-1961" may be purchased by mail and over the counter in paperback book form and as a set of microfiche.
"Publications of the Geological Survey, 1962-1970" may be purchased by mail and over the counter in paperback book form and as a set of microfiche.
"Publications of the Geological Survey, 1971-1981" may be purchased by mail and over the counter in paperback book form (two volumes, publications listing and index) and as a set of microfiche.
Supplements for 1982, 1983, 1984, 1985, 1986, and for subsequent years since the last permanent catalog may be purchased by mail and over the counter in paperback book form.
State catalogs, ';'List of U.S. Geological Survey Geologic and Water-Supply Reporlts and Maps For (State)," may be purchased by mail and over the counter in paperback booklet form only.
"Price and Availlability List of U.S. Geological Survey Publications," issued annually, is available free of charge in paperback booklet form only.
Selected copies 1[)f a monthly catalog "New Publications of the U.S. Geological Sunrey" are available free of charge by mail or may be obtained over the: counter in paperback booklet form only. Those wishing a free subscription to the monthly catalog "New Publications of the U.S. Geological Survey" should write to the U.S. Geological Survey, 582 National Center, Reston, VA 22092.
Note.-Prices of Government publications listed in older catalogs, announcements, and publications may be incorrect. Therefore, the prices charged may differ from the prices in catalogs, announcements, and publications.
