the cheese industry
TRANSCRIPT

<3
THE CHEESE INDUSTRY
o .<^ 33 33 >C=7 mc ,•
oo5 m -o
-Mm -—-o
rn3i po-n
?i CX3 '. cr»
- ' —I á is
0^ :TJ—j TWO -<= CPZ CyO m
U.S. DEPARTMENT OF AGRICULTURE
ECONOMIC RESEARCH SERVICE
AGRICULTURAL \ ECONOMIC REPORT NO. 2 94 V

THE CHEESE INDUSTRY, By Harold W. Lough. Economic Research Service, U.S. Department of Agriculture. Agricultural Economic Report No. 294.
ABSTRACT
The structure and organization of cheese manufacturing and distribution are described. Emphasis is placed on factors affecting the industry such as Government regulation, economic signals, technology, dairy business policies, and competing products, and on special areas of concern such as whey disposition. Trends in pro- duction, imports, stocks, and prices are included. Results of a national sample survey of 225 cheese plants are presented.
Keywords: Cheese, production, distribution, structure, organization, pricing, whey,
Washington, D. C. 20250 July 1975

CONTENTS Page
Sunnnary ...•••. ...•..•••• « ^^
Introduction. , ,, 1
Trends 2 Milk Utilization. !..!!!.!.!.! 2 Production. •.••.••...... , 2 Imports , , 5 Commercial Stocks , 6 Price Spreads , 6
Regulation 9 Federal Price Support ,...•.«•..... 9 Import Restrictions 10 Quality Regulation 11
Manufacture of Natural Cheese , 12 Number and Size of Plants , 12 Production Areas 16 Milk Supply 19 Plant Organization , 24 Manufacturing Technology and Capacity 25 Product Description 29 Whey Byproducts , 30
Intermediate Distribution of Natural Cheese 31 Distribution Channels , 31 Pricing at the Manufacturing Level 36
Manufacture of Process Cheese 36 Description • 36 Plants and Production Regions 36 Organization • 37
Distribution of Natural and Process Cheese. • 38
Other Sources of Cheese • 39 Imported Cheese • • • • • 39 Cheese Analogs • ^3
Literature Cited. ^^
General References ^^
Appendix A—Tables ^6
Appendix B—Sample and Survey Procedure...••..• ^3
Appendix C—Questionnaire on Structure and Organization of Cheese Plants 63

SUMMARY
Natural cheese production in the United States increased 82 percent from 1960 through 1973. The greatest increase was in Italian-type cheese, primarily Mozzarella. This production increase was achieved despite a decline in the total number of plants from 1,419 in 1960 to only 865 in 1973. Average production per plant tripled during this period to 3.1 million pounds.
Natural cheese production is still heavily concentrated in the North Central Region near the source of large milk supplies, but some cheese is manufactured in every area of the United States.
The natural cheese industry involves many different types of manufacturers and channels of distribution. Corporations manufactured 59 percent of the total natural cheese in 1973; cooperatives, 33 percent; and individual proprietors and partners, only 8 percent. From the manufacturer, cheese usually moves through integrated inter- mediate distributors and cheese processors to final distribution.
There are many different forms and styles of natural cheese for each cheese type or variety. One-third of American-type cheese was manufactured in 40-pound blocks in 1973 and over half was in bulk (500-pound barrels and 640-pound blocks). Cheese was stored at the plant for "aging" an average of 20-50 days for American-type, 180 days for hard Italian-type, and 60 days for Swiss.
Whey disposition methods are changing in response to changing farming methods, pollution standards, and economic values. In 1973, over half of the whey was further processed by cheese manufacturing plants, less than a fourth was sold for further processing, and the rest was either fed to livestock or disposed of.
ii

THE CHEESE INDUSTRY by Harold W. Lough
Commodity Economics Division Economic Research Service
INTRODUCTION
This report describes the manufacture and distribution of the principal types and varieties of natural cheese. Both the nature of the businesses involved and the operations performed in arriving at the final cheese products are examined.
The description of the businesses includes their structure and organization and many of the factors which affect them, such as Government regulation, economic signals, technology, dairy business policies, and competing products. The discussion includes cheese manufacture, storage, transportation, exchange, and product standardization. Sources of information include previous reports, personal interviews with industry representatives, and a survey of cheese manufacturing plants conducted in April 1974.
Natural cheese production in the United States in 1973 totaled 2.685 billion pounds (18). 1/ Many varieties of natural cheese are manufactured in the United States, each with distinctive flavor, body, and texture. For convenience through- out this report, certain varieties are included under group headings. The principal group or type of cheese is American, which includes the specific varieties Cheddar, Colby, Granular, Stirred curd. Washed curd, and Monterey Jack. This group accounted for 62 percent of total U.S. cheese production in 1973. Cheddar accounts for over 78 percent of American-type production.•
The Italian group includes the varieties Mozzarella, Ricotta, Provolone, Parmesan, and Romano. This group accounted for over 21 percent of total U.S. cheese production in 1973, of which two-thirds was Mozzarella.
All other cheeses referred to in this report are specific varieties. The Swiss cheese variety was 6 percent of total production in 1973 and the Cream cheese variety was 5 percent. Other varieties, primarily Blue, Brick, Limberger, Muenster, and Neufchatel, accounted for the remaining 6 percent of production. Cottage cheese is not covered in this report.
Natural cheese is distributed through several alternative market channels. How- ever, more differences occur among the types of businesses handling distribution and the functions they perform than among the types or varieties of cheese. The same business may handle different cheese types or varieties.
Natural cheese is treated as a single industry in this report. In practice, however, manufacture of cheese and other dairy products, especially fluid milk, butter.
1/ Underscored numbers in parentheses refer to items in Literature Cited, p. 44

and nonfat dry milk, are closely interrelated through relative prices. Federal programs, manufacturing flexibility among manufactured dairy product plants, and the fluid and manufactured dairy product policies of corporate and cooperative businesses. These make it difficult to study any dairy product separately. Although these factors are acknowledged in this report, they are difficult to quantify and will be given only brief attention.
TRENDS
Milk Utilization
Final dairy products, including fluid milk, cheese, butter, ice cream, and others, competed for milk supplies. Cheese production is utilizing an increasing proportion of milk in relation to most other manufactured dairy products. Total miik supply from
1960 through 1973 ranged from 115.4 billion pounds to 127.0 billion pounds. About half was utilized for all manufactured dairy products (fig. 1). During this same period, the proportion of total milk used for the manufacture of cheese almost doubled from 11 to 20 percent. Cheese production utilized a record 23.2 billion pounds of
milk in 1973.
Production
Natural cheese production increased 96 percent from 1960 through 1974 (tables A.2-A.7). Almost half of this increase came during 1971-74.
Although production increased for all cheeses, the rate of increase varied among types and varieties (fig. 2). The greatest percentage increase was in Italian-type cheese, where production in 1974 was over 3.8 times greater than in 1960, American- type cheese also showed a large increase, with production in 1974 up 84 percent from 1960. The two other major cheese varieties, Swiss and the combination of Cream and Neufchatel, increased 50 and 37 percent, respectively.
Natural cheese production is highly seasonal since it depends on fluctuating milk supplies. In recent years it has been highest during the summer months of the flush milk season, generally declining in late June through November, and increasing in December through mid-June. American-type and Swiss cheeses have followed this general seasonal production pattern, with the highest production in the summer and the lowest in the spring and winter. Italian-type cheese production has also peaked in summer, but production has been lowest in the fall and has generally risen through the winter and spring. In contrast, Cream and Neufchatel cheeses combined have had the highest production in the winter with relatively lower production during the other seasons, due to the heavy seasonal demand during the winter holidays.
A large proportion of natural cheese is further processed into pasteurized process cheese products. Production of process cheese was 720.7 million pounds in 1973, one-fourth of the production of natural cheese (natural equivalents). 2/ Production of process cheese foods, spreads and cold pack was 441.8 million pounds in 1973, or about 11 percent of total natural cheeses produced (natural equivalents).
The production of process cheese increased about 60 percent from 1960 to 1973 (fig. 3), and output of process cheese foods, spreads, and cold pack about doubled
2/ Natural equivalent is the pounds of natural cheese used to produce cheese proces- sed products. There is approximately 0.9 pound of natural cheese in 1 pound of process cheese and approximately 0.65 pound of natural cheese in 1 pound of process cheese foods, spreads, and cold pack cheese food.

UTILIZATION OF MILK SUPPLY FOR ALL MANUFACTURED
DAIRY PRODUCTS AND CHEESE BIL. LBS. riMilk
140- riAII manufactured
dairy products
120-~ n Cheese
100-
80-
60 - ^ f] 1 (1 M fi M M
40-
20-
n
1 pL r-l-i II
1960 '62 '64 '66 '68 '70 '72 '74 SOURCE: APP. A.
USDA NEC. ERS 1083-75 (4)
Figure 1
3

PRODUCTION OF SELECTED NATURAL CHEESES
Cream and Neufchatel Other natural
I960 '62 '64 '66 '68 70 '72 '74 SOURCE: APP. A.
USDA NEC. ERS 1084-75 (4)
Figure 2
4

PRODUCTION OF PROCESS CHEESE PRODUCTS WL LBS.
0.8
0.6
0.4 H
0.2
Process cheese foods, 4 spreads, and cold pack ^^
-\
1960 '62 -n—I—\—\—\—\—\—\—r- '64 '66 '68 '70 72 '74
SOURCE: APP. A.
N£G. ERS 1085 ■ 76 (4)
Figure 3
However, the proportion of natural cheese used in process cheese products has declined in recent years.
Compared with natural cheese, seasonal variations in the production of process cheese products are relatively small. However, production is slif;htly higher in the fall and often lower in sur.imer than in winter.
Imports
A high proportion of total imports, 68 percent in 1973, is subject to quotas (discussed later). Total imports of cheese, although showing large fluctuations from time to time, increased overall since 1960 (fig. 4). In 1974, imports of cheese totaled a record 316 million pounds, equal to 10.9 percent of domestic production.
Imports of American-type cheese were equal to 6.1 percent of domestic American natural production and imports of Italian-type cheese, to 4.4 percent of domestic Italian production, in 1974. Imports of Swiss cheese were 43.5 percent of domestic Swiss production.
Recently, imports of American-type and Swiss cheeses have been highest in winter and lowest in the summer. Imports of Italian-type cheeses have been greatest in the spring and winter.

SELECTED CHEESE IMPORTS MIL LBS
loo-
se
60 H
40
20
^^
a ..'l^^^^i«'
4^1,4«»,
American
/ V ' Swiss / I
Italian / A \ ....♦•""••"..,.»»* ^ /
1960 '62 '64 '66 '68 ^ \ I r^ 70 72 74
SOURCE: /fF.A.
USDA NEC. ERS1086-75 (41
Figure 4
Commercial Stocks
Year-end stocks of all cheese ranged from 304 to 494 million pounds during 1960- 74 (tables A.15-A.18 and fig. 5), and avRraged 356 million pounds. Although the quantity of total cheese stocks showed no trend during this period, stocks generally declined as a proportion of total annual production since 1960. Year-end stocks were as high as 29 percent of production during 1961 and as low as 13 percent during 1971-73. This trend was reversed in 1974 with ending stocks increased to 17 percent of production.
Over the past few years, stocks have been highest in the summer and early fall, following the peak spring production season. They have usually been reduced during the winter months.
Price Spreads
The retail price of an 3-ounce package of process American cheese increased about 80 percent from 1960 to 1973 (table 1). During this period the farm value doubled and the farm-retail price spread increased from 19.0 to 30.6 cents. The farm-retail price spread as a proportion of the retail value ranged from 55.6 to 59.1 percent from 1960 through 1972. It then declined to 50.7 percent in 1973 due to record milk prices and the effect of economic controls. This spread includes the costs of assembling milk, manufacturing process cheese into the final product, packaging, and distribution.
6

COMMERCIAL STOCKS OF SELECTED NATURAL CHEESES
MIL. LBS.
460
420
380
340-
300-!
260
220- 20 ^
X/
Swiss
~ I I I I I I I I I I I I 1960 '62 '64 '66 '68 '70 '72 '74
SOURCE: APP. A.
USD A NEC. ERS 1087-75 (4)
Figure 5
7

Table 1—Farm-retail prices spreads of American process cheese, 1960-73
Year Price per 8-ounce package : Farm
* * value Retail 1/ ; I^olesale 2/ ; ^f
Farm-retail spread
Total : Wholesale-: Farm- : retail : wholesale
I960 : 33.9
1961 : 35.9
1962 : 35.7
1963 : 35.7
1964 i : 36.6
1965 ! 37.4
1966 ! 41.9
1967 : 43.6
1968 ': 44.4
1969 ¡ 47.0
1970 i 50.4
1971 : 52.8
1972 : 54.3
1973 : 60.4
19.8
19.8
19.2
20.8
21.1
21.7
25.6
25.4
26.2
28.7
30.7
31.8
33.4
39.9
Cents
14.9 19.0 14.1
15.1 20.8 16.1
14.5 21.2 16.5
14.8 20.9 14.9
15.1 21.5 15.5
15.3 22.1 15.7
18.6 23.3 16.3
18.4 25.2 18.2
19.3 25.1 18.2
20.7 26.3 18.3
22.2 28.2 19.7
22.9 29.9 21.0
24.1 30.2 20.9
29.8 30.6 20.5
4.9
4.7
4.7
6.0
6.0
6.4
7.0
7.0
6.9
8.0
8.5
8.9
9.3
10.1
1/ Farm-retail spreads for food products» Econ. Res. Serv., U.S. Dept. Agr., Misc. Pub. 741, Jan. 1972. Marketing and Transportation Situation, Econ. Res. Serv., U.S. Dept. Agr.
2/ Computed from USDA Market News quotation on 5-pound loaf at Chicago.

REGULATION
Price support operations have been carried out for specified commodities since 1933. The Agricultural Act of 1949, as amended, directs the Secretary of Agriculture to support the price of manufacturing milk through purchases of dairy products. To accomplish this, the Department of Agriculture purchases at announced prices all that is offered of natural Cheddar cheese as well as butter and nonfat dry milk which meet USDA grade and packaging specifications. The Department also buys process cheese on a competitive bid basis at prices equal to the announced purchased price for natural cheese plus the additional costs of packaging and processing.
The Secretary announces the support price for manufacturing milk for each milk marketing year on or before April 1. (This price may be raised, but not lowered, during the year.) At the same time, the announcement is made of the prices USDA's Commodity Credit Corporation (CCC) will pay for natural cheese, butter, and nonfat dry milk.
USDA purchase prices are set at levels expected to support the annual average price which plants pay to farmers for manufacturing milk equal to the announced support price. In determining these purchase prices, consideration is given to developments in average processing and marketing margins, relative market prices, pro- duction, stocks, consumption of different dairy products, results of recent price support operations, relative volume of purchases, CCC stocks, and utilization in available program outlets (14, p. 17).
The above considerations are used to estimate returns to cheese plants, as well as to butter-powder plants (plants that manufacture butter from milkfat and powdered milk from the remaining skim milk), which will accomplish support price objectives. The CCC purchase price for Cheddar cheese is then calculated, using the average manu- facturing and marketing margin, to result in this return to plants. 3/
In addition to cheese purchases under the price support program, the Secretary may purchase cheese at market prices. Under Section 709 of the Food and Agricultural Act of 1965, CCC funds may be used to purchase sufficient supplies of cheese to meet the requirements of any domestic propcrams where there are insufficient stocks available for such program uses. Purchases of dairy products at market prices may also be made under Section 4a of the Agriculture and Consumer Protection Act of 1973, as amended.
Generally, purchases have varied inversely with the degree to which market prices exceed support prices. They have been a small proportion of total annual production of Cheddar cheese, taking just over 2 percent of production in the highest years. The CCC purchases under price support and Section 70? are shown in table A.16 for 1960-73.
l7~íí^"calculation"of CCC purchase prices for support of manufacturing milk at $7.24 per hundredweight which was announced on January 3, 1975, and effective through March 31, 1976:
Target returns to cheese plants per cwt. $7.24 Spread between price of mamfacturlng milk and the market value of cheese and whey fat per 1 00 pounds of milk $0.87
Market value of cheese and whey fat per 100 pounds of milk 8.11 Value of 0.25 pound of whey fat -^^ Value of other whey solids -1^ Value of cheese:
Per 100 pounds of milk i^'Ç: Per pound-rounded (using a yield of 10.1 pounds) .7725

Although either natural Cheddar or pasteurized process American cheese may be pur- chased, most purchases in recent years have been pasteurized process American cheese in 5-pound or 2-pound loaves, although there have been some current purchases of natural Cheddar cheese in 40-pound blocks. The process cheese is purchased for later delivery and may not be manufactured at time of purchase.
If necessary, cheese is stored in commercial warehouses which are inspected, approved, and under storage agreements with CCC. Process cheese usually moves im-
mediately to program outlets.
Imp^ort Res_tríetions
Import controls are authorized under Section 22 of the Agricultural Adjustment Act of 1933, as amended. Section 22 directs the Secretary of Agriculture to advise the President whenever he believes any products are being imported which will:
(a) Render or tend to render ineffective or materially interfere with any price support program or other programs relating to agricultural commodities undertaken by the Department of Agriculture, or
(b) Reduce substantially the amount of any product processed in the united States from any agricultural commodity or product included in any such program or operation.
Imports of certain specified types of cheeses have been subject to import quotas since mid-1953. Current cheese quotas are listed in table A.17.
Normally, the International Trade Commission will conduct an investigation (in- cluding a public hearing) at Presidential request on any proposed change and submit findings and recommendations to the President for decision. Many such reports have been made in recent years (20,21,23,24).
When a condition requires emergency treatment, the President is empowered to take action prior to the required investigation and report from the Commission. This was done in January 1974, when the President by proclamation temporarily increased Cheddar cheese quotas by 100 million pounds for a 3-month period ending March 31, 1974. This increase was administered by the Bureau of Customs, U.S. Department of Treasury, on a first-come, first-served basis and import licenses were not required. The quota was 99-percent filled. The subsequent International Trade Commission report to the President supported this action by its decision that the additional quantity would not interfere with the Department's price support program for milk (22).
Import controls on almost all cheeses under regular quotas are administered by the Import Branch, Foreign Agricultural Service, U.S. Department of Agriculture, through the issuance of import licenses* These licenses are issued to enable imports by type of cheese and country of origin. During the first 6 months of any quota year no more than one-half of the annual quota may be allocated. Thus, the quotas are allocated under licenses issued on January 1 and July 1 of each quota year. The unused portion of a licensed share cannot be carried forward to the next year«
Quotas on Canadian natural Cheddar cheese made from unpasteurized milk and aged not less than 9 months are administered by the Bureau of Customs on a first-come, first-served basis. One-half of the 1.2-million-pound quota is open on January 1, and the balance on July 1. The quota is usually filled shortly after each opening date.
10

Quality^ Regulation
Milk
All surplus Grade A milk which is made into cheese has relatively uniform standards of farm inspection for sanitation. These standards set by State and local authorities are based on the 'trade A Pasteurized Milk Ordinance—1965 Recommendations of the U.S. Public Health Service."
Requirements for inspection of farms with manufacturing grade milk vary widely among States. As of late 1974, all but six States required farm inspection. At that time, all but six States also had plant inspection requirements specifically for dairy manufacturing plants. All States have basic food laws covering food items in intra- state commerce.
A USDA-recommended standard for State adoption covering both farm and plant in- spection was created in 1963 and revised in 1972 (3). \-lhen adopted by the States, these recommended requirements covering farm facilities, milk quarters, and processing plants would give uniformity to sanitation standards for manufacturing-grade milk. Most States have laws and regulations that are in accordance in part or totally with the USDA recommendations.
Quality control of manufacturing grade milk is largely done at the procurement stage by the cheese manufacturing firms. If there are milk quality problems a plant fieldman consults with the producer. For cheese manufactured in plants surveyed under the USDA voluntary plant inspection service there are requirements for milk quality including checks on plant records for bacteria and sediment tests on producer*s milk, and USDA testing for the bacteria count of mixed milk in plant storage tanks (16).
Domestic Cheese
All food products, including cheese, moving in interstate commerce are subject to requirements of the Food, Drug, and Cosmetic Act, which is administered by the Food and Drug Administration (FDA), U.S. Department of Health, Education, and Welfare.
USDA offers an inspection service which is required of all cheese plants (and butter and dry milk plants) selling to the CCC under the dairy price support program, and available to plants requesting grading for commercial transactions. Under this program cheese plants are inspected at least twice yearly for milk quality, sanitary practices, condition of the plant and equipment, and processing procedures. A fee is charged to cover the cost of inspection. This program has received wide industry par- ticipation not only because it is required of plants seeking to qualify for Government sales, but also because it is a valuable aid in improving product quality, marketing, and internal management. In 1973, 55 percent of all cheese plants, including almost all large plants, used this inspection service.
The FDA provides regulations concerning the pasteurization of milk and the curing, labeling, and composition of cheese entering interstate commerce. Cheese produced and marketed within a State is regulated under State standards. In general. State com- positional standards closely follow Federal standards (15).
ImpQrted Cheese
Imported cheese must meet the same standards as domestically produced cheese. The FDA is charged with inspection under the Food, Drug, and Cosmetic Act. The Bureau of Customs notifies FDA of shipments and FDA then either clears or inspects for
clearance.
11

MANUFACTURE OF NATUR.\L CHEESE
Natural cheese is generally manufactured by plants located in rural communities near the source of milk supplies. In the past, numerous plants in the major cheese- producinçr areas often received milk hauled in every day by producers. The plants were usually small family-owned or local cooperative businesses.
Recent changes in economics, institutions, technology, and transportation have resulted in larger, more x^idely spaced plants. Some are highly efficient, capable of running 24 hours a day, 7 days a week. They obtain milk supplies from producers over a broad area and may be supplied in part by nearby smaller plants which act as receiv- ing stations and send their milk to the central plant.
Much of the information in both this section of the report and in a later section on intermediate distribution is' derived from a national survey of cheese niants con- ducted in April 1974. The survey procedure is described in appendix B and a copy of the survey questionnaire is included in appendix C. The results are generally reported for three regions and the total United States. In 1973, Kegion 1 (Wisconsin) produced 40 percent of U.S. cheese, Region 2 (V/est North Central—Iowa, Kansas, Minnesota, Missouri, Nebraska, North Dakota, and South Dakota) produced 23 percent, and Region 3 (all other States) produced 32 percent. Regions reported in tables 3 and 4 are standard Statistical Reporting Service regions.
The number of plants manufacturing natural cheese is declining and average plant production is increasin^ï (table 2), The exception is for Italian-type cheese, which had more plants in 1973 than in 1950. Many cheese plants manufacture more than one type of cheese, so the average production oí all plants in table 2 is irreater than the average plant production of any one cheese type.
In 1973 tiiere were 865 cheese plants, down from 2,159 niants in 1950. Average production per plant was 3.1 million pounds in 1973 compared with 552,000 pounds in 1950. The Nortti Atlantic and the North Central regions had the greatest number of plants in 1972 (table 3). The proportion of plants produciníí less than 1 million pounds annually was 66 percent in the North Atlantic, 36 percent in the North Central, 23 percent in the South, and 55 percent in the West.
Recent years have shown a pattern of decreasing numbers of smaller plants and increasing numbers of larger plants (table 4). Cheese plants m.anufacturing 2 million or more pounds annually represented 9 percent of all plants in 1957, 14 percent in 1963, and 37 percent in 1972. The exception to the general decline in smaller plants is Italian-type cheese, which has sliown increases in the number of plants manufactur- ing 50,000 pounds or less annually as well as in the plants making over 2 million
pounds annually.
Although large plants represent a small proportion of total plant numbers, they account for a sizable proportion of production (table 5). The total 1973 output of American-type cheese could have been produced by only 53 plants in the largest pro- duction size category, instead of by the actual 592 plants. Similarly, the number of Italian-type cheese plants could iiave been cut from 189 to 20 and the number of Swiss cheese plants, from 75 to 16. These comparisons assume the plants would be geograpliically located to minimize milk procurement costs, which is not presently possible since milk production concentration varies considerably by State.
The survey results indicate tliere were an average of 20 employees per cheese manufacturing plant in 1973 (table 6). On this basis the total number of such em-
12

Table 2--Number and average production of natural cheese manufacturing plants, selected years, 1950-73
Cheese type or variety Total American : Italian ; Swiss
Year ; Plants :
Average plant
production : Plants
: Average ; : plant : : production •
Plants : Average : plant : production •
• Plants : Average : plant : production
Number 1,000 pounds Number
1,000 pounds Number
1,000 pounds Number
1,000 pounds
1950 : 1,621 551 167 370 284 350 2,159 552
1955 • 1,358 740 158 544 228 512 1,789 764
1960 : 1,008 988 193 816 164 738 1,419 1,042
1965 : 864 1,341 182 1,343 123 998 1,209 1,452
1970 : 669 2,128 197 1,998 90 1,600 963 2,286
1973 : 592 2,825 189 2,991 75 2,190 865 3,104
Source: (18)

Table 3--Number of plants producing cheese by size group and region, 1972
Cheese type or variety by region
Total cheese plants
Production size groups (thousand pounds)
Less than 50
50- 99
100- 174
175- 249
250- 499
500- 749
750- 999
1,000- 1,499
1,500- 1,999
2,000- 2,999
3,000- 4,999
5,000- 9,999
10,000- 19,999
20,000 and
over
North Atlantic American Italian Swiss All types 1/
North Central American Italian Swiss All types 1/
South American Italian Swiss All types II
West American Italian Swiss All types 1/
United States American Italian Swiss All types 1/
28 83 7
133
480 89 60
640
45 10 2
52
60 17 7
76
613 199 76
901
4 21
25
17 5 3
11
8 2 1
11
34 32 4
53
11 8 4
17
1 12
15
8 16 3
24
17 4 6
22
3 10 2
16
43 6
17 67
11 2
12
57 18 19 95
46 7
11 66
53 13 13 78
1 4
56 3 1
70
66 8 1
86
Number
1 7 2
10
79 3 2
97
4 3 1
10
87 14 5
120
60 9 3
66
64 14
91
13 1
13
3 4 1 1
— 1 3 4
65 81 12 19
3 1 73 114
2 8
12
43 14 6
66
12 1
12
61 25 6
96
29 15
47
7 1 2
11
44 21 5
70
1 4
13 5 5
25
18 6 6
36
11 2
15
11 3
17
— = 0 1/ Plants making American, Italian, and Swiss are also included in counts, but a plant is counted only once if it makes more than one
type. (Excludes plants making cottage cheese.)
Source: Dairy Products, Statis, Rptg. Serv., U.S. Dept. Agr., Jan. 1974.

Table 4—Number of plants making cheese, by production size group and region, 1957, 1963, and 1972
Output per plant
; North Atlantic • North Central • • South West * United States •
(1.000 lbs.) : 1957 : 1963 : 1972 : 1957 : 1963 : 1972 : 1957 : 1963 : 1972 : 1957 : 1963 : 1972 : 1957 : 1963: 1972
Number
Less than 50 : 36 30 25 46 31 11 4 9 6 19 11 11 105 81 53
50-99 : 18 12 8 33 13 5 — 3 1 7 4 3 58 32 17
100-249 : 31 27 24 195 86 14 6 5 2 20 9 6 252 127 46
250-499 : 20 22 16 341 200 67 5 3 — 19 18 12 385 243 95
500-749 : 12 7 8 238 180 66 6 2 — 16 14 4 272 203 78
750-999 : 7 7 7 131 122 70 9 10 3 7 4 6 154 142 86
1,000-1,499 : 10 12 10 133 128 97 8 7 3 14 14 10 165 162 120
1,500-1,999 : 9 5 4 46 91 66 11 10 ~ 2 7 3 68 113 73
2,000 or more : 13 23 31 88 116 244 33 28 37 10 12 21 144 179 333
2,000-2,999 : • N.A. N.A. 6 N.A. N.A. 91 N.A. N .A. 13 N.A. N.A. 4 N.A. N.A. 114 3,000-4,999 : ■ N.A. N.A. 12 N.A. N.A. 66 N.A. N .A. 12 N.A. N.A. 6 N.A. N.A. 96 5,000-9,999 : N.A. N.A. 7 N.A. N.A. 47 N.A. N .A. 11 N.A. N.A. 5 N.A. N.A. 70 10,000-19,999: N.A. N.A. 4 N.A. N.A. 25 N.A. N .A. 1 N.A. N.A. 6 N.A. N.A. 36 20,000 or : more : N.A. N.A. 2 N.A. N.A. 15 N.A. N .A. — N.A. N.A. — N.A. N.A. 17
Total plants: 156 145 133 1,251 967 640 82 76 52 144 94 76 1,603 1,282 901
N.A. = Not available. 0.
Source: Plants Manufacturing Dairy Products by Production-Size Groups and Geographic Distribution, 1957, Agr. Mktg. Serv., U.S. Dept. Agr., AMS-301, Mar. 1959; Plants Manufacturing Dairy Products by Production-Size Groups and Geographic Distribution, 1963, Statis. Rptg. Serv., U.S. Dept. Agr., SRS-5, Mar. 1965; and Plants Man- ufacturing Dairy Products by Production-Size Groups and Major Regions, United States, 1972, Statis. Rptg. Serv., U.S. Dept. Agr., Dairy Products, Feb. 1974.

ployees in the United States in 1973 was 17,300, American-type cheese plants averaged only 16 employees for all plant sizes, equivalent to 9,472 employees for all
American plants in 1973.
Product i on Areas
Wisconsin is the leadin?; State in the production of each of the mai or cheese types and varieties v7Íth the exception of Swiss. Its share of total natural cheese pro- duction declined slif^htly in recent years from 43.1 percent in 1970 to 39.9 percent in 1973.
Ame ri can-Type Ciieese
Production of Aiiierican-type cheese is heavily concentrated in the north central area of the United States near lar^e milk supnlies (table 7). Re<?ion 1 produced 43
Table 5—Number and production of large cheese plants, 1972
Cheese type Size group
(annual product ion) : Plants Product ion
1,000 1,000 pounds Number Percent pounds Percent
American : 20,000+ 11 1,8 345,572 21.0
Italian : 20,000+ 3 1.5 83,975 16.4
Swiss : 10,000+ 6 7.9 60,000 33.8
Total : 20,000+ 17 1.9 564,498 21.7
Source: Dairy Situation, Econ. Res. Serv., U.S. Dept, Agr•, July 1974.
Table 6—Average number of employees per plant, 1973
Plant size 2/ Region 1/
Small Medium •
. Large ; All sizes
Number
1 5 30 102 15
2 12 27 93 32
3 : 11 35 77 22
Total U.S. : 8 31 90 20
1/ Region 1: Wisconsin; Region 2: Iowa, Kansas, Minnesota, Missouri, Nebraska, North Dakota, and South Dakota; Region 3: All other States.
2/ Small: Less than 2 million pounds annually; Medium: 2-9.9 million pounds annually; Large: 10 million pounds or more annually,
16

percent of American-type cheese in 1973. Region 2 produced 34 percent, accounted for 97 percent of American-type cheese production in 1973.
Twenty States
Although Wisconsin is by far the largest producer of American-type cheese, it ranked 15th in average plant production in 1973, well below the U.S. average. Tn con- trast, all States in the West North Central region ranked above the national average in plant production. Wisconsin had 315 plants producing American-type cheese, while Minnesota with only 18 plants produced a third as much as V/isconsin.
Until recently, cheese production was concentrated relatively more in Wisconsin than in other areas while butter-pox^7der (nonfat dry milk) production was concentrated relatively more in Minnesota. Although Wisconsin has many new production facilities, it retains numerous older plants,
Minnesota has entered the cheese industry more strongly in recent years. It has a greater proportion of large plants than Wisconsin and uses newer technology for several reasons. First, Minnesota is one of the centers of the cooperative merger and consolidation movement. Second, butter plants had already consolidated to some degree in Minnesota. Therefore, when the demand for cheese increased, it was relatively easier to build large cheese plants because of established procurement and transpor- tation systems. Finally, there has been an increased demand for fluid milk in the traditional cheese-producing area of Wisconsin. Fluid milk has first call on milk
Table 7--Leading States producing American-type cheese, 1973
State : Total : Average plant : production production 1/
1,000 pounds
Wisconsin 720,104 2,686 (15) Minnesota 24,560 13,646 (1) Iowa 97,487 4,874 (2) Missouri 71,834 3,991 (3) New York 61,212 3,826 (5) Idaho : 50,794 3,175 (9) North Dakota 50,794 3,132 (10) Kentucky 47,216 3,935 (4) South Dakota : 45,298 2,831 (12) Utah : 36,592 2,614 (13) Kansas 32,619 3,262 (8) Nebraska 31,212 3,121 (11) Tennessee 25,302 2,109 (17) Oregon 20,844 3,474 (6) Illinois 17,145 1,072 (20) Indiana : 16,840 3,368 (7) Ohio 16,823 2,403 (14) Michigan 14,538 1,454 (18) Vermont 13,032 2,172 (16) Washington 8,626 1,232 (19)
20 State total : 1,623,253
U.S. total : 1,672,515 2,825
JL/ Rank in average plant production given in parentheses. Source : (18)•
17

supplies because it returns a higher price. Further expansion of fluid markets in and near Wisconsin is likely to reduce the proportion of cheese produced in that State in the future. Present trends indicate Minnesota, Iowa, the Dakotas, and Nebraska will supply an increasing proportion of expanding cheese demands.
Since American-type cheese production is so heavily concentrated in several areas, a large proportion is shipped out for consumption. For example, an estimated 95 per^ cent of the cheese produced in Wisconsin is exported outside the State.
Utah and Idaho together accounted for over 5 percent of the U.S. production of American-type cheese in 1973. This area has a large supply of milk with a limited fluid market. A sizable cheese manufacturing industry has developed there largely for shipment to the west coast, which produces little American-type cheese. Substantial amounts of cheese also flow from the North Central Region to Utah and Idaho where it is further processed for the west coast market.
New York was fifth in the production of American-type cheese and fifth in average plant production in 1973. However, cheese manufacturing in New York differs from that in many other regions. Production is partially from surplus Grade A milk and although butter-powder production is the primary balance for fluid milk in New York, cheese pro- duction is also subject to a variable supply of milk both seasonally and within the week. Some plants, even large ones, shut down entirely during winter when milk production is short. In contrast to the North Central Region, only small amounts of American-type cheese are produced in New York for further processing. Instead it is generally aged for retail sale as natural cheese, usually in the East, South, and Midwest.
Kentucky, which ranked eighth in production and fourth in average plant production, benefited from high cheese prices in 1973 and received a large amount of surplus Grade A milk for cheese manufacturing. In addition, there is a large amount of manufacturing- grade milk in Kentucky and Tennessee, much of which goes into cheese production. Most is bulk cheese, packed in barrels and used for further processing.
Other States, such as Oregon and Vermont, have established themselves in the retail market as makers of quality American-type cheeses. However, they make,only a small proportion of total U.S. production.
Italian-Type Cheese
Ten States produced 79 percent of the Italian-type cheese in the United States in 1973 (table 8). The leading State in production was Wisconsin, while the leading State in average plant production was Minnesota. Other important production areas are in the Northeast and California. The Northeastern States have a long tradition of production, while California has recently become a major producer, primarily of Moz- zarella cheese.
Italian-type cheese production has been concentrated in the North Central Region and New York since Italian cheesemakers originally settled in those areas. Those areas best duplicated the climate of the Old World production areas, which was im- portant in the production and storage of cheese.
Small Mozzarella plants account for practically all of the cheese production in the Northeast. The Mozzarella produced in this area has a higher moisture content and is thus more perishable than the Mozzarella produced in Wisconsin. The higher-moisture Mozzarella is primarily used in the home, whereas most of the low-moisture Mozzarella made in Wisconsin is utilized by the institutional trade.
18

Table 8--Leacling States producing Italian-type cheese, 1973
State Production : Average plant : production 1/
1,000 pounds
Wisconsin 199,674 3,503 (5) New York 81,430 2,908 (7) California 35,584 3,558 (4) Nebraska 34,850 6,970 (2) Minnesota : 21,297 7,099 (1) Vermont 19,773 3,296 (6) Illinois : 18,072 1,807 (8) Washington 14,315 3,579 (3) New Jersey 12,361 1,124 (9) Pennsylvania : 10,502 808 (10)
10 State total 447,858
U.S. total : 565,270 2,991
II Rank in average plant production given in parentheses. Source: (18)
Swiss cheese production is much more concentrated geographically than either American or Italian-type production. In 1973, four States produced over two-thirds of the U.S. Swiss cheese. Illinois had the highest production (29 percent of the U.S. total) and a high average plant production due to its few large plants. Wisconsin was second in Swiss production with 22 percent of the total. Many of the plants are small and located in the traditional Swiss cheese producing area of southwest Wisconsin, while a few large plants are located in other areas. Other States with significant amounts of Swiss production x^ere Utah, Ohio, and Pennsylvania.
Milk Supply
Milk used for the manufacture of cheese generally moves a short distance to the plant, in contrast to milk used for fluid purposes which may go hundreds of miles. In the past local milk routes were the transferrable property of individual haulers. However, with the transition of most routes to bulk pickup, there has been a movement away from the individual owning one route toward the manufacturing firm supplied by one organization. The trend has been toward either an independent hauler serving the entire cheese business or the business itself providing all assembly services.
Producers are generally '^rice takers" as opposed to "price setters", with manu- facturing plants setting the mük price based on their returns. Smaller manufacturers primarily consider the prices paid by competing buyers.
Although plants compete vigorously for raw milk, price competition is generally deemphasized. Rather, competition is through the assembly functions. Examples of competitive practices used occasionally are subsidized hauling, patronage refunds, premiums based on fat solids or a combination of fat solids and nonfat solids, farm supplies sold at a reduced cost, money advanced against future milk checks, group in- surance plans, fieldman service for physical improvements such as bulk tanks, market information, and integrity (prompt payment of the milk check over time). The manu-
19

facturer offers these advantages in assembly services to help earn the goodwill of producers and assure a steady supply of milk to the plant.
Sources of Milk
Producers are the main source of milk for the manufacture of cheese (table 9). In 1973, bulk producers supplied 57•5 percent, can producers 8.2 percent, producer cooperatives 18.2 percent, and other plants and receiving stations 16,1 percent. Larger plants got less of their total supply directly from producers and more from cooperatives and other plants and receiving stations. Producer milk in cans was a very small part of total milk supply for the large plants.
The manufacturers of American-type cheese obtained relatively more milk directly from producers than did the manufacturers of all cheese (table 9). Can producers supplied 10 percent of the milk to American-type cheese m.anufacturers.
Table 9—Average sources of milk used in cheese production, 1973
Plant size 11 ; All s
. Small : Medium : Large
Izes Source American : All rAmerican i: All American : All :American : All
cheese :cheese : cheese :cheese , cheese :cheese : cheese : cheese
Percent
Individual producers, bulk ■ 70.2 61.9 70.9 60.4 58.3 53.1 66.2 57.5
Individual producers, can ■ 20.0 18.6 10.2 9.2 4.4 3.1 10.1 8.2
Directly from producer cooperatives : 4.5 8.9 9.7 16.5 16.2 23.6 11.0 18.2
Other plants or receiving stations : 5.3 10.6 9.2 13.9 21.1 20.2 12.7 16.1
Total : 100.0 100.0 100.0 100.0 100.0 100.0 100.0 100.0
ll See footnote 2, table 6,
Producer Description
Of the 225 survey plants, 196 reported receiving part of their milk directly from producers. The survey measured the number of producers per plant and the distance of these producers from the cheese plants. Although the number of producers was reported for both June and November 1973, it remained quite stable, so an average of these 2 months is reported.
These cheese manufacturers were supplied by an average of 134 producers per plant in 1973 (table 10) for a total of 116,000 producers shipping directly to cheese plants. Although larger plants tended to receive a smaller portion of their milk directly from producers, the average number of producers supplying these larger plants
was still much greater than the number supplying smaller plants. Region 2 averaged the highest number of producers per plant.
20

Table 10--Average number and distance of producers supplying all cheese plants, 1973
Plant size 2/ All sizes : Small : Medium : Large
Region y 'Producers
: Distance from plant
Producers
distance from plant
1Producers
Distance from plant ;
Producers
Distance from olant
Average ̂ Farthest Average Farthest Average |Farthest Average 1 Farthest
No, Miles Miles No. Miles Miles No. Miles Miles No. Miles Miles
1 42 6 15 164 13 33 654 25 54 96 9 21
2 : 71 28 79 191 30 69 579 33 90 212 30 75
3 : lOO 26 56 237 44 100 324 44 106 153 32 72
Average : U.S. : 67 16 36 197 28 66 509 35 86 134 21 48
_1/ See footnote 1, table 6. ll See footnote 2, table 6,

The producers were relatively closer to the plants in Reç^ion 1, reflecting the high density of both dairy farms and plants (table 10). Since producers in other areas were located two to three times farther from the plant. Region 1 would seemingly realize a considerable advantage in assembly costs and operations.
Larger plants must pull milk from a larger area, offsetting some of the economies of scale. However, large Wisconsin plants pulled from an area which was comparable to procurement areas of smaller plants in the other regions.
Grade of Milk
Cheese is manufactured from either surplus Grade A or manufacturing-grade milk. There has been a continuing decline in the proportion of milk which is of manufactur- ing grade, to 23 percent in 1973. However, in the principal cheese-producing areas in 1973 the proportion of total milk production of manufacturing grade was still large, 41 percent in Wisconsin (Region 1) and 55 percent in the West North Central Region (Region 2).
About 35 percent of the milk used to manufacture cheese in the United States in 1973 was surplus Grade A. Thus, about 11 percent of the total Grade A milk was used to manufacture cheese. Larger cheese plants used relatively higher proportions of Grade A milk (table 11). Plants in Region 3 (all other States) manufactured about 50 percent of their cheese from surplus Grade A milk. This reflects the large proport-
ion of fluid grade milk and the small amounts of manufacturing grade milk in parts of the region. Cheese tends to be used as an outlet for reserve supplies of fluid markets, although not necessarily the major outlet, more in parts of this area than in Regions 1 and 2. There are some problems in starting and stopping production using cheese rather than butter as a balancing operation when milk supplies are limited.
Milk Standardization
A high butterfat level, along with a high level of nonfat solids, in milk used in the manufacture of cheese results in greater cheese yields. The level of butterfat in milk may be adjusted by skimming off some of the butterfat from the milk (standardiz- ing), and selling or using that butterfat for the manufacture of butter, or by the less common method of adding nonfat solids to the milk.
Table 11—Proportion of all cheese manufactured from Grade A milk, 1973
Region 1/ Plant size 2/
Small ] Medium :
Large
Percent
1 3 22 54
2 6 19 27
3 54 44 58
Total U.S. 24 29 46
JL/ See footnote 1, table 6. 2/ See footnote 2, table 6,
22

The rate of standardization used often depends on the butterfat price and the minimum butterfat content required for a particular cheese variety. If the price of butterfat is relatively low it returns relatively more money if used in cheese, so manufacturers would choose a higher level of standardization or no standardization. With a relatively high price, butterfat would earn relatively more money in butter, so a relatively lower standardization level would be used. Thus, plants may vary the level of standardization even seasonally.
Factors other than price considerations also affect the level of standardization. The cheese buyer may not want any more than the legal minim.um fat content in the cheese. Also, many cheese plants are too small to economically standardize their milk at any level because of a small volume or lack of a market for the butterfat.
Some level of standardization was reported for 16 percent of the small plants, 53 percent of the medium-sized plants, and 43 percent of the large plants. Those plants which reported standardizing American-type cheese standardized at an average of 3.5 percent, with no differences among plant sizes. In comparison, the U.S. average butterfat content of milk received for the manufacture of American-type cheese 'was 3.78 percent in January 1973 and 3.56 percent in June 1973.
As bulk handling of milk has decreased the need for receiving stations, it has also increased the need for bulk storage at the manufacturing plant. Other pressures for increased milk storage come from the increasing variability of fluid use during the
week and an increasing reluctance of employees to work Sundays and night shifts. Thus, storage capacity is often needed to hold milk on days when cheese is not manufactured.
Milk storage capacity in cheese plants averaged 20,000 gallons per plant in 1973 (table 12). This includes milk storage capacity for all manufactured dairy
Table 12--Average milk storage capacity at all cheese plants, 1973
Region \l Plant size 2/
Small ; Medium _ •
Large ; All sizes
1,000 gallons
1 9 29 115 18
2 13 29 116 37
3 ! 9 28 57 17
Total U.S. : 9 29 95 20
\l See footnote 1, table 6, 2/ See footnote 2, table 6.
23

products. The milk storage capacity contains enough volume for approximately 2.8 days of cheese manufacturing for small plants, 1.5 days for medium-sized plants, and 2.0 days for large plants. This assumes 365 manufacturing days a year for the small, medium, and large plant size groups of 1 million, 6 million, and 15 million pounds annual cheese production, respectively.
Plant Organization
The plant survey reported 53 percent of the manufacturing plants were proprietary corporations in 1973 (table 13). These plants manufactured 59 percent of the total cheese produced. Over 22 percent of the plants were cooperatives and they produced about one-third of the cheese. The remainder of the plants, about 25 percent, were privately owned and produced only about 8 percent of production.
Dairy cooperatives have been involved in many of the changes in plant organization in recent years* From 1967 to 1970 cooperatives underwent an intensive merger movement and a few large regional cooperatives were formed in the central United States (8), The mergers were an attempt to obtain greater market stability, improved bargaining position, and increased operational efficiency for both fluid and manufacturing opera- tions. Problems involved overlapping producer procurement areas and excess or inef- ficient plant capacity. The manufactured product facilities are aids developed to assist in cooperative bargaining and maximizing Class I use. The regional cooperatives in the Midwest evolved as full-service organizations to take advantage of the market opportunities for manufactured as well as fluid products.
An intensive consolidation of manufacturing facilities, including cheese niants, followed the merger activity. Many smaller plants were closed and the remaining plants increased their volume. Consolidation ensured a continuous supply of milk to the larger plants with a few smaller plants for balancing milk supplies for the fluid market. This enabled service to the fluid market with minimum disruption of cheese
manufacturing.
Table 13—Number of plants manufacturing natural cheese and production, by type of firm, 1973
Type of firm Plants • Product ion
Number Percent 1.000 pounds Percent
Corporations : Multiunit Single unit
137 322
15.8 37.2
695,506 888,851
25.9 35.1
Cooperatives: Multiunit Single unit
55 : 138
6.4 16.0
504,846 386,690
18.8 14.4
Individual proprietors partners
and : 213 24.6 209,457 7.8
Total ': 865 100.0 2,685,350 100.0
24

M^£âcË!l,^JJlR^TechnolojTy and Capacity
Technolog)^^
Most cheeses are manufactured from whole milk although skim milk, whey, or mixtures are used for certain types of cheese. Bacterial cultures are added to a vat of milk to increase the acidity and rennet or microbial enzyme milk coagulants are added to coagulate the milk. The coagulated milk is cut, stirred, and heated, the whey is drained off, and the curd is collected or pressed. Manufacturing techniques differ by cheese type regarding (1) the composition of milk used, (2) the type of bacteria or molds used in ripening, (3) the conditions of ripening such as temperature, humidity, and length of ripening, (4) the time and extent of whey expulsion, (5) the method used to cut and form or mold the curd, (6) the amount of and method used when adding the salt, (7) the degree and method of pressing, and (8) the color added.
In the manufacture of Cheddar cheese the curd is cut into small cubes, heated, and the whey is drained off. The curd is cheddared (matted and turned for texture). Finally, the cheese is milled (cut), salted, packed and pressed into a block, hoop, or put in a barrel.
Recent new manufacturing techniques have led to an increase in plant size. In the manufacture of Cheddar cheese the most important advance has been the automation of the various manufacturing steps (9). In the standard vat system, the cooking and cheddaring are completed in the same vat; in newer systems, the whey and curd are pumped to a smaller drain table for cheddaring. Other advances permit the cheddaring to be performed mechanically and the cheese to be automatically milled, salted, weighed and hooped. All of these techniques reduce labor and increase capital requirements, generally resulting in significant cost advantages (9),
Cheddar cheese production technology in 1973 was explored in the plant survey (table 14). The number of plants reporting was not sufficiently large to allow generalizations about all Cheddar cheese production, so only a summary for the survey is given.
The survey indicates the standard vat system dominates Cheddar cheese "Manufacture in the small plants. Even in the medium-sized plants only 18 out of 70 plants reported the adoption of any further automation. Since the overwhelming majority ofi all Cheddar cheese plants are in these two size groups, it seems the capital-intensive in- creased automation techniques have not been adopted by most plants in the industry. In contrast, the large plants in ti^e survey reported much more automation. Given the
cost advantages of automation, the larger plants seem to be at a comparative advantage in the production of Cheddar cheese.
Italian-type cheese is manufactured in as many ways as there are varieties. How- ever, it generally requires a higher temperature than Cheddar. The curd is formed and stretched in hot water, placed in hoops in cold water, and immersed in salt brine. Ricotta is often manufactured from the Mozzarella whey.
The cheesemaker can retain more individuality manufacturing hard Italian-type cheese than Cheddar cheese. Consequently, adoption of new automated technology has been slower. For example, Italian-type cheesemaking has not utilized vertical vats. Hard Italian cheese manufacture requires a large capital investment for storage facilities to age the product.
However, there are some large Mozzarella cheese plants, because of the fast growth of the market. Major developments in the manufacture of Mozzarella are the use of larger vats, the introduction of direct salting of the curd instead of the use of brine, and the introduction of an automatic mixer-molder.
25

Table 14—Number of plants in survey reporting Cheddar cheese production technology
Regie m and 10 logy 1/ 2/ :
Plant size V
techr Small \ Medium Large
Region 1 Number
Standard vat : Manual hooping Automatic weighing Automatic milling, and hooping
and hooping : salting, weighing, :
28 1
0
24 3
2
1 1
1
Two-tier vats: Manual hooping Automatic weighing Automatic milling, and hooping
and hooping : salting, weighing.
0 0
0
0 1
0
0 3
1
Automatic: Cheddaring Cooking Cooking and che<3daring
0 0 0
1 0 0
2 1 0
Region 2
Standard vat: Manual hooping Automatic weighing Automatic milling, and hooping
and hooping salting, weighing
9 0
0
9 3
0
3 2
1
Two-tier vats: Manual hooping Automatic weighing Automatic milling, and hooping
and hooping salting, weighing.
0 0
0
1 2
0
1 3
1
Automatic; Cheddaring Cooking Cooking and cheddaring
" 0 0
: 0
0 0 1
2 0 1
Region 3
Standard vat: Manual hooping Automatic weighing Automatic milling, and hooping
and hooping salting,^ weighing
': 20 : 0
: 0
19 0
0
2 3
0
Two-tier vats: Manual hooping Automatic weighing Automatic milling, and hooping
and hooping salting, weighing.
: 0 : 0
: 0
0 3
0
0 2
0
Automat ic: Cheddaring Cooking Cooking and cheddaring
0 : 0 : 0
0 0 1
1 0 1
1/ See footnote 1, table 6. 2/ The types of technology examined are taken from (9), 3/ See footnote 2, table 6.
26

Swiss cheese has a firm, smooth body with distinctive "eyes" distributed throughout the cheese. These eyes are produced by specific bacterial cultures. They form in the warm room after the cheese is pressed and placed in a brine vat for 24 to 23 hours. The principal technological changes in the manufacture of Swiss cheese are the conversion from kettles to vats and from wheels to labor-saving, quicker aging 100- to 200-pound rindless blocks.
Capacity
The manufacturing capacity of the natural cheese industry was measured in the survey by the average number of cheese vats per plant and the total milk volume of the vats per plant (table 15). An average U.S. cheese plant in 1973 had four cheese vats and a total capacity of 58,700 pounds of milk. Therefore, there were approximately 3,460 vats in the cheese industry in 1973.
Both the average number of vats and volume per vat increase with plant size. Total vat volume per plant averaged 5.5 times greater for the large plants than for the small plants. Region 2, x>7ith about 94,000 pounds of milk volume, generally averaged a greater average vat volume per plant than the other regions, which had about 50,000 pounds each.
The cheese industry has undergone rapid changes in manufacturing facilities in recent years. The survey reported 123 out of 225 plants, about 55 percent, had some remodeling, expansion, or major improvements from 1971 through 1973. As previously noted, an initial consolidation movement of regional cooperatives in the Midwest improved operational efficiency with a few larger, well-located cheese plants. Many cooperative plants are now undergoing a second change toward cheese manufacturing facilities which emphasize flexibility among manufactured dairy products.
A survey of selected farm cooperatives conducted in 1974 on recent and proposed capacity changes reported 16 of 54 cooperatives recently expanded cheese capacity and no cooperatives decreased capacity. These 16 cooperatives contained a total of 35 generally large plants which had increased capacity. The primary reason listed for change was to gain manufacturing flexibility among manufactured dairy products. Also important was a response to the relatively higher price of cheese in recent years.
Much of the expansion in cheese manufacturing capacity was reported as either new cheese plants by cooperatives that also produce butter-powder or as conversion from butter-powder production. However, in many cases the butter-powder facilities were retained to permit a possible switch in response to price.
Given the recent emphasis on product flexibility in the new manufacturing capacity" of many plants, the marketing advantages of price flexibility appear to increasingly offset the operational efficiency disadvantages of maintaining dual production facili- ties. This holds more for the regional cooperatives and less for local cooperatives with one plant, local privately owned companies, and national companies.
Cheese manufacturing has been more specialized than butter production since World War II. In 1961, 679 plants reported producing American-type cheese only, while 344 produced American-type cheese and other dairy products. Production of butter was reported in 153 American-type cheese plants (1).
The 225 plants in the cheese survey reported the manufacture of 98.7 million pounds of butter of which 78.5 million pounds was by cooperatively owned plants. Based on these results, an estimated 15 percent of the total U.S. butter production was manufactured in plants that also manufacture cheese.
27
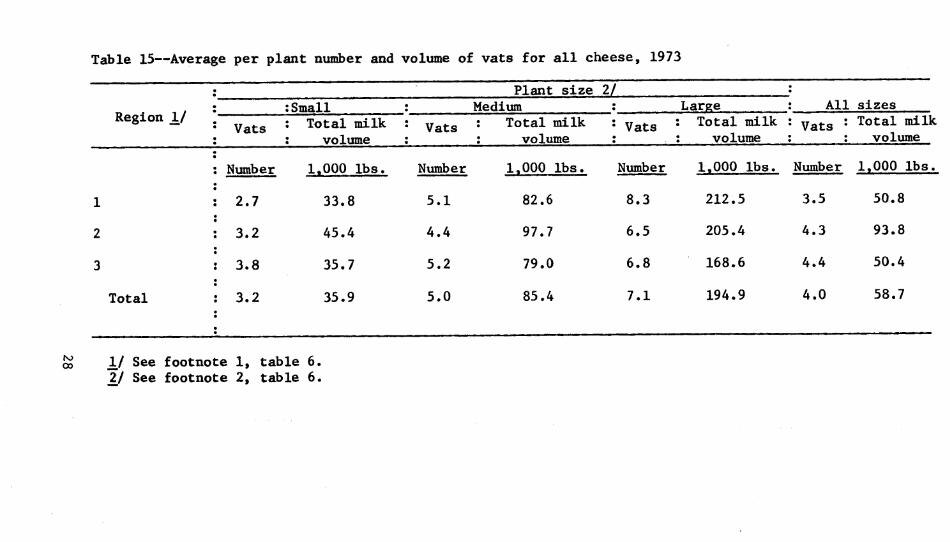
Table 15—Average per plant number and volume of vats for all cheese, 1973
"—"
Region 1/ \
Plant size 2/ All :Small Medium Large sizes
\ Vats : Total milk : volume
; Vats • • •
Total milk volume
* Vats : Total milk . : volume !
' Vats ' * • Total milk volume
: Number 1.000 lbs. Number 1.000 lbs. Number 1.000 lbs. Number 1,000 lbs.
1 ! 2.7 33.8 5.1 82.6 8.3 212.5 3.5 50.8
2 : 3.2 45.4 4.4 97.7 6.5 205.4 4.3 93.8
3 ! 3.8 35.7 5.2 79.0 6.8 168.6 4.4 50.4
Total : 3.2 35.9 5.0 85.4 7.1 194.9 4.0 58.7
Sä y See footnote 1, table 6. 2J See footnote 2, table 6.

Zyjo^uÇt Descriptiqn
The survey reported the manufacture of several alternative cheese type or variety combinations within a plant. The manufacture of a single type or variety was reported in 127 American-type cheese plants, 34 Italian-type cheese plants, and 6 Swiss cheese plants.
A combination of manufacturing American-type cheese and at least one other type or variety x^as reported in an additional 39 plants. The dominant cheese in these combinations was often Italian-type or Swiss, with American-type accounting for only about 5 percent of that manufactured. Very fev7 plants manufactured either Italian- type or Swiss in combination with any cheeses other than American-type.
The dominant styles in the manufacture of American-type cheese are bulk (500- pound barrel and 640-pound block combined) and 40~pound block. The plant survey indicated over 84 percent of 1973 American-type production was in these styles. Similarly, actual VJisconsin plant information for 1973 shows over 82 percent in these styles, although there was a relatively greater proportion of 40-pound blocks and a lesser proportion of bulk (table 16). These styles have generally increased in importance in the last 20 years while the other styles, notably Cheddar (70-75 pound wheels), have declined. The Cheddar style alone comprised almost 46 percent of American cheese manufactured in 1956 (19). The 640-pound blocks, which comprised a significant proportion of the bulk cheese, and the 40-pound blocks are commonly sold for use as natural cheese. In contrast, 500-pound barrels are commonly used for further processing.
For most plant sizes, the share of the production in the form of 40-pound blocks remained fairly constant, while bulk Increased substantially with plant size. The
Table 16—Percent of plants producing natural American cheese styles, 1973
Cheese and approximate : Wisconsin, : all size plants 1/
:Total United States, bi jilant size 2/ weight : Small : Medium : Large : All sizes
Percent
Longhorn, 12 lbs. : 4.5 12.1 5.8 3.3 6.1 Daisy, 20 lbs. 1.6 7.6 2.2 .8 2.8 Midget, 10 lbs. .9 2.8 .5 .0 .8 Cheddar, 72 lbs. 5.4 .8 1.2 .3 .8 Block, 20 and 60 lbs. 5.0 11.9 1.1 .1 2.9 Block, 40 lbs. 39.3 33.1 31.0 34.8 32.8 Bulk 3/ : 42.8 30.0 55.3 59.0 51.6 Other .5 1.7 2.7 1.7 2,2
Total 100.0 100.0 100.0 100.0 100.0
1/ Wisconsin American Cheese Production, by Style-1973, Wis. Statis. Rptg. Serv. 2/ See footnote 2, table 6. 3_/ Includes 500-pound barrels and 640-pound square containers.
29

other styles generally declined as a proportion of manufacture with increases in plant size.
The manufacture of a single style of American-type cheese was reported in 58 percent of the plants. The remaining plants reported manufacturing more than one style. One style commonly dominated these combinations with about 90-95 percent of manufacture,
Mozzarella cheese is primarily manufactured for industrial use in bulk as 5-, 6-, or 20-pound loaves, although some 40-pound loaves are manufactured for cutting and shredding, A smaller amount of Mozzarella is manufactured for retail sale in consumer- size packages. Hard Italian cheeses take many forms, Parmesan and Romano are most often in a 20-pound size, while Provolone is commonly manufactured in a rindless 10- pound size.
The dominant product type of Swiss cheese has changed from 250-pound wheels to 100- and 200-pound blocks. In 1973, Wisconsin reported over 97 percent of Swiss cheese manufactured as block (25).
Common styles of other cheese varieties include Muenster in 5-pound loaves or wheels. Brick in 5-pound brick-like shapes, and Blue in 5-pound wheels and also "crumbles'' for institutional use. Cream and Limberger are packaged in retail forms at manufacture,
Whey Byproducts
The byproduct of natural cheese production is whey, i^They averages 93 percent water, 5.1 percent lactose, 0.9 percent protein, 0.5 percent ash, and 0.3 percent milkfat. The fat is separated out for further use in other food products. About 8 pounds of whey are produced for every pound of cheese.
Traditionally, whey has been considered an undesirable byproduct in the manufact- ure of cheese. Because it had little or no economic value, the least costly methods of disposal were often used. It was usually either dumped in a sewer or stream, or given to farmers to be fed to livestock or spread on fields as fertilizer.
However, there have been recent changes in farming methods, pollution standards, and the relative value of whey for food and feed uses (i,i,l, 10,17) . Less liquid whey is now returned to farmers because of the shift to bulk milk pickup at the farms and the high cost of operating return routes. Also, whey production is highest in the spring and summer, the period with the lowest number of hogs to be fed, and because of the weather and planting schedules, often the most difficult period to get into the fields. Hog producers now use more specialized equipment, use dry feed, and emphasize efficiency and sanitation, all contriljuting to the use of feeds other than liquid whey. Federal and State pollution standards have tightened and are more strictly enforced in recent years. Enforcement of these standards is confronting many cheese plants with a much greater cost in disposing of whey. Recent higher prices for nonfat dry milk and protein commodities as a result of shortages have improved the relative position of dry whey products as a food ingredient in the following items or processes: ice cream, process cheese foods and spreads, fortification of fluid milk products, baking, candy, meat processing, and other food products.
Those changes make it less practical to treat whey as a waste product. Consequent- ly, there has been increased research to determine whey utilization alternatives. Dry- ing whey requires a heavy capital investment and high operating costs, especially for fuel, which smaller cheese plants cannot generally justify. Also, an efficient size of whey-drying operation requires a greater volume of whey than most individual cheese
30

manufacturers produce. These reasons, combined with the high transportation costs of
whey as a result of the high water content, make it economically necessary to either dry whey in large cheese plants or assemble liquid or condensed whey from a number of smaller cheese plants to a central drying plant. Therefore, a decision by one drying plant may affect a number of small cheese plants.
To lower transportation costs, the whey may be condensed before hauling for further processing. Condensing, which lowers the liquid content to about 60 percent, is relatively inexpensive and economically feasible for medium-sized to large cheese plants. After the whey has been condensed, it may be hauled to a drying plant uo to 200 miles away in vehicles suitable for hauling fluid milk.
Whey may be dried by several techniques. Roller-drying was the most common method in the past and yields a relatively cheap product for animal feed uses. How- ever, the emergence of stricter sanitary regulations and economic pressures have favored spray-drying, which produces a high quality, higher priced product for human consumption. Although spray-drying continues to be the most important drying method, new techniques in drying and processing are gaining in importance. Dried xihey may return a small profit, but modified whey products including whey proteins, lactose, and blended and specialty products are more profitable.
In 1973, almost 54 percent of the whey from hard cheese plants was condensed, dried, or modified by the plant (table 17). Twenty-two percent was sold for further processing in liquid form and the rest, almost 25 percent, was fed or dumped. There was a significant difference in the uses of whey among plant sizes. Small plants dumped almost 65 percent of their whey while large plants dumped less than 7 percent. In contrast, large plants dried 38 percent of their whey while small plants dried about 6 percent. The proportion of whey sold for further processing declined as plant size increased.
INTERMEDIATE DISTRIBUTION OF NATURAL CHEESE
D i St r i but i on Channe 1 s_
The intermediate distribution system for natural cheese is highly complex and must be viewed in terms of both the institutions involved and the functions performed at that level in the marketing channel. Cheese purchased from manufacturers is used as packaged natural cheese or process cheese products, or put into industrial (con- venience foods such as cheese crackers and frozen pizzas) or institutional (such as pizza and cheeseburgers) products.
First, the cheese is assembled, which involves collecting the small diverse lots of cheese from individual manufacturers and sorting and aggregating them into larger uniform lots. Grading and storage may be included. All businesses performing these functions are referred to by the industry as "assemblers."
Few independent assemblers performing only the assembly functions remain in the industry. Wisconsin has around 50 assemblers but only about half a dozen are relative- ly small independent cheese assemblers. Independent assemblers are practically non- existent outside Wisconsin, Most of the cheese they assemble is then sold to the processors and intermediate handlers who cut and package natural cheese for distri- bution to wholesalers and retailers.
The industry at this level has a high degree of vertical integration. The larpse
cheese processors, who are also the most important intermediate handlers, originally bought cheese on the open market but they now assemble most of their cheese directly from factories through a variety of arrangements. Many obtain a large proportion of
31

Table 17—Whey disposition, 1973
Disposition Plant size 1/
^ \ Small Medium
• Large \ All sizes
•
Percent
Sold for further processing : 29.0 27.3 14.2 22.0
Condensed 1 .0 11.4 37.6 20.6
Dried ! 6,3 30.8 38.0 29.7
Modified .0 4.7 3.6 3.4
Dumped in: .. Municipal sewer 10.8 5.5 1.9 4.9
Private sewage treatment plant 4.2 .8 .2 1.1
Lagoon 6.5 3.5 .0 2.5 Irrigation systems 2.9 6.9 2.8 4.5
Fed or used for fertilizer 40.3 9.1 1.7 11.3
Total 100,0 100.0 100.0 100.0
1/ See footnote 2, table 6.
their needs from their own plants on under informal sales agreements with private and cooperative manufacturers. These processors are the major market for most of the regional cooperatives.
The increased integration has reduced the number of levels the cheese must pass through in the market channel. As a result the assembly functions may be carried out at any level. They are often performed at the manufacturing level by multiplant cooperatives through a marketing office, by a group of small plants through a market- ing cooperativej or by large private cheese manufacturers. At the other extreme these functions may be carried out by the buyers, processors, and intermediate handlers.
Before constructing a natural cheese plant, most businesses attempt to assure some stability in the future production and marketing of their product. They may seek the assistance of a processor to this end. "Processors in recent years have provided aids in starter management, supervision of factory operations, aid in manu- facturing problems, and even advice in plant design and construction!' (11).
Agreements between processors and natural cheese manufacturing plants take many forms. The processors may be willing to take the entire output of selected manu- facturers with a desirable quantity of cheese. They also may take some specified amount from some plants on a regular basis, and when supplies are tight, they may make arrangements with additional plants for specified quantities. Alternatively, when cheese supplies are abundant, assemblers may cut back on the amount of cheese they are willing to accept, in which case additional milk may be shifted into butter and powder. This may explain in part why the Government has bought relatively more butter and powder in the past under the price support program.
32

Table 18—First handler of cheese, 1973
Plant size 1/ Handler ■"
; Small [ Medium : Large ; Total
Percent
Assembler Î 26.0 13.6 12.5 15.2 Retail food chain : 5.7 12.0 6.2 8.5 National cheese company 26.8 41.5 45.1 40.5 Wholesaler 29.1 17.6 16.9 19.3 Marketing cooperative 1 7.4 3.5 10.2 7.0 Broker 1.9 3.9 3.3 3.3 Government .0 .0 .0 .0 Food company outside dairy .1 3.2 .5 1.5 Retail sales by plant 2.1 1.3 3.5 2.4 Other .9 3.4 1.8 2.3
Total 100.0 100.0 100.0 100.0
1/ See footnote 2, table 6.
The only cheese bought under an open offer under the price support program is in 40-pound blocks. However, the Government does provide an outlet for barrel cheese (in the form of process cheese, which is bought on a bid-basis) but no open-end com- mitment exists to buy process cheese. In recent years a number of plants have switched to the production of barrel cheese and cannot easily switch back to 40-pound blocks. Barrel cheese makes up a major portion of total Cheddar cheese production since it provides savings in manufacture and package costs. This weaker guaranteed market position in relation to butter places the cheese manufacturers at times in a relatively weaker bargaining position, and may explain the unwillingness of assemblers to accumulate unlimited quantities of barrel cheese.
Table 18 shows the route the cheese takes from the manufacturers* docks for further preparation for final distribution. In some cases, especially with a national cheese company, it may just move to another company-owned plant for further processing or cutting. The largest proportion, 40.5 percent, goes to national cheese companies. Wholesalers take 19.3 percent and assemblers, 15.2 percent. Very little cheese goes from the manufacturing plants directly to food companies outside the dairy industry even though they are substantial users of cheese. The assemblers in this table un-
doubtedly include some Í!usiness.e_s that have primary functions o4hôr tfeaa aseembly.
Functions at the Intermediate Distrlbution Level
In addition to assembly, cheese may go through several other steps in preparation for final utilization. These include cooling, testing for moisture and fat, grading, and weighing. All these functions may be partially performed at assembly. Other functions include storage, transportation, and cutting or processing.
Testing for moisture and fat is the basis for most of the pricing mentioned in the next section. In addition, most cheese is graded. The survey results for 1973 indicated 54 percent of all cheese was graded at the plant. Small plants had 31 per- cent of their cheese graded, medium-sized plants had 51 percent, and large plants had
33

Table 19—Average cheese stora^^e capacity at all cheese olants, 1973
Region _!/
Total U.S.
Plant size 2/ Small Medium LarRe All sizes
37.8
64.9
188,6
99.9
1,000 pounds
623.3
387.3
516.0
528.9
2,042.7
1,955.1
2,384.4
2,136.0
262.5
522.4
406.3
354.3
Ij See footnote 1, table 6. 2/ See footnote 2, table 6.
66 percent. American-type cheese was generally graded at the plant in the same pro- portions. Almost all Swiss cheese was graded at the plant.
Some types of cheese must be aged. Medium Cheddar cheese is usually aged 3-6 months and aged Cheddar usually a minimum of 6 months. In the Italian-type varieties, Mozzarella is not aged, but Parmesan must be aged at least 10 months, Romano 5 months, and Provolone 60 days. Swiss cheese must be aged at least 60 days.
Since this aging requires large capital investments in storage capacity, the cheese (except in some large plants) is not stored at the manufacturing level. How- ever» the cheese, still warm after manufacture, is often cooled at the plant under controlled conditions until a shipment has been accumulated. It may then be further cooled by the assembler. Therefore, there is usually at least minimum storage capacity at the plant.
Average plant cheese storage capacity was about 354,000 pounds in 1973 (table 19). Capacity in all regions increased with plant size so that the large plants averaged 2.1 million pounds. Region 3 had relatively large cheese storage capacity through all plant sizes. Average capacity for all sizes was less for Region 3 than for Region 2 because Region 2 contained proportionately more large plants. American- type cheese plants generally had slightly lower cheese storage capacity than all cheese plants combined. Capacity at Swiss plants was about double the capacity of all cheese plants combined and at Mozzarella plants, about half that of all cheese plants combined.
The average number of days cheese was stored by the manufacturers reporting in the survey varied by cheese type. Cheddar cheese was stored an average of 34 days by smaller plants and almost 50 days by the largest plants. Storage for Colby increased with plant size from an average of 21 to 35 days. Stirred curd (500-pound barrels) was stored an average of 4 to 8 days. Almost all manufacturers stored Swiss cheese just over 60 days at the plant, until it was to be cut for distribution. Cheese is kept in the warm room for 35 to 40 days while the '*eyes" form and the flavor develops. The plant needs to control environmental conditions. Mozzarella, a fresh, highly perishable Italian-type cheese, was stored at the plant an average of 4 to 9 days. However, plants manufacturing hard Italian-type cheeses reported an average of about 180 days for all plant sizes. Most of the hard Italian varieties manufactured are aged to be relatively mild.
34

Table 20--Transportation method and average distance from the manufacturer to the first handler, 1973
Item Plant size 11
Small Medium •
Large \ All sizes
Percent Method of transportation:
Truck 95 91 88 90 Rail 5 9 12
Miles
10
Distance to first handler: Average 161 350 351 318 Farthest 253 671 1,041 757
\l See footnote 2, table 6.
Trucks transported 90 percent of the cheese from the manufacturers to the first handlers, with the remainder going by rail (table 20). Proportionately more of the cheese from the small plants went by truck, 95 percent, compared with the large plants, 88 percent.
Cheese was transported an average distance of 318 miles from the manufacturing plants to the handlers (table 20). On the average the farthest distance was 757 miles. The average distance to handlers was about the same for the medium-sized and large plants. This was especially true in Wisconsin and the West North Central Region, where the average distance to first handlers from the large plants was about 260 miles. The large plants are often operated as part of a totally integrated system with resulting efficiencies in distribution. The cheese in Wisconsin generally moved a shorter distance to the first handlers, especially cheese from the small plants, which went 77 miles.
Wholesale blocks of natural cheese distributed through the retail market are cut and packaged in retail units. Some of the retail cheese is cut in exact weights, packaged, and either "branded" with the distributor's label or "private labeled" with the name of the retailer. Other retail packages are in varying random weights and may or may not use the retailer's label.
Some cutting and packaging is done at all levels in the market channel, including the manufacturing plant, the intermediate distributor, and the chainstore warehouse. It is estimated that half of all manufacturing plants in Wisconsin cut and package at least part of their production for local distribution. However, national cheese companies and other intermediate handlers cut and package the greatest volume of natural cheese. Two of the major national cheese companies package primarily their own labels, whereas the other national companies perform both name branding and private label branding for retail chains. Cheese cutting at the retail level used to predominate but has declined with the introduction of rindless cheese block at wholesale and changing merchandising methods. Very few of the retail chains now even cut and package cheese at the wholesale level, although the number is increasing. The increase is partially due to the growth of the delicatessen department in stores. Cutting and packaging can give the retail chain greater control over the type of product merchandised.
35

Pricing at the Manufacturing Level
The Wisconsin Cheese Exchange, which meets weekly, provides a place for members to buy or sell American-type or Swiss cheeses (2). The purpose of the Exchange is not to provide an outlet for all cheese marketed". Although most of the cheese Is
marketed through direct long-term arrangements, the Exchange offers an alternative outlet and source as a safeguard for both buyers and sellers when an imbalance of cheese exists. Less than 1 percent of all cheese marketed is traded on the Exchange. Most sales are based on inspection by the buyer or Government grading.
The Exchange transactions provide a useful service as a basis of opinion on almost all cheese prices at the plant level. However, short-run market forces may bring prices paid to plants up relative to the Exchange during times of short supplies and down relative to the Exchange during times of abundant supplies. In addition, varieties of cheese such as Mozzarella, in which a greater proportion of the butterfat is separated out, are more sensitive to butter prices than others. High butter prices may result in relatively lower prices of Mozzarella cheese.
Price premiums may be based on age, moisture, fat, or flavor. Additional pre- miums on the basis of protein content are being considered by the industry. Forms of nonprlce competition for plants include free supplies, such as boxes, salt, and barrels; free transportation; and technical aid in plant design, plant construction, and manufacturing.
MANUFACTURE OF PROCESS CHEESE
Description
Pasteurized process cheese is manufactured hy grinding^ heating^ blending^ and emulsifying natural cheese. A resulting uniform pasteurized process cheese with the desired properties is obtained by combining the natural cheeses of two or more lots on the basis of flavor, texture, body, age, acidity, and composition. Pasteurized process cheese foods and spreads are manufactured in the same way as pasteurized process cheese. Certain dairy products (cream, milk, skim milk, cheese whey, or whey albumin) may be used in addition to cheese in pasteurized process cheese foods and spreads. Pasteurized process cheese spreads contain more moisture and less fat than pasteurized process cheese and thus are more spreadable. The heat treatment used in the manufacture of all these process cheese products halts the ripening of the cheese and results in a longer shelf life.
The natural varieties most often used in pasteurized process cheese products are Cheddar, Colby, and Swiss. Small amounts of specialty cheeses may be used to obtain distinctive flavors. Italian cheeses have not been successfully processed. Fruits, vegetables, or meats may be added to any of the pasteurized process cheese products.
Cold pack cheese is manufactured by grinding and blending, either with very little or no heat, one or more lots of natural cheese.
Plants and Production Regions
The manufacturers of process cheese and other process cheese products have each maintained around 40 plants from 1960 to the present (table 21), There is some pro- duction overlap among plants, so the total number of plants making all process cheese products is somewhat less than the sum of manufacturers of the separate products. Average plant production has increased to 24 million pounds for process cheese and about half that for other process products.
36

Table 21—Number and average production of process cheese product plants, selected years, 1960-73
Process cheese : Process spreads, cheese foods, Years and cold jpack
Plants : Average plant production : Plants : Average plant production
: Number 1,000 pounds Number 1,000 pounds
1960 41 11,270 45 5,020 1965 44 14,348 46 4,968 1970 ; 40 17,160 40 11,290 1971 41 18,312 37 12,961 1972 41 18,164 42 10,845 1973 : 30 24,023 N.A. N.A.
N.A. = Not available.
Sources: (18) and unpublished data, Econ. Res. Serv., U.S. Dept. Agr.
Process cheese manufacturers try to establish an even flow of natural cheese, to be as little dependent on variable surplus milk supplies as possible. Therefore, operations have been located near areas of high natural cheese production. Plants manufacturins? natural cheese seldom manufacture process cheese. Process cheese pro- duction is heavily concentrated in Minnesota, Missouri, and Wisconsin. Other factors affecting plant location include proximity to markets, costs of transportation, and availability of skilled labor. As a result there is some process cheese manufactur- ing in the West, primarily Utah, There, in addition to local natural cheese supplies, some natural cheese is shipped in from the North Central Region for processing.
Organization
Process cheese manufacturing began over 55 years ago. Basic patents were initially held by a few businesses, with a limited number of other manufacturers licensed to operate under these patents. The original objectives of process cheese manufacturing were to approximate natural cheese while extending the keeping quality, uniformity, and slicing quality (11,12).
By the time the basic patents expired in 1938 the established manufacturers had attained good market position. Concentratipn has been maintained at this level by these early entrants partially by effective brand differentiation and competitiveness at the retail level, making entry into the national market by new brands difficult. Wlien selling cheese using a retail store's name (private label) became a mai or method of marketing, these same businesses adjusted so that now almost all of these firms package under private labels for food chains as well as under their own labels.
Process cheese is manufactured by two different groups of plants. The first group generally consists of large plants serving their own trade and/or retail store brands over an extensive area. Most of them are owned by national cheese companies although some facilities are owned by regional cooperatives. They account for a high proportion of the total U.S. production of process cheese products.
These plants require a large capital investment and, because of low per-unit margins, a large volume. Therefore, they are usually tied in closely with the cutting
37
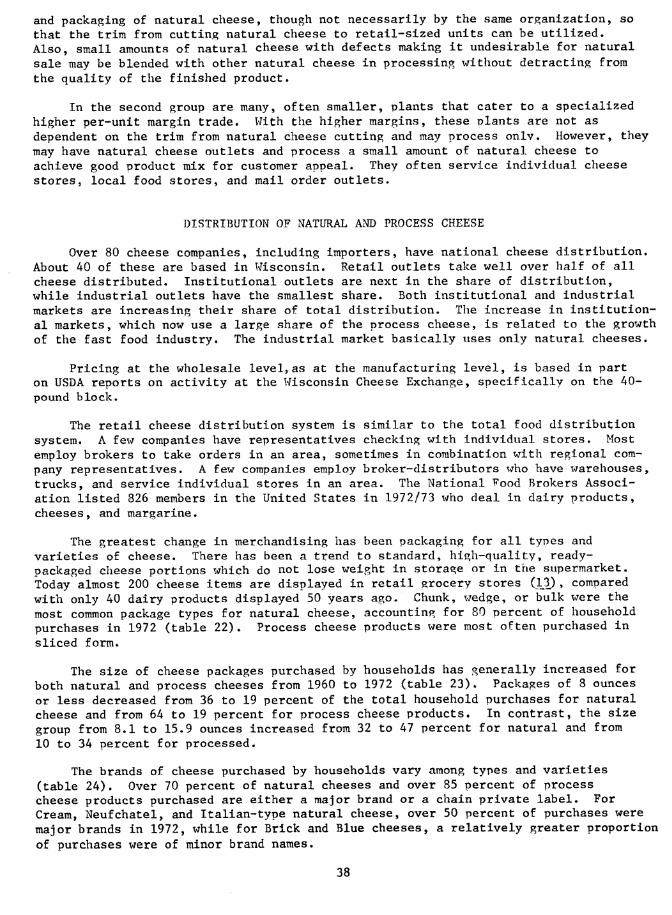
and packaging of natural cheese, though not necessarily by the same organization, so that the trim from cutting natural cheese to retail-sized units can be utilized. Also, small amounts of natural cheese with defects making it undesirable for natural sale may be blended with other natural cheese in processing without detracting from the quality of the finished product.
In the second group are many, often smaller, plants that cater to a specialized higher per-unit margin trade. With the higher margins, these plants are not as dependent on the trim from natural cheese cutting and may process onlv. However, they may have natural cheese outlets and process a small amount of natural cheese to achieve good product mix for customer appeal. They often service individual cheese stores, local food stores, and mail order outlets.
DISTRIBUTION OF NATURAL AND PROCESS CHEESE
Over 80 cheese companies, including importers, have national cheese distribution. About 40 of these are based in Wisconsin. Retail outlets take well over half of all cheese distributed. Institutional outlets are next in the share of distribution, while industrial outlets have the smallest share. Both institutional and industrial markets are increasing their share of total distribution. The increase in institution- al markets, which now use a large share of the process cheese, is related to the growth of the fast food industry. The industrial market basically uses only natural cheeses.
Pricing at the wholesale level,as at the manufacturing level, is based in part on USDA reports on activity at the Wisconsin Cheese Exchange, specifically on the 40- pound block.
The retail cheese distribution system is similar to the total food distribution system. A few companies have representatives checking with individual stores. Most employ brokers to take orders in an area, sometimes in combination with regional com- pany representatives. A few companies employ broker-distributors who have warehouses, trucks, and service individual stores in an area. The National Food Brokers Associ- ation listed 826 members in the United States in 1972/73 who deal in dairy products, cheeses, and margarine.
The greatest change in merchandising has been packaging for all types and varieties of cheese. There has been a trend to standard, high-quality, ready- packaged cheese portions which do not lose weight in storage or in the supermarket. Today almost 200 cheese items are displayed in retail grocery stores (13.) , compared with only 40 dairy products displayed 50 years ago. Chunk, wedge, or bulk were the most common package types for natural cheese, accounting for 80 percent of household purchases in 1972 (table 22). Process cheese products were most often purchased in
sliced form.
The size of cheese packages purchased by households has generally increased for both natural and process cheeses from 1960 to 1972 (table 23). Packages of 8 ounces or less decreased from 36 to 19 percent of the total household purchases for natural cheese and from 64 to 19 percent for process cheese products. In contrast, the size group from 8.1 to 15.9 ounces increased from 32 to 47 percent for natural and from 10 to 34 percent for processed.
The brands of cheese purchased by households vary among types and varieties (table 24). Over 70 percent of natural cheeses and over 85 percent of process cheese products purchased are either a major brand or a chain private label. For Cream, Neufchatel, and Italian-type natural cheese, over 50 percent of purchases were major brands in 1972, while for Brick and Blue cheeses, a relatively greater proportion
of purchases were of minor brand names.
38

Table 22—Household purchases by package type of natural and process cheeses, percent of volume, April-September 1972
Cheese type Packaged—chunk: Packaged— Loaf/box' Other * Total or variety ' wedge, bulk : sliced •
Percent
Natural American 90.0 9.5 — 0.5 100.0 Swiss 38.4 61.6 — — 100.0 Brick 71.8 28.2 — — 100.0 Muenster 52.8 47.2 — — 100.0 Blue 88.3 — — 11.7 100.0 Italian : 54.3 17.5 — 28.2 100.0 Other 81.0 17.4 — 1.6 100.0
Total 1/ 77.9 18.9 — 3.2 100.0
Process American — 89.7 9.6 .7 100.0 Sx^iss — 94.9 1.5 3.6 100.0 Other — — — — 100.0 Cheese food : — 93.4 2.6 4.0 100.0 Cheese spread — 5.5 74.4 20.1 100.0 Total : 89.7 9.4 .9 100.0
1/ Does not include Cream cheese or Neufchatel cheese. ~ =• 0.
Source: The Cheese Household Market, April-September 1972, Marketing and Economic Research Division, united Dairy Industry Association.
OTHER SOURCES OF CHEESE
Imported Cheese
Cheese imports in 1974 were the highest on record (table 25). This was partially due to a temporary increase of 100 million pounds for Cheddar cheese. The 1974 imports amounted to 10.9 percent of domestic cheese production.
Utilization
The only cheeses covered under the first quotas were Cheddar, Edam and Gouda, and Blue Mold, all for table use. In the I960's the demand for processing cheeses in- creased in the United States, with a resulting rise in imports of cheeses for proces- sing, and quotas were placed on these as well.
The American-type cheese imports are almost all used for further processing. The only major exception is aged Cheddar cheese, imported from Canada under the special 1.2 million pound quota, which is distributed through retail outlets for table use. Almost all Italian-type cheese imports are sold either in delicatessen or retail food- store outlets. Some is grated, but it is still sold through retail outlets. A small amount of Italian cheese from other sources is converted to institutional outlets. Edam and Gouda imports are practically all for retail sale. Blue Mold is primarily used in restaurants as an ingredient in foods such as salad dressings. A small amount
39

o
Table 23*^Household purchases by package size of natural and process cheeses, percent of volume, April-September 1960 and 1972
\ Less than , 8 oz. ; 8.1-15 .9 oz. '. 1^ oz. ; 16.1-31 .9 oz. • 32 oz. and Cheese type : 8 02. over • or variety
; 1960 : 1972 \ 1960 ; 1972 •
1960 ; 1972 ; I960 : 1972 ■ 1960 ; • 1972 1960 '• • 1972
Total
Percent Natural American • 3.8 2.2 13.5 7.5 42.4 53.3 19.3 14.4 14.1 9.9 6.9 12.7 100.0 Swiss •17.1 10.9 32.9 24.6 21.1 34.1 12.8 20.0 9.4 4.3 6.7 6.1 100.0 Brick ; 5.2 6.3 16.0 15.5 39.6 54.9 15.2 11.2 16.7 3.9 7.3 8.2 100.0 Muenster : 11.9 10.7 40.4 25.7 28.1 48.6 14.3 9.7 4.8 2.6 .3 2.7 100.0 Blue : 50.0 48.2 8.4 21.7 28.4 15.7 7.8 8.3 2.7 6.2 IJ .5 100.0 Italian : N.A. 17.3 N.A. 32.7 N.A. 17.3 N.A. 20.5 N.A. 6.0 N.A. 6.2 100.0 Total II : 13.0 6.0 22.6 13.1 32.0 46.6 15.3 15.2, 10.8 8.5 6.3 10.6 100.0
Process : American : 13.5 3.6 46.1 12.9 10.3 35.0 10.8 18.8 1.9 8.0 17.4 21.7 100.0 Swiss : 25.1 17.4 57.6 55.0 7.6 17.2 5.8 9.5 2.5 .9 1.4 — 100.0 Other : 18.1 17.9 61.9 11.9 9.0 23.6 1.8 16.3 2.5 27.6 6.7 2.7 100.0 Cheese food ; 7.0 4.9 6.4 8.8 1.4 59.7 3.9 15.7 ,2 7.2 81.1 3.7 100.0 Cheese spread : 8.9 8.7 1Ö.2 7.7 .6 4.4 13.9 13.1 1.5 — 64.9 66.0 100.0 Total : 15.0 4.2 49.2 14.3 9.9 34.2 9.1 18.6 2.1 8.0 14.7 20.7 100.0
N.A. = Not available; — = 0. 11 Total in 1972 does not include Cream cheese or Neufchatel cheese.
Source: The Household Cheese Market, Apri 1-September 1960/Marketing Research Department, American Dairy Association and The Cheese Household Market, April-September 1972, Marketing and Economic Research Division, United Dairy Industry Association.

Table 24—Household purchases by brand of natural and process cheeses, percent of volume, April-September 1972
Cheese type or variety
4>
Natural American Swiss Cream Neufchatel Brick Muenster Blue Italian Total 2/
Process Cheese Cheese food Cheese spread
Total
Major : Chain private : Independent private : All other : xotal brands 1/ : label ; label brands :
Percent
36.6 33.8 1.9 47.7 29.4 2.0 68.1 25.7 .3 83.2 10.3 — 31.9 29.2 3.4 29.6 42.5 2.5 32.4 24.2 1.6 57.4 18.4 .7 39.5 31.5 1.8
53.3 30.1 1.2 67.4 21.0 .9 80.0 6.7 1.0 65.4 20.3 1.1
27.7 100.0 23.9 100.0 5.9 100.0 6.5 100.0
35.5 100.0 25.4 100.0 41.8 100.0 23.5 100.0 27.2 100.0
15.4 100.0 10.8 100.0 12.3 100.0 13.2 100.0
~ - 0. 1/ Includes all brands exceeding 1 percent of U.S, total volume. 2/ Does not include Cream cheese or Neufchatel cheese.
Source: The Cheese Household Market, April-September 1972, Marketing and Economic Research Division, United Dairy Industry Association.

Table 25—Cheese imports by type, 1970-74
Product 1970 ; 1971 ; 1972 ; 1973 ; 1974 y
Thousand pounds
Cheese, quota types American:
Cheddar 10,132 9,324 9,516 20,010 107,017 Other 5,969 7,624 5,959 8,430 5,101
Italian: Original loaves 6,617 6,458 10,802 10,524 8,932 Other 674 852 1,350 1,517 1,185
Edam and Gouda: (Natural and process) 11,799 10,126 10,146 11,596 9,371
Blue mold 4,766 4,485 4,434 5,994 5,015 Swiss: Emmenthaler TJ 3,592 2,533 11,235 24,875 12,565 Gruyere (process) 2/ 3,149 2,720 4,499 9,936 6,191
Other: Over 0.5% fat 11 • 23,371 15,701 32,225 52,477 34,452 Under 0.5% fat . 10,753 7,530 3,397 11,965 7,860
Total : 80,410 67,403 98,563 157,324 197,739
Cheese,nonquota types Sx^iss:
Emmen thaler _3/ : 22,763 21,784 22,337 24,725 51,297 Gruyere (process) 1/ : 10,800 8,879 8,287 5,703 9,113
Other 1/ : 22,634 17,961 23,275 21,241 37,698 Pecorino : 20,621 16,566 22,976 17,215 16,465 Roquefort : 2,063 1,671 2,543 2,126 1,439 Other : 1,585 1,663 1,508 1,466 1,908
Total : 80,463 68,524 80,926 72,476 117,920
1/ Preliminary. 2J Below pricebreak. ¿/ Above pricebreak.
Source: Dairy Situation, Econ. Res. Serv., U.S. Dept. Agr.
is sold at retail. Swiss cheese is used for both retail sale and for further proces- sing. Almost all coming under a certain price is used for further processing. The other cheeses go into further processing. A large portion of this is Mozzarella which goes to the pizza trade.
Structure
Import licenses were issued to 312 persons or firms by USDA's Foreign Agricultural Service as of January 1, 1974. The major importers of cheeses used for further proces- sing are the large domestic cheese processors. The many smaller importers, which are usually food brokers, sell most or their imported cheese to these same nrocessors*
Imported cheese which is sold in natural form at the retail market is primarily imported by food brokers which distribute to food chains and other retail outlets. A
42

small part is imported by gourmet shops for their own distribution.
Cheese j^nalogs_
Synthetic cheeses are not a major factor in the market at present and are not expected to be in the near future. The quantity of milk which might be replaced by cheese analogs in 1980 has been estimated at the medium level of penetration to be 675 million pounds and the highest level of penetration to be 2,252 million pounds (5),
Cheese analogs simulate cheese or cheese products but the milk components are either wholly or partially replaced in their manufacture. The protein substance, calcium caseinate, which may be used in the manufacture of cheese analogs is considered a dairy-derived product. Synthetic cheese products are illegal in about three-fourths of the States.
Host of the recent industry research on substitute cheeses has concentrated on institutional and industrial use. The major problems to overcom.e for these products are nutritional equivalency, taste, and appearance. Svnthetic cheese products appear to be highly price sensitive. During one recent period of high cheese prices there was much research activity in the area, but with a price decline this activity slack- ened. Continuing high prices of vegetable oils, a potential source of ingredients, would probably dampen research activity.
43

LITERATURE CITED
1. CARLEY, D* H., Flexibility of Operations in Dairy Manufacturing Plants: Changes 1944 to 1961. U.S. Dept. Agr,, Agr. Econ. Rpt. 61, 1964.
2. Cheese Reporter, The Wisconsin Cheese Exchange.
3. Federal Register, Milk for Manufacturing Purposes and its Production and Proces- sing: RecoRimended Requirements. Vol. 37» No, 68, Part 2, April 7, 1972.
4. Food and Agriculture Organization, Monthly Bulletin of Agricultural Economics and Statistics: îfliey - An Important Potential Protein Source. Vol. 23, April 1974.
5. GALLIMORE, WÏLLIM W., Synthetics and Substitutes for Agricultural Products: Projections for 1980. U.S. Dept. Agr. Mkt. Res. Rpt. 947, March 1972.
6. GROVES, FRANK, An Analysis of i^/hey Utilization. Madison, Wisconsin, Univ. of Wisconsin, Ag* Econ. Staff ^per 48, July 1972.
7. ^^ _ , and TRUMAN F. GRAF, An Economic Analysis of Whey Utilization and Disposal in Wisconsin. Madison, Wis., Univ. of Wis., Agr. Econ. 44, July 1965.
8. KNUTSON, RONALD D. Cooperative Bargaining Developments in the Dairy Industry, 1960-70: With Emphasis on the Central United States, U.S. Dept. of Agr. Farm Coop. Serv. Res. Rpt. 19, August 1971.
9. LILWALL, NICHOLAS B., and JEROME HAMMOND. Cheddar Cheese Manufacturing Costs. St. Paul, Minn., Minn. Agr. Expt. Sta. Bui. 501, 1970.
10. MATHIS, A, G. More Whey is Coming. U.S. Dept. Agr., Econ. Res. Serv., Dairy Situation, Sept. 1970.
11. PRICE, WALTER v., and^ERLIN G. BUSH. The Process Cheese Industry in the United States: A Review: I. Industrial Growth and Problems. Jour, of Milk and Food Technology, Vol. 37, No. 3, Mar. 1974.
12. ^__ , The Process Cheese Industry in the United States: A Review: ÏI. Research and Development, Jour, of Milk and Food Technology, Vol. 37, No. 4, Apr. 1974.
13. Progressive Grocer, July 1974, pt 86.
14. U.S. Department of Agriculture. Dairy Price Support and Related Prokjrams^ 1949-68. Agr. Sta. and Cons. Serv. Ag;r. Econ. Rpt. 165.
15. __^ , Agricultural Marketing Service, Federal and State Standards: For the Composition of Milk Products. Ag. Handbook 51, Jan. 1974.
16. , Agricultural Marketing Service, General Specifications for Plants Approved for USDA Inspection and Grading Stirrvice.
17. , Initial Analysis of the Economic Impact of Water Pol- lution Control Costs Upon the Dairy Products Industry, Report to the Environ- mental Protection Agency from the Economic Research Service, Jan. 1973.
18. ___„______^__ » Statistical Reporting Service, Production of Manu- factured Dairy Products.
44

19. _ _, Statistical Reporting Service, Sunmiary of American "^ Cheese Warehouse Statistics, 1963. (Discontinued)
20. U.S. Tariff Commission, Certain Dairy Products. TC Pub. 274, December 1968.
21. _ _ _^ , Certain Dairy Products. TC Pub. 338, Sept. 1970.
22. __^ , Cheddar Cheese, TC Pub. 653, Mar. 1974.
23. ,_..__ y Cheeses. TC Pub. 567, April 1973.
24. _„_^ ^ . , Dairy ^^roducts. TC Pub, 211, June 1967.
25. Wisconsin American Cheese Production, by style 1973, Wis. Stat. Rpt. Serv.
GENERAL REFERENCES
1. COOK, HUGH L., and J. KENNETH LITTLE, Marketing Costs and Margins for Selected Lots of Wisconsin Cheddar Cheese. Res, Bui. 210, Madison, Wisconsin, Wis. Agr. Expt. Sta.. May 1959.
2. MILLER, A. H., Pricing American Cheese at Wisconsin Factories, Wis. Agr. Expt. Sta. Res. Bui. 163, 1949.
3. MILLER, ROBERT R. The Changing U.S. Cheese Industry. U.S. Dept. Agr., Econ. Res. Serv., Dairy Situation, July 1971.
4. National Commission on Food Marketing: Organization and Competition in the Dairy Industry. Tech. Study No. 3, June 1966.
5. U.S. Department of Agriculture, Cheese Varieties and Description, Agr. Handbook 54, Rv. Sept. 1969.
6. WILLIAMS, SHELDON W., DAVID A. VOSS, CHARLES E. FRENCH, HUGH L. BOOK, and ALDEN C, MANCHESTER, Organization and Competition in the Midwest Dairy Industries. Ames, Iowa. Iowa State Univ. Press, Ch. 9, 1970.
45

APPENDIX A—TABLES
Table A.] .--Utilization of total milk supply in total manufactured dalrj ' products and cheese, 1960- -73
Total milk supply
Utilization (milk equivalent) 1/ Year ■ ¡Total manuf
: produc actured ts
Pet.
'.American
Mil. lbs
cheese.
. Pet.
Other che ese .
Pet.
Total cheese
• Mil. lbs. Mil. lbs. Mil. lbs. Mil. lbs . Pet.
1960 123,102 59,751 48.5 9,686 7.9 3,678 3.0 13,364 10.9
1961 : 125,734 63,580 50.6 11,179 8.9 3,682 2.9 14,861 11.8
1962 126,325 64,141 50.8 10,689 8.5 3,652 2.9 14,341 11.4
1963 ■ 125,335 62,667 50.0 10,920 8.7 3,890 3.1 14,810 11.8
1964 ! 127,020 64,538 50.8 11,454 9.0 4,162 3.3 15,616 12.3
1965 124,339 61,768 49.7 11,458 9.2 4,277 3.4 15,735 12.7
1966 121,283 57,900 47.7 12,154 10.0 4,521 3.7 16,675 13.7
1967 120,109 59,770 49.8 12,701 10.6 4,507 3.8 17,208 14.3
1968 ; 117,421 59,230 50.4 12,716 10.8 4,660 4.0 17,376 14.8
1969 ; 116,402 58,315 50.1 12,668 10.9 4,948 4.2 17,616 15.1
1970 117,493 59,992 51.1 14,226 12.1 5,330 4.5 19,556 16.6
1971 , 118,725 61,492 51.8 15,127 12.1 5,820 4.9 20,947 17.6
1972 • 120,468 62,287 51.7 16,329 13.6 6,439 5.3 22,768 18.9
1973 2/ 115,441 58,898 51.0 16,541 14.3 6,619 5.7 23,160 20.1
1/ Milk equivalent is computed by diviciinsi the milkfat in the T5roduct by the yearly average butterfat test of whole milk sold by farmers.
2/ Unrevised.
Source: Milk Production, Disposition, and Income, Statis. Rptg. Serv., U.S. Dept. Agr.
46

Table A* 2—Production of all natural cheese, annual and quarterly, 1960-74
Year ; First quarter
: Second : quarter
: Third : : quarter :
Fourth quarter
• Total • • • • • Annual index
________ TVi ousand pounds 1960=100 ————— III
1960 328,980 449,406 363,397 336,190 1,477,973 100
1961 377,977 499,861 403,822 352,845 1,634,505 111
1962 362,399 481,195 397,448 350,980 1,592,022 108
1963 357,713 496,719 414,891 362,494 1,631,817 110
1964 • 402,263 509,362 421,197 390,814 1,723,636 117
1965 417,341 528,844 433,594 375,677 1,755,456 119
1966 ! 418,543 544,065 460,867 430,527 1,854,002 125
1967 • 459,796 557,993 473,687 427,354 1,918,830 130
1968 ! 454,821 576,020 481,172 426,195 1,938,208 131
1969 : 444,149 572,593 503,867 468,980 1,989,589 135
1970 : 514,876 626,131 543,639 516,782 2,201,428 149
1971 ! 549,306 676,764 587,643 560,602 2.374,315 161
1972 ! 619,052 737,541 654,569 593,443 2,604,605 176
1973 1/ ! 629,228 774,098 640,257 641,767 2,685,350 182
1974 1/ : 742,896 822,089 692,416 640,535 2,897,936 196
1^/ Unrevised.
Sources: Production of Manufactured Dairy Products, Statis. Rptg. Serv., U.S. Dept. Agr., and Dairy Products, Statis. Rptg. Serv., U.S. Dept. Agr.
47

Table A*3—Production of An^rican--type cheese, annual and quarterly, 1960-74
Year : First ; quarter
: Second : quarter
: Third : quarter
: Fourth : quarter
• Total • • • • •
Annual index
—.__—__ TI lousand poim rio ______—.- 1960-100 ""■""■""- Li PS ———
1960 ! 208,655 322,674 252,177 212,612 996,118 100
1961 ; : 254,890 369,043 295,046 229,782 1,148,761 115
1962 ! 239,081 354,458 280,592 220,356 1,094,487 110
1963 : 232,114 358,877 291,744 225,616 1,108,351 112
1964 : 260,673 364,309 288,983 243,346 1,157,311 116
1965 ! ¡ 272,483 373,463 291,211 221,128 1,158,285 116
1966 i : 257,999 377,172 311,103 274,063 1,220,337 123
1967 i : 303,185 394,262 319,424 259,468 1,276,339 128
1968 ! '. 293,871 400,878 322,471 256,596 1,273,816 128
1969 ! ■ 273,964 385,633 327,984 278,847 1,266,428 127
1970 î ! 328,093 428,906 355,394 311,006 1,423,399 143
1971 ! ¡ 344,185 458,249 380,872 328,202 1,511,508 152
1972 ! .381,894 491,106 424,435 346,852 1,644,287 165
1973 1/ : , 383,737 499,017 402,946 386,815 1,672,515 168
1974 1/ i • 487,644 547,347 431.843 365,299 1,832,133 184
1/ Unrevised,
Sources : Production of Manufactured Dairy Products, Statis. Rptg. Serv., U.S. Dept. Agr., and Dairy Products, Statis. Rptg. Serv., U.S. Dept. Agr.
48

Table A .4—Production of Italian-type cheese, annual and quarterly, 1960-74
Year : First : quarter
: Second : quarter
: Third : quarter
: Fourth : quarter
• Total • • : Annual : index
^^ TYn^^t«^ #«T%^ 1960-100 ~ inousana pounds ——
1960 : 40,231 42,146 35,103 40,053 157,533 100
1961 : 42,629 43,388 34,881 40,901 161,799 103
1962 : 42,956 45,646 39,774 43,616 171,992 109
1963 ! 45,179 50,851 44,852 51,346 192,228 122
1964 ! 56,818 56,579 51,437 54,884 219,718 139
1965 i : 59,513 64,966 57,436 62,555 244,470 155
1966 ! 68,474 72,849 62,159 67,637 271,119 172
1967 ! , 71,802 73,891 66,791 71,972 284,456 181
1968 i 78,134 83,464 74,836 78,421 314,855 200
1969 i 85,671 95,136 87,321 93,126 361,254 229
1970 : 96,465 99,593 93,927 103,683 393,668 250
1971 : 108,879 117,700 108,195 119,087 453,861 288
1972 ': 130,701 135,655 121,854 123,933 512,143 325
1973 1/ : 133,725 154,548 131,926 145,071 565,270 359
1974 1/ : 145,501 155,184 144,187 156,412 601,284 382
1/ Unrevised.
Sources: Production of Manufactured Dairy Products, Statis. Rptg, Serv., U.S, Dept. Agr., and Dairy Products, Statis. Rptg. Serv., U.S. Dept. Agr.
49

Table A»5—Production of Swiss cheese, annual and quarterly, 1960-74
Year " First quarter
: Second : quarter
: Third : : quarter :
Fourth quarter
• Total • • • • • Annual index
Thousand pounds 1960-100
1960 27,282 34,765 31,755 27,279 121,081 100
1961 ■ 29,116 36,751 29,210 25,431 120,508 100
1962 26,587 31,179 27,212 24,434 109,412 90
1963 26,741 35,804 31,613 25,748 119,906 99
1964 27,380 35,652 31,442 27,370 121,844 101
1965 : 28,386 35,200 31,429 27,717 122,732 101
1966 ■ 32,425 40,068 35,810 28,361 136,664 113
1967 ! 28,773 36,679 36,078 30,674 132,204 109
1968 : 31,004 37,065 33,739 27,805 129,613 107
1969 : 29,354 37,294 33,787 31,177 131,612 109
1970 : 32,594 40,387 37,934 33,042 143,957 119
1971 : 33,829 41,868 39,418 38,728 153,843 127
1972 ! 40,702 46,906 45,229 44,936 177,773 147
1973 1/ : 43,390 48,585 39,059 33,187 164,221 136
1974 1/ : 43,710 49,645 47,032 41,523 181,910 150
1/ Unrevised,
Sources: Production of Manufactured Dairy Products, Statis. Rptg. Serv., U.S. Dept. Agr., and Dairy Products, Statis. Rptg. Serv., U.S. Dept. Agr.
50

Table A.6—Production of Cream and Neufchatel cheeses, annual and quarterly, 1960-74
Year : First : quarter
: Second : quarter
: Third : quarter
: Fourth : quarter : Total : • •
Annual index
Thousand pou r\Ao 1960=100 nas —————
1960 : ! 28,490 24,164 22,255 31,528 106,437 100
1961 Í 27,369 26.221 23.376 32,547 109,513 103
1962 ! . 29,710 25,780 28,280 37,918 121,688 114
1963 ! 29,223 26,791 24,840 34,561 115,415 108
1964 \ : 30,003 27,002 25,299 37,880 120,184 113
1965 i ! 29,359 27,625 27,956 37,769 122,709 115
1966 i • 30,333 24,397 25,651 36,003 116,384 109
1967 ! ! 30,051 26,069 26,961 38,573 121,654 114
1968 ! 27,296 27,885 25,872 37,806 118,859 112
1969 : 28,717 27,374 27,963 39,528 123,312 116
1970 i 30,219 27,565 27.958 40,356 126,098 118
1971 : 32,487 26,447 29,079 41,816 129,829 122
1972 : 31,277 28,651 29,535 43,795 133,258 125
1973 1/ : 31,097 33,379 32,308 42,880 139,664 131
1974 1/ : 30,777 35,246 34,519 45,564 146,106 137
1/ Unrevised.
Sources: Production of Manufactured Dairy Products, Statis. Rptg, Serv., U.S. Dept, Agr., and Dairy Products, Statis. Rptg. Serv., U.S. Dept. Agr.
51

Table A .7^—Production of other natural cheese, annual and quarterly, 1960-74
Year ; First quarter
: Second : quarter
: Third : : quarter :
Fourth quarter
• Total - • _ • - : Annual : index
■-^^..«..-.1—-»■> ' rhousand pounds 1960=100
1960 : 24,322 25,657 22,107 24,718 96,804 100
1961 : 23,973 24,458 21,309 24,184 93,924 97
1962 : 24,065 24,132 21,590 24,656 94,443 98
1963 : 24,456 24,396 21,842 25,223 95,917 99
1964 ! 27,389 25,820 24,036 27,334 104,579 108
1965 : 27,600 27,590 25,562 26,508 107.260 111
1966 ! ! 29,312 29,579 26,144 24,463 109,498 113
1967 : , 25,985 27,092 24,433 26^667 104,177 108
1968 ! ! 24,516 26,728 24,254 25^567 101,065 104
1969 ! ! 26,443 27,156 26,812 26,572 106,983 111
1970 ¡ ! 27,505 29,680 28,426 28,695 114,306 118
1971 : 29,926 32,500 30,079 32,769 125,274 129
1972 ! 34,478 35,223 33,516 33,927 137,144 142
1973 1/ : 37,279 38,569 34,018 33,814 143,680 148
1974 1/ : 35,264 34,667 34,835 31,737 136,503 141
¿/ Unrevised.
Sources: Production of Manufactured Dairy Products, Statis. Rptg. Serv., U.S. Dept, Agr., and Bairy Produc^ts, Statis. Rptg» Serv., U.S. Dept. Agr.
52

Table A,8—Production of process cheese products, 1960-73
Year ', Process cheese * Process cheese foods, spreads, and cold oack
: Production : Index ; Production : Index
: Thou. lbs. 1960-100 Thou. lbs. 1960-100
1960 : 462,090 100 225,878 100
1961 : 509,333 110 221,727 98
1962 '. 644,661 140 228,161 101
1963 ! 661,730 143 210,133 93
1964 Í 659,667 143 207,990 92
1965 1 ! 631,312 137 228,517 101
1966 i ! 621,787 135 262,436 116
1967 ! 724,301 157 285,885 127
1968 : 643,723 139 327,547 145
1969 Î 650,161 141 367,195 163
1970 ! 686,383 149 451,614 200
1971 : 750,772 162 479,553 212
1972 : 744,728 161 455,496 202
1973 i 720,690 156 441,777 196
Source: Production of Manufactured Dairy Products, Statis. Rptg. Serv., U.S. Dept. Agr.
53

Table A.9—Imports of all cheese, annual and quarterly, 1960-74
Importa as
Year ; First [ quarter
•
[ Second ] [ quarter
• *
Third ; quarter
Fourth ] quarter [ • Total .
*
proportion of : total annual ; natural cheese
production
_ _ _ ^ _ ^ ^ mt« >. msand pour %Ar% •...— «. Percent The Ids -------
1960 i 13,745 13,902 12,857 22,644 63,148 4.3
1961 : 19,691 19,300 15,792 21,039 75,822 4.6
1962 : 17,726 20,348 15,334 24,108 77,516 4.9
1963 : 19,386 24,436 14,598 25,680 83,100 5.2
1964 : 19,716 18,616 15,061 24,440 77,833 4.5
1965 : 17,191 21,237 13,765 27,117 79,310 4.5
1966 ! • 29,715 23,978 30,759 50,987 135,439 7.3
1967 : 46,690 46,489 26,833 31,768 151,780 7.9
1968 ': 27,311 37,164 66,408 39,366 170,249 8.8
1969 ! 21,558 38,037 32,120 52,386 144,101 7.2
1970 : 37,730 31,745 33,687 57,776 160,938 7.3
1971 ': 29,469 34,741 42,369 29,348 135,927 5.9
1972 : 43,737 33,118 44,552 58,083 179,490 6.9
1973 ': 41,361 48,539 58,507 81,393 229,800 8.6
1974 1/ ': 148,430 48,925 48,759 69,545 315,659 10.9
1/ Unrevised.
Source: Bureau of the Census, U.S. Dept. Commerce,
54

Table A.10—Imports of American-type cheese, annual and quarterly, 1960-74
Imports as
Year : First quarter
Second \ \ quarter
Third • quarter
Fourth [ quarter ' ; Total
: proportion of : total annual ¡natural American- : type production
>■■«■-_-■■* *T*T-i/- msand pout s>flo **.»• — . Percent ---- inc Ids -----—
1960 ; 1,868 2,339 243 2,646 7,096 .7
1961 : 6,498 5,446 3,258 2,108 17,310 1.5
1962 : 3,721 5,614 745 3,869 13,949 1.3
1963 : 4,633 6,811 1,175 5,470 18,089 1.6
1964 : 4,855 3,572 596 3,713 12,736 1.1
1965 : 5,822 4,503 702 4,980 16,007 1.4
1966 ; 11,709 5,988 12,544 19,898 50,139 4.1
1967 : 24,504 22,658 6,746 6,441 60,349 4.7
1968 : 2,226 3,059 2,763 7,655 15,703 1.2
1969 : 1,883 3,481 2,143 8,130 15,637 1.2
1970 : 4,383 1,403 816 9,048 15,650 1.1
1971 : 3,899 1,881 4,058 7,109 16,948 1.1
1972 \ l,3kl 1,550 4,038 7,542 15,472 .9
1973 : 4,268 8,157 6,228 9,787 28,440 1.8
1974 11 : 94,943 5,916 833 10,426 112,118 6.1
1/ Unrevised.
Source: Bureau of the Census, U.S. Dept. Commerce
55

Table A^ll—Imports of Italian-type cheese, annual and quarterly, 1960-74 1/
: Imports as
Year ; First ; quarter
[ Second \ quarter
; Third \ quarter
\ Fourth \ quarter ]
: Total : proportion of ; total annual :natural Italian- :tvpe production
. __.MM_ fVïy >usând poui ̂ Ao >--__•>. Percent ------ Tnc Ids
1960 • 3,954 3,972 3,434 8,641 20,001 12.7
1961 : 5,294 5,798 4,221 7,337 22,650 14.0
1962 : 6,483 6,291 5,524 8,746 27,044 15.7
1963 : 7,091 7,940 4,379 8,872 28,282 14.7
1964 : 4,889 6,266 5,571 8,875 25,601 11.7
1965 : 4,664 5,921 4,533 8,569 23,687 9.7
1966 ! 5,604 4,828 4,120 9,437 23,989 8.9
1967 : 6,117 7,397 4,883 7,258 25,655 9.0
1968 : 4,956 5,713 6,120 10,007 26,796 8.5
1969 : 5,896 8,845 7,172 9,601 31,514 8.7
1970 : 7,244 6,582 5,646 8,449 27,921 7.1
1971 • 7,070 6,385 6,366 4,053 23,876 5.3
1972 ; 11,070 6,722 7,114 10,121 35,128 6.8
1973 : 6,988 7,355 5,916 8,997 29,255 5.2
1974 2/ ■ 7,988 5,818 4,754 8,071 26,631 4.4
1/ Includes Romano, Pecorino, Reggiano, Parmesano, Provolini, and Provelette. 2/ Unrevised.
Source: Bureau of the Census, U.S. Bept. Commerce.
56

Table A.12--Imports of Swiss cheese, annual and quarterly, 1960-74 ll
: Imports as
Year \ First ■ quarter \
Second quarter
Third quarter
Fourth quarter : Total
proportion of total annual
natural swiss : production
■ _ » _ ^ ■• ^ mL- )usand pour *j« _—..——. Percent ._---_- ^j^d Ids -------
1960 3,069 2,950 3,853 4,814 14,686 12.1
1961 : 3,145 3,424 4,157 5,108 15,834 13.1
1962 : 3,406 3,500 4,441 5,977 17,324 15,8
1963 ! 3,464 3,694 4,197 5,235 16,590 13.8
1964 : 3,857 3,566 4,338 4,921 16,682 13.7
1965 ' 2,574 4,019 3,562 5,579 15,734 12.8
1966 : 4,826 4,431 6,031 8,555 23,843 17.5
1967 . 5,518 5,335 6,205 7,132 24,190 18.3
1968 : • 8,578 14,249 28,841 7,161 58,829 45.4
1969 : 4,982 7,247 9,521 11,007 32,757 24.9
1970 : 9,060 7,757 10,709 12,778 40,304 28.0
1971 : 8,927 8,580 12,628 5,781 35,917 23.4
1972 : 12,386 8,179 11,535 14,258 46,358 20.5
1973 : 12,758 12,671 17,229 22,581 65,240 39.6
1974 2/ : 21,434 18,783 20,389 18,561 79,167 43.5
1/ Includes Emmenthaler and Gruyere. 2/ Unrevised.
Source: Bureau of the Census, U.S. Dept. Commerce.
57

Table A.13--Ending commercial stocks of all cheese, quarterly, 1960-74
Fourth quarter stocks as
Year : First : quarter
Second : quarter
Third quarter
Fourth • : quarter
proportion of total annual
; natural cheese product ion
ml 1 -^^ 3- Percent J.11UUSCU1U MUUllUS
1960 ! 261,835 345,165 346.189 332,594 23
1961 : 341,084 452,351 501,192 472,935 29
1962 • 417,184 496,975 493,088 422,079 27
1963 ! 343,391 415,996 407,918 340,701 21
1964 ■ 301,743 381,780 363,486 325,952 19
1965 : 292,384 378,689 386,639 308,562 18
1966 275,680 369,654 398,366 372,668 20
1967 : 367,365 438,580 439,466 390,289 20
1968 ; ■ 351,404 420,751 447,267 380,963 20
1969 • 315,033 366,081 369,468 317,535 16
1970 286,192 368,256 363,534 324,483 15
1971 : 302,127 371,344 357,589 304,268 13
1972 287,316 376,294 404,010 331,444 13
1973 302,438 374,167 382,260 357,808 13
1974 ! 438,855 570,739 539,087 493,955 17
Source: Regional Cold Storage Holdings, Statis. Rptg. Serv., U.S. Dept. Agr.
58

Table A.14--Ending commercial stocks of American-type cheese, 1960-74
: Fourth quarter stocks as
Year : First ! Second ; . Third ¡ Fourth : : proportion of : quarter quarter : ' quarter • quarter total annual
natural American- ' type production
• ^ ^ ^ T^Vt ^^*« ^v m M ^ inousanc 1 pounds ---- Percent
1960 ' 228,222 304,111 304,237 292,011 29
1961 : 302,349 400,283 442,236 419,914 37
1962 : 367,823 454,493 457,107 384,246 35
1963 ! 309,303 373,915 363,863 301,631 27
1964 264,035 339,213 318,580 283,647 25
1965 : 252,314 333,187 340,579 270,988 23
1966 : 235,378 321,116 347,081 322,248 26
1967 : 317,936 384,838 386,106 344,047 27
1968 : 303,457 370,130 376,042 318,676 25
1969 : 260,180 307,021 309,034 265,438 21
1970 : 238,899 313,200 290,679 253,984 18
1971 : 236,281 296,402 283,674 238,900 16
1972 : 226,707 307,789 335,777 269,438 16
1973 : 244,955 307,527 310,507 290,299 17
1974 : 363,792 486,543 462,999 420,838 23
Source: Regional Cold Storage Holdings, Statis. Rptg. Serv., U.S. Dept. Agr.
59

Table A.15—Ending commercial stocks of Swiss cheese, quarterly, 1960-74
Year ' First ;
; quarter : Second ■ quarter
• Third ; quarter
Fourth ; : quarter
Fourth quarter stocks as
proportion of ; total annual ; natural Swiss
production
m-U Percent xiiuusauu iJuuuuB
1960 : 9,557 9,681 11,476 11,782 10
1961 12,070 18,076 21,457 16,728 14
1962 15,723 12,416 11,631 7,640 7
1963 7,990 9,540 12,299 10,270 9
1964 ! 9,404 10,817 11,048 8,805 7
1965 : 8,870 9,422 9,851 6,720 5
1966 ', 8,330 11,983 13,991 12,405 9
1967 ■ 12,101 12,662 13,345 10,987 8
1968 i 10,687 12,220 15,908 16,054 12
1969 11,764 11,562 12,590 10,313 8
1970 : ■ 10,472 9,835 10,744 12,644 9
1971 11,599 10,614 10,594 7,191 5
1972 : 7,103 8,926 9,322 8,122 5
1973 8,713 12,612 15,351 13,393 8
1974 15,891 13,837 13,810 15,130 8
Source: Regional Cold Storage Holdings, Statis. Rptg. Serv., U.S. Dept. Agr.
60

Table A.16—CGC purchases of Cheddar cheese, on a delivery basis
Calendar year ; Bulk 1/ • • Process : 709 section : Price support
Thousand pounds
1960 : 267 — —
1961 : 78,225 — 21,864
1962 : 113,853 — 100,433
1963 : 19,797 — 93,348
1964 : 25,785 — 103,527
1965 : 10,740 ~ 38,192
1966 : 10,820 —
1967 : 45,798 4,434 130,234
1968 ! ! 17,452 — 70,661
1969 ! 198 7,459 22,210
1970 : 3,614 6,048 39,279
1971 ! 2,747 5,309 82,622
1972 i . — 30,375
1973 ! ~ 1,176 2,016
1974 11 i 4,827 1,008 51,982
— ss None purchased. \j Prior to July 1961, all purchases were in bulk form. Ij An additional 2,485,000 pounds were purchased under Section 4(a) of the
Agriculture and Consumer Protection Act of 1973.
Source: Agr. Stabilization and Conservation Serv., U.S. Dept. Agr.
61

Table A.17—Cheese quotas, calendar year 1974
Cheese ; Quota
Thousand pounds
American; Cheddar Other
: 10,037.5 : 6,096.6
Edam and Gouda: Natural Processed
; 9,200.4 3,151.0
Blue Mold ! 5,017.0
Italian: Original loaves Other
11,500.1 : 1,494.0
Swiss or Etnmenthaler ll ! 20,420.0
Gruyere (process) 11 ! 11,242.0
Other cheeses and substitutes Over 0,5% butterfat 0.5% or less butterfat
1/: ! 40,730.0 : 8,901.0
Subtotal ! 127,789.6
Temporary quota of 100 million pounds for Cheddar for the period beginning January 3, 1974, and ending March 31, 1974* : 100.000.0
Total : 227,789.6
1/ Includes all cheese less than "pricebreak". The pricebreak is the Commodity Credit Corporation purchase price for Cheddar cheese, rounded to the nearest whole cent, plus 7 cents.
62

APPENDIX B~SAMPLE ANI) SURVEY PROCEDURE
All U.S. cheese manufacturing plants were stratified into three groups based on annual cheese production. The plant size groups in thousand pounds of annual pro- duction were: Small (less than 2,000), medium (2,000-9,999), and large (10,000 and greater). The initial sample allocation was based on the number of plants in each size group. The plants were then arrayed by major types of cheese production within the plant size groups for each State. A plant was classified by cheese type if 80 per- cent or more of annual production in 1973 was of that type. Other plants were classi- fied as mixed types if the production of no single type of cheese predominated. The cheese types were American, Italian, Swiss, other, and mixed cheeses.
From these arrays a sampling interval and random start were determined to select a systematic random sample. This ensured a proportional representation of all type plants. All plants in the large plant size strata were selected for the sample.
A survey of these sample cheese manufacturing plants was conducted by mail questionnaire during March and April, 1974. The questionnaire was sent to a sample of 316 plants out of a population of 901 plants in 1972 (see tables B.l, B.2). The National Cheese Institute aided in constructing the questions. The initial mailing was followed by a second mailing one week later. A nonresponse sample was conducted in the third week using the same sampling techniques, followed by a telephone reminder call. Of the 225 usable questionnaires returned, 15 were from the nonresponse sample.
The sample plants were grouped into three regions for reporting the results in some sections of the bulletin. For a complete plant description, data from the questionnaire were combined with plant production data reported annually. The identity of the individual plants was kept confidential for both the questionnaire results and the production data. Annual production was reported for American cheese, Italian cheese, Swiss cheese, other cheese, butter, condensed products, dry milk, other manufactured products, and total milk received. The sample allocation and sample frame are based on 1972 data listing plants by size, although all data reported are for 1973.
The plants in the sample produced 1,559 million pounds of cheese in 1973 (58.1 percent of the 1973 total U.S. production). The sample American plants produced 999 million pounds (59.8 percent), the sample St^iss plants, 128 million pounds (78.0 percent), and the sample Italian plants, 274 million pounds (48.5 percent).
The results were reported in one of three different forms based on sample data limits and usefulness. In the first form, summary data from only the survey plants were reported. There were either too few plants in the sample to draw any generalizations here, or the weights were unavailable to expand the data.
In the second form, average per plant data were reported using weights derived from the number of plants in each group in 1972. It was assumed the proportion of plants in each group did not change significantly for 1973. The national total can be obtained by multiplying average per plant data by the total number of plants in 1973.
The third form reported information on the total industry by region and plant size which was inferred from the ample results. This was based on weights derived from the proportion of cheese production in that group.
63
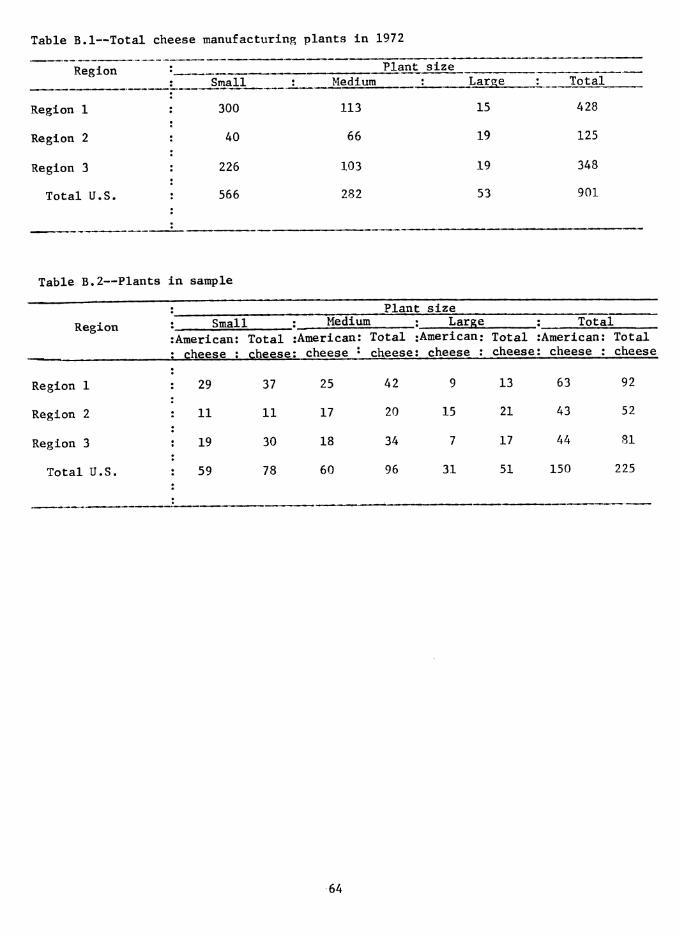
Table B.l—Total cheese manufacturing plants in 1972
Region '• Plant size ! Small : Medium Larpie : Total
Region 1 : 300 113 15 428
Region 2 40 66 19 125
Region 3 : 226 103 19 348
Total U.S. : 566 282 53 901
Table B.2—Plants in sample
Plant size
Region * Small : Medium : Large • Total
American: ' cheese :
Total cheese
:Âmerican: : cheese •
Total «American:
cheese: cheese : Total cheese
:American: : cheese :
Total cheese
Region 1 : 29 37 25 42 9 13 63 92
Region 2 11 11 17 20 15 21 43 52
Region 3 19 30 18 34 7 17 44 31
Total U.S. : 59 78 60 96 31 51 150 225
64

APPENDIX G—QUESTIONNAIRE ON STRUCllRE AND ORGANIZATION OF CHEESE PLANTS
(ALL QUESTIONS REFER TO 1973,)
SECTION I. GENERAL PLANT DESCRIPTION
1. What is the structure of the work iorce at this plant (average number of workers in 1973)?
a. Managerial and supervisory personnel Number.
b. Production personnel:
(1) Skilled (Specify .. ) ,..Number,
(Specify ) Number
(Specify — ) Number
(2) Maintenance and support personnel Number ^
c. TOTAL WORK FORCE Ca ^ b(l) ^ b(2)3 Number
2. Iluw old is this plant? - ^^^^^ .
3. Whiit is the type of organiiation? (Enter Code)
Code 1 - Multi-unit corporation 2 - Single unit corporation rODP 3 - Local proprietorship or partnership Cüüt 4 - Regional proprietorship or partnership 5 - National proprietorship or partnership 6 - Multi-unit cooperative 7 - Single unit cooperative
4. Has the plant been remodeled, expanded or had major improvements in the last three years, 1971 - 73?
NO L;_1 YES □-Briefly describe: — —
SECTION II. CHEESE AND CHEESE PRODUCTS
S. How nuicli cheese powder was produced in this plant in 1973? Pounds _
t>. How much dehydrated cheese was produced in this plant in 1973? Pounds ^
65

SECTION II. CHEESE AND CHEESE PRODUCTS (ConU
7. Of the American Natural cheese produced in 1973 in this plant, what perccMit of the total production was in each of the following forms or styles? (Include Cheddar, Colby, stirred curd, washed curd, Monterey and Jack.)
ÍÍ, Lonj^horn • .....-., « c,..., - %_
b- Dfiisy - , -. - - %.
c- Micl^cí .,«-,,, ,.., o., %_
d, Cheddar , » %
o- 40 pound block .-...- » - - «., , ».. «.. » %
f. 60 pound block „......,,,-....., ..,.,,.... %
g« 500 pound barrel ., - ..o...,....- , %
h. 640 pound block ^
i. Other (Specify) . •. - - « ^
__„ %
Total 100%
H. Of the other than American cheese produced in 1973 in this plant, what percent was of the following major varieties and styles?
u. Rindless Swiss
b- Wheel Swiss - • • • - -
c. Block Mozzarella .,...,.... •
d. Blue
e. Other (Specify) —
Total 100%
9. Had you considered manufacturing other vorietles of cheese in the last three years?
NO n YES [71 - What varieties?
a. Reasons for not manufacturing other varieties. (Money, equipment, location, milk supply, market, etc.)
66
%
%

SECTION II. CHEESE AND CHEESE PRODUCTS (Cont.)
10. What disposition was made of the liquid whoy produced in this plant in 1973? (Percent of total)
a. Sold for further processing
b. Condensed » ,
c- Dried ,
d. Modified - ,...
e. Dumped in:
(1) Municipal sewer ,
(2) Private sewage treatment plant.
(3) Lagoon
(4) Irrigation systems
f. Other (Specify
Totol 100%
II. What percent of the total 1973 cheese production of this plant was produced in each of the following seasons?
a. Spring (March, April and May)
b. Summer (June, July, August)
c. Fall (September, October, November)
d. Winter (December, January and February).
Total 100%
%
12. What percent of the average weekly production in 1973, was produced each day during the flush season and short season?
a. Mondiiy ...
b. Tuesday ..
c- Wednesday
d- Thursday..
e. Friday
f. Saturday .,
g. Sunday....
Flush Short
% %
% %
% %
% %
% %
% %
% %
Total 100% 100%
67
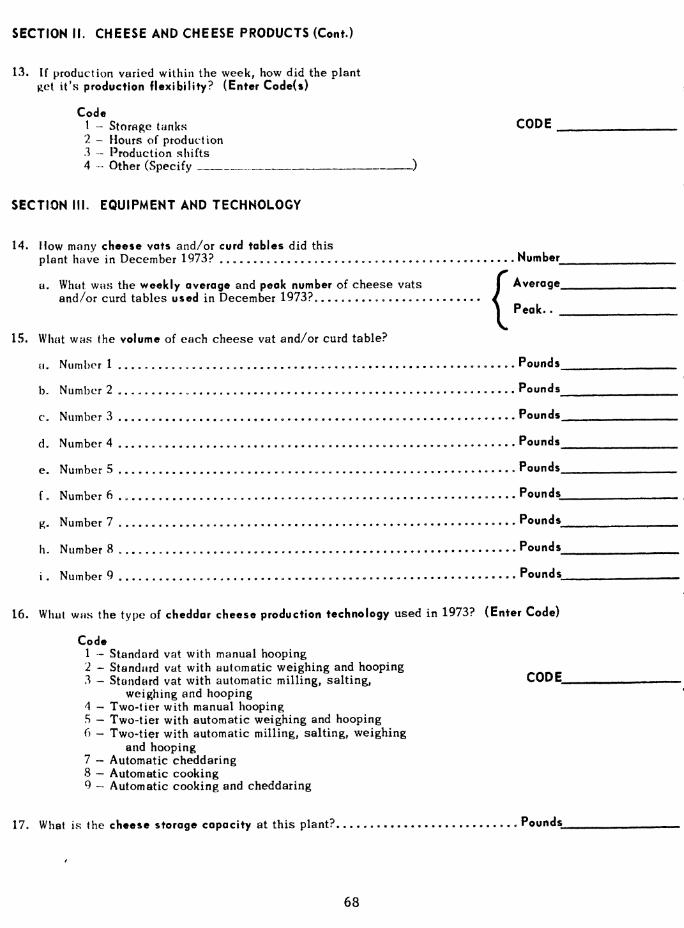
SECTION II. CHEESE AND CHEESE PRODUCTS (Cont.)
13. If production varied within the week, how did the plant get it's production flexibility? (Enter Code($)
Code 1 " Storftge tanks CODE _ 2 - Hours of production 3 - Production shifts 4 " Other (Specify )
SECTION III. EQUIPMENT AND TECHNOLOGY
14. How many cheese vats and/or curd tables did this plant have in December 1973? „...,,, Number^
a. What was the weekly average and peak number of cheese vats I Average^ and/or curd tables used in December 1973? .. — .,.., /
Peak..
15. What was the volume of each cheese vat and/or curd table?
a. Number 1 - Pounds^
b. Number 2 , - Pounds^
c. Number 3 Pounds,
d. Number 4 , ,.,., Pounds^
e. Number 5 Pounds.
f. Number 6 Pounds^
g. Number 7 Pounds^
h. Number 8 Pounds^^^
i. Number 9 Pounds^
16. What was the type of cheddar cheese production technology used in 1973? (Enter Code)
Code 1 - Standard vat with manual hooping 2 - Standard vat with automatic weighing and hooping 3 - Standard vat with automatic milling, salting, CODE^
weighing and hooping 4 - Two-tier with manual hooping 5 — Two-tier with automatic weighing and hooping 6 - Two-tier with automatic milling, salting, weighing
and hooping 7 — Automatic cheddaring 8 — Automatic cooking 9 - Automatic cooking and cheddaring
17. What is the cheese storage capacity at this plant? Pounds^
68

SECTION III. EQUIPMENT AND TECHNOLOGY (Cont.)
18. What is the average number of days each of the following types of cheese is stored at the plant or at a plant leased cooler before it is marketed?
a. Cheddar , , „ Days
^- Colby „,, _ „ ^ Days.
c. Swiss o , o Days
d. Italian , , Days
í^ Other (Specify) Days
.._ Days,
Days_
1 ^). What percent of the cheese is graded at your plant?.., , %
SECTION IV. MILK AND MILK STANDARDIZATION
20. What percent of the total milk bought for cheese in 1973 was from each of the following sources?
a. Individual producers, bulk.., , , %__
b- Individual producers, can . - %_
c. Directly from producer cooperatives %
d. Ot her plants or receiving stations , %_
t\ Other (Specify) ..... . %
Total 100% 21. If individual producers supplied part of the milk:
a- What was the average number of these producers in -
(1) June 1973? Number
(2) November 1973?. Number
b. How far were these producers from the plant?
(1) P"^arthest Miles
(2) Closest Miles
(3) Average Miles
22. What percent of the total milk supply used for cheese manufacture in 1973 was GRADE A?.
69
%

SECTION IV. MILK AND MILK STANDARDIZATION (Cont.)
23. What is the total milk storage capacity at the plant? .. • • Gallons
24. Do you standardize milk received? YES \_ \ NO [^]
a. If YES, give millcfat content of standardized milk used to manufacture-
il) American natural types..,-... • • Mtlkfat
(2) Swiss Mi Ikfat
(3) Italian, Mozzarella Mllkfat
(4) Other Italian types , Milkfat
(5) Other varieties Milkfat
SECTION V. DISPOSITION
25. What percent of the plant's cheese production in. 1973 was sold to each of the following buyers?
a. Assembler t
b. Retail food chain » • -
c. National cheese company •••,•..
d. Wholesaler • •
i\ Marketing cooperative • •
f - Broker •
g. Government, under price support or related programs
h. F'ood company outside the dairy industry
i. Retail sales by plant
j. Other (Specify) —
Total 100%
26. What percent of the total cheese production in 1973 was transported from this plant to the first buyer by:
a. Truck?
b. Rail?
J0
%
%
%
%
70

SECTION V. DISPOSITION (Cont.)
27. If cheese was transported by trucks, who owns them? (Enter Cod«)
Cod« 1 - This plant or associated with this firm 2 - Buyer CODE 3 - Independent trucking company 4 - Other (Specify , )
28. How fnr was the choeso transported to the first buyer in 1973?
u. Farthest distance Miles
b. Average distance Miles
29. What is the pickup Interval at the plant for cheese? (Report percent of total movement.)
a. Each day , , ^.,...,..,.,
b. Every other day , ,.., ,
c. Twice a week ......•,.
d. Once a week , ,....,,..
e. Once a month. ^
f. Other (Specify )
Total 100%
Thank you.
Ploase ch&ck hare Q] if you would like to receive a report of the results of tfiis survey.
71