the child trust fund · 1.3 aims and objectives the overall aims of this evaluation of the ctf were...
TRANSCRIPT

THE CHILD TRUST FUND FINDINGS FROM THE WAVE 2 EVALUATION
ELAINE KEMPSON, ANDREA FINNEY AND SARA DAVIES
PERSONAL FINANCE RESEARCH CENTRE UNIVERSITY OF BRISTOL
JANUARY 2011
HM Revenue and Customs Research Report 143

CHILD TRUST FUND WAVE 2 EVALUATION
Disclaimer
„The views expressed in this report are those of the authors and do not necessarily represent those of HM Revenue & Customs or HM Treasury.‟
© Crown Copyright 2011
Copyright in the typographical arrangement and design rests with the Crown. This publication may be reported free of charge in any format or medium provided that it is reproduced accurately and not used in a misleading context. The material must be acknowledged as Crown copyright with the title and source of the publication specified.
Published by HM Revenue & Customs, June 2011
www.hmrc.gov.uk
CHILD TRUST FUND WAVE 2 EVALUATION
Contents
1 Introduction .................................................................................................................... 1
1.1 Policy background................................................................................................... 1
1.2 Baseline study and ongoing data collection ............................................................ 2
1.3 Aims and objectives ................................................................................................ 2
1.4 Method .................................................................................................................... 3
1.5 The structure of this report ...................................................................................... 5
2 Child Trust Fund account opening and management ..................................................... 7
2.1 Who opened the CTF account ................................................................................ 7
2.2 Experience of opening the account and making choices ....................................... 12
2.3 Account management ........................................................................................... 16
3 Saving into Child Trust Fund accounts ......................................................................... 19
3.1 Overview of payments into accounts ..................................................................... 19
3.2 Contributions made by parents ............................................................................. 24
3.3 Contributions to CTF accounts by others .............................................................. 34
3.4 Total amounts held in CTF accounts ..................................................................... 35
4 Other savings and investments held for children .......................................................... 38
4.1 Other accounts opened for CTF eligible children .................................................. 38
4.2 Saving in the previous 12 months ......................................................................... 42
4.3 Total amounts saved or invested .......................................................................... 44
4.4 How amounts saved elsewhere compared with saving into the CTF ..................... 45
5 Impact of the Child Trust Fund on saving for and by children ....................................... 50
5.1 Effect of Government payments on saving into the CTF by parents ...................... 52
5.2 Effect of CTF on other account holding and amounts saved elsewhere ................ 52
5.3 Effect of CTF on total saving for children .............................................................. 55
5.4 Effect of the CTF on saving by children ................................................................. 62
5.5 How parents intend CTF savings to be used ......................................................... 64
5.6 Effect of CTF on saving for other (non-eligible) children ........................................ 65
5.7 Overview of the effect of the Child Trust Fund ...................................................... 65

CHILD TRUST FUND WAVE 2 EVALUATION
List of tables
Table 2.1 Who opened the child's CTF, by socio-demographic and other characteristics 9
Table 3.1 Contributions made to the CTF, by socio-demographic and other characteristics ................................................................................................ 21
Table 3.2 Parental contributions to CTF, actual and anticipated rates ........................... 25
Table 3.3 Pattern of payments and amount paid in by parents into CTF account, by socio-demographic and other characteristics ................................................. 27
Table 3.4 Reasons why parents have not contributed to CTF account, by pattern of payments ....................................................................................................... 31
Table 3.5 Where the money parents paid into CTF in last 12 months came from .......... 32
Table 3.6 Whether amount of money respondent pays into CTF account would change 33
Table 3.7 Average total amount held in CTF, by socio-demographic and other characteristics ................................................................................................ 36
Table 4.1 Levels of savings in other accounts, by socio-demographic and other characteristics ................................................................................................ 40
Table 4.2 Total amount saved for child in the last 12 months, comparing CTF and other accounts ........................................................................................................ 45
Table 4.3 Total amount currently held in savings, comparing CTF and other accounts .. 45
Table 4.4 Whether child had more money saved in CTF or elsewhere, by socio-demographic and other characteristics........................................................... 47
Table 5.1 Impact of the CTF on children‟s other saving, investment or insurance account holding ........................................................................................................... 53
Table 5.2 Impact of the CTF on amounts held in other saving and investment accounts 54
Table 5.3 Impact of CTF on any saving into other accounts in the last 12 months ......... 54
Table 5.4 Impact of the CTF on amount saved into other accounts in the last 12 months .. ...................................................................................................................... 55
Table 5.5 Impact of the CTF on total active saving in the last 12 months ....................... 58
Table 5.6 Impact of the CTF on total amount saved in the last 12 months ..................... 58
Table 5.7 Impact of the CTF on regular saving by parents in the last 12 months ........... 59
Table 5.8 Impact of the CTF on total savings held ......................................................... 60
Table 5.9 Impact of the CTF on total savings held, by key characteristics ..................... 61
Table 5.10 Impact of the CTF on total savings held, by parent saving attitudes and behaviour ....................................................................................................... 62
Table 5.11 How parents intend money saved in the CTF and elsewhere to be used ....... 65

INTRODUCTION
1
1 Introduction
The Child Trust Fund (CTF) was a Government initiative that provided an asset for every eligible child in the United Kingdom born since 1 September 2002. HM Revenue & Customs commissioned the Personal Finance Research Centre (PFRC) and TNS-BMRB to undertake an evaluation of the CTF to explore perceptions of its delivery and examine whether there was evidence of early impacts of the initiative in terms of parents‟ and guardians‟ attitudes and behaviour towards saving for children. This evaluation was undertaken five years after the inception of the initiative in 2005 as the first cohort of children eligible for a CTF account was turning seven years old.
1.1 Policy background
The CTF was a major savings policy initiative introduced by the Government of 1997 to 2010. It was aimed at promoting asset accumulation among young people, with three core objectives:
To create an asset for every eligible child to access when they turned 18
To build and strengthen a savings habit among parents and children
To promote financial education.
Detailed proposals for the scheme were published in October 2003 and the Child Trust Fund Act was passed in May 2004. Under the scheme, CTF accounts were available from April 2005 for all children born on or after 1 September 2002 who were eligible for Child Benefit or in Local Authority care.
Under the scheme, the parents or guardians (herein referred to as „parents‟) of all babies who were eligible for a CTF received a £250 voucher that could be used to open a CTF on behalf of their new born baby within one year of the issue of the voucher. Children in low-income families received an additional £250 payment into their CTF;1 a further £250 (or £500 for children in low-income families) was paid into the CTF by the Government when the child reached seven years of age. At the time this interim evaluation of the CTF was commissioned, the first of these age-seven payments were being made.
While the evaluation was being completed, the current coalition Government announced on 24 May 2010 proposals to reduce and eventually cancel the CTF. The Government contributions at birth were reduced from £250 to £50 (or from £500 to £100 for those living in a low-income household) for children born in the period August to December 2010. Additional payments made when a child reached the age of seven ceased for children who turned seven after 31 July 2010. Children born after 2 January 2011 do not qualify for a CTF account. Regulations made on 22 July 2010 implemented the first phase of these changes from August 2010. The „Savings Accounts and Health in Pregnancy Grant Bill‟ received royal assent in December 2010 and introduced the remaining changes from January 2011.
There were three main types of CTF account and a wide range of providers, including banks, credit unions and insurance companies. All providers had to offer a stakeholder account, but they could also offer cash (savings) accounts. If parents did not choose a CTF account
1 Low income being defined as those receiving Child Tax Credit (CTC), where the household income
is not greater than the CTF threshold of £16,190 for 2010/11 2010, or where the person in receipt of CTC was also in receipt of Income Support, Income-based Jobseekers‟ Allowance, Pension Credit or Employment Support Allowance.

CHILD TRUST FUND WAVE 2 EVALUATION
2
within the first year, the voucher was automatically invested by HM Revenue & Customs into a stakeholder account for the child, with providers being chosen on a rotating basis. These were known as Revenue Allocated Accounts (RAA).
Parents, family, friends and children are able to contribute up to a total of £1,200 a year into the CTF account. This will continue to be the case for those who have accounts when government payments to CTF have ceased. All income and gains from the account are exempt from personal tax. Contributions are not, however, tax deductable. Parents (who
manage the account until the child reaches age 16) can switch CTF accounts at any point, but money cannot be withdrawn from the account by the parent. From the age of 16 children can control the accounts but the investment cannot be withdrawn before age 18. Once the 18-year old has access to the money they can spend or invest it as they wish.
1.2 Baseline study and ongoing data collection
At the inception of the CTF, HM Revenue & Customs commissioned a baseline study to describe the levels of saving for, and by, children.2 The study was undertaken during 2005 and early 2006 (referred to herein as 2005) and involved three face-to-face surveys with parents and children, depth interviews with parents and CTF providers and a review of CTF provision. The report of the 2005 survey provides baseline data on account holding and saving by and for children up to the age of 18. It also provides some early evidence on choosing and opening an account and intentions with regard to saving in CTF accounts (CTF-eligible children at that time were over-sampled to enable this analysis). This evaluation draws on the baseline survey with parents to make cross-sectional comparisons of account holding and saving for children between 2010 and 2005, as well as comparing parents‟ actual saving behaviour in relation to the CTF in 2010 with the intentions expressed by their counterparts in 2005.
In addition to the baseline data, HM Revenue & Customs has collected monitoring data. The most recent report of these was published in December 2010.
1.3 Aims and objectives
The overall aims of this evaluation of the CTF were to explore perceptions of CTF delivery and to consider how the CTF has achieved its objectives in relation to parents‟/guardians‟ attitudes and behaviour regarding saving for children.
Within these, the evaluation set out to address a number of research questions under the following broad themes:
Experience of the account-opening process, choosing the account type and product provider and the role of information and advice
Understanding why some parents do not open an account for their child
Satisfaction with accounts held, monitoring of these by parents and levels of account switching, and parents‟ understanding and views of the CTF account rules
Levels and patterns of saving into the CTF and the amounts held in these, who contributes to the account, and where the money paid in comes from
How parents would like their children to use these savings in the future
Other account holding for children, levels of saving into these and who contributes
The early effects of the CTF on levels of saving for CTF-eligible children and on saving for non-eligible children, including the total amounts saved for children
2 See Kempson, E., Atkinson A., and Collard, S. (2006) „Saving for children: a baseline survey at the
inception of the Child Trust Fund‟ HM Revenue & Customs Research Report 18. London: HM Revenue & Customs.
INTRODUCTION
3
The early effects of the CTF on saving by children.
In relation to the last two points above, a key question for the research was to identify whether the CTF has added to savings that would otherwise have been made or whether it has acted as a substitute either in part or in whole. There are two aspects to this. First, whether parents have discounted the initial contribution from the Government when deciding how much to save for the child themselves. Second, where they have made contributions to the CTF, whether these have been matched by a corresponding reduction in other saving. In order to assess these effects, the evaluation incorporated into the (survey) design a comparator group of children who were two years older than the oldest CTF birth-cohort. Levels of saving for these children in 2010 were in turn compared back to levels of saving for children of a similar age in the 2005 baseline survey. Section 1.4 provides further details.
1.4 Method
This evaluation comprised two main elements: a nationally (UK) representative quantitative survey of parents of children eligible for the CTF (that is children born after 1 September 2002) and a comparator group of parents of children born prior to 1 September 2002 and who were therefore not eligible for the CTF; and qualitative interviews with parents of children eligible for the CTF.
1.4.1 Survey of parents
Fully structured quantitative interviews were undertaken with 2,027 parents of children eligible for the CTF. These children were all aged from birth to seven years at the time of the interview and were sampled from the Child Benefit Register.3 Interviews were undertaken by telephone by computer-assisted interviewing methods (CATI). The questionnaire included topics on CTF account opening and contributions made into these, other account holding and saving into these, views and understanding of the CTF rules, children‟s saving behaviour, parent‟s own saving, their attitudes towards saving for children and levels of credit use and current account holding. Details of the household‟s composition and socio-economic status were also collected.
Interviews were also undertaken with a comparator group of 522 parents of children aged seven to nine years at the time of the survey who were not eligible for a CTF account but who were closest in age to the first cohort of children who were eligible. These parents were asked a similar set of questions to the parents of CTF-eligible children, excluding the sections relating specifically to the CTF. The purpose of interviewing the comparator group was to enable comparisons of the levels of saving for children who were eligible for the CTF with those who were not, drawing on levels of saving into other accounts for the non-eligible children.
Comparisons of findings from the 2010 survey for CTF-eligible children are also made back to the 2005 baseline survey. These include comparisons of levels of actual account opening with intentions expressed by parents at the inception of the CTF and levels of saving into other accounts for children before and after the CTF was available. For those topics, the 2010 questionnaire was therefore designed to replicate the questionnaire for 2005 as far as possible. Two main differences should be noted, however, relating directly and indirectly to the method of data collection in the 2010 and 2005 surveys.
First, while telephone interviews were undertaken in 2010, the 2005 survey used face-to-face interviewing. Face-to-face interviews are generally considered to produce the most
3 Only children born before June 2009 were sampled, as data were not available for those born after
this time. Note that minimal management information was shared and for the purposes of the research only. See Appendix 1 in the separate volume of methodological appendices for details.

CHILD TRUST FUND WAVE 2 EVALUATION
4
reliable survey data. This is because they permit the use of „showcards‟ (visual aids) to help prompt respondents when pre-set answer codes are lengthy and they also optimise the opportunity for interviewers to probe respondents answers fully. Use of telephone interviewing prevents the use of showcards and militates against full interviewer probing. Adoption of data collection by telephone is also likely to explain the lower response rate of 49 per cent in the 2010 survey compared with 69 per cent in the 2005 survey.
Second, given greater constraints on the length of interviews in 2010, questions relating to other account holding were asked collectively of these other accounts, by type of account (saving deposit, investment and insurance policies), wherever more than one account of each type was held. Each individual account was enquired about in 2005. As a result of these differences there could be pronounced effects on the answers given, and all comparisons are made with caution.
The „counterfactual‟ to levels of saving for CTF-eligible children in 2010 (that is, what level of saving for children would have been observed in 2010 in the absence of the CTF) is provided with the help of two groups of children: the comparator group of CTF non-eligible children covered by the 2010 survey; and non-eligible children covered by the 2005 baseline survey. By comparing, on the one hand, changes in levels of saving for the CTF-eligible children in 2010 with children of a similar age in 2005 with, on the other hand, changes in levels of saving for non-eligible children in the 2010 with their age counterparts in the 2005, it is possible to provide an indication of what would have happened to levels of saving for children in the absence of the CTF. This double comparison, known as „difference-in-differences‟ (DiD) overcomes any effects of the different data collection methodologies between the 2005 and 2010 surveys. However, it does not control for potential effects (direct or indirect) of the CTF on levels of saving for the children who just missed out on being eligible for the CTF. The DiD methodology and the analyses undertaken for this evaluation are described in chapter five.
The period between 2005 and 2010 saw severe difficulties in the macro economic climate. The UK officially entered recession in the second quarter of 2008, emerging (albeit weakly) in quarter four of 2009 after six consecutive quarters of contraction. This may have impacted on CTF saving in the short term two main ways, first in the propensity for parents and others to have added to CTF accounts, and second in the rates of interest and investment growth on account balances. This should be borne in mind when interpreting absolute levels of CTF saving (and saving in other accounts). However, the DiD methodology effectively controls for the effect of the macro economic climate when assessing the impact of the policy on saving levels.
All survey fieldwork and data preparation were undertaken by TNS-BMRB. PFRC designed the questionnaire in consultation with HM Revenue & Customs and TNS-BMRB. All analysis and reporting was undertaken by PFRC. Full details of the 2010 survey methodology and the questionnaire can be found in the separate volume of methodological appendices.
1.4.2 Qualitative interviews
Qualitative interviews were undertaken with parents of children who were eligible for the CTF to help provide explanations for answers to key questions asked in the quantitative survey. These interviews were undertaken during and after the survey interviews, the participants being drawn from respondents to the survey. Thirty depth interviews were undertaken in total: ten with parents who opened the account themselves and had made further contributions, ten with parents who opened the account themselves but had not made further contributions, and ten with parents whose child had an RAA. Soft quotas were also set to ensure a good spread of accounts with and without the Government‟s Additional Payment Award and parents of children of different ages.

INTRODUCTION
5
The qualitative research was undertaken by PFRC. Further details, including the topic guides, can be found in the separate volume of methodological appendices.
1.5 The structure of this report
Chapter two begins by considering aspects of the CTF account-opening process including who opened the account for the child, how parents made their choice of provider and type of account (cash, stakeholder and other equity-based accounts) and the role of the information that was available from HM Revenue & Customs in this. In doing so, it also examines which types of children were most likely to have an RAA and the reasons why the parents of these children did not open the account themselves. The chapter ends by looking at parents‟ satisfaction with the service they had received from CTF providers, levels of account switching and how carefully parents read CTF account statements.
Chapter three examines levels of saving into CTF accounts by parents and other individuals. Patterns of saving into the account by parents and the drivers of these patterns are examined in particular detail. Where parents have made no payments into their child‟s CTF, the reasons for this are explored. This chapter also looks at the extent to which parents had attempted to pay similar amounts into the CTF of all their CTF-eligible children, the influence of the CTF rules on parents‟ saving levels and provides an analysis of the factors that encouraged parents to save into the CTF or discouraged them from doing so. The chapter ends with an analysis of the total amounts saved in CTF accounts.
Chapter four turns the focus towards saving for CTF-eligible children in other vehicles, including saving deposit accounts, investments and insurance policies. The chapter starts by looking at levels of account holding and rates of saving into these accounts. It also examines the average amounts children held in these accounts, before making explicit comparisons between this and the amounts held in CTF accounts.
Chapter five builds on the analysis presented in the previous two chapters to assess the effect of the CTF on saving for children. It does this using three broad approaches. First, it considers parents‟ own views of the extent to which the CTF has impacted on their levels of saving for their CTF-eligible children, the extent to which it has affected whether they discuss saving with their children and how much they save for their other non-eligible children. Second, it examines saving for CTF-eligible children by parents in its totality, exploring the overlap between saving into the CTF and elsewhere. It identifies seven types of parents according to their patterns of saving and the factors that determine these patterns.
Finally, chapter five uses a difference-in-differences methodology to estimate the impact of the CTF on various measures of levels of saving for children for children aged five and six in 2010. This approach compares changes in the rates of saving between 2005 when the baseline survey of saving for children was undertaken and 2010 for five and six-year olds (who in 2010 were eligible for the CTF) against a comparator group of eight- and nine-year olds (who were not eligible for the CTF). This chapter concludes with an overview of the impact of the CTF and an assessment of the children who had benefited most from it.
1.5.1 Reporting conventions
The findings reported throughout the report are drawn primarily from the quantitative survey of parents. Findings from the qualitative interviews are included only where they provide additional insight to parents‟ attitudes and behaviours.
All estimates are based on weighted data. Percentages are reported rounded to the nearest whole number. This may result in figures in the tables or text not appearing to sum (or subtract) correctly. All tables give the unweighted bases. Survey estimates based on a sample size of fewer than 50 cases have been suppressed (indicated by „..‟ in tables). It is

CHILD TRUST FUND WAVE 2 EVALUATION
6
recommended that any figures based on a sample size of fewer than 100 cases are treated with caution as the sampling error is likely to be large.
CTF ACCOUNT OPENING AND MANAGEMENT
7
2 Child Trust Fund account opening and management
This chapter examines the experience of Child Trust Fund (CTF) account opening, the information used to inform the choice as well as any difficulties with choosing, and the reasons for not opening an account personally.
Summary
In most cases (86 per cent), parents said they found it easy to know what to do with
the vouchers and the majority (78 per cent) had opened the CTF themselves
Most of those who opened the accounts found it easy to choose the provider (79 per
cent), often choosing one they had an existing relationship with, and to choose the
type of account (80 per cent)
The information sent by HM Revenue & Customs was the most common form of
information relied upon to help make the decision (25 per cent) and the majority of
parents (86 per cent) were satisfied with this information
Although many who had Revenue Allocated accounts (RAA) said that they had „just
not got round to‟ opening an account, there were often underlying barriers to account
opening
For a substantial minority, the wide range of accounts and providers was one of the
main barriers to choosing and opening a CTF account
Similar barriers increased the amount of time it took some parents to eventually open
the account
Only a half of parents knew accurately which type of CTF account they had
Most parents (84 per cent) were happy with the service of the CTF provider.
Nonetheless, fewer than a half of parents knew they had the option to switch
accounts and only a third read the statements carefully.
2.1 Who opened the CTF account
The great majority of the parents interviewed (78 per cent) whose child had a CTF account said that they had either opened the account personally or that their partner had done so. Most of the rest (19 per cent) had accounts that were opened on their behalf by HM Revenue & Customs through the Revenue account allocation process, with a further two per cent not knowing who had opened the account. A small proportion of parents interviewed (one per cent) said that someone else had opened the account.

CHILD TRUST FUND WAVE 2 EVALUATION
8
This is broadly consistent with management information collected by HM Revenue & Customs, which also shows that the proportion of parents not opening an account themselves has remained fairly constant over time.4
In fact 85 per cent of parents whose child is recorded in the management information as having an RAA said that the account had been opened by the government for them; six per cent did not know who had opened it and nine per cent thought, mistakenly, that they had opened it themselves. Among those where the management information showed that the account had not been opened by the government 91 per cent said that they had opened it personally; one per cent that someone else had opened it; eight per cent believed that the government had opened it for them; and one per cent did not know who had opened it. Despite these inaccuracies, this report has used parental reporting of who had opened the account rather than the management information, which was incomplete for children aged under two.
The proportion with an RAA is somewhat higher than the intentions reported by parents when the Child Trust Fund was first launched would have suggested. The baseline survey, which was conducted as the first cohort of parents were beginning to receive their Child Trust Fund vouchers, showed that 99 per cent of parent had already opened or said that they intended to open an account themselves. This discrepancy between intentions and the level of actual account opening by parents is examined in sections 2.1.2 and 2.1.3 which look, respectively, at the characteristics most associated with not having opened an account and the reasons for not opening one.
2.1.1 Characteristics of those most and least likely to open accounts themselves
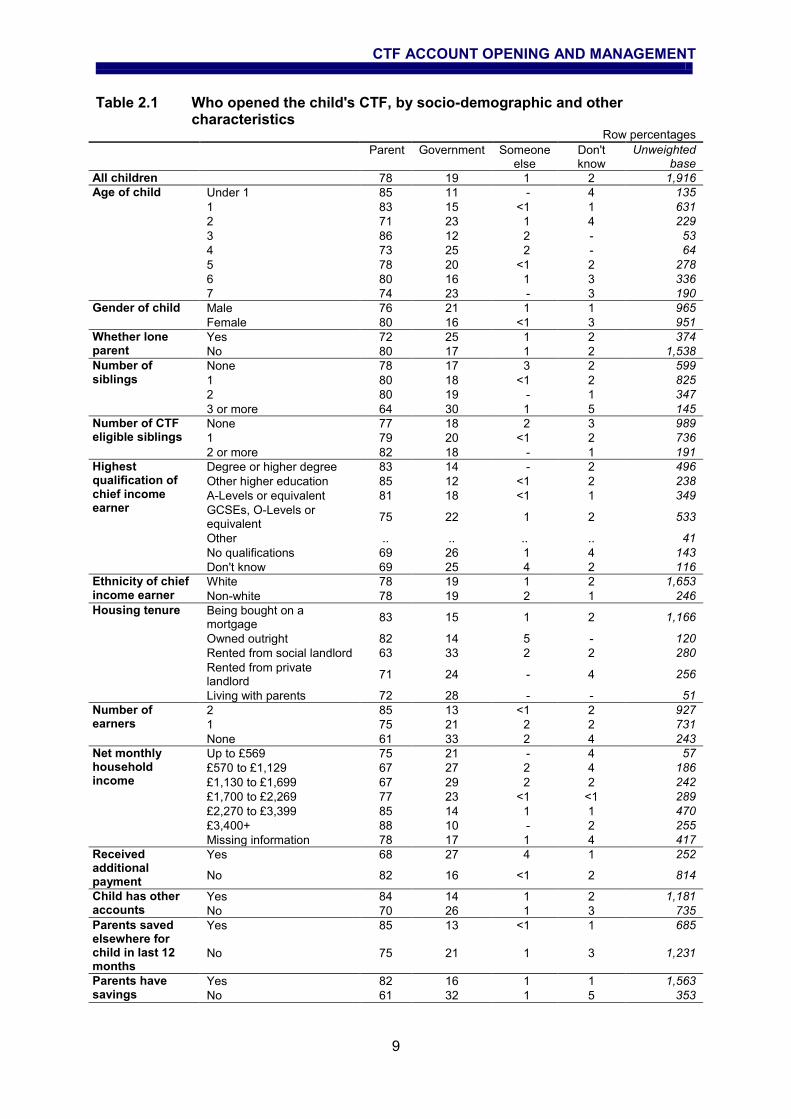
On the whole, whether parents opened the CTF account themselves or had an RAA was linked to both their economic circumstances and to their engagement with saving more generally, although the effects were not large (Table 2.1).
The types of parents who were most likely to have opened an account themselves were those with the highest incomes (88 per cent of those with a net monthly income of more than £3,400), who lived in two earner families (85 per cent) and were home owners, including those buying a home on a mortgage (83 per cent) as well as those owning a home outright (82 per cent). They were also parents who had savings of their own (82 per cent), held very positive attitudes to saving for children (for example 84 per cent of those who disagreed strongly that saving for children was a low priority at the moment) and had opened other saving accounts or investments for their CTF-eligible child (84 per cent).
Conversely, those most likely to say that they had an RAA included lone parents (25 per cent of lone parents), unwaged families (33 per cent), parents with low and low-to-middle incomes (27 per cent of those with a net monthly income of £570 to £1,129 and 29 per cent of those in the next income bracket), social tenants (33 per cent) and those living with their own parents (29 per cent) and people who had three or more children (30 per cent). They were parents who had no savings of their own (32 per cent), who held the most negative attitudes to saving for children (e.g. 28 per cent who agreed strongly that saving for children was currently a low priority) and whose CTF-eligible child had no other savings or investments (26 per cent). These same groups were also the ones most likely not to know who had opened the account, which is consistent with the fact that (where available) the management information shows that many of them in fact had an RAA.
4 Statistics on opening rates can be found at http://www.hmrc.gov.uk/stats/child_trust_funds/child-
trust-funds.htm
CTF ACCOUNT OPENING AND MANAGEMENT
9
Table 2.1 Who opened the child's CTF, by socio-demographic and other characteristics
Row percentages
Parent Government Someone else
Don't know
Unweighted base
All children 78 19 1 2 1,916
Age of child Under 1 85 11 - 4 135
1 83 15 <1 1 631
2 71 23 1 4 229
3 86 12 2 - 53
4 73 25 2 - 64
5 78 20 <1 2 278
6 80 16 1 3 336
7 74 23 - 3 190
Gender of child Male 76 21 1 1 965
Female 80 16 <1 3 951
Whether lone parent
Yes 72 25 1 2 374
No 80 17 1 2 1,538
Number of siblings
None 78 17 3 2 599
1 80 18 <1 2 825
2 80 19 - 1 347
3 or more 64 30 1 5 145
Number of CTF eligible siblings
None 77 18 2 3 989
1 79 20 <1 2 736
2 or more 82 18 - 1 191
Highest qualification of chief income earner
Degree or higher degree 83 14 - 2 496
Other higher education 85 12 <1 2 238
A-Levels or equivalent 81 18 <1 1 349
GCSEs, O-Levels or equivalent
75 22 1 2 533
Other .. .. .. .. 41
No qualifications 69 26 1 4 143
Don't know 69 25 4 2 116
Ethnicity of chief income earner
White 78 19 1 2 1,653
Non-white 78 19 2 1 246
Housing tenure Being bought on a mortgage
83 15 1 2 1,166
Owned outright 82 14 5 - 120
Rented from social landlord 63 33 2 2 280
Rented from private landlord
71 24 - 4 256
Living with parents 72 28 - - 51
Number of earners
2 85 13 <1 2 927
1 75 21 2 2 731
None 61 33 2 4 243
Net monthly household income
Up to £569 75 21 - 4 57
£570 to £1,129 67 27 2 4 186
£1,130 to £1,699 67 29 2 2 242
£1,700 to £2,269 77 23 <1 <1 289
£2,270 to £3,399 85 14 1 1 470
£3,400+ 88 10 - 2 255
Missing information 78 17 1 4 417
Received additional payment
Yes 68 27 4 1 252
No 82 16 <1 2 814
Child has other accounts
Yes 84 14 1 2 1,181
No 70 26 1 3 735
Parents saved elsewhere for child in last 12 months
Yes 85 13 <1 1 685
No 75 21 1 3 1,231
Parents have savings
Yes 82 16 1 1 1,563
No 61 32 1 5 353

CHILD TRUST FUND WAVE 2 EVALUATION
10
Table 2.1 continued
Parent Government Someone else
Don't know
Unweighted base
Borrowing a burden
Heavy burden 77 19 2 2 249
Somewhat of a burden 74 23 2 1 410
Not a problem 83 15 1 1 585
Nothing owed 78 19 <1 3 626
I think it's more important to buy my child(ren) the things they want than to save for them'
Strongly agree 75 22 2 1 248
Tend to agree 75 21 2 3 271
Neither agree nor disagree 77 21 - 2 164
Tend to disagree 80 18 <1 2 593
Strongly disagree 80 17 1 2 640
Saving for my child(ren) is a low priority for me at the moment'
Strongly agree 67 27 2 3 382
Tend to agree 79 20 - 1 495
Neither agree nor disagree 68 18 11 3 58
Tend to disagree 82 16 1 1 451
Strongly disagree 84 12 <1 3 530
I don't know enough about savings and investment products to choose ones that are suitable for my circumstances'
Strongly agree 67 28 2 3 472
Tend to agree 81 18 - 1 452
Neither agree nor disagree .. .. .. .. 28
Tend to disagree 85 13 <1 1 484
Strongly disagree 82 15 <1 2 449
General understanding of CTF rules
Good 80 19 <1 1 811
Moderate 77 19 1 2 808
Poor 77 16 3 4 297
Respondent (or partner) has a current account
Yes 79 18 1 2 1,813
No 58 34 - 8 80
Base is all children with an open CTF account '-' indicates there were no cases in the sample; '<1' indicates a value of less than one per cent but greater than zero '..' Figures based on fewer than 50 cases have been suppressed. Treat any figure based on a sample size of fewer than 100 with caution
There was no clear pattern by parents‟ ethnicity although there was a link with educational qualifications. So while 26 per cent of parents with no qualifications had an RAA, this fell to 14 per cent among those educated to degree level or above. There was also no consistent variation by the age of the child.5
The relationship with measures of financial capability and financial inclusion was also investigated. This found a strong relationship between the likelihood of a parent‟s child having an RAA and the extent to which the parent agreed with the statement “I don‟t know enough about savings and investment products to choose ones that are suitable for my circumstances”. So, children whose parents agreed strongly with this statement were almost twice as likely to have an RAA as those whose parents strongly disagreed (28 per cent compared with 15 per cent). The qualitative findings indicated that range of choice within the CTF was a particular barrier (page 12). There was, however, remarkably little difference between children whose parents‟ knowledge of the CTF was good (19 per cent) and those where it was poor (16 per cent). Having a current account is often used as an indicator of financial inclusion. Here we find a strong relationship with a child having an RAA, with those whose parents did not have a current account being around twice as likely to have an RAA as those whose parents did have one (34 per cent compared with 18 per cent).
5 While rates of parental opening of the CTF account are marginally higher than the average among
the under twos, this is not reflected in the management information (which has shown relatively consistent levels of parental opening since the CTF‟s inception). The difference is likely to reflect a combination of sampling error and the recall issue described on page 8.

CTF ACCOUNT OPENING AND MANAGEMENT
11
On the whole, parents who had an RAA for the child covered by the survey also had RAA accounts for other CTF-eligible children in their family. Indeed, less than a quarter (23 per cent) of parents with other CTF-eligible said that the surveyed child was the only one with an RAA.
2.1.2 Predictors of having a Revenue Allocated Account
Because many of these factors will be correlated with one another, a regression analysis was undertaken to ascertain which had the greatest independent effect on an account being opening by the Government, when all other factors were taken into account.6
This showed that only a small number of the factors described above had an independent effect on whether or not a child had an RAA. If the child did not have another savings account or investment, they were much more likely (with odds of 1.9) to have an RAA than if they did have other savings or investments, all other things being equal.7 And where parents agreed strongly with the statement “I don‟t know enough about savings and investment products to choose ones that are suitable for my circumstances” the odds that a child had an RAA were 1.9 times higher than where parents disagreed strongly with the statement. Over and above these factors, whether or not parents had savings of their own was statistically significant, the odds of the child having an RAA being 1.6 times higher where parents did not have savings.
Finally, household income just reached statistical significance in the model. Children living in households in the middle two income brackets (£1,139 to £1,699 and £1,700 to £2,269 per month) had significantly higher odds of having an RAA account (with odds ratios of 1.5 and 2.2 respectively) than those in the higher income bracket (£3,400 or more per month).8
Even so, the model was not a good predictor of children having an RAA,9 suggesting that factors that could not be included in it may have been playing an important role. Section 2.1.3 explores this further.
2.1.3 Reasons why some parents did not open an account
Parents whose child had an RAA were asked directly why they had decided not to open the account themselves. One reply predominated in their replies: that they simply had not got round to it or needed more time (43 per cent of those who had an RAA, equivalent to eight per cent of all parents whose child had a CTF). The next most common replies included:
Did not know how to open the account (three per cent of all whose child had a CTF)
Was content to let the Government open one on their behalf (two per cent)
Could not decide which account to open (two per cent).
Only two out of the 1,917 parents interviewed whose child already had a CTF account said it was because they did not agree with or had no interest in the CTF.
6 The method of regression analysis used here and throughout this report is a single entry logistic
regression model. Cases where parents said they did not know who had opened the account have been excluded from this analysis. 7 Note that „odds‟ and „likelihood‟ are similar but not identical concepts. While an odds ratio of greater
than 1.0 signifies increased likelihood (and an odds ratio of less than 1.0 indicates a decreased likelihood) odds and likelihoods are not on equivalent scales so cannot be described in the same way. 8 Measures that were not statistically significant in the regression model were: number of siblings,
whether a two- or lone-parent household, highest qualification achieved by the chief income earner, whether the household was waged or unwaged, housing tenure, parental attitudes towards saving for their children, parental knowledge of the CTF and parental current account holding. 9 As indicated by a pseudo R squared of 0.15.
CHILD TRUST FUND WAVE 2 EVALUATION
12
On the whole better-off parents and those who were saving-engaged were more inclined to be content to let the Government open an account for their child; while those who were less well off or disengaged from saving were more inclined to cite lack of time or lack of knowledge.
The depth interviews shed some more light on the reasons why parents had not opened the CTF account themselves. They showed that in many instances parents had started to look into the process of opening an account, but had hit a barrier that they lacked either the ability or the inclination to overcome. For some, the barrier was the inability to choose between providers or account types that prevented them from opening the account themselves. Many of those who did not open the account themselves could not find anything to differentiate between the providers, or could not decide which of the account types was best for their child, and therefore did not feel confident in making a choice. The issue was generally too much information rather than too little. The perceived complexity of the decision caused some not to make the decision at all.
I did contact a number of companies about setting up the trust fund, but they seemed to make it so complicated that in the end I just ran out of time.
One participant described this as “paralysis by analysis”.
In contrast, parents who found choosing a provider and account easiest to make were those who did not „over- think‟ the decision and could focus on one factor to help choose which CTF to open. The most common of these was having a previous relationship with the provider; another example was wanting to invest in ethical funds.
Others had an idea about what they wanted, but couldn‟t identify a provider that accommodated this, such as being able to open an account or to pay money into it in person at a branch.
It would have been just been easier to do it when I was in there (own bank’s branch) doing something else.
Having hit a barrier, parents either procrastinated and ran out of time, or consciously chose to let the government open one. Awareness that the Government would open an account for their child if they failed to do so themselves acted as a „backstop‟ and reassured parents who found it difficult to make the decision themselves.
If they had been ‘if you don’t do anything you don’t get it,’ I think I would have done it...Having the security of ‘it will be sorted for you’ was like ‘that’s one thing I don’t have to do...the Child Trust Fund is a lovely thing, but I was more interested in our own savings really
Other factors were not sufficient on their own to prevent parents from opening an account but were compounding factors. These included, parents having decided that they would not be contributing to the account; the pressures of having a young baby; and, linked to this, the timing of receipt of the CTF voucher.
2.2 Experience of opening the account and making choices
Parents were asked two questions in relation to account opening in the survey. First, all parents with a child aged under four were asked how easy or difficult it had been to understand how to use the CTF vouchers they had received. Nine in ten (86 per cent) of them said it had been easy; while only one in ten (12 per cent) said it had been difficult. A greater proportion of parents whose child had an RAA said it had been difficult (21 per cent, compared with seven per cent of those who had opened the account themselves).

CTF ACCOUNT OPENING AND MANAGEMENT
13
Secondly, all parents with a child aged under four who had opened the CTF account themselves were asked how easy they had found it. Just about everybody (98 per cent) said it had been easy, with seven in ten (69 per cent) saying it was very easy.
The depth interviews show that the reasons why some parents took longer to open an account than others were almost identical to those that deterred others from opening one at all. The main difference between them related to the RAA process. Those who delayed but did ultimately open an account either wanted to retain the responsibility for choosing the account or, less commonly, were unaware that the government would open an account by default after 12 months.
2.2.1 Choosing a provider
The depth interviews with parents who had opened the CTF account themselves showed that many chose the provider they would open the account with before they chose the type of account they would open. As also noted below, this was often because having a prior relationship with a provider had been the deciding factor overall.
The survey found that most (79 per cent) parents who had opened their child‟s CTF account themselves had found it easy to choose a provider. 10 In fact, the largest group (45 per cent) had chosen to open an account with a provider they already had a relationship with and a further seven per cent said it was the only provider they were aware of. Other important reasons for choosing the provider they did included the fact that they had an account that offered a good rate of return (17 per cent), that they were convenient or easy to access (13 per cent) and that the money saved or invested them would be relatively safe (seven per cent).
Meanwhile two in ten parents (20 per cent) said that choosing a provider had been quite or very difficult. The four main reasons for finding it difficult were that:
There were too many providers to choose from (nine per cent of all parents who had opened an account)
There was not much difference between them (seven per cent)
It was difficult to know which one to trust (four per cent)
Lack of information (four per cent).
The ease of choosing a provider was primarily associated with prior experience of opening an account for savings or investments. So, the parents in the survey who found it most difficult to choose a provider were those with no other CTF-eligible children (26 per cent), whose child had no other savings or investment accounts (24 per cent) or who had no savings accounts of their own (22 per cent).
There was a strong link between the ease with which parents had chosen a provider and the way in which they had chosen them. More than half (55 per cent) of those saying it had been very easy to choose had opted for a provider that they had a prior relationship with, falling to just three in ten (29 per cent) of those who said it had been very difficult.
I did look around... but as we’ve banked with them (provider) for a long time, it was just straightforward and simple for us to do.
10
Only parents with a child aged under four were asked the detailed questions about account choice and opening. Testing showed that parents with children any older than this would have struggled to remember the detail.

CHILD TRUST FUND WAVE 2 EVALUATION
14
There was no link between ease of choosing a provider and the choice having been based on the rate of return of the accounts they opened. The types of parents who had most frequently selected a provider based on the rate of return they could get with them included those with the highest net household incomes of more than £3,400 a month (26 per cent), educated to degree level or above (29 per cent) and buying a home on a mortgage (21 per cent).
2.2.2 Choosing the type of CTF account
Similarly, most (80 per cent) of parents who had opened an account themselves and could remember what type of account they had opened (and 27 per cent could not remember) said that it had been an easy choice. Again, though, two in ten (19 per cent) said it had been a difficult choice and the reasons were similar to those reported in relation to finding the choice of provider difficult. So, the most common reasons for finding choosing the type of account difficult were that:
They found it difficult to decide which would be best (seven per cent of all parents who had opened an account)
They did not understand the difference between the accounts (five per cent)
They did not have enough information to help them make a choice (five per cent).
The groups of parents who found the choice of account most difficult were those with only one child (27 per cent), who lived in a two-earner household (23 per cent), were buying their home on a mortgage (24 per cent), had the highest net incomes (25 per cent) of those receiving £3,400 or more a month), had a savings account themselves (21 per cent) and had opened another account for their child (20 per cent).
The main reasons for having chosen the type of account they did were that:
It seemed to offer the lowest risk to the money deposited (28 per cent)
It offered a good rate of return (21 per cent)
It was the only type of account offered by the provider they had chosen (17 per cent).
A further eight per cent said it was the type of account that their chosen provider had advised them to open.
Not surprisingly, cash accounts were the ones most often opened because they were considered low risk (42 per cent); shares accounts because they were expected to offer the highest rate of return (42 per cent), while people were attracted to stakeholder accounts either because of the rate of return they hoped to get (30 per cent) or because they were the only type offered by their chosen provider (22 per cent).
There were no notable or systematic differences in the reasons why parents in different circumstances had chosen the account they did. However, parents who had opened a shares account had found it most difficult to make the choice (25 per cent). Those who found it easiest had opted for the only account offered by their chosen provider, although there was no obvious difference in the ease of choice among people who had selected their child‟s account on other criteria.
2.2.3 Parents’ awareness of the type of account they had opened
Parents who participated in the survey were asked what type of CTF account they had opened (a cash account, a stakeholder account or a shares account). At the same time, for the majority of parents we also have management information on the type of account that

CTF ACCOUNT OPENING AND MANAGEMENT
15
they were recorded as having.11 Comparing these two sources of data it is clear that many parents were mistaken about the type of account they held.
The first thing to note is that more than a quarter (27 per cent) of all parents said that they did not know what type of account they had. In fact, only a half of parents (49 per cent) knew accurately which type of account they had; the remaining quarter (24 per cent) thought they knew but the management information showed they were wrong.
The proportion of parents who said that they did not know what type of account type had was especially high for those whose child had an RAA (45 per cent) and lowest for those with a cash account (although even here it was 20 per cent).
The proportion that knew accurately the type of account their child had was somewhat lower for those with an RAA (37 per cent) than it was among parents who said that they had opened the account themselves (51 per cent). It was highest among parents who had personally opened a cash account (65 per cent) and lowest for those who had opened a share account (26 per cent), who often thought that they had either a stakeholder (38 per cent) or a cash one (11 per cent). There was less confusion among parents who had opened a stakeholder account themselves but even here 18 per cent thought they had opened a cash account and seven per cent a non-stakeholder shares account.
Parents were also asked two questions to assess their knowledge of the different types of CTF account. This showed that 42 per cent believed (correctly) that the statement “the only account without any charges is a cash-based deposit account” was true; 45 per cent thought it was false and 13 per cent said that they did not know one way or the other. Knowledge of stake-holder CTF accounts was somewhat better, with 88 per cent believing (correctly) that the “the value of a stakeholder account can go down as well as up”; nine per cent though that the statement was false and only three per cent said that they did not know.
Putting the replies to these two questions together, only 36 per cent of parents answered both questions correctly.
2.2.4 Sources of information used in making choices
All parents were sent an information pack about the CTF by HM Revenue & Customs. Six in ten parents (58 per cent) who had opened an account themselves said that they had actively obtained information or advice over and above this to help them decide which CTF account to open. There was no notable or systematic difference in the propensity of parents in different circumstances to have sought additional information or advice. Nor was there a clear link between having sought further information and the ease with which parents were able to make their choice. But it must be stressed that this was only among those who had opened the account themselves. As can be seen below, the situation was somewhat different among those who had not opened an account personally.
All those who said that they had got any information or advice were asked to say which had been the main source or sources they had used in deciding which account to open. The one cited most commonly, by far, was the information pack sent by HM Revenue & Customs which was cited by a quarter (25 per cent) of all parents who had opened an account themselves (43 per cent of those who said that they had sought extra information). This was followed in frequency of mention by information obtained from providers (16 per cent) or from a website other than the HM Revenue & Customs one (14 per cent) and family and friends (6 per cent). Only two per cent of parents said that their main source of information and advice had been a financial adviser.
11
The management information is relatively complete for children aged over two, but incomplete for younger children. We have, therefore, restricted this analysis to children for whom we have both management information and information collected in the survey.

CHILD TRUST FUND WAVE 2 EVALUATION
16
On the whole, there were only slight variations in the main sources used by parents in different circumstances. The most notable difference was in the use of websites to gather information. This was strongly associated with household financial circumstances rising from two per cent of parents in households with a net monthly income below £1,130 to 19 per cent of parents in households with a monthly income of £3,400 or more. There was also a strong link with whether the parents themselves had a savings account or any investments, 16 per cent of whom had consulted a website, compared with four per cent of parents with no such accounts.
In the depth interviews, parents referred to the dearth of product comparison information on CTF accounts, which made it difficult to compare providers or products.
If it was a lot more clearer with comparisons of what is available then we’d be able to shop around, same as people do for mortgages and insurance.
In the absence of such comparison information parents had to gather it themselves, from individual providers individually, which few had the time or inclination to do.
2.2.5 Satisfaction with the HM Revenue & Customs information pack
All parents, regardless of whether or not they had opened the CTF account themselves, were asked whether they had been satisfied with the information about the CTF that they had received from HM Revenue & Customs. Levels of satisfaction were high, with almost nine in ten (86 per cent) of parents saying that they were satisfied, including a third (34 per cent) who said they were very satisfied. Only one in ten (nine percent) expressed any degree of dissatisfaction and most of these (seven per cent) were only fairly dissatisfied:
It’s very straightforward what they send out, it’s not like they try to bamboozle people. I think they’ve got it covered in that sense.
It should, however, be noted that levels of satisfaction were higher among parents who had opened an account themselves (89 per cent satisfied and only seven per cent dissatisfied) than they were among those with an RAA (78 per cent of whom were satisfied, with 17 per cent expressing dissatisfaction). Otherwise there were no notable differences in levels of satisfaction between parents in different circumstances.
The small number of parents who expressed any dissatisfaction in the depth interviews felt that either the language used could have been be simpler, or wanted more details about the performance of accounts from different providers.
Only a minority (13 per cent) of all parents said that they had contacted HM Revenue & Customs for further information or guidance regarding the CTF. Most commonly they had visited the CTF website (11 per cent), followed in frequency by a telephone call to the CTF helpline (two per cent). The two most common types of enquiry, by far, were to find out more about the different types of accounts (four per cent) and for more detail about the CTF generally (three per cent). Once again there was a high level of satisfaction (84 per cent).
2.3 Account management
The survey asked about three key aspects of account management: satisfaction with the service provided by the CTF provider; whether or not parents had switched the accounts since it was opened; and how well parents read the CTF account statements when they received them.
CTF ACCOUNT OPENING AND MANAGEMENT
17
2.3.1 Satisfaction with the service of the CTF provider
Most (84 per cent) of parents were satisfied with the service offered by their CTF account provider, only one in ten (9 per cent) were not and the rest were ambivalent. The main source of dissatisfaction was a failure by the provider to provide sufficient information about the account. Even so this view was expressed by just six per cent of parents whose child had a CTF account. Other sources of dissatisfaction were cited much less often. These were a decrease in the amount in the account due to stock market fluctuations (two per cent) and aspects of customer service (two per cent), including difficulties paying money into the account, being unable to make transactions in person and unhelpful staff.
Levels of dissatisfaction tended to be higher among parents with an RAA (14 per cent) than they were among parents who had opened their child‟s CTF account themselves (eight per cent). There was also an association with the pattern of parental contributions into the CTF account, with levels of dissatisfaction being higher for parents who had made only ad hoc payments (12 per cent) or none at all (ten per cent) than they were for parents who paid money in regularly (five per cent). Levels of parental dissatisfaction with their CTF provider fell the more money there was in a child‟s CTF account (from 12 per cent of those whose child had only £250 in the account to just three per cent of those with more than £1,000 in the account). There are two possible explanations for these findings. First, some parents may not contribute to the account regularly (or even at all) because they are dissatisfied with the provider. On the other hand, their dissatisfaction might indicate a degree of disengagement from the account that is further evidenced by their failure to pay money into it. Indeed, the depth interviews showed that dissatisfaction with a provider did cause a minority of parents to become disengaged from the CTF. For example, one mother had opened CTFs for her first three children herself, but as a result of dissatisfaction with the provider of these accounts, did not open the one for her fourth child.
Levels of dissatisfaction did not vary between parents in different personal or economic circumstances.
2.3.2 Account switching
Hardly any parents (two per cent) reported that they had ever switched either CTF account provider or type of account and most of these had switched provider. Moreover, most of them said that it had been the provider and not they, themselves, who had switched it – presumably as a result of mergers of CTF providers and the sale of the book of one CTF provider. No groups stood out as having a higher than average level of switching; indeed it did not even increase with the age of the child.
This low level of switching does, however, need to be set in context. Fewer than half (45 per cent) of parents were aware that they had the option of switching, with the proportion being slightly higher among parents who had opened their child‟s CTF account themselves (47 per cent) than it was among parents whose child had an RAA (35 per cent). With higher levels of awareness, it is possible that some of those who were dissatisfied with their provider might have switched.
2.3.3 Reading CTF account statements
Parents were also asked what they did with CTF account statements when they received them. Only a third of parents (34 per cent) said that they read them carefully; the most common response was that they were looked at briefly (54 per cent). Only a small number of parents (five percent) said that they did not read them at all or did not know what they did with them. And a further seven per cent said that they did not receive statements, but as these spanned parents children of all ages, it is likely that in most cases statements had been received but had not been looked at.
CHILD TRUST FUND WAVE 2 EVALUATION
18
These findings are broadly consistent with behaviour in relation to account statements more generally (see for example the Financial Services Authority baseline survey of financial capability).12 Moreover, the depth interviews with parents about the CTF showed that people who claimed to have looked at statements briefly had often done nothing more than look at the overall balance on an account – and frequently not even that. This is borne out by the fact that almost three in ten parents (28 per cent) did not know how much money was in their child‟s CTF account.
There were few notable differences in the propensity of parents in different circumstances to say they read their accounts carefully. It declined slightly with income from four in ten (41 per cent) of parents with a net monthly household income of between £570 and £1,129 to three in ten (31 per cent) of those with incomes that were greater than £3,400 a month. It was slightly higher for parents who had opened the account themselves than it was for parents whose child had an RAA (36 per cent compared with 29 per cent). It was highest for parents who had made ad hoc payments into the CTF account since it was opened (48 per cent), but there was only a small difference between those paying money in regularly (36 per cent) and those who had paid nothing in at all (32 per cent). As might be expected, there was also a link with the amount saved in the CTF account. So, 45 per cent of parents whose child had more than £1,000 in their account said that they read the statements carefully, compared with 32 per cent of those whose child had only the initial government payment in it. And parents with the most positive attitudes to saving for children were more likely to say they read their CTF statements carefully than those holding the most negative attitudes (39 per cent compared with 30 per cent).
On the whole, though, it seemed that the main explanation for parents‟ approach to their CTF statement lay in their general approach to reading account statements carefully.
12
A. Atkinson, S. McKay and E. Kempson (2006) Levels of financial capability in the UK. London: Financial Services Authority.

SAVING INTO CHILD TRUST FUND ACCOUNTS
19
3 Saving into Child Trust Fund accounts
Having looked at the experience of Child Trust Fund (CTF) account opening, this chapter reports the levels of contribution made to CTFs and overall amounts held in them. Patterns of saving into the account by parents and the drivers of these patterns are examined in particular detail and comparisons are made to the intentions of parents expressed in the baseline study in 2005. The role played by the rules of the CTF and other factors in encouraging or discouraging saving into the accounts is explored.
Summary
Only just over a third of accounts (37 per cent) had had any contributions made into
them apart from the Governmental contribution(s)
Accounts opened by the government (RAA accounts) were the least likely to have
had any contributions paid into their account (nine per cent)
One quarter (26 per cent) had had contributions in the last 12 months, paying in a
total median amount of £170
Four out of five accounts that had received any contributions had received them in
the last 12 months, and these were very often regular contributions (i.e. monthly)
Very few people other than parents had contributed to any CTF accounts. Others
who had contributed tended not to have done in the last 12 months
The main reasons parents gave for not contributing to the CTF were affordability,
dislike of certain aspects of the CTF (for some people), or a preference for paying
into an account chosen by parents themselves. Broadly speaking, however, the rules
in themselves were not a huge barrier to most
The median amount held in CTF accounts overall was approximately £300, little
more than the value of the voucher without the Government‟s Additional Payment
Award. However, over one in ten had more than £1,000 in their accounts.
3.1 Overview of payments into accounts
Among the CTF-eligible children whose accounts had been opened, fewer than four in ten (37 per cent) had ever had any contributions made into it by anyone other than the Government. This includes 30 per cent that had had money paid in by a parent and 14 per cent that had had money contributed by someone else.
This is far lower than the 77 per cent of CTF-eligible parents in the baseline survey in 2005 who anticipated that some money would be added to their child‟s account. It is also lower than the 48 per cent of parents who were able to say in the 2005 survey how much they thought might be added in the next 12 months.
Meanwhile, about a quarter of children with a CTF account (26 per cent) had had contributions made into it by someone other than Government in the previous 12 months.
CHILD TRUST FUND WAVE 2 EVALUATION
20
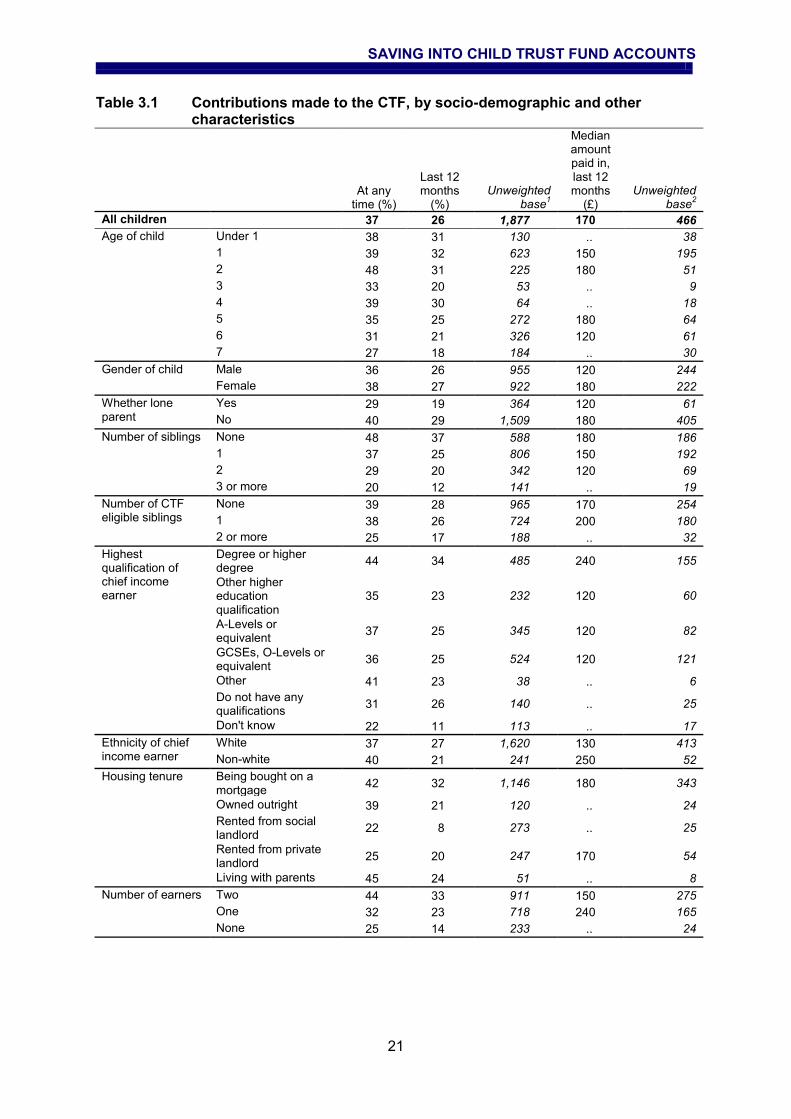
3.1.1 Characteristics of those where any payments have been made
There were wide variations in the likelihood that a child‟s CTF account had had any money paid into it, other than Government contributions (Table 3.1). The socio-economic characteristics of the child‟s household were particularly strongly related, but there were also marked variations depending on the number of other children in the household and parent‟s attitudes towards saving for children, as we go on to describe. The most striking difference in the propensity for the CTF account to have received contributions, however, related to who opened the CTF account: 44 per cent of accounts opened by someone other than the Government (in most cases the parent or their partner) had received some level of contribution compared with just nine per cent of Revenue Allocated Accounts (RAAs).13
The propensity to have had any money paid into their CTF peaked among CTF-eligible children who were two years old (48 per cent), falling away steadily to just over a quarter of children aged seven (27 per cent). This decline may partly reflect a recall effect, particularly if payments had been made only on account opening or when the child was very young. Curiously, however, three-year old children were also relatively unlikely to have had contributions made to their accounts (33 per cent). This may be related to the economic climate around the time parents of many of these children would have received the Government vouchers which coincided with the start of the recession in 2007.
Although female children appear to have been more likely than males to have had contributions made to their CTF accounts at some point, this finding is not statistically significant.
There was a clear relationship between whether or not any contributions had been made into the CTF account and how many other children there were in the household. Children living in households with two or more other CTF-eligible children were far less likely (25 per cent) than those with one or no other CTF-eligible children (39 and 38 per cent respectively) to have had contributions made to their accounts. The relationship with the number of other children (regardless of CTF eligibility) is even more striking, ranging from 20 per cent of children with 3 or more siblings and 49 per cent of children with none.
Socio-economic indicators were particularly strongly related to contributions having been made. Children living in households with two earners (44 per cent), the highest net monthly income (£3,400 or more; 48 per cent) or in a home that was owned either outright (39 per cent) or on a mortgage (42 per cent) were all at the high end of the range. Meanwhile, children living in households with no wage earners (25 per cent), those in the second-lowest income band (£570 to £1,129; 23 per cent) and where the home was rented from a social landlord (22 per cent) were at the lower end of the range.
Similarly, CTF accounts that had received an additional payment from the Government were less likely to have received any other contributions (23 per cent) than those who did not qualify for the additional payment (42 per cent), reflecting the economic conditions of the household in the child‟s first year.
There was no marked relationship between contributions having been made and the type of account that had been opened.
Finally, it is notable that the likelihood for contributions to have been made into the child‟s account did not vary significantly depending on whether the child had other savings or investments, although there were some variations depending on the amount saved in these ways.
13
This uses information reported to the survey by the respondent, rather than the administrative data.
SAVING INTO CHILD TRUST FUND ACCOUNTS
21
Table 3.1 Contributions made to the CTF, by socio-demographic and other characteristics
At any time (%)
Last 12 months
(%) Unweighted
base1
Median amount paid in, last 12 months
(£) Unweighted
base2
All children 37 26 1,877 170 466
Age of child Under 1 38 31 130 .. 38
1 39 32 623 150 195
2 48 31 225 180 51
3 33 20 53 .. 9
4 39 30 64 .. 18
5 35 25 272 180 64
6 31 21 326 120 61
7 27 18 184 .. 30
Gender of child Male 36 26 955 120 244
Female 38 27 922 180 222
Whether lone parent
Yes 29 19 364 120 61
No 40 29 1,509 180 405
Number of siblings None 48 37 588 180 186
1 37 25 806 150 192
2 29 20 342 120 69
3 or more 20 12 141 .. 19
Number of CTF eligible siblings
None 39 28 965 170 254
1 38 26 724 200 180
2 or more 25 17 188 .. 32
Highest qualification of chief income earner
Degree or higher degree
44 34 485 240 155
Other higher education qualification
35 23 232 120 60
A-Levels or equivalent
37 25 345 120 82
GCSEs, O-Levels or equivalent
36 25 524 120 121
Other 41 23 38 .. 6
Do not have any qualifications
31 26 140 .. 25
Don't know 22 11 113 .. 17
Ethnicity of chief income earner
White 37 27 1,620 130 413
Non-white 40 21 241 250 52
Housing tenure Being bought on a mortgage
42 32 1,146 180 343
Owned outright 39 21 120 .. 24
Rented from social landlord
22 8 273 .. 25
Rented from private landlord
25 20 247 170 54
Living with parents 45 24 51 .. 8
Number of earners Two 44 33 911 150 275
One 32 23 718 240 165
None 25 14 233 .. 24

CHILD TRUST FUND WAVE 2 EVALUATION
22
Table 3.1 continued
At any time (%)
Last 12 months
(%) Unweighted
base1
Median amount paid in, last 12 months
(£) Unweighted
base2
Net monthly household income
Up to £569 38 32 54 .. 8
£570 to £1,129 23 11 181 .. 22
£1,130 to £1,699 30 22 235 .. 43
£1,700 to £2,269 32 22 288 180 60
£2,270 to £3,399 45 29 465 120 139
£3,400+ 48 37 248 300 85
Missing information 34 28 406 150 109
Received additional payment
Yes 23 12 246 .. 27
No 42 30 796 180 204
Revenue allocated account
Non-RAA 44 31 1,519 180 443
RAA 9 5 358 .. 23
Type of CTF account
Cash 37 22 219 .. 42
Stakeholder 38 26 750 120 167
Shares 43 27 73 .. 22
Child has other account
Yes 38 27 1,160 150 300
No 36 26 717 200 166
Amount held in savings and investments (excludes insurance)
None 37 26 773 200 183
£1 to 250 37 22 272 120 76
£251 to £500 32 22 170 .. 45
£501 to £1,000 42 35 181 120 57
£1,001 to £2000 39 21 130 .. 26
More than £2,000 33 28 143 .. 40
Has account, value unknown
38 30 208 .. 39
1. Base is children with an open CTF account. 2. Base is children with any CTF contributions in last 12 months. '..' Figures based on fewer than 50 cases have been suppressed. Treat with caution any figure based on fewer than 100 cases.
3.1.2 Predictors of any contributions having been made
In order to control for the likely correlations between the various characteristics that related to any contributions having been made, regression analysis was undertaken that included a range of these characteristics. This showed that several measures were independently related to contributions having been made.
Whether or not the account was an RAA had the strongest independent association. The odds of any contributions having been made were some seven times higher for the children with non-RAAs compared with those with RAAs. Other highly statistically significant predictors were:
The number of siblings, the odds of contributions being 2.7 times higher among those with no siblings compared with those with three or more siblings
The child‟s age, for which the odds were some two to three times higher among the two-year olds compared with most other age groups
Household income, where those in the two highest income brackets had more than 2.9 and 2.7 times higher odds of having had any contributions than those in the second lowest income bracket

SAVING INTO CHILD TRUST FUND ACCOUNTS
23
The chief income earner‟s highest achieved qualification, for which the odds were 1.7 times higher among those with A-levels or equivalent and GCSEs or equivalent than those with higher education qualifications other than a degree or higher.
This final point is surprising given that, in crosstabular analysis (Table 3.1), children living in a household where the chief income earner‟s highest qualification was A-level or GCSE (or equivalent) had relatively low rates of any contributions into their CTF account. The results from the regression analysis suggest that this was a reflection of other characteristics that were themselves correlated with education level, such as household income, whether or not the child had an RAA account and the level of Government contribution. As further regression analysis shows, in contrast to these findings, higher qualifications were associated with higher odds of regular parental contributions (see section 3.2.3). Taken together, this suggests that different factors influenced whether or not CTF contributions had been made depending on the nature of the contribution considered; that is, whether it only includes parents or other potential contributors, and the pattern of those contributions (any contributions or regular ones). Of the remaining measures, the odds of any CTF contributions were 1.4 times higher for children with any other savings than those with none and 1.5 times higher for children who did not receive the Government‟s higher initial endowment than those who did.14
3.1.3 Characteristics of those where payments had been made in the last 12 months
As noted, 26 per cent of CTF accounts had had some payment (other than the Government contribution) made into them in the last 12 months. There was a very similar pattern of variation in relation to whether or not any contributions had been made in the last 12 months (Table 3.1). However, the likelihood was particularly low, lower perhaps than might be expected from the rates of any contributions, for children in households living in a home that was rented from a social landlord (eight per cent) and in the second lowest income bracket (£570 to £1,129 per month; 11 per cent) compared with the average (26 per cent).
3.1.4 Total amounts paid into the CTF in the last 12 months
Among children whose CTF accounts had received some contribution in the last 12 months, the average (median) amount saved into the account was £170.15 This was rather lower than the amount that parents of children eligible for the CTF in the baseline survey typically estimated would be paid in to their child‟s CTF accounts in the following 12 months (a median of £240).
Reflecting the median value, only seven per cent of CTF accounts had had more than £1,000 paid into them, including four per cent that had the maximum allowable amount paid into them (£1,200). Moreover, 13 per cent of accounts receiving any contributions had had less than £100 paid into them and 83 per cent less than £500.
14
Measures that were not statistically significant in the regression model were: the child‟s gender, whether a one or two-parent family, ethnicity, whether household was waged or unwaged and housing tenure. The pseudo R squared for the model was 0.25. In a separate and otherwise identical regression analysis that replaced the RAA measure with the type of CTF account, the type of account was not statistically significant. 15
Median values are used throughout this report instead of mean values when reporting averages to avoid the influence of extreme values. The same decision about the reporting of the median was also taken in reporting the baseline survey. Any variations to this approach are indicated in the text.
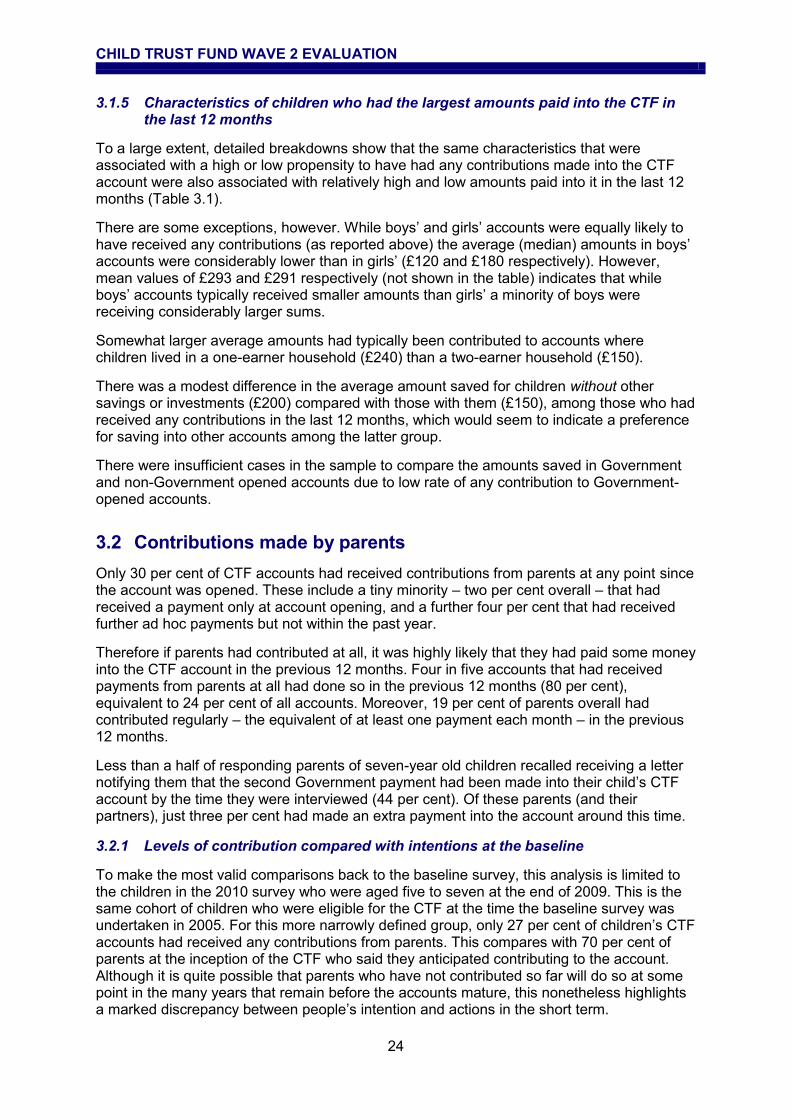
CHILD TRUST FUND WAVE 2 EVALUATION
24
3.1.5 Characteristics of children who had the largest amounts paid into the CTF in the last 12 months
To a large extent, detailed breakdowns show that the same characteristics that were associated with a high or low propensity to have had any contributions made into the CTF account were also associated with relatively high and low amounts paid into it in the last 12 months (Table 3.1).
There are some exceptions, however. While boys‟ and girls‟ accounts were equally likely to have received any contributions (as reported above) the average (median) amounts in boys‟ accounts were considerably lower than in girls‟ (£120 and £180 respectively). However, mean values of £293 and £291 respectively (not shown in the table) indicates that while boys‟ accounts typically received smaller amounts than girls‟ a minority of boys were receiving considerably larger sums.
Somewhat larger average amounts had typically been contributed to accounts where children lived in a one-earner household (£240) than a two-earner household (£150).
There was a modest difference in the average amount saved for children without other savings or investments (£200) compared with those with them (£150), among those who had received any contributions in the last 12 months, which would seem to indicate a preference for saving into other accounts among the latter group.
There were insufficient cases in the sample to compare the amounts saved in Government and non-Government opened accounts due to low rate of any contribution to Government-opened accounts.
3.2 Contributions made by parents
Only 30 per cent of CTF accounts had received contributions from parents at any point since the account was opened. These include a tiny minority – two per cent overall – that had received a payment only at account opening, and a further four per cent that had received further ad hoc payments but not within the past year.
Therefore if parents had contributed at all, it was highly likely that they had paid some money into the CTF account in the previous 12 months. Four in five accounts that had received payments from parents at all had done so in the previous 12 months (80 per cent), equivalent to 24 per cent of all accounts. Moreover, 19 per cent of parents overall had contributed regularly – the equivalent of at least one payment each month – in the previous 12 months.
Less than a half of responding parents of seven-year old children recalled receiving a letter notifying them that the second Government payment had been made into their child‟s CTF account by the time they were interviewed (44 per cent). Of these parents (and their partners), just three per cent had made an extra payment into the account around this time.
3.2.1 Levels of contribution compared with intentions at the baseline
To make the most valid comparisons back to the baseline survey, this analysis is limited to the children in the 2010 survey who were aged five to seven at the end of 2009. This is the same cohort of children who were eligible for the CTF at the time the baseline survey was undertaken in 2005. For this more narrowly defined group, only 27 per cent of children‟s CTF accounts had received any contributions from parents. This compares with 70 per cent of parents at the inception of the CTF who said they anticipated contributing to the account. Although it is quite possible that parents who have not contributed so far will do so at some point in the many years that remain before the accounts mature, this nonetheless highlights a marked discrepancy between people‟s intention and actions in the short term.
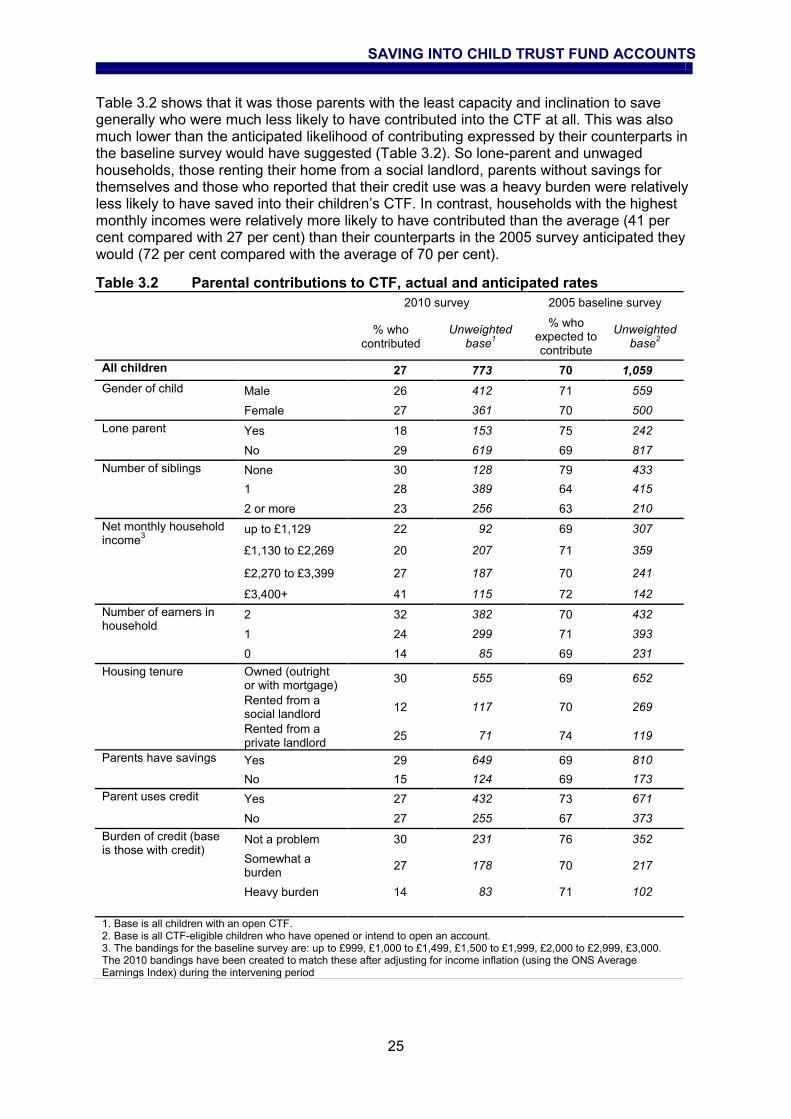
SAVING INTO CHILD TRUST FUND ACCOUNTS
25
Table 3.2 shows that it was those parents with the least capacity and inclination to save generally who were much less likely to have contributed into the CTF at all. This was also much lower than the anticipated likelihood of contributing expressed by their counterparts in the baseline survey would have suggested (Table 3.2). So lone-parent and unwaged households, those renting their home from a social landlord, parents without savings for themselves and those who reported that their credit use was a heavy burden were relatively less likely to have saved into their children‟s CTF. In contrast, households with the highest monthly incomes were relatively more likely to have contributed than the average (41 per cent compared with 27 per cent) than their counterparts in the 2005 survey anticipated they would (72 per cent compared with the average of 70 per cent).
Table 3.2 Parental contributions to CTF, actual and anticipated rates 2010 survey 2005 baseline survey
% who
contributed
Unweighted base
1
% who expected to contribute
Unweighted base
2
All children 27 773 70 1,059
Gender of child Male 26 412 71 559
Female 27 361 70 500
Lone parent Yes 18 153 75 242
No 29 619 69 817
Number of siblings None 30 128 79 433
1 28 389 64 415
2 or more 23 256 63 210
Net monthly household income
3
up to £1,129 22 92 69 307
£1,130 to £2,269 20 207 71 359
£2,270 to £3,399 27 187 70 241
£3,400+ 41 115 72 142
Number of earners in household
2 32 382 70 432
1 24 299 71 393
0 14 85 69 231
Housing tenure Owned (outright or with mortgage)
30 555 69 652
Rented from a social landlord
12 117 70 269
Rented from a private landlord
25 71 74 119
Parents have savings Yes 29 649 69 810
No 15 124 69 173
Parent uses credit Yes 27 432 73 671
No 27 255 67 373
Burden of credit (base is those with credit)
Not a problem 30 231 76 352
Somewhat a burden
27 178 70 217
Heavy burden 14 83 71 102
1. Base is all children with an open CTF. 2. Base is all CTF-eligible children who have opened or intend to open an account. 3. The bandings for the baseline survey are: up to £999, £1,000 to £1,499, £1,500 to £1,999, £2,000 to £2,999, £3,000. The 2010 bandings have been created to match these after adjusting for income inflation (using the ONS Average Earnings Index) during the intervening period
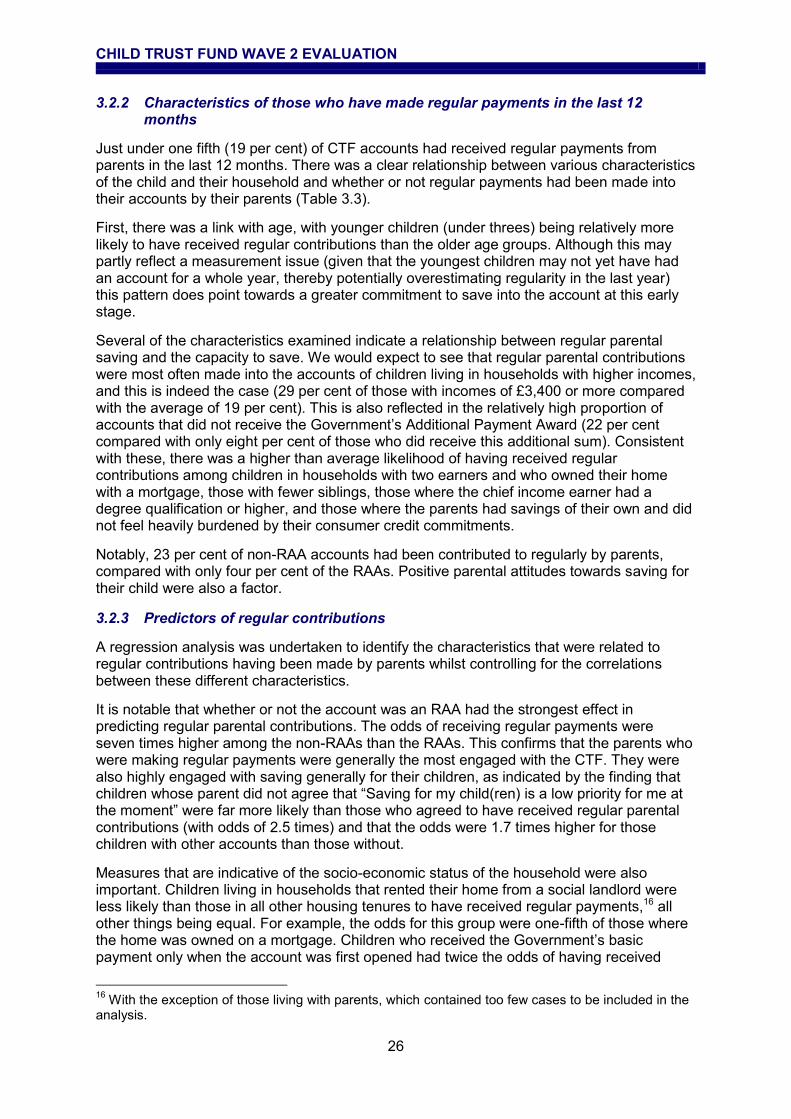
CHILD TRUST FUND WAVE 2 EVALUATION
26
3.2.2 Characteristics of those who have made regular payments in the last 12 months
Just under one fifth (19 per cent) of CTF accounts had received regular payments from parents in the last 12 months. There was a clear relationship between various characteristics of the child and their household and whether or not regular payments had been made into their accounts by their parents (Table 3.3).
First, there was a link with age, with younger children (under threes) being relatively more likely to have received regular contributions than the older age groups. Although this may partly reflect a measurement issue (given that the youngest children may not yet have had an account for a whole year, thereby potentially overestimating regularity in the last year) this pattern does point towards a greater commitment to save into the account at this early stage.
Several of the characteristics examined indicate a relationship between regular parental saving and the capacity to save. We would expect to see that regular parental contributions were most often made into the accounts of children living in households with higher incomes, and this is indeed the case (29 per cent of those with incomes of £3,400 or more compared with the average of 19 per cent). This is also reflected in the relatively high proportion of accounts that did not receive the Government‟s Additional Payment Award (22 per cent compared with only eight per cent of those who did receive this additional sum). Consistent with these, there was a higher than average likelihood of having received regular contributions among children in households with two earners and who owned their home with a mortgage, those with fewer siblings, those where the chief income earner had a degree qualification or higher, and those where the parents had savings of their own and did not feel heavily burdened by their consumer credit commitments.
Notably, 23 per cent of non-RAA accounts had been contributed to regularly by parents, compared with only four per cent of the RAAs. Positive parental attitudes towards saving for their child were also a factor.
3.2.3 Predictors of regular contributions
A regression analysis was undertaken to identify the characteristics that were related to regular contributions having been made by parents whilst controlling for the correlations between these different characteristics.
It is notable that whether or not the account was an RAA had the strongest effect in predicting regular parental contributions. The odds of receiving regular payments were seven times higher among the non-RAAs than the RAAs. This confirms that the parents who were making regular payments were generally the most engaged with the CTF. They were also highly engaged with saving generally for their children, as indicated by the finding that children whose parent did not agree that “Saving for my child(ren) is a low priority for me at the moment” were far more likely than those who agreed to have received regular parental contributions (with odds of 2.5 times) and that the odds were 1.7 times higher for those children with other accounts than those without.
Measures that are indicative of the socio-economic status of the household were also important. Children living in households that rented their home from a social landlord were less likely than those in all other housing tenures to have received regular payments,16 all other things being equal. For example, the odds for this group were one-fifth of those where the home was owned on a mortgage. Children who received the Government‟s basic payment only when the account was first opened had twice the odds of having received
16
With the exception of those living with parents, which contained too few cases to be included in the analysis.

SAVING INTO CHILD TRUST FUND ACCOUNTS
27
regular parental contributions of those who had received the additional payment. And the highest qualification achieved by the chief income earner was highly predictive of regular parental contributions, all other things being equal, in the expected direction (that is with higher-level qualifications being associated with higher odds of regular parental contributions having been made).
Table 3.3 Pattern of payments and amount paid in by parents into CTF account, by socio-demographic and other characteristics Row percentages
Never
(%)
Ad hoc payments
(%)
Regularly in the past 12 months
(%)
Unweighted base
All children 70 11 19 1,877
Age of child Under 1 66 5 29 130
1 68 9 23 623
2 65 12 23 225
3 72 12 16 53
4 66 19 16 64
5 71 9 20 272
6 74 10 16 326
7 79 6 15 184
Gender of child Male 69 12 19 955
Female 70 10 19 922
Lone parent Yes 77 9 14 364
No 68 12 21 1,509
Number of siblings None 61 13 26 588
1 70 12 18 806
2 75 7 17 342
3 or more 84 6 9 141
Number of CTF eligible siblings
None 68 10 21 965
1 68 13 18 724
2 or more 81 4 14 188
Highest qualification of chief income earner
Degree or higher degree 65 8 28 485
Other higher education qualification
75 9 16 232
A-Levels or equivalent 68 14 18 345
GCSEs, O-Levels or equivalent
70 12 18 524
Other .. .. .. 38
Do not have any qualifications
70 19 11 140
Don't know 81 11 9 113
Ethnicity of chief income earner
White 70 11 19 1,620
Non-white 70 12 18 241
Housing tenure Being bought on a mortgage 64 12 24 1,146
Owned outright 77 8 15 120
Rented from social landlord 85 10 6 273
Rented from private landlord 79 7 15 247
Living with parents 72 19 9 51
Number of earners 2 63 14 23 911
1 74 8 18 718
None 81 9 10 233

CHILD TRUST FUND WAVE 2 EVALUATION
28
Table 3.3 continued
Never
(%)
Ad hoc payments
(%)
Regularly in the past 12 months
(%)
Unweighted base
Net monthly household income
Up to £569 75 4 21 54
£570 to £1,129 81 10 8 181
£1,130 to £1,699 76 10 14 235
£1,700 to £2,269 72 12 16 288
£2,270 to £3,399 65 13 22 465
£3,400+ 58 13 29 248
Missing information 71 9 19 406
Respondent's (or their partner's) income has ever increased or decreased over the past three years
Yes - increased 69 9 22 293
Yes - decreased 67 11 21 723
Yes - both 73 8 19 98
No 71 13 17 716
Better off or worse off than three years ago
Better off 71 12 18 418
Worse off 68 12 19 717
About the same 70 10 20 707
Received additional payment
Yes 82 11 8 246
No 65 13 22 796
Revenue allocated account
Non-RAA 64 13 23 1,519
RAA 93 2 4 358
Type of CTF account Cash 73 21 6 219
Stakeholder 69 9 22 750
Shares 62 17 21 73
Child has other account Yes 68 11 21 1160
No 72 11 17 717
Parents saved elsewhere for child in last 12 months
Yes 71 11 18 674
No 69 11 20 1,203
Amount held in savings and investments (excludes insurance)
None 72 11 17 773
£1 to 250 71 10 19 272
£251 to £500 72 11 17 170
£501 to £1,000 63 10 26 181
£1,001 to £2000 64 20 16 130
more than £2,000 68 8 24 143
Value unknown 68 9 23 208
Parents have savings Yes 67 12 21 1,538
No 82 7 11 339
Borrowing a burden Heavy burden 80 8 12 243
Somewhat of a burden 69 12 19 404
Not a problem 69 10 21 574
Nothing owed 67 13 19 612
Agreement with statement about saving: 'I think it's more important to buy my child(ren) the things they want than to save for them'
Strongly agree 83 8 9 243
Tend to agree 71 12 17 264
Neither agree nor disagree 79 9 11 160
Tend to disagree 63 14 23 583
Strongly disagree 68 10 22 627
Agreement with statement about saving: 'Saving for my child(ren) is a low priority for me at the moment'
Strongly agree 83 10 7 373
Tend to agree 71 12 16 487
Neither agree nor disagree 69 10 21 56
Tend to disagree 64 9 27 445
Strongly disagree 61 12 26 516
1. Base is children with an open CTF account. 2. '..' Figures based on fewer than 50 cases have been suppressed. Treat with caution any figure with a base of fewer than 100 cases

SAVING INTO CHILD TRUST FUND ACCOUNTS
29
Finally, there were statistically significant variations by both the age and gender of the child once the influence of other characteristics was held constant. Consistent with the crosstabular analysis reported above, two-year olds were at the high end of the range, the odds of having received regular payments being twice as high for this group compared with many other groups. More surprisingly, boys were significantly more likely to have received contributions than girls (with 1.4 times the odds).17
3.2.4 Characteristics of those who have made only ad hoc payments
Altogether, 11 per cent of children with an open CTF account had had only ad hoc payments into their account since it had been opened.
There were few clear links between receiving ad hoc payments from parents into the CTF and the socio-demographic characteristics of the child or their household (Table 3.3). The likelihood was substantially higher than the average among those living in a household where the chief income earner had no qualifications (19 per cent) and where the family was living with the parents‟ own parents (19 per cent). Ad hoc payments also tended to be associated with children who had few other siblings, those living in a household with two earners, the child having significant sums saved in other accounts (£1,001 to £2,000), and where the child‟s parents had savings of their own. There was no marked variation by household income level or by whether or not the account received the Government‟s Additional Payment Award, and no clear links with parents‟ attitudes towards saving for their children.
Taken together these findings suggest that, however small this group of children was, it was nonetheless heterogeneous. This might not be surprising given that „ad hoc payments‟ is defined broadly, encompassing those who may only have paid in a token amount at account opening through to those who may have paid regularly for several years but not in the last year.
On the other hand, a relatively high proportion of non-RAA accounts had received ad hoc payments (13 per cent compared with two per cent of RAA accounts), as had non-stakeholder equity-based CTF accounts (17 per cent). Moreover, 21 per cent of cash-based CTF accounts had received ad hoc payments. As such, these findings might be interpreted as pointing weakly towards a desire by parents of these children to save into the CTF but little capacity to do so. It is not clear why the likelihood was relatively high for children aged four (19 per cent).
3.2.5 Characteristics of those where no payments at all had been made
Across CTF-eligible children of all ages in 2010, some 70 per cent of accounts had received no contributions whatsoever from parents. Given that most accounts that had received contributions had received them from parents only, there is a similarity between the characteristics of those who were least likely to have received any contributions and those whose parents had not contributed at all (Table 3.3).
The oldest CTF-eligible children (those aged seven at the time of the interview) were among those most likely to have had no contributions made by parents into their account (79 per cent), although as before the pattern with age is not straightforward.
17
Measures that were not statistically significant in the regression model were: number of siblings, ethnicity, household income, whether or not there were earners in the household, parental saving, the burden of borrowing, and parental attitudes towards saving for children. The pseudo R squared for the model was 0.25.

CHILD TRUST FUND WAVE 2 EVALUATION
30
More than eight in ten children living in larger families, where there were three or more siblings (84 per cent) and two or more CTF-eligible siblings (81 per cent), had not received any CTF payments from parents.
The likelihood that parents had not contributed at all varied consistently by socio-economic characteristics. Children living in a household that was unwaged (81 per cent), had low net monthly household income (£570 to £1,129; 81 per cent) and was renting from a social landlord (85 per cent) were at the high end of the range. There was also significant variation depending on whether the child lived in a lone-parent household (77 per cent) or not (68 per cent).
Two additional measures of the financial situation of the household over the preceding three years were considered. There was little or no variation in the likelihood that parents had not contributed at all by whether the respondent felt the household was generally better or worse off than three years ago. While there is some indication that a volatile household income (one that has both increased and decreased in the past three years) was associated with a higher propensity for parents to have paid no money in (73 per cent) than the average (70 per cent), this finding is not statistically significant.
CTF accounts that had received the Government‟s Additional Payment Award, reflecting the households‟ economic situation at the time the child was born, were much more likely (82 per cent) never to have received any contributions from parents than those into which only the basic award had been received (65 per cent). Most strikingly however, the vast majority of RAAs had never been contributed to by parents (99 per cent), compared with a little under two-thirds (64 per cent) of non-RAA accounts.
3.2.6 Reasons why parents had not paid into the CTF
The most common reason parents gave in the survey for not having contributed to their child‟s CTF account was a lack of affordability, regardless of whether they had never contributed (35 per cent) or had done so but not since account opening (55 per cent; Table 3.4). The depth interviews showed that many people in this situation hoped to be able to afford to do so at some point in the future.
A substantial number of those who had never contributed said that this was in some way due to a dislike of some aspect of the CTF or a preference for making other provision (46 per cent), including 23 per cent who preferred to put money into an account they have chosen themselves. Meanwhile a fairly common reason given among those who had only contributed at account opening was that they were concerned about poor performance or about stock market fluctuations (20 per cent).
Four per cent of parents who had not contributed since account opening said that this was because they did not know where the account was at the time of survey. This may be interpreted as a lack of engagement in the CTF, but equally it may reflect the way in which providers are keeping parents informed about children‟s CTF accounts. For example, two parents interviewed in depth described how one particular provider had stopped offering deposit-based accounts and that their child‟s CTF accounts had been passed to another, otherwise unconnected, company. For both, it was only when they tried to open subsequent CTFs that they discovered this had happened. This had resulted in a feeling of disengagement among parents who were previously reasonably engaged (in principle, if not in practice) with the CTF. Similarly, some parents reported that their stakeholder accounts were run by companies other than those with which the parent opened the account: they were confused between the provider and the distributor. This appeared to have led to some disconnect between the provider and parents, albeit to a lower degree than when the accounts had been sold on.

SAVING INTO CHILD TRUST FUND ACCOUNTS
31
Table 3.4 Reasons why parents have not contributed to CTF account, by pattern of payments
Percentages
Payments made
None at all None since
account opening
Cannot afford it / not enough money 35 55
Prefer to put money into an account they have chosen themselves 23 3
Have not got round to it 12 10
Prefer to put the money into another account where it can be withdrawn before the child is 18
5 4
Have another savings account (elsewhere) that we add to 5 1
Prefer to put money into another account with a better return 5 1
Worried about stock market fluctuations 3 8
Don't Know where the account is 2 4
Because cannot draw money out until child is 18 2 -
Don't feel the need for/ see the point in adding money' 2 1
Money is added/has been added by someone else 2 1
Value was decreasing/not performing 1 12
Don't know how to 1 -
Because the child themselves can decide what to do with the money when they are 18
1 -
Don't agree with/like the idea of the Child Trust Fund 1 -
Prefer to spend the money 1 4
Am/was out of work 1 5
Did not know you could add to it 1 -
Other answers 8 13
Don't Know 2 -
Unweighted base 1,294 87
Base is children whose CTFs have received no contributions from parents
More than one response was allowed
„-„ indicates that there were no cases in the sample
3.2.7 Amounts contributed in the last 12 months
Among the parents who had contributed at all to their child‟s CTF account in the previous 12 months, the average (median) total amount that had been paid into it in that time was £150. Only a small minority (seven per cent; equivalent to two per cent of all with an open account) had received £1,000 or more, which includes four per cent (or one per cent of all open account) that had received the maximum payment of £1,200 allowable under the CTF rules. This is very similar to the four per cent in the baseline survey who said they thought they (and their child) would save the maximum amount, albeit based on the somewhat larger proportion who said they expected to contribute at all in the following 12 months.
When asked where the money parents had saved into the account in the last 12 months had come from, there was little evidence that money had been diverted from the child‟s other savings (Table 3.5). In the vast majority of cases parents reported that the money they had paid in had come out of their current income or their own current account (72 per cent; or 17 per cent of all parents), and few said that they had used Child Benefit or Child Tax Credit payments (nine per cent; or two per cent of all parents). A few also said that the money had come from money saved in an account or investments not opened for the child (11 per cent, equivalent to three per cent of all parents), presumably the parents own accounts. Very few, only three per cent of those who had contributed (and one per cent of all) reported that some or all of this money had come from other saving or investments already open for the child.

CHILD TRUST FUND WAVE 2 EVALUATION
32
Table 3.5 Where the money parents paid into CTF in last 12 months came from
Percentages
Other money from current income / transfer from current account 72
Transferred money from another savings or investment account (not one opened for the child) 11
Money from Child Benefit/Child Tax Credit 9
Money given to them by a relative or friend specifically to be saved 6
Transferred money from another savings or investment account already opened for the child 3
Ourselves/parents 2
Birthday/Christmas money/gifts 2
Money given to them by a relative or friend that would otherwise have been spent 2
By borrowing money from a commercial lender <1
By borrowing money from a relative or friend <1
Don't Know <1
Other answers 3
Unweighted base 467
Base is children with an open CTF account with any contributions from parents in the last 12 months
More than one response was allowed
This distribution of responses is broadly similar to the answers given at the inception of the CTF by parents in 2005 who expected to pay money in, among whom 69 per cent were expecting the contributions they made to come from current income or their own current account, and four per cent from Child Benefit payments.
3.2.8 Paying into accounts of other eligible children
It was very common for parents with more than one CTF-eligible child who had made payments into the sampled child‟s account to have paid a similar amount into their other children‟s CTF accounts. Eighty per cent said they had paid a similar amount into all of their CTF-eligible children‟s accounts and a further five per cent said they had done so into some. The depth interviews showed that parents felt it was very important to try to equalise contributions between children, and most did try to do this. The arrival of the second or subsequent children for some had, however, resulted in a drop in family (disposable) income, and therefore the older children had received a comparatively higher amount of money.
The reasons respondents to the survey gave for not paying a similar amount into all their CTF-eligible children‟s accounts, where applicable, largely reflected affordability and timing, suggesting that parents may have intended to pay a similar amount at some point in the future.18
3.2.9 Impact of CTF rules
Two sets of questions were asked of all respondents to the 2010 survey with a CTF-eligible child to directly elicit parents‟ views of the rules of the CTF in relation to the release of CTF saving to the child at age 18 and the likely impact of this on the amounts they were saving into the account. Specifically, they were asked if they would change the amount they paid in:
If some or all of the money could be taken out before the child reached 18
If the child could only withdraw the money at 18 with the parent‟s consent.
Those saying they would pay in a different amount were asked a follow up question of whether it would be more or less.
On the whole, parents did not feel that changes to these rules would affect how much they would pay in (Table 3.6). The vast majority of parents felt that bringing the age at which the
18
The samples are too small to report these findings quantitatively.

SAVING INTO CHILD TRUST FUND ACCOUNTS
33
money becomes available to children would not affect how much they paid in (86 per cent) and most also did not think that parental consent to do so at age 18 would affect their level of saving into the account (71 per cent).
Moreover, those who said it would change their behaviour were somewhat more inclined to favour earlier access and child autonomy. They would pay in more if the age was brought forward (10 per cent compared with five per cent who would pay less) and they would pay in less if parental consent was needed, 27 per cent compared with just three per cent who would pay in more.
Table 3.6 Whether amount of money respondent pays into CTF account would change
Column percentages
If money could be taken out before child reaches 18
If child could only withdraw money with their consent at 18
Would pay in more 10 3
No change 86 71
Would pay in less 5 27
Unweighted base 2,027 2,027
Base is all CTF-eligible children
3.2.10 Factors that encourage or discourage CTF saving
Affordability aside, the depth interviews with parents identified a range of different reasons why some had saved into the CTF account and others had not (so far) engaged with it. For some, the simple fact that the account “is there” had encouraged them to use it as either as a saving account or as an investment account for their child. Most of these parents believed they would have set up some form of account regardless, but had nonetheless been encouraged to start saving for their child at a very young age as a direct result of the CTF.
Building on the findings from the survey questions reported in section 3.2.9, some factors that were evident from the depth interviews related to the rules of the CTF itself. While most recognised the reasoning behind the rules surrounding access to the CTF, for some parents these rules nevertheless affected saving into the account depending on their perceived needs for an account for their child.
So for some, the fact the money could be withdrawn by the child at 18 had discouraged saving among those who preferred to retain control over any money they were saving for their child even into adulthood. Conversely, there were some for whom the lack of access until 18 was a factor in encouraging them to contribute (even if they were not currently doing so), as they believed this would increase the chances that their child would have a reasonable a sum of money saved at 18:
Whatever happens in my domestic life, I can’t think aha! Here’s £1,000, now I can pay the gas bill!
This was particularly so for those on lower incomes, who were currently not contributing to the CTF or any other account.
There were also those who believed that 18 was too young, and would have preferred the age to be set at 21, for example. That said, this was not a major objection for people who expressed this view, and so appeared to have had only a minimal effect on levels of contributions. Equally, and reflecting the findings of the survey described in section 3.2.9, there were some who believed that their child might have reason to access the money
CHILD TRUST FUND WAVE 2 EVALUATION
34
before age 18, and therefore that the CTF did not provide them with the requisite flexibility they were looking for:
I want a savings scheme where as they grow they can save for things, and understand the idea of getting things back at a younger age than 18
Moving away from the design of the CTF per se, the way the account was operated by the provider discouraged saving into the CTF among some people. In particular, the inability to pay into the account over the counter had discouraged parents from contributing to the CTF at all, despite a desire to do so:
I thought that while I was down there anyway, when they’ve got birthday money, I can just put it in, but it’s not as easy as that, you have to send it off...gradually they have this and that...(the spent money) would have been her savings.
it would be easier if you could just make a one off payment with a card
It was those on low incomes who tended to be affected by this particular consideration.
Finally, some parents described considerations for other, non-eligible children as affecting whether and how much they contributed to eligible children‟s CTF. As already noted, for many parents it was important to treat children equally. For some, this meant paying an extra equivalent amount into the account of the older, non CTF-eligible child (as discussed further in section 5.6). For others, it meant taking into consideration any extra money the older child had had paid into their account prior to the arrival of the CTF-eligible child or children. While for others still, feeling unable to compensate older children for any contributions they might add to the eligible child‟s CTF account due to a lack of money inhibited saving into the CTF account. The bigger the age gap between the CTF-eligible and non-eligible children, however, the less important was this consideration.
3.3 Contributions to CTF accounts by others
While it was not uncommon for CTF accounts to have received contributions from someone other than the responding parent or their partner, it was far from the norm. Some 86 per cent of accounts had received no contributions whatsoever from friends or other family members.
Altogether then, 14 per cent of open CTF accounts had received contributions from someone other than the child‟s parent. This includes 11 per cent that had received a payment from someone at or after account opening but not in the last 12 months. It also includes the small minority of accounts – three per cent in total – that had received contributions from other people in the last 12 months.
Looking across those accounts that had received any contributions from other individuals, it was most often the case that these contributions had been made by grandparents (71 per cent, equivalent to 10 per cent of all accounts). The contributions had also quite often been made by „someone else‟, most likely other relatives (53 per cent, or seven per cent of all accounts). In eight per cent of cases (one per cent overall) the contributions had been made by a non-resident parent. Very few children had contributed to their accounts themselves (fewer than one per cent).
On average, the average (median) total amount contributed by others to the CTF account in the last 12 months was £100. Contributions ranged widely, from £15 to £1,200, the maximum payable into the CTF in any one year.19
19
Treat with caution due to small bases (n=64).

SAVING INTO CHILD TRUST FUND ACCOUNTS
35
3.4 Total amounts held in CTF accounts
Most respondents were able to report how much money their child had in the CTF account. Typically, only very modest amounts of money were saved in CTF accounts in total. The average (median) amount held across all accounts was £300. This is only a little more than the value of the first voucher for those who did not receive the additional payment from the Government, reflecting the low likelihood overall than any contributions had been made by parents or others (37 per cent, as reported above).20
A third of accounts (33 per cent) had more than £500 saved in them, and a little over one in ten accounts (12 per cent) held £1,000 or more. The maximum reported amount held was £7,000.
3.4.1 Characteristics of children with the largest sums in their CTF accounts
On the whole, the differences in the median amount held in the CTF, where known, between children of different backgrounds were rather small. The widest variations related to socio-economic status and to characteristics associated with the CTF and account opening (Table 3.7).
The median amount held in the CTF accounts of children living in households in the second lowest income bracket at the time of the survey was £280, rising to £380 among those with the highest household incomes (£3,400 or more per month). By housing tenure, the median amount ranged from £268 in the accounts of those living in a home rented privately, to £360 where the home was owned outright.
This link with socio-economic status is reflected in the breakdown by whether or not the CTF account received the initial additional payment from the Government at account. Where the additional payment was received the typical balance was £500, indicating that, typically, no contributions had been made by parents or other individuals. In contrast, where an account had received only the basic award of £250, the average balance reported to the survey was £300.
As might be expected, slightly higher balances were also associated with the CTF account having been opened by a parent or their representative (£325), as opposed to one that was opened by the Government (£250). And stakeholder accounts had less saved in them on average (£300) than both other equity-based accounts (£400) and cash (£400).
A typical balance of £500 for children aged seven will partly reflect that some of these will have received their second (age seven) Government endowment. For younger age groups the median amount held in the CTF ranged from £250 among the under ones to £317 among those aged six, reflecting the gradual accrual of money in the accounts.
20
Note that 27 per cent said they did not know the balance of the account.

CHILD TRUST FUND WAVE 2 EVALUATION
36
Table 3.7 Average total amount held in CTF, by socio-demographic and other characteristics
Median (£) Unweighted base
All children 300 1,381
Age of child Under 1 250 111
1 270 505
2 280 162
3 .. 39
4 277 50
5 300 182
6 317 217
7 500 115
Gender of child Male 300 703
Female 286 678
Whether lone parent Yes 300 251
No 295 1128
Number of siblings None 300 462
1 300 593
2 280 230
3 or more 279 96
Number of CTF eligible siblings None 300 715
1 300 537
2 or more 250 129
Highest qualification of chief income earner
Degree or higher degree 325 370
Other higher education qualification 300 186
A-Levels or equivalent 295 263
GCSEs, O-Levels or equivalent 280 386
Other .. 24
Do not have any qualifications 300 85
Don't know 258 67
Ethnicity of chief income earner White 300 1,203
Non-white 280 167
Housing tenure Being bought on a mortgage 300 860
Owned outright 360 90
Rented from social landlord 275 186
Rented from private landlord 268 180
Living with parents .. 42
Number of earners 2 300 692
1 280 523
None 274 157
Net monthly household income Up to £569 .. 37
£570 to £1,129 280 126
£1,130 to £1,699 300 165
£1,700 to £2,269 280 225
£2,270 to £3,399 330 364
£3,400+ 380 200
Missing information 250 264
Received additional payment Yes 500 156
No 300 543
Revenue allocated account Non-RAA 325 1,134
RAA 250 247
Type of CTF account Cash 400 153
Stakeholder 300 490
Shares 400 56
Child has other account Yes 300 864
No 280 517

SAVING INTO CHILD TRUST FUND ACCOUNTS
37
Table 3.7 continued
Median (£) Unweighted base
Amount held in savings and investments (excludes insurance)
None 280 557
£1 to 250 300 210
£251 to £500 280 137
£501 to £1,000 270 150
£1,001 to £2000 300 102
more than £2,000 300 116
Value unknown 300 109
Base is children with an open CTF account, excluding those with unknown balance
'..' Figures based on fewer than 50 cases have been suppressed. Treat with caution any figure based on fewer than 100 cases.
CHILD TRUST FUND WAVE 2 EVALUATION
38
4 Other savings and investments held for children
This chapter moves the main focus away from the Child Trust Fund (CTF), to look at levels of saving or investing for children into other accounts (including insurance policies), and the amounts contributed to and held in these accounts. Explicit comparisons are also made between the amounts held in these other types of accounts compared with the amounts saved into the CTF and the characteristics of the children who were more likely to have more saved in their CTF are considered.
Summary
Some 60 per cent of CTF eligible children had some other form of saving vehicle,
mostly deposit accounts
The majority of these accounts were opened at the same time as the CTF, or within a
year of birth
Just over a third of those with Revenue Allocated Accounts (RAA) accounts also had
another account compared with almost two thirds of those whose parents had
opened the CTF account for them
Forty-four per cent of parents had paid money into a non-CTF account for their child
at some point (compared with 30 per cent into the CTF)
It was also far more likely for someone other than the parents to have contributed to
a non-CTF account (36 per cent), than it was for them to have saved into the CTF
(14 per cent)
The median amount held in a non-CTF account (among those with any) was £515
but there was considerable variation between amounts; more than a quarter had
£250 or less saved, while nearly one in ten had more than £2,000
Although larger average amounts were saved in other accounts (£600 among those
with any) compared with the CTF (£300), the CTF nonetheless comprised an
appreciable proportion of the overall amount saved for these children.
4.1 Other accounts opened for CTF eligible children
Six in ten (60 per cent) of all children eligible for the Child Trust Fund (CTF) had other money that had been saved or invested for them (including into insurance policies) outside their CTF account. This compares with just 37 per cent of children with an open CTF account who had received any contributions into their CTF other than the Government endowment.
Over a half (55 per cent) had a savings account, with a bank or building society deposit account being by far the most common (44 per cent). Investment accounts were held for a quarter (25 per cent) of CTF-eligible children; the most common being premium bonds (11 per cent) and life insurance policies (eight per cent).
OTHER SAVINGS AND INVESTMENTS HELD FOR CHILDREN
39
4.1.1 Age of children when accounts were opened
The majority of other accounts will have been opened at much the same time as the child‟s CTF account. Three quarters of savings accounts (76 per cent) and over half (55 per cent) of investments had been opened around the time of the birth of the child. Most of the rest (ten per cent of savings accounts and 30 per cent of investments) had been opened before the child„s first birthday.
4.1.2 Characteristics of those with other accounts
The likelihood of a CTF-eligible child having other saving accounts, investments or insurance policies increased with age, rising from under half (46 per cent) of children aged under one to two thirds (68 per cent) of children aged six and then levelled off (Table 4.1). The apparent difference between boys and girls (63 per cent compared with 57 per cent) did not quite reach statistical significance at the five per cent level. Children were somewhat more likely to have other savings or investments if they were living in a two-parent rather than a lone-parent family (63 per cent, compared with 50 per cent), and while the likelihood fell to 39 per cent if a child had three or more siblings, there was no systematic link with the number of siblings in smaller families.
There were also some clear associations with a number of economic indicators. Only four in ten children (40 per cent) living in families with a net household income of between £570 and £1,129 a month had any other savings or investments, rising to seven in ten (70 per cent) of children living in the wealthiest families that had a monthly income of £3,400 or more. Reflecting this it was highest for children with two parents in paid employment (70 per cent) and lowest for those living in a family with no parent in paid work (34 per cent).
There was a strong link with housing tenure, so children whose parents owned their home had the highest levels of other account holding (76 per cent owned outright; 70 per cent if buying on a mortgage); those whose parents rented their home had the lowest (46 per cent private tenants and 37 per cent social tenants).
Children with an RAA were considerably less likely to have other savings or investments (46 per cent) than those whose parents had opened their CTF account for them (65 per cent). There was, however, no statistically significant relationship with the type of CTF account held or between either parents‟ pattern of saving in the CTF account or the amount in that account.
Children were far more likely to have a non-CTF account if their parents had savings or investments of their own (67 per cent) than if they did not (32 per cent). And there was a fairly strong relationship with parents‟ attitudes to saving for children (see Table 4.1). More than two thirds of children whose parents disagreed with the two attitude statements had an account compared with fewer than a half of those who agreed.
To a large degree, these characteristics are very similar to the characteristics of the children who had received any contributions into their CTF account, as described in section 3.1.1. There is one notable exception, however. Children from a minority ethnic family were considerably less likely to have other accounts than their peers from white British families (39 per cent compared with 64 per cent). This is in contrast to the rates observed for any saving into the CTF which were similar among children from a minority ethnic background and those from a white British family. However, as section 4.1.3 shows, low rates of other account holding among children from a minority ethnic family appear to reflect other characteristics of the household; once such characteristics were controlled for in regression analysis, the odds that a child from a minority ethnic family had a non-CTF account was very high.

CHILD TRUST FUND WAVE 2 EVALUATION
40
Table 4.1 Levels of savings in other accounts, by socio-demographic and other characteristics
An
y
acco
un
t
he
ld (
%)
An
y s
avin
g
in last 1
2
mo
nth
s (
%)
Un
we
igh
ted
ba
se
1
Me
dia
n
am
oun
t
he
ld (
£)
Un
we
igh
ted
ba
se
2
All children 60 43 2,027 600 936
Age of child Under 1 46 34 190 350 65
1 56 45 664 400 294
2 60 45 235 950 103
3 64 38 55 .. 27
4 59 44 66 .. 33
5 63 43 283 800 149
6 68 50 338 1,000 175
7 65 44 196 800 90
Gender of child Male 63 45 1,020 600 477
Female 57 41 1,007 600 459
Whether lone parent Yes 50 34 409 400 140
No 63 46 1,613 600 796
Number of siblings None 59 41 643 600 295
1 65 48 868 600 423
2 60 42 365 500 171
3 or more 39 25 151 .. 47
Number of CTF eligible siblings
None 61 43 1,049 600 493
1 62 46 779 500 362
2 or more 52 31 199 600 81
Highest qualification of chief income earner
Degree or higher degree 69 51 517 800 281
Other higher education qualification 56 39 247 600 114
A-Levels or equivalent 60 44 375 550 188
GCSEs, O-Levels or equivalent 65 47 564 500 259
Other .. .. 43 .. 16
Do not have any qualifications 38 26 160 .. 41
Don't know 46 22 121 .. 37
Ethnicity of chief income earner
White 64 45 1,736 600 853
Non-white 39 32 271 780 77
Housing tenure Being bought on a mortgage 68 51 1,196 600 661
Owned outright 76 48 121 1,200 67
Rented from social landlord 37 25 307 250 76
Rented from private landlord 46 28 296 290 94
Living with parents 64 45 61 .. 22
Number of earners 2 70 55 959 700 538
1 58 39 775 500 328
None 34 17 278 200 65
Net monthly household income
Up to £569 46 26 65 .. 10
£570 to £1,129 40 21 208 200 60
£1,130 to £1,699 46 34 260 400 98
£1,700 to £2,269 58 43 306 400 148
£2,270 to £3,399 66 49 491 800 271
£3,400+ 70 55 264 900 172
Missing information 70 49 433 550 177
Received additional payment
Yes 45 28 256 350 90
No 70 50 826 750 459
Revenue allocated account
Non-RAA 65 46 1,519 600 774
RAA 46 33 358 300 122
Type of CTF account
Cash 66 43 222 600 123
Stakeholder 63 45 785 600 381
Shares 66 47 75 .. 45

OTHER SAVINGS AND INVESTMENTS HELD FOR CHILDREN
41
Table 4.1 continued
An
y
acco
un
t
he
ld (
%)
An
y s
avin
g
in last 1
2
mo
nth
s
(%)
Un
we
igh
te
d b
ase
1
Me
dia
n
am
oun
t
he
ld (
£)
Un
we
igh
te
d b
ase
2
Anyone has contributed to account
Yes, in last 12 months 63 43 502 600 250
Yes, but not in last 12 months 65 46 149 350 64
Not contributed to account 60 44 1,226 600 582
Pattern of payment into CTF account by parents
Never 60 43 1,317 550 615
Ad hoc payments 63 52 177 680 82
Regular payments in last 12 months 66 42 383 600 199
Amount in CTF account
0 to £250 59 43 528 600 252
£251 to £299 69 53 159 700 92
£300 to £499 73 53 246 350 135
£500 to £999 56 39 307 800 157
£1,000 or more 62 40 141 1,000 79
Parents have savings
Yes 67 50 1,632 600 854
No 32 16 395 290 82
Borrowing a burden Heavy burden 55 34 263 300 99
Somewhat of a burden 61 47 440 400 208
Not a problem 65 52 613 600 319
Nothing owed 58 37 662 700 293
'I think it's more important to buy my child(ren) the things they want than to save for them'
Strongly agree 46 36 263 250 77
Tend to agree 46 32 295 350 107
Neither agree nor disagree 62 39 173 500 83
Tend to disagree 68 48 627 600 317
Strongly disagree 65 49 669 800 352
'Saving for my child(ren) is a low priority for me at the moment'
Strongly agree 45 28 411 300 148
Tend to agree 56 34 528 400 225
Neither agree nor disagree 43 38 62 .. 25
Tend to disagree 66 50 474 700 251
Strongly disagree 74 61 552 1,000 287 1. Base is all CTF-eligible children. 2. Base is CTF-eligible children with any savings or investments and where the amounts held in these were known.
'..' Figures based on fewer than 50 cases have been suppressed. Treat with caution any figure based on fewer than 100 cases.
4.1.3 Predictors of having other accounts
Again, regression analysis has been used to identify which characteristics were associated with having other savings or investments (including insurance policies) while controlling for the potential correlations between the different characteristics. Although there are some parallels with the characteristics that predicted any saving into the CTF account, the characteristics that related independently to other account holding appear to be rather different in many ways. Compared with the children who had had any contributions into their CTF accounts, children with other accounts:
Were seemingly poorer
Were more likely to be from families with a minority ethnic background
Were more likely to have had an RAA account
Their likelihood of account holding was unaffected by having siblings.
Ethnicity and the highest qualification achieved of the chief income earner of the household were highly significant in this analysis. The odds of having another account were 2.9 times higher among children from a minority ethnic family than those from a white British background; and compared with those with only GCSE (or equivalent) level qualifications, the odds were 2.7 times higher among those with other higher education qualification and 2.2 times higher among those with no qualifications. The effect of the child‟s gender was
CHILD TRUST FUND WAVE 2 EVALUATION
42
also fairly strong, with girls being more likely than boys to have another account (with an odds ratio of 1.5).
Housing tenure was also significant. Compared with children living in a household that owned their accommodation outright, the odds of having another account were higher among those with a mortgage (by a ratio of 1.7), renting from a social landlord (by a ratio of 2.1) and renting privately (by a ratio of 2.6). Finally, whether or not the household was waged was also significant, with children in unwaged households being more likely to have another account (with an odds ratio of 1.7).
Some of the most highly statistically significant factors, however, were ones that related in some way to the CTF. The odds were 2.5 times higher among those children who had not received the Government‟s higher rate Government endowment (than those who had). The odds were 2.1 times higher among those with RAA compared with non-RAA accounts, suggesting that some people were engaged with saving generally for their child even though they had not engaged with the CTF at the point of account opening. And children who had received any contributions to their CTF account were more likely than those who had not to have other accounts (with an odds ratio of 1.7), possibly indicating that these children came from backgrounds where saving was generally considered to be a priority.21
4.2 Saving in the previous 12 months
A little over four in ten (43 per cent) CTF-eligible children had had money saved into a non-CTF account in the previous 12 months, (equivalent to 77 per cent of those with an account). This compares with 26 per cent of children with an open CTF who had received payments into these in the last 12 months (as reported in section 3.1.3).
4.2.1 Characteristics of those who had money saved for them in the last 12 months
The children who were likely to have had money saved for them in the last 12 months were very similar in their characteristics to those with a non-CTF account of any kind (Table 4.1). So, again, children who were aged 6 were at the high end of the range (50 per cent) as were those living in smaller families, two-parent families (46 per cent) and those from a white British background (45 per cent).
There were again strong links with socio-economic characteristics. As such, 51 per cent of children living in a home being bought on a mortgage, 55 per cent where there were two earners (compared with only 17 per cent of those with none) and 55 per cent of those in the highest income bracket of £3,400 or more had had money saved for them into non-CTF accounts in the last 12 months.
While those with non-RAA accounts were more likely to have had money saved for them in other accounts in the previous 12 months (46 per cent) than those with RAA accounts (33 per cent), this difference was considerably less marked than for rates of any saving into the CTF in the previous 12 months (31 and five per cent respectively).
The propensity for a child to have had money saved for them in the last 12 months differed very markedly depending on whether their parents did (50 per cent) or did not have savings of their own (16 per cent). Meanwhile, the proportions ranged from 28 per cent among those whose parents agreed strongly with the statement “Saving for my child(ren) is a low priority for me at the moment” to 61 per cent of those whose parents disagreed strongly with this.
21
The analysis was run on children with an open CTF account. Measures that were not statistically significant in the regression analysis were: the child‟s age, number of siblings, whether a two- or lone-parent family and household income. The pseudo R squared for the regression model was 0.23.

OTHER SAVINGS AND INVESTMENTS HELD FOR CHILDREN
43
4.2.2 Saving by parents
Altogether, 44 per cent of CTF-eligible children had had money saved for them into other accounts by their parents at some time (equivalent to 77 per cent of children with another account). Slightly fewer had received such contributions in the last 12 months (37 per cent). Primarily this money had been saved into a savings account: 31 per cent of all CTF-eligible children compared with three per cent into an investment and an estimated eight per cent into an insurance policy.22 This compares with 30 per cent of parents who had saved into the CTF account at all and 24 per cent of parents who had saved into this in the last 12 months.
The average (median) amount saved by parents in the last 12 months through any of these saving vehicles was £240. Where money had been saved into a saving deposit account the average sum saved over the course of the year was slightly lower at £200, with rather larger amounts being associated with insurance policies (£550) for the smaller number of children with these types of accounts.
4.2.3 Saving by others
Just over a third of CTF eligible children (36 per cent) had had money saved for them into another saving or investment account at some point by someone other than their parents.23 This was mostly made up of saving into saving deposit accounts (32 per cent) rather than into investments (nine per cent). Again, this is rather higher than the 14 per cent of children who had received payments into their CTF accounts from someone other than their parents.
As found in relation to saving into the CTF, it was very common for the benefactor to have been a grandparent of the child. Seventy-seven per cent of all those who had received any contribution (equivalent to 28 per cent of all CTF-eligible children) had received a contribution from a grandparent. Similarly, it was common for the benefactor to have been „someone else‟ (44 per cent, or 16 per cent of all CTF-eligible children). Very few of them had received a contribution from a non-resident parent (two per cent, equivalent to one per cent of all) or from the child themselves (two per cent, or less than one per cent overall).
About a half of those who had ever had money saved for them by someone else had done so in the last 12 months (18 per cent of all children), including 16 per cent who had had money put into a saving deposit accounts and three per cent into an investment.
The median amount saved by others in total in the last 12 months was £150, which varied considerably by type of account: £120 into savings accounts and £300 into investments.
4.2.4 Total amounts saved in the last 12 months
Summing together the money saved for children by parents and other individuals into non-CTF accounts in the last 12 months, the average (median) amount saved for children into other accounts was £250. However, a large minority of children (34 per cent) had had more than £500 paid into their accounts, including 14 per cent who had had more than £1,000 paid to them in the last year alone. It should be noted, however, that these figures are based on only the subset of children (43 per cent) who had other accounts and had received any payments into them.24
22
It was not possible to identify who (whether parents or other individuals) had made the payments into insurance policies. Therefore these payments were assumed to have been made by parents. 23
These figures exclude any payments into insurance policies for this child, since any such payments were assumed to have been made by parents. 24
It is not possible to use medians across all children, regardless of whether or not they have any other account, as so many had had nothing saved for them in these ways (resulting in a median value of zero). The median can therefore only be reported for the subset with non-zero values, an approach that is consistent with the approach taken in the baseline report.

CHILD TRUST FUND WAVE 2 EVALUATION
44
4.3 Total amounts saved or invested
Altogether, four in ten (43 per cent) CTF-eligible children had no stock of money saved or invested for them (excluding insurance policies) other than the money they had in their CTF account.25 A further 11 per cent had some money saved but their parent who was interviewed did not know how much this was. The remaining children who did have another account with a known amount included 15 per cent who had £250 or less, that is a sum equivalent to the basic government CTF contribution at birth, and a few more (seven per cent) had between £250 and £500 saved. At the other extreme just under one in ten (eight per cent) of CTF-eligible children had more than £2,000 saved or invested for them, with a small number of these (one per cent of all CTF-eligible children) having more than £10,000. The largest sum held for a child was £130,000. The average amount (median) held in accounts was £600.
4.3.1 Characteristics of the children with the largest sums saved or invested
On the whole, the average amounts children in different circumstances had saved for them in other accounts again mirrored their likelihood of having an account at all (Table 4.1).26 So the amount tended to be larger the older the child was (rising from £350 among the under-ones to £1,000 among six-year olds) and the fewer siblings they had (from £500 among children with two siblings to £600 if they had none or only one). Boys and girls meanwhile had very similar amounts saved on average (with a median each of £600).
Although they were less likely to have another savings or investment account, where they did, children from a minority ethnic group had more money than those from a white British family (£780 compared with £600).
The links with household economic circumstances were strong and, again, mirrored the likelihood of a child having a non-CTF account at all. While children living in families with a net household income of between £570 and £1,129 a month had an average of £200 saved for them in non-CTF accounts, this rose steadily with income to an average of £900 among in the most well-off families, with a net household income of more than £3,400 a month. There were similarly substantial differences in the average amounts depending on the number of earners in the household (£200 where there were none, rising to £700 where there were two) and large differences between children living in different housing tenures. Children who lived in social rented housing had an average of £250, compared with £1,200 among their counterparts whose parents owned their home outright.
Where management information was available about the amount received in CTF vouchers at birth from the Government, it is clear that those eligible for the additional payment had much less on average saved elsewhere (£350) than those where no additional payment was made (£750). There was a link with whether or not the child had an RAA (£300 if they did and £600 if their parents had opened the account) but (as with account holding reported above) there was no marked or systematic relationship between the amount held in other savings or investments and either the amount held in CTF accounts or the pattern of payments into them.
Children whose parents had savings or investments of their own had more money saved in non-CTF accounts (£600) than those whose parents had no savings at all (£200). There was, as might be expected, also a link with parental attitudes to saving for children. So, while children whose parents expressed the most negative views in response to the two attitudinal statements had £250 and £300 saved elsewhere on average; children whose parents were the most positive had £800 and £1,000 respectively.
25
Insurance policies could not be included in this measure given that survey respondents could not reasonably be expected to know the value of these. 26
Treat with caution, however, as many subgroups have small sample sizes (fewer than 100 cases).
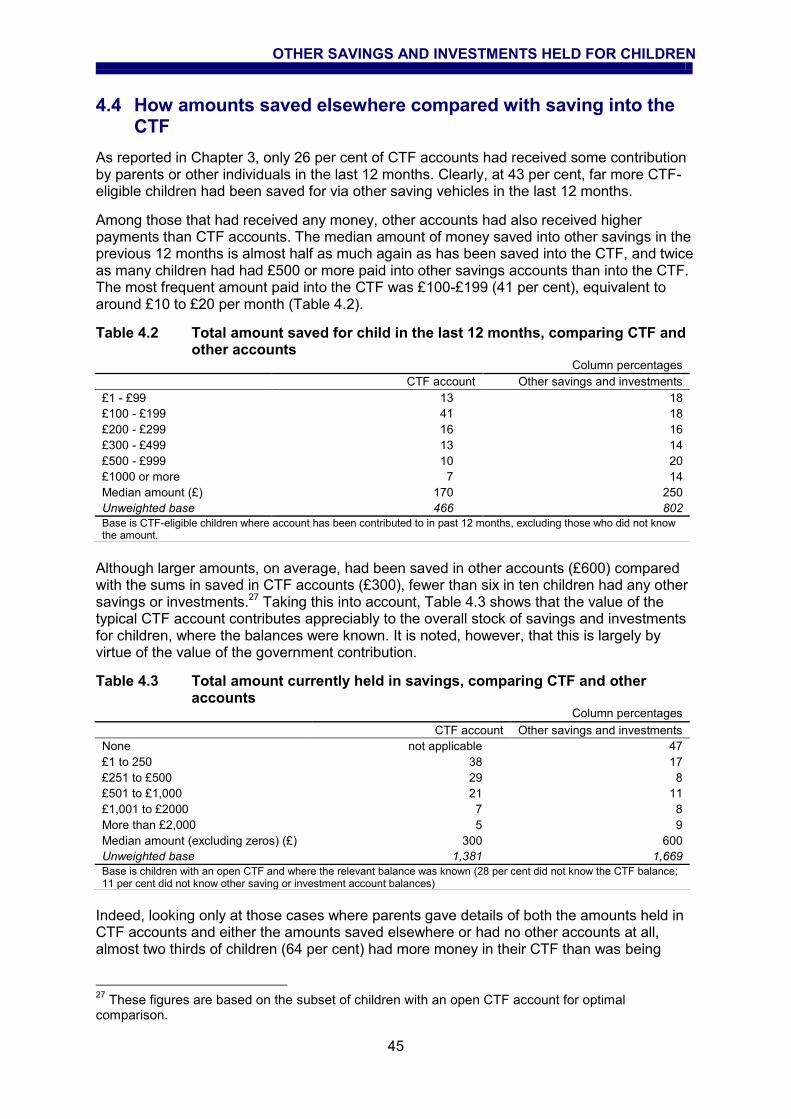
OTHER SAVINGS AND INVESTMENTS HELD FOR CHILDREN
45
4.4 How amounts saved elsewhere compared with saving into the CTF
As reported in Chapter 3, only 26 per cent of CTF accounts had received some contribution by parents or other individuals in the last 12 months. Clearly, at 43 per cent, far more CTF-eligible children had been saved for via other saving vehicles in the last 12 months.
Among those that had received any money, other accounts had also received higher payments than CTF accounts. The median amount of money saved into other savings in the previous 12 months is almost half as much again as has been saved into the CTF, and twice as many children had had £500 or more paid into other savings accounts than into the CTF. The most frequent amount paid into the CTF was £100-£199 (41 per cent), equivalent to around £10 to £20 per month (Table 4.2).
Table 4.2 Total amount saved for child in the last 12 months, comparing CTF and other accounts
Column percentages
CTF account Other savings and investments
£1 - £99 13 18
£100 - £199 41 18
£200 - £299 16 16
£300 - £499 13 14
£500 - £999 10 20
£1000 or more 7 14
Median amount (£) 170 250
Unweighted base 466 802
Base is CTF-eligible children where account has been contributed to in past 12 months, excluding those who did not know the amount.
Although larger amounts, on average, had been saved in other accounts (£600) compared with the sums in saved in CTF accounts (£300), fewer than six in ten children had any other savings or investments.27 Taking this into account, Table 4.3 shows that the value of the typical CTF account contributes appreciably to the overall stock of savings and investments for children, where the balances were known. It is noted, however, that this is largely by virtue of the value of the government contribution.
Table 4.3 Total amount currently held in savings, comparing CTF and other accounts
Column percentages
CTF account Other savings and investments
None not applicable 47
£1 to 250 38 17
£251 to £500 29 8
£501 to £1,000 21 11
£1,001 to £2000 7 8
More than £2,000 5 9
Median amount (excluding zeros) (£) 300 600
Unweighted base 1,381 1,669
Base is children with an open CTF and where the relevant balance was known (28 per cent did not know the CTF balance; 11 per cent did not know other saving or investment account balances)
Indeed, looking only at those cases where parents gave details of both the amounts held in CTF accounts and either the amounts saved elsewhere or had no other accounts at all, almost two thirds of children (64 per cent) had more money in their CTF than was being
27
These figures are based on the subset of children with an open CTF account for optimal comparison.

CHILD TRUST FUND WAVE 2 EVALUATION
46
saved or invested elsewhere – including children who had no other accounts – a third (33 per cent) had a larger sum in non-CTF accounts and three per cent had identical amounts.
4.4.1 Characteristics of children who had more saved in their CTF than elsewhere
The types of children who were most likely to have more money saved in the CTF than elsewhere tended also to be those who had no money saved elsewhere and who had not had any money paid into their CTF accounts (Table 4.4). This suggests that in many cases they had more in their CTF account than elsewhere only because they had the government endowment. They included children:
Who had three or more siblings (80 per cent; compared with the average of 64 per cent)
Who were from minority ethnic groups (80 per cent)
Who lived in low-income households, with net monthly incomes of between £570 and £1,129 (89 per cent)
Who had no parent in paid work (92 per cent)
Whose parents had no qualifications (92 per cent)
Whose parents rented rather than owned their home, particularly if renting from a social landlord (88 per cent)
Who had an RAA (75 per cent)
Whose parents had no savings of their own (89 per cent)
Whose parents held strongly negative views about saving for their children compared with buying things for them that they need now (80 per cent).
There was, however, no systematic difference between children of different ages. And the pattern of payments into the CTF account played much less of a role than whether or not the parent saved elsewhere.
4.4.2 Predictors of having more money saved in the CTF than elsewhere
Again regression analysis has been used to identify the factors that independently predict having more money in a CTF account than elsewhere. The factors with the highest level of statistical significance (net of other factors in the model) were parental attitudes towards saving for children as a current priority and whether or not the parent had savings of their own. So where parents strongly agreed that saving for their child was a low priority, the odds of the child having more saved in their CTF account than elsewhere were 2.5 times higher than children whose parents‟ disagreed strongly. There was similar variation depending on to what extent the parent agreed or disagreed that they thought it was more important to buy things for their child(ren) now than to save for them, albeit to a less marked extent.
Similarly, compared with children whose parents had savings of their own, the odds of having more money in the CTF than elsewhere were three times higher than those whose parents had no savings of their own.
The education level of the chief income earner in the household was also highly significant. All other things being equal, those with only GCSEs (or equivalent) were at the lower end of the range. The odds of having more money in the CTF than elsewhere were around twice as high as these among the children of parents with degrees or higher and other higher education qualifications, rising to more than four times the odds where the parent was without any qualifications whatsoever. This polarised distribution suggests the likely effect of two independent influences on amounts held in the CTF relative to other accounts: the effect of the higher rate Government endowment on those with no qualifications (who, presumably, were more likely to have qualified for this); and the effect of active saving by parents or other individuals accounts among those with higher qualifications.
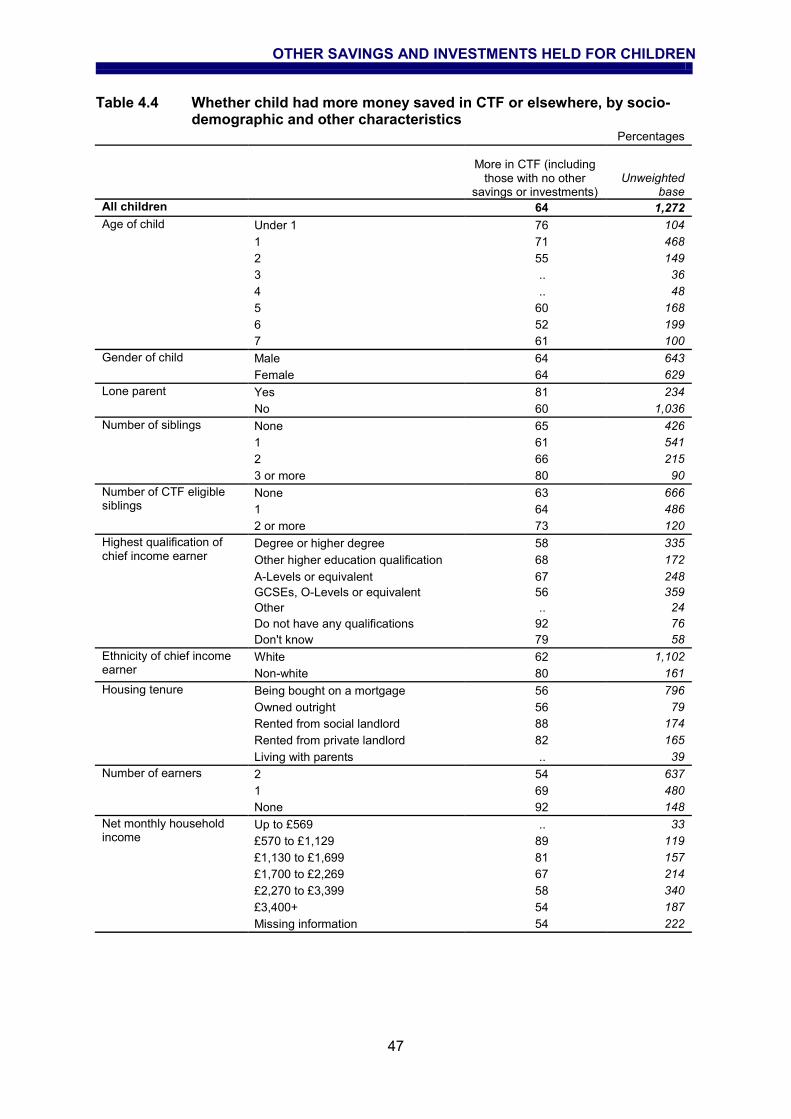
OTHER SAVINGS AND INVESTMENTS HELD FOR CHILDREN
47
Table 4.4 Whether child had more money saved in CTF or elsewhere, by socio-demographic and other characteristics
Percentages
More in CTF (including
those with no other savings or investments)
Unweighted base
All children 64 1,272
Age of child Under 1 76 104
1 71 468
2 55 149
3 .. 36
4 .. 48
5 60 168
6 52 199
7 61 100
Gender of child Male 64 643
Female 64 629
Lone parent Yes 81 234
No 60 1,036
Number of siblings None 65 426
1 61 541
2 66 215
3 or more 80 90
Number of CTF eligible siblings
None 63 666
1 64 486
2 or more 73 120
Highest qualification of chief income earner
Degree or higher degree 58 335
Other higher education qualification 68 172
A-Levels or equivalent 67 248
GCSEs, O-Levels or equivalent 56 359
Other .. 24
Do not have any qualifications 92 76
Don't know 79 58
Ethnicity of chief income earner
White 62 1,102
Non-white 80 161
Housing tenure Being bought on a mortgage 56 796
Owned outright 56 79
Rented from social landlord 88 174
Rented from private landlord 82 165
Living with parents .. 39
Number of earners 2 54 637
1 69 480
None 92 148
Net monthly household income
Up to £569 .. 33
£570 to £1,129 89 119
£1,130 to £1,699 81 157
£1,700 to £2,269 67 214
£2,270 to £3,399 58 340
£3,400+ 54 187
Missing information 54 222

CHILD TRUST FUND WAVE 2 EVALUATION
48
Table 4.4 continued
More in CTF (including those with no other
savings or investments)
Unweighted base
Received additional payment
Yes 84 146
No 54 490
Revenue allocated account (survey measure)
Non-RAA 62 1,040
RAA 75 232
Type of CTF account (sample variable)
Cash 60 143
Stakeholder 62 440
Shares 55 53
Anyone has contributed to account
Yes, in last 12 months 71 339
Yes, but not in last 12 months 76 106
Not contributed to account 60 827
Pattern of payment into CTF account by parents
Never 62 894
Ad hoc payments 69 126
Regularly in the last 12 months 69 252
Amount in CTF account 0 to £250 57 484
£251 to £299 58 145
£300 to £499 66 225
£500 to £999 71 286
£1,000 or more 79 132
Child has other account Yes 40 755
No 100 517
Parents saved elsewhere for child in last 12 months
Yes 24 441
No 82 831
Amount held in savings and investments (excludes insurance)
None 100 557
£1 to 250 88 210
£251 to £500 34 137
£501 to £1,000 11 150
£1,001 to £2000 5 102
More than £2,000 1 116
Parents have savings Yes 59 1,053
No 89 219
Borrowing a burden Heavy burden 75 173
Somewhat of a burden 69 277
Not a problem 60 387
Nothing owed 61 416
'I think it's more important to buy my child(ren) the things they want than to save for them'
Strongly agree 80 164
Tend to agree 76 167
Neither agree nor disagree 69 109
Tend to disagree 59 400
Strongly disagree 57 432
'Saving for my child(ren) is a low priority for me at the moment'
Strongly agree 79 249
Tend to agree 71 319
Neither agree nor disagree .. 39
Tend to disagree 57 308
Strongly disagree 51 357
1. Base is all children with an open CTF account
„..‟ Figures based on fewer than 50 cases have been suppressed. Treat with caution any figure based on a sample of fewer than 100 cases

OTHER SAVINGS AND INVESTMENTS HELD FOR CHILDREN
49
Children living in social rented and private rented accommodation were more likely (with twice the odds) than those living in homes owned either outright or on a mortgage to have more money in their CTF than elsewhere. Since these children are more likely to be the ones who would have qualified for the Government‟s Additional Payment Award, these findings support the idea that the amount in the CTF compared with those held elsewhere were partly driven by this endowment.28
A further regression analysis was undertaken, otherwise identical to this one, which included an indicator of whether the child received only the Government‟s standard contribution of £250 or the higher Government contribution of £500 to help test whether or not this was the case (for the subset of children for whom this information was available in the management data). The measure was statistically significant in the model and improved the predictive power of the model considerably.29 With odds at 2.1 times higher than those who received the basic award, the children who received the additional payment from Government were far more likely to have more money saved in the CTF than elsewhere. Moreover, the inclusion of this measure resulted in housing tenure no longer being statistically significant. The results of this regression were otherwise broadly very similar to those just described. This confirms that the size of the endowment received from Government played a large role in explaining why some children had more savings in their CTF account than in other accounts.
28
Measures that were not statistically significant in the model were: number of siblings, whether a two- or lone-parent household, ethnicity, household income, whether the household was waged or unwaged, and whether an RAA or a non-RAA. The pseudo R squared for the model was 0.26. 29
The pseudo R squared for the model was 0.33.

CHILD TRUST FUND WAVE 2 EVALUATION
50
5 Impact of the Child Trust Fund on saving for and by children
In previous chapters levels of saving into the Child Trust Fund (CTF) and into other types of saving vehicles have been examined separately. The focus in this chapter is on saving in its entirety, considering the overlap between these two elements and the effect of the CTF on total saving for children. While it describes various self-report measures of the effect of aspects of the CTF policy on saving for children by parents, a key part of the chapter involves evaluating objectively the impact of the CTF on levels of saving for children. To do this, a „difference-in-differences‟ (DiD) approach has been adopted, drawing on a comparator group of children who were just too old to qualify for the CTF. This approach provides estimates of the impact of the CTF on key measures of saving for children. The methodological note on pages 51-52 explains how the DiD was calculated and applied here.
Summary
Few parents had personally paid into the CTF when they opened the account to pay
in the Government vouchers. Fewer still had made payment around the time of the
second payment at age seven
There was no statistically significant change in levels of saving into or the total
amounts held in children‟s non-CTF accounts as a result of the CTF. Statistical
evidence of a CTF impact on non-CTF account holding was inconclusive
For a quarter of parents, saving into the CTF was an important part of their overall
saving for their child; this included a minority who had only saved into the CTF
A larger group of parents – four in ten – had primarily saved for their child outside the
CTF; a further third were largely disengaged from saving at all for their child
When asked directly, most parents of CTF-eligible children who also had other
accounts said that the CTF had had no effect on the total amount they had saved for
their child. Among those who said there had been an effect many more said they had
saved more than said they had saved less
However, more formalised impact analysis identified no statistically significant effect
of the CTF on rates of active saving for children (whether into CTF or other accounts)
or on the total amounts held in savings among children overall
There was, nonetheless, clear statistical evidence that the CTF had had a positive
impact, of an estimated £618, on the total amounts saved for children living in homes
that were not owned by their household
Financing education was the most common purpose parents had in mind for the
money saved into the CTF; in contrast sums saved elsewhere tended to earmarked
for the child‟s future more generally
The CTF appeared to have stimulated some parents to both open a similar account
for older siblings not eligible for a CTF account and to save for them.

IMPACT OF THE CTF ON SAVING FOR AND BY CHILDREN
51
Methodological note: Difference-in-differences estimates and their application to the CTF evaluation
Difference-in-differences (DiD) is an established approach for estimating the impact of a policy using sample averages. Its particular value here is that it can be used in the absence of panel data. The approach incorporates into the calculation an estimate of the counterfactual, in this case, what levels of saving would have been in the absence of the CTF. As such, the approach allows the difference on a given measure between the CTF-eligible children and a comparator group of CTF-ineligible children after the introduction of the CTF to be understood in the context of differences between their equivalent groups prior to the introduction of the CTF. At its simplest, the DiD is the change in a measure over time for the CTF-eligible group, minus the change in the same measure over time for the comparator group.
For the DiD analysis, data was utilised for two specific subsets of children from the 2005 and 2010 surveys: children aged eight and nine (the comparator group of CTF-non-eligible children in 2010); and children aged five and six (all of who were eligible for the CTF in 2010 and who were closest in age to the eight- and nine-year olds to help control for any specific age effects). Seven-year olds were excluded because younger seven-year olds in the 2010 sample were eligible for the CTF while older seven-year olds were not and this distinction could not be replicated in the 2005 data.
The change observed in the comparator group is taken to be representative of the trend that would have occurred in the CTF-eligible group had the policy not been introduced. Thus by controlling for the difference observed in the comparator group over time, the DiD estimate can be interpreted as the impact of the CTF policy on the intervention group. However, in using the eight- and nine-year olds as the comparator, we must accept that there may potentially have been some unintended, indirect effects of the CTF on these older CTF-ineligible children affecting some measures more than others.
DiD also controls for any fixed effects of unobserved characteristics on the impact measures such as the changes in the macro-economic climate in Britain between 2005 and 2010. Nonetheless, the analysis and the interpretation of it assume that these unobserved influences have impacted on both the CTF-eligible and the comparator group equally. Additionally, the analysis reported here does not control for differences in the characteristics of the groups except where breakdowns by these are explicitly reported.
In practice, DiD analysis is normally undertaken using regression techniques. Regression confers several advantages over the manual calculation of the DiD estimate, including the computation of the statistical significance of the estimate. However, for regression analysis to have been possible, it would have been necessary to combine the data from the 2005 and 2010 surveys, which were held separately, into a single data file. This was not possible within the parameters of the current project due to time and budgetary constraints.30
Instead, the approach taken here has been to assess the reliability of the DiD estimate indirectly. This is done with reference to the statistical significance (at the 95 per cent level) of the differences over time for the CTF-eligible and comparator groups individually and in particular the confidence interval (CI, or „margin of error‟) for each difference. The confidence intervals for the two differences are compared and if their ranges do not overlap at all a firm conclusion can be drawn that there is statistical evidence of a CTF impact.
30
The use of DiD analysis did not form part of the original study design. There were therefore practical limitations to its application in this instance, relating in particular to the method of calculating the DiD estimate and to relatively small sample sizes.
CHILD TRUST FUND WAVE 2 EVALUATION
52
Methodological note continued
Where there is overlap between the two CIs that extends beyond the midpoint of either range („extreme overlap‟), it is concluded that there is no statistical evidence of a CTF impact. This is not to say that the CTF did not have an effect on levels of saving for children, just that if such an effect did exist it was too small to be detected reliably (particularly given the relatively small sample sizes).
Finally, whenever there is any overlap that falls short of extreme overlap, the statistical evidence is itself considered „inconclusive‟. In other words, it is unclear whether or not the DiD estimate can be treated as a reliable indicator of the impact of the CTF. Again, this is due to the size of the estimated effect given by the DiD relative to the sample sizes. As the chapter describes, a number of the DiD analyses fall into this last category of statistically inconclusive.
In a departure from earlier chapters, in which average amounts were expressed as the median, this chapter examines the mean amounts saved. Using the mean rather than the median allows the calculation of the statistical significance of the observed differences in the amounts saved between the 2005 and the 2010 surveys. However, the mean values that are shown and discussed throughout this chapter are trimmed means (trimmed at the five per cent level) in order to control for extreme outliers. It should be noted that the non-trimmed means are used in the assessment of statistical significance.31
5.1 Effect of Government payments on saving into the CTF by parents
All parents whose child had a CTF account were asked if they had personally paid in any money when they opened the account to pay in the vouchers they had received from the Government. A minority (13 per cent) said that they had.
At the time the survey was carried out around half of the parents of children aged seven said that they had received notification that the second Government payment had gone into their child‟s CTF account. This second payment had less of an impact on parental saving, with just three per cent of parents who had received it saying that they had paid money in themselves at the same time.
5.2 Effect of CTF on other account holding and amounts saved elsewhere
Parents whose CTF-eligible child also had other savings or investments were asked if their child having a CTF account had affected the amounts of money they had saved or invested elsewhere. The great majority of them said that it had had no effect (83 per cent, equivalent to 48 per cent of all parents, including those whose child had no other account). Roughly the same proportion said that it had reduced other saving (seven per cent, equivalent to four per cent of all parents) as said that it had increased the amount they had saved elsewhere (nine percent, or five per cent of all parents).
31
Statistical significance was calculated using the Student‟s t-test of the non-trimmed mean and its standard deviation. The assumption of homogeneity of variance was assumed to be violated, implying an increased risk of finding a significant result where one does not exist (a Type I error). This risk is mitigated by the relatively large sample sizes on which the analysis is based.

IMPACT OF THE CTF ON SAVING FOR AND BY CHILDREN
53
5.2.1 Impact of the CTF on other account holding
It was reported in section 4.1 that 60 per cent of all CTF-eligible children in 2010 had some other form of saving or investment account or an insurance policy. This section re-considers levels of other account holding in this first application of difference-in-differences (DiD) analysis.32 Some 66 per cent of five- and six-year olds had some form of other saving vehicle in 2010 (Table 5.1). This compares with an estimate of 70 per cent for the same age group in 2005. However, the apparent decrease of five percentage points in the rate of other account holding since 2005 was not statistically significant, and so cannot be taken as being indicative of a change in the population of all five- and six-year olds.
Table 5.1 Impact of the CTF on children’s other saving, investment or insurance account holding
Percentage with any other account Percentage point difference between surveys (95% CI) 2005 2010
5 & 6 year olds 70 66 -5ns
(± 9)
Unweighted bases 330 621
8 & 9 year olds 69 74 5ns
(± 9)
Unweighted bases 357 383
DiD estimate (percentage point)
-10
Inconclusive
Base is all children „*‟ indicates a statistically significant difference (p<0.05); „ns‟ indicates that this difference is not statistically significant Figures may not appear to sum (or subtract) correctly due to rounding
Conversely, rates of other account holding among the comparator group of eight- and nine-year olds were 69 per cent in 2005 and 74 per cent in 2010. Again, however, the nominal increase of five percentage points in the rate of other account holding among this group was not statistically significant.
As explained at the start of this chapter, the DiD methodology subtracts the nominal change for the comparator group from the nominal change for the CTF-eligible group. The result here was a nominal DiD estimate of -10, which implies that, among the samples surveyed at least, other account holding decreased ten percentage points among CTF-eligible children compared with what it would have been had the CTF not been introduced (Table 5.1).
However, the statistical significance of this estimate must be assessed before we can have confidence in generalising the findings beyond the children covered by the survey. The statistical significance of the DiD estimate was assessed using the confidence intervals (CIs) associated with the percentage point difference between surveys for each age group (shown in Table 5.1). For the children aged five and six, the margin of error of plus or minus nine percentage points around the estimated five percentage point decrease produced a CI of -14 percentage points to four percentage points. The CI associated with the estimated change over time for eight- and nine- year olds ranged from -4 to 14 percentage points. The overlap between these CIs was large but fell short of the „extreme‟ overlap needed to conclude that there was no statistically significant effect of the CTF on account holding.33 Consequently, the statistical evidence was inconclusive.
32
Note that these findings should be seen in the context of different question structures for capturing other account information in the two surveys (see section 1.4). 33
Where „extreme‟ overlap is defined as being where the range of one CI overlaps the midpoint of the other CI, in this case -5 and 5 percentage points respectively.
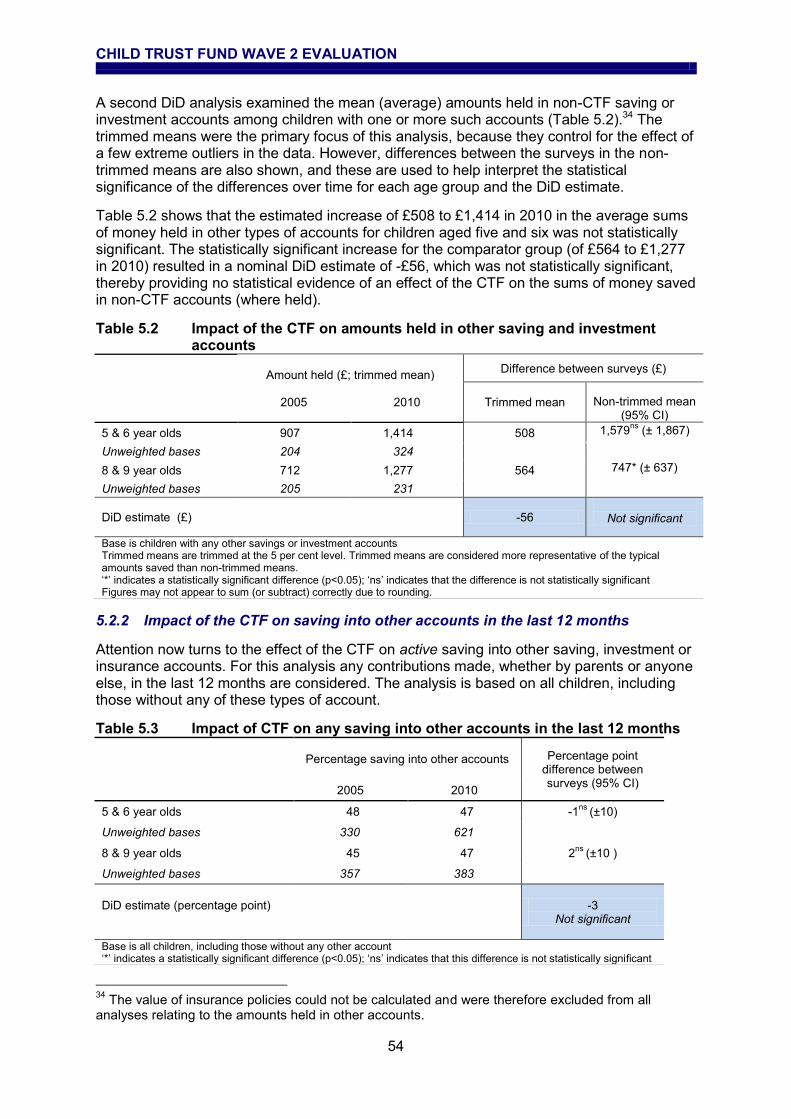
CHILD TRUST FUND WAVE 2 EVALUATION
54
A second DiD analysis examined the mean (average) amounts held in non-CTF saving or investment accounts among children with one or more such accounts (Table 5.2).34 The trimmed means were the primary focus of this analysis, because they control for the effect of a few extreme outliers in the data. However, differences between the surveys in the non-trimmed means are also shown, and these are used to help interpret the statistical significance of the differences over time for each age group and the DiD estimate.
Table 5.2 shows that the estimated increase of £508 to £1,414 in 2010 in the average sums of money held in other types of accounts for children aged five and six was not statistically significant. The statistically significant increase for the comparator group (of £564 to £1,277 in 2010) resulted in a nominal DiD estimate of -£56, which was not statistically significant, thereby providing no statistical evidence of an effect of the CTF on the sums of money saved in non-CTF accounts (where held).
Table 5.2 Impact of the CTF on amounts held in other saving and investment accounts
Amount held (£; trimmed mean) Difference between surveys (£)
2005 2010 Trimmed mean Non-trimmed mean
(95% CI)
5 & 6 year olds 907 1,414 508 1,579ns
(± 1,867)
Unweighted bases 204 324
8 & 9 year olds 712 1,277 564 747* (± 637)
Unweighted bases 205 231
DiD estimate (£) -56
Not significant
Base is children with any other savings or investment accounts Trimmed means are trimmed at the 5 per cent level. Trimmed means are considered more representative of the typical amounts saved than non-trimmed means. „*‟ indicates a statistically significant difference (p<0.05); „ns‟ indicates that the difference is not statistically significant Figures may not appear to sum (or subtract) correctly due to rounding.
5.2.2 Impact of the CTF on saving into other accounts in the last 12 months
Attention now turns to the effect of the CTF on active saving into other saving, investment or insurance accounts. For this analysis any contributions made, whether by parents or anyone else, in the last 12 months are considered. The analysis is based on all children, including those without any of these types of account.
Table 5.3 Impact of CTF on any saving into other accounts in the last 12 months
Percentage saving into other accounts Percentage point difference between surveys (95% CI)
2005 2010
5 & 6 year olds 48 47 -1ns
(±10)
Unweighted bases 330 621
8 & 9 year olds 45 47 2ns
(±10 )
Unweighted bases 357 383
DiD estimate (percentage point)
-3
Not significant
Base is all children, including those without any other account „*‟ indicates a statistically significant difference (p<0.05); „ns‟ indicates that this difference is not statistically significant
34
The value of insurance policies could not be calculated and were therefore excluded from all analyses relating to the amounts held in other accounts.
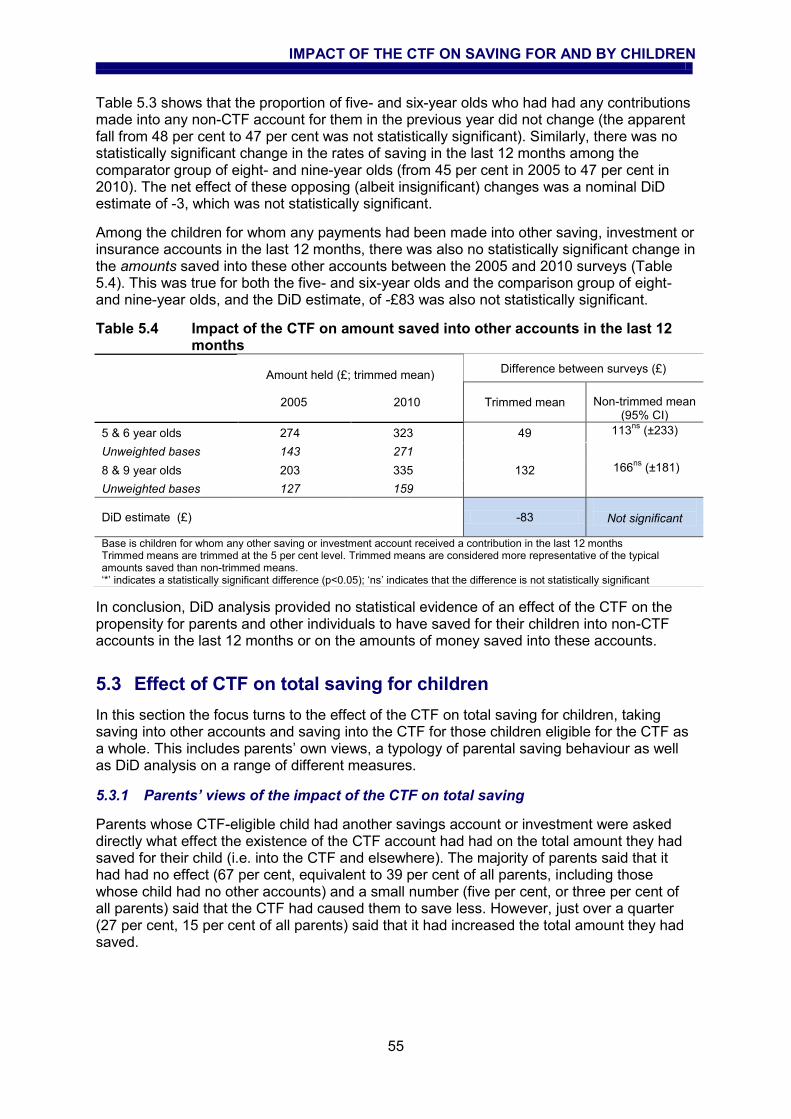
IMPACT OF THE CTF ON SAVING FOR AND BY CHILDREN
55
Table 5.3 shows that the proportion of five- and six-year olds who had had any contributions made into any non-CTF account for them in the previous year did not change (the apparent fall from 48 per cent to 47 per cent was not statistically significant). Similarly, there was no statistically significant change in the rates of saving in the last 12 months among the comparator group of eight- and nine-year olds (from 45 per cent in 2005 to 47 per cent in 2010). The net effect of these opposing (albeit insignificant) changes was a nominal DiD estimate of -3, which was not statistically significant.
Among the children for whom any payments had been made into other saving, investment or insurance accounts in the last 12 months, there was also no statistically significant change in the amounts saved into these other accounts between the 2005 and 2010 surveys (Table 5.4). This was true for both the five- and six-year olds and the comparison group of eight- and nine-year olds, and the DiD estimate, of -£83 was also not statistically significant.
Table 5.4 Impact of the CTF on amount saved into other accounts in the last 12 months
Amount held (£; trimmed mean) Difference between surveys (£)
2005 2010 Trimmed mean Non-trimmed mean
(95% CI)
5 & 6 year olds 274 323 49 113ns
(±233)
Unweighted bases 143 271
8 & 9 year olds 203 335 132 166ns
(±181)
Unweighted bases 127 159
DiD estimate (£) -83
Not significant
Base is children for whom any other saving or investment account received a contribution in the last 12 months Trimmed means are trimmed at the 5 per cent level. Trimmed means are considered more representative of the typical amounts saved than non-trimmed means. „*‟ indicates a statistically significant difference (p<0.05); „ns‟ indicates that the difference is not statistically significant
In conclusion, DiD analysis provided no statistical evidence of an effect of the CTF on the propensity for parents and other individuals to have saved for their children into non-CTF accounts in the last 12 months or on the amounts of money saved into these accounts.
5.3 Effect of CTF on total saving for children
In this section the focus turns to the effect of the CTF on total saving for children, taking saving into other accounts and saving into the CTF for those children eligible for the CTF as a whole. This includes parents‟ own views, a typology of parental saving behaviour as well as DiD analysis on a range of different measures.
5.3.1 Parents’ views of the impact of the CTF on total saving
Parents whose CTF-eligible child had another savings account or investment were asked directly what effect the existence of the CTF account had had on the total amount they had saved for their child (i.e. into the CTF and elsewhere). The majority of parents said that it had had no effect (67 per cent, equivalent to 39 per cent of all parents, including those whose child had no other accounts) and a small number (five per cent, or three per cent of all parents) said that the CTF had caused them to save less. However, just over a quarter (27 per cent, 15 per cent of all parents) said that it had increased the total amount they had saved.
CHILD TRUST FUND WAVE 2 EVALUATION
56
5.3.2 A typology of total saving of parents for CTF-eligible children
There was really very little overlap between saving by parents into the CTF and into other saving accounts or investments in the previous twelve months; if they saved at all, parents saved into one or the other. A half (50 per cent) of parents had not saved any money in the previous 12 months for their CTF-eligible child in either their CTF account or another savings or investment account. A little under two in ten (17 per cent) had only saved money in the CTF account; a quarter (26 per cent) had saved only into another savings account or investment, while a small number (seven per cent) had saved money both in the CTF account and elsewhere.
A statistical technique known as cluster analysis was undertaken to obtain a more comprehensive picture of parents‟ pattern of saving into the CTF accounts and elsewhere for their child. The analysis took into account parents‟ patterns of saving into the CTF during the lifetime of the account, whether or not the child had any other accounts and, where these were held, parents‟ patterns of saving into these. The technique allocated individuals to groups of people with similar patterns of saving behaviour which distinguished them from all others in the sample. This identified seven distinct patterns of behaviour.
For three of these groups, deposits into their child‟s CTF account were an important part of their saving behaviour. They represented more than a quarter of all parents of children with a CTF account:
Avid savers: parents who saved regularly in the Child Trust Fund and made either occasional or, in some cases, regular payments into another account as well (ten per cent of all parents)
Regular CTF savers: parents who saved regularly into the CTF but did not save elsewhere at all (11 per cent)
Ad hoc CTF savers: parents who saved occasionally into the CTF but did not save elsewhere at all (five per cent).
A further two groups primarily saved outside the CTF and accounted for almost four in ten of parents of a CTF-eligible child:
Regular other savers: parents who saved regularly into another savings account or investment but made only occasional or (much more commonly) no payments into the CTF at all (17 per cent)
Ad hoc other savers: parents who saved occasionally into another savings account or investment and made only occasional or (much more commonly) no payments into the CTF at all (21 per cent).
And two final groups of disengaged savers, who accounted for the remaining third of parents:
Passive account-holders: parents whose children had another savings account or investment as well as a CTF account but did not pay money into either (nine per cent)
Non-savers: parents whose children only had a CTF account, to which they had never contributed (27 per cent).
The characteristics of these seven groups were investigated in detail, and this showed that the three groups of regular savers (avid savers, regular CTF savers and regular other savers) were broadly similar and reflected the characteristics already discussed in chapters three and four. In other words, they tended to be better off and more engaged with saving

IMPACT OF THE CTF ON SAVING FOR AND BY CHILDREN
57
generally. This was in contrast with the two groups of disengaged savers who tended to be less well-off and not committed to saving generally. But the differences were not, on the whole, large.
In many ways the two groups that it is most interesting to compare are the regular CTF savers and the regular other savers. The first point to note is that only 38 per cent of the children of regular CTF savers had another savings account or investment. Other key differences between them were that regular CTF savers included:
More parents with a child aged under two (27 per cent, compared with 14 per cent of the regular other savers)
More parents with only one child (39 per cent, compared with 25 per cent)
More households with one earner (40 per cent, compared with 31 per cent) and correspondingly fewer with two earners (53 per cent, compared with 65 per cent)
Fewer parents whose child had an RAA (five per cent, compared with 16 per cent)
More who had opened a stakeholder account themselves (87 per cent, compared with 71 per cent) and fewer who had opened a cash CTF (six per cent, compared with 20 per cent)
More who agreed strongly that they would like to save more for their children but could not afford to do so (47 per cent, compared with 35 per cent) and fewer that strongly disagreed that saving for their children was a low priority at the moment (27 per cent, compared with 42 per cent).
There was, however, no real difference between these two groups in the extent to which they were deterred by the rules relating to access to CTF funds when the child reached 18 (a measure combining the effect of the age limit itself and the fact that the child would be able to decide how to use the money).
On the other hand, there were some very interesting differences in their reports of how the CTF had affected their overall level of saving. CTF regular savers whose child had another savings account or investment were very much more likely to say that the CTF had reduced the amounts they had saved outside the CTF (31 per cent, compared with four per cent of regular other savers). But the group as a whole was much more likely than the regular other savers to say that the CTF had increased the overall amount of money being saved for the child (63 per cent, compared with 21 per cent). In other words, the CTF regular savers were more likely to report saving more overall as a result of the CTF than they otherwise would have done, and this was focused on saving into the CTF despite other accounts being held for the child.
5.3.3 Impact on total saving in the last 12 months
The percentage of five- and six-year-old children who had been saved for in the last 12 months was significantly higher in 2010 (58 per cent) than 2005 (48 per cent; Table 5.5). Conversely, the percentage of eight- and nine-year old children who had been saved for did not change significantly (the apparent increase from 45 per cent to 47 per cent was not statistically significant).
The difference between these trends was a nominal DiD estimate of nine percentage points, which was not statistically significant (Table 5.5).
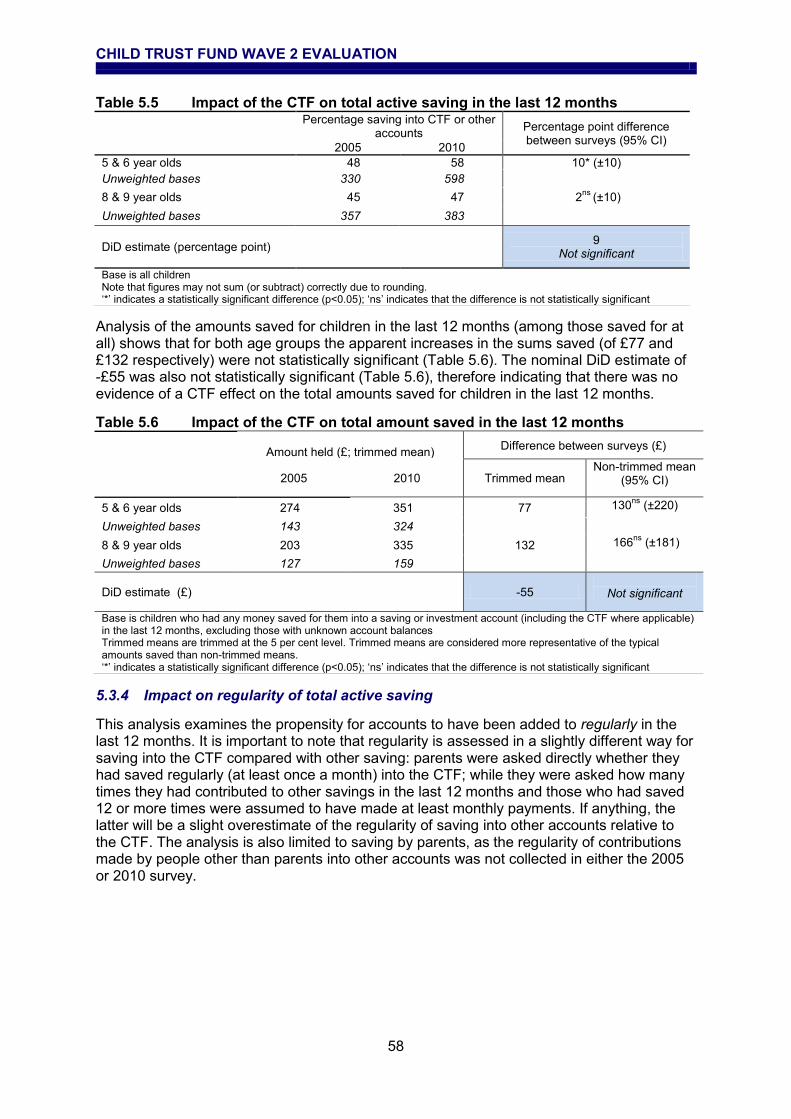
CHILD TRUST FUND WAVE 2 EVALUATION
58
Table 5.5 Impact of the CTF on total active saving in the last 12 months
Percentage saving into CTF or other
accounts Percentage point difference between surveys (95% CI)
2005 2010
5 & 6 year olds 48 58 10* (±10)
Unweighted bases 330 598
8 & 9 year olds 45 47 2ns
(±10)
Unweighted bases 357 383
DiD estimate (percentage point)
9
Not significant
Base is all children Note that figures may not sum (or subtract) correctly due to rounding. „*‟ indicates a statistically significant difference (p<0.05); „ns‟ indicates that the difference is not statistically significant
Analysis of the amounts saved for children in the last 12 months (among those saved for at all) shows that for both age groups the apparent increases in the sums saved (of £77 and £132 respectively) were not statistically significant (Table 5.6). The nominal DiD estimate of -£55 was also not statistically significant (Table 5.6), therefore indicating that there was no evidence of a CTF effect on the total amounts saved for children in the last 12 months.
Table 5.6 Impact of the CTF on total amount saved in the last 12 months
Amount held (£; trimmed mean) Difference between surveys (£)
2005 2010 Trimmed mean
Non-trimmed mean (95% CI)
5 & 6 year olds 274 351 77 130ns
(±220)
Unweighted bases 143 324
8 & 9 year olds 203 335 132 166ns
(±181)
Unweighted bases 127 159
DiD estimate (£) -55
Not significant
Base is children who had any money saved for them into a saving or investment account (including the CTF where applicable) in the last 12 months, excluding those with unknown account balances Trimmed means are trimmed at the 5 per cent level. Trimmed means are considered more representative of the typical amounts saved than non-trimmed means. „*‟ indicates a statistically significant difference (p<0.05); „ns‟ indicates that the difference is not statistically significant
5.3.4 Impact on regularity of total active saving
This analysis examines the propensity for accounts to have been added to regularly in the last 12 months. It is important to note that regularity is assessed in a slightly different way for saving into the CTF compared with other saving: parents were asked directly whether they had saved regularly (at least once a month) into the CTF; while they were asked how many times they had contributed to other savings in the last 12 months and those who had saved 12 or more times were assumed to have made at least monthly payments. If anything, the latter will be a slight overestimate of the regularity of saving into other accounts relative to the CTF. The analysis is also limited to saving by parents, as the regularity of contributions made by people other than parents into other accounts was not collected in either the 2005 or 2010 survey.

IMPACT OF THE CTF ON SAVING FOR AND BY CHILDREN
59
In 2010, some 35 per cent of five- and six-year olds had been saved for regularly by parents in the last 12 months compared with just 19 per cent of children of the same age prior to the introduction of the CTF in 2005 (Table 5.7). This was a statistically significant increase of 16 percentage points for this age group. To determine whether or not this increase would have happened in the absence of the CTF, the change observed among the comparator group of eight- and nine-year olds were considered. The nominal change of eight percentage points for this age group was not statistically significant. The nominal DiD estimate of eight percentage points was also not statistically significant.
Table 5.7 Impact of the CTF on regular saving by parents in the last 12 months
Percentage saving regularly into
CTF or other accounts Percentage point difference between surveys (95% CI)
2005 2010
5 & 6 year olds 19 35 16* (±8)
Unweighted bases 330 598
8 & 9 year olds 18 26 8ns
(±9)
Unweighted bases 357 383
DiD estimate (percentage point) 8
Not significant
Base is all children „*‟ indicates a statistically significant difference (p<0.05); „ns‟ indicates that the difference is not statistically significant
5.3.5 Impact on total amounts in savings and investments
For this analysis the total amounts held in saving across the CTF and other types of savings and investments were considered regardless of who made the contributions. Whereas section 5.2.2 considered the amounts held among those with any savings in other accounts, the introduction of the CTF meant of course that all children aged five and six in 2010 had an account with some money saved into it. For this analysis, therefore, it was necessary to set all children aged five and six and eight and nine as the base for 2005 and 2010, including those holding zero amounts.35
Table 5.8 shows that children aged five and six in 2010, namely those with CTF accounts, had by far the largest sums saved on average of all the groups in the analysis (£1,361). They had £830 more saved than their counterparts in 2005, and they had £596 more saved than the comparator group of eight- and nine-year olds in 2010 (these differences were statistically significant). The amounts held in savings for the older children were also higher in 2010 than in 2005, although this statistically significant difference of £371 was far less marked than for the younger children.
The resulting DiD estimate of the impact of the CTF on total amounts held for children at age five and six, of £459, was not statistically significant. As such, there was no reliable evidence of an effect of the CTF on the total amounts saved – including the value of the Government endowment – for children overall.
35
Excludes those with unknown amounts.

CHILD TRUST FUND WAVE 2 EVALUATION
60
Table 5.8 Impact of the CTF on total savings held
Amount held (£; trimmed mean) Difference between surveys (£)
2005 2010 Trimmed mean
Non-trimmed mean (95% CI)
5 & 6 year olds 531 1,361 830 1,682* (±1,383)
Unweighted bases 308 367
8 & 9 year olds 394 765 371 539* (±445)
Unweighted bases 322 340
DiD estimate (£) 459
Not significant
Base is all children, excluding those with unknown account balances Trimmed means are trimmed at the 5 per cent level. Trimmed means are considered more representative of the typical amounts saved than non-trimmed means. „*‟ indicates a statistically significant difference (p<0.05); „ns‟ indicates that the difference is not statistically significant
When the value of the initial Government endowment received by the child was taken into account,36 the mean value for five- and six-year olds in 2010 fell to £1,092, reflecting an increase since the baseline of £541 for this group that remained statistically significant (Table not shown). The DiD also remained positive at a nominal £190, but as in the previous analysis this was not statistically significant.
More detailed analysis of the changes in the total amounts saved for children (including the CTF Government endowment, where applicable; Table 5.9) shows that there were statistically significant increases among five- and six-year olds living in two-parent households across the income distribution in low- and high-income households and where the family home was not owned (whether on a mortgage or outright).37 Meanwhile, the only statistically significant increase among eight- and nine-year olds was for those who were living in a home that was owned.
Despite this, the DiD estimate was not statistically significant (Table 5.9) for most of the subgroups. There were two exceptions. First, with a DiD estimate of £559, the statistical evidence of an effect of the CTF among the children living in a low income household was inconclusive.38
Second, the DiD estimate of £618 among children living in a home that was not owned (whether outright or with a mortgage) was statistically significant. This provided clear statistical evidence of a (positive) CTF impact on the total amounts saved for children, specifically those living in non-owner occupier households. It is not possible to identify whether this increase is the result of increased rates of saving for children by parents and other contributors or a reflection of the Government endowment. However, as children in non-owner occupier households would have been more likely to have received the higher rate Government endowment of £500 rather than the standard £250 it is possible that this at least partly explains the increase.
36
The value of the endowment (as reported by the responding parent) was subtracted from the account balance given. Any „balances‟ of less than zero resulting from this deduction were set to zero as it is not realistic to expect any CTF account to have a value of less than zero. 37
Treat individual figures with caution, where samples sizes are small. Only a small set of socio-demographic breakdowns is considered due to sample sizes of less than 50 for some subgroups. 38
Additional testing at the 90 per cent level of confidence found that there was a statistically significant effect of the CTF on the amounts saved among children in a low income household at this lower level of confidence.

IMPACT OF THE CTF ON SAVING FOR AND BY CHILDREN
61
Table 5.9 Impact of the CTF on total savings held, by key characteristics
Amount held
(£, trimmed mean) Difference between surveys (£) DiD estimate
(£, trimmed mean) 2005 2010
Trimmed mean
Non-trimmed mean (95% CI)
Lone- or two-parent family
Lone-parent family
5 & 6 year olds 150 783 634 2,536ns
(±5,080) 326
Not significant Unweighted bases 80 62
8 & 9 year olds 115 424 308 523ns
(±578)
Unweighted bases 96 88
Two-parent family
5 & 6 year olds 685 1514 829 1,445* (±1,126) 454
Not significant Unweighted bases 228 305
8 & 9 year olds 529 904 375 525ns
(±563)
Unweighted bases 226 281
Household income
Low income (less than £1,700)
5 & 6 year olds 235 751 516 533* (±333) 559
Inconclusive Unweighted bases 118 81
8 & 9 year olds 172 129 -43 -101ns
(±380)
Unweighted bases 137 77
High income (£1,700 or more)
5 & 6 year olds 758 1732 975 2,231* (± 2,206)
646 Not significant
Unweighted bases 190 230
8 & 9 year olds 589 918 329 591ns
(±693)
Unweighted bases 185 192
Housing tenure of household
Owns home (including with mortgage)
5 & 6 year olds 808 1601 793 1,841ns
(±1,891) 305
Not significant Unweighted bases 212 276
8 & 9 year olds 622 1110 488 673* (±639)
Unweighted bases 205 237
Does not own home
5 & 6 year olds 43 716 673 944* (±649) 618
Significant Unweighted bases 96 86
8 & 9 year olds 82 137 55 73ns
(±201)
Unweighted bases 117 99 Base is all children, excluding those with unknown account balances
Trimmed means are trimmed at the 5 per cent level. Trimmed means are considered more representative of the typical amounts saved than non-trimmed means. Treat with caution any figure based on a sample of fewer than 100 cases „*‟ indicates a statistically significant difference(p<0.05); „ns‟ indicates that the difference is not statistically significant
Finally, the impact of the CTF on total saving of parents‟ own saving behaviour and their attitudes towards saving for their children was considered (Table 5.10). There were some large and statistically significant increases in the average amounts saved for children for the individual age groups (particularly for the five- and six-year olds). For example, the average amounts saved among five- and six-year olds‟ whose parents had savings of their own were some £874 higher in 2010 than in 2005. Despite this none of the DiD estimates shown in Table 5.10 were statistically significant.
However, as with all previous non-significant and inconclusive results from the DiD analysis, this does not necessarily mean that the CTF was ineffective at increasing the levels of saving for children. It means that if there was an effect in either direction it was not sufficiently large to have been detected reliably in this sample.

CHILD TRUST FUND WAVE 2 EVALUATION
62
Table 5.10 Impact of the CTF on total savings held, by parent saving attitudes and behaviour
Amount held
(£, trimmed mean)
Difference between surveys (£) DiD estimate (£, trimmed
mean) Trimmed
mean Non-trimmed
mean (95% CI) 2005 2010
Parent agrees that "I think it's more important to buy my child(ren) the things they want than to save for them"
Yes
5 & 6 year olds 176 923 748 1.049* (±722) 342
Not significant Unweighted bases 67 90
8 & 9 year olds 138 543 406 857ns
(±932)
Unweighted bases 89 85
No
5 & 6 year olds 668 1,510 842 1,911* (±1,777) 503
Not significant Unweighted bases 241 277
8 & 9 year olds 504 843 339 420ns
(±438)
Unweighted bases 333 285
Parents have own savings
Yes
5 & 6 year olds 693 1,567 874 1,866* (±1,706)
474 Not significant
Unweighted bases 240 311
8 & 9 year olds 511 910 399 593* (±526)
Unweighted bases 259 285
No
5 & 6 year olds 71 517 446 558* (±403) 296
Not significant Unweighted bases 68 56
8 & 9 year olds 12 161 149 257* (±253)
Unweighted bases 61 55
Base is all children, excluding those with unknown account balances Trimmed means are trimmed at the 5 per cent level. Trimmed means are considered more representative of the typical amounts saved than non-trimmed means. Treat with caution any figure based on a sample of fewer than 100 cases „*‟ indicates a statistically significant difference (p<0.05); „ns‟ indicates that the difference is not statistically significant
5.3.6 Switching of savings from other accounts to the CTF
There is little evidence that the money saved into the CTF had come directly from money saved elsewhere. Few parents had withdrawn money from another savings account in order to pay it into their child‟s CTF account. Just three per cent had withdrawn money from their own savings account and one per cent from another account in the child‟s name. However, as noted in section 5.2, a small proportion of parents of CTF-eligible children (seven per cent) said that having a CTF had reduced other saving for the child and statistical evidence of the impact of the CTF on the likelihood that children had other types of accounts was inconclusive.
5.4 Effect of the CTF on saving by children
On the whole, the CTF had not had any real impact on patterns of saving by children themselves. But, with the oldest children being only seven, they were probably too young for this to have happened.

IMPACT OF THE CTF ON SAVING FOR AND BY CHILDREN
63
5.4.1 Discussing ‘looking after money’ with children
Parents of children aged four or older were asked if they ever talked to their children about „looking after their money’. The majority of those with a CTF-eligible child (72 per cent) said that they did, rising from 58 per cent of parents with a four-year-old child, to 85 per cent of children aged seven. It then remained at this level among older children aged between seven and nine who were not eligible for a CTF account. In fact, the age of the child had a much greater effect on parents‟ propensity to talk to their children about looking after their money than any other factor including their attitudes to saving for children.
5.4.2 Discussing the CTF with children
In contrast very few parents (eight per cent) with a CTF-eligible child aged four or more had talked to the child about their CTF account. This did, however, increase with the age of the child, from just two per cent of parents with a four-year-old child to 19 per cent of parents with a child aged seven.
5.4.3 Level of saving by children
Parents of CTF-eligible children of all ages were asked if their child had saved any money at home, for example in a money box, over the past 12 months. Seven in ten (69 per cent) said that they had, increasing from just under half of babies aged under one (47 per cent)39 to eight in ten (82 per cent) of children aged seven. Indeed, the parents interviewed in depth said that encouraging children to save into money boxes was an important part of teaching them about savings and money management generally.
The average (mean) amount these children had saved was £40. The largest amounts had been „saved‟ by babies and toddlers (£100 by under ones; £80 by one-year-old children and £47 by two-year olds), suggesting that parents of very young children save in this way for them. It is only from around the age of three that this question appears to capture saving by children themselves and children of this age had saved £23 in the previous year. The sum rose only slightly to £34 among the seven-year-old children who were eligible for a CTF account.
Where the child was aged four or over, parents were asked what the child was saving the money for. The two most common reasons, by far, were „nothing specific‟ (38 per cent of those with any money saved) and toys (33 per cent). Other relatively common reasons were holiday spending money (14 per cent), to put into a savings account (11 per cent) and sweets and treats (10 per cent). There was remarkably little difference in the reasons given for children of different ages.
Fewer than one per cent of CTF-eligible children had, in fact, paid money into a savings account in the past 12 months and all of these were aged four or more. The propensity to save in this way did not increase with age either for the CTF-eligible children or those aged between seven and nine in the comparison group of non-eligible children.
5.4.4 Encouraging children to save into the CTF
The survey also asked parents whether children had themselves put any money into their CTF account. In fact only one child sampled, a seven-year-old child, had done so.
The depth interviews with parents showed that the CTF was seen as an investment that parents make for the child. It was considered too long term and intangible for young children aged seven or under. This is consistent with the ways that parents said they intend the money in the CTF account to be used (reported in section 5.5).
39
This indicates that a significant proportion of parents were reporting their own saving behaviour on behalf of their child as saving „by‟ the child.
CHILD TRUST FUND WAVE 2 EVALUATION
64
5.5 How parents intend CTF savings to be used
Most parents (64 per cent) said they intended to encourage their child to spend the money saved in their CTF account on higher or further education. Other relatively commonly cited uses for the money included to buy a car or motorbike (34 per cent). The intended uses, in order of frequency of mentions were:
For higher or further education (64 per cent)
To buy a car or motorbike (34 per cent)
To put towards the cost of setting up home or buying a home (23 per cent)
To retain the money in savings (19 per cent)
For the child‟s future generally (12 per cent)
To pay for driving lessons (12 per cent)
For the child to spend how they like (11 per cent).
These proportions did not vary widely with the level of household circumstances. The most notable difference was that parents with net monthly incomes of between £570 and £1,129 were slightly less inclined than others to encourage their children to spend the money on education (55 per cent) or help them to set up home (11 per cent), but more inclined to want their child to carry on saving the money (24 per cent) or to say that they would leave their child to decide how to spend it (18 per cent).
Interestingly, there was no correlation between whether or not parents had paid any money into the CTF account themselves and how they would encourage the child to use the money in the account when they reached 18.
5.5.1 How this compares with intentions for other savings or investments
Although the same list of purposes was mentioned for how children would be encouraged to use money saved in other savings accounts or investments, there were some important differences in the relative emphasis parents gave to them compared with money saved or invested in CTF accounts (Table 5.11). In particular, twice as many parents wanted the money in CTF accounts to be spent on education, on buying a car or motorbike or on setting up home as said that they wanted money saved or invested elsewhere to be used in these ways. Conversely, they were much more inclined to say that money saved elsewhere was intended for the child‟s future generally and twice as likely to say that other money could be spent as the child wished.
Taken together, this indicates that parents saw money in a CTF account being used rather differently from other money that was being saved or invested for the child. In particular, they more often envisaged it being used for the major areas of expenditure where parents often help their children out financially. This might help explain why almost none of the children had been encouraged to save in the CTF themselves (see section 5.4.4).

IMPACT OF THE CTF ON SAVING FOR AND BY CHILDREN
65
Table 5.11 How parents intend money saved in the CTF and elsewhere to be used Percentages
CTF Other savings Other investments
Education 64 31 29
Buy car or motorbike 34 18 15
Set up home 23 13 10
Carry on saving or investing 19 2 15
Future generally 12 63 29
Driving lessons 12 6 2
Child to decide 11 19 18
Unweighted base 2,027 913 312 Base is CTF-eligible children (with specified type of account) More than one response was allowed
5.6 Effect of CTF on saving for other (non-eligible) children
As already noted (see section 3.2.10), depth interviews with parents emphasised the importance that some parents placed on treating their children equally and the effect this had on discouraging saving into the CTF for some parents who felt they could not afford to also save for their older, non-eligible children.
Parents with other children as well as the one who was covered by the survey were asked how important they felt it was that all of their children should have the same amount of money saved for them at similar stages of their lives. These parents overwhelmingly felt that it was important that all of their children have the same amount of money saved for them at similar stages (88 per cent). Indeed six in ten of them (62 per cent) believed it was very important.
This meant that among parents with older children who were not eligible for a CTF account – who comprised 52 per cent of the parents with a CTF-eligible child – nearly four in ten had opened accounts for them that were similar to the CTF (38 per cent). In a similar number of cases (36 per cent) the non-eligible child already had a savings account, which parents felt removed the necessity to open one. That left just a quarter (26 per cent) of older siblings with no saving account.
Moreover 37 per cent of parents with a non-eligible child had paid the same amount of money into their account as their younger child had received from the Government to put into their CTF. And two thirds (66 per cent) of parents who had paid money into the CTF account in the past 12 months had also paid a similar amount into their non-eligible child‟s account as well. This is equivalent to 11 per cent of all parents of CTF-eligible children with a non-eligible child. It is somewhat lower than the 88 per cent of parents in 2005, in the survey at the inception of the CTF, who said they intended to save similar amounts for the CTF-ineligible children.
The most common reason for not doing so was that they could not afford it; other fairly common reasons included that the child already had money in savings, that they had given money to the child to spend instead or that they had not got round to it.
5.7 Overview of the effect of the Child Trust Fund
Taking the evidence examined in this report as a whole, the evaluation indicates that there were increases in levels of active saving for CTF-eligible children and in the amounts saved for both CTF-eligible and non-eligible children since the introduction of the CTF. For the most part, however, there was insufficient evidence to attribute any of the increases in levels of saving for CTF-eligible children to the CTF, except where effects reported by the parents themselves were considered. Additionally, it had had no observable effect on saving by

CHILD TRUST FUND WAVE 2 EVALUATION
66
children themselves by age seven. In contrast, the CTF did appear to have increased the amounts saved for some older siblings of CTF-eligible children.
As discussed in previous chapters, the typical amounts saved in CTF accounts comprised an appreciable proportion of the overall stock of savings saved among CTF-eligible children. There was also little evidence that money deposited into the CTF had come directly from parents‟ own or their child‟s other savings.
This chapter has shown that where parents were saving regularly for their children – and just under two in five of them were – deposits into the CTF formed a large part of their overall saving behaviour. A minority of parents were saving only into the CTF account, including a core group of about one in ten parents who were saving regularly into the CTF and were not saving at all for their child elsewhere. When parents of CTF-eligible children with other accounts were asked directly about the effect they felt the CTF had had on their total saving for their CTF-eligible child, two-thirds said it had had no effect. However, among those who reported that there had been an effect, many more parents said that it had increased the amount they had saved on behalf of their child than said that it had caused them to save less.
Although the majority of parents of CTF-eligible children aged four or older reported talking to their children about looking after their money, it was very unusual for them to report having talked to their child about their CTF account. Equally, it was far more likely that children were saving money in a money box at home than saving into any account, and saving into their CTF was very rare indeed. However, given that the oldest CTF-eligible children were only aged seven at the time of this evaluation, it was perhaps too early to observe any effects on this.
Following the introduction of the CTF, there were statistically significant increases in the likelihood that CTF-eligible children at age five and six had been saved for at all in the previous 12 months and that they had been saved for regularly by their parents. There was also an increase in the average amount that children overall had in savings at age five and six. Moreover, there were statistically significant increases in the total amounts saved for CTF-eligible children from a range of socio-demographic backgrounds and across the income distribution.
However, impact analysis designed to formally evaluate and quantify the effect of the CTF on saving for children did not, in most cases, provide statistical evidence in support of a CTF impact on children‟s savings despite the Government contribution. In other words, the observed increases in levels of saving since the introduction of the CTF could not be attributed to the CTF. This was the case in relation to the likelihood that children had been saved for actively and the average total amounts they held in savings.
This does not necessarily mean that the CTF had not impacted on levels of saving for children, but that if such an effect did exist (in either direction) it was not sufficiently large to be detected reliably. The ability of impact analysis to detect policy effects reliably is influenced by the samples sizes available for the analysis. It can also be influenced by the design of the study, which in this case could not control for any potential effects of the CTF on levels of saving for the comparator group of non-eligible children.
The impact analysis did provide clear evidence, however, of a statistically significant increase in the average total amount held in savings among children living in homes not owned by their household and that the increase was over and above any increase that would have occurred in the absence of the CTF. The (positive) impact of the CTF on this group was an estimated £618 at age five and six. This finding may partly reflect that children in these households would have been more likely to have received the higher rate Government endowment of £500 rather than the standard £250. Statistical evidence of a CTF impact on the total amounts saved for children in low-income households was inconclusive.

IMPACT OF THE CTF ON SAVING FOR AND BY CHILDREN
67
There was also some evidence that the CTF may have influenced the level of saving for older, non-eligible siblings. The CTF appears to have stimulated some parents to open a similar account for older siblings that were not eligible for a CTF account. Moreover, a minority of parents said that they had paid a similar amount to the government CTF contribution into an account for older siblings or, if they made regular contributions to the CTF account, that they had also made a regular contribution to the accounts held by their older children.