the city blueprint: experiences with the implementation · pdf filethe city blueprint:...
TRANSCRIPT
769 © IWA Publishing 2013 Water Science & Technology: Water Supply | 13.3 | 2013
The city blueprint: experiences with the implementation
of 24 indicators to assess the sustainability of the urban
water cycle
Cornelis J. van Leeuwen and Philipo C. Chandy
ABSTRACT
A set of indicators, i.e. the city blueprint, has been developed to assess the sustainability of the water
cycle (SWC). The city blueprint comprises a set of 24 dedicated indicators divided over eight
categories, i.e. water security, water quality, drinking water, sanitation, infrastructure, climate
robustness, biodiversity and attractiveness and governance including public participation. The city
blueprint can be used as a first step or quick-scan to benchmark the SWC in cities and may help: (1)
to communicate a city’s SWC performance and exchange experiences, (2) to select appropriate
water supply and sanitation strategies, (3) to develop technological and non-technological options as
future alternatives for the water cycle, where several possible changes in the use of technology,
space and socio-economic scenarios can be introduced. This should finally lead to: (4) a selection of
measures, including an evaluation of their costs and benefits under different development scenarios,
and how to integrate these in long-term planning on urban investments. So far, a city blueprint has
been made for the city of Rotterdam. This study reports on three other cities, i.e. two Dutch cities
(Maastricht and Venlo) and one city in a developing country (Dar es Salaam in Tanzania). Experiences
so far and further plans will be discussed.
doi: 10.2166/ws.2013.062
Cornelis J. van Leeuwen (corresponding author)KWR Watercycle Research Institute,P.O. Box 1072,3430 BB Nieuwegein,The NetherlandsE-mail: [email protected]
Philipo C. ChandyMinistry of Water,P.O. Box 9153,Dar es Salaam,Tanzania
Key words | cities of the future, Dar es Salaam, indicators, Rotterdam, water scarcity
INTRODUCTION
According to the United Nations Environment Programme
(UNEP ), climate change, population growth and
increased consumption, coupled with urbanization, are all
placing increased pressure on water management. Compet-
ing demands for scarce water resources may lead to an
estimated 40% supply shortage by 2030 (2030 Water
Resources Group ). There are currently over 300
cities in the world exceeding 1 million inhabitants and 21
mega cities – a metropolitan area with a total population
in excess of 10 million people. According to the United
Nations (), 50% of the human population lives in
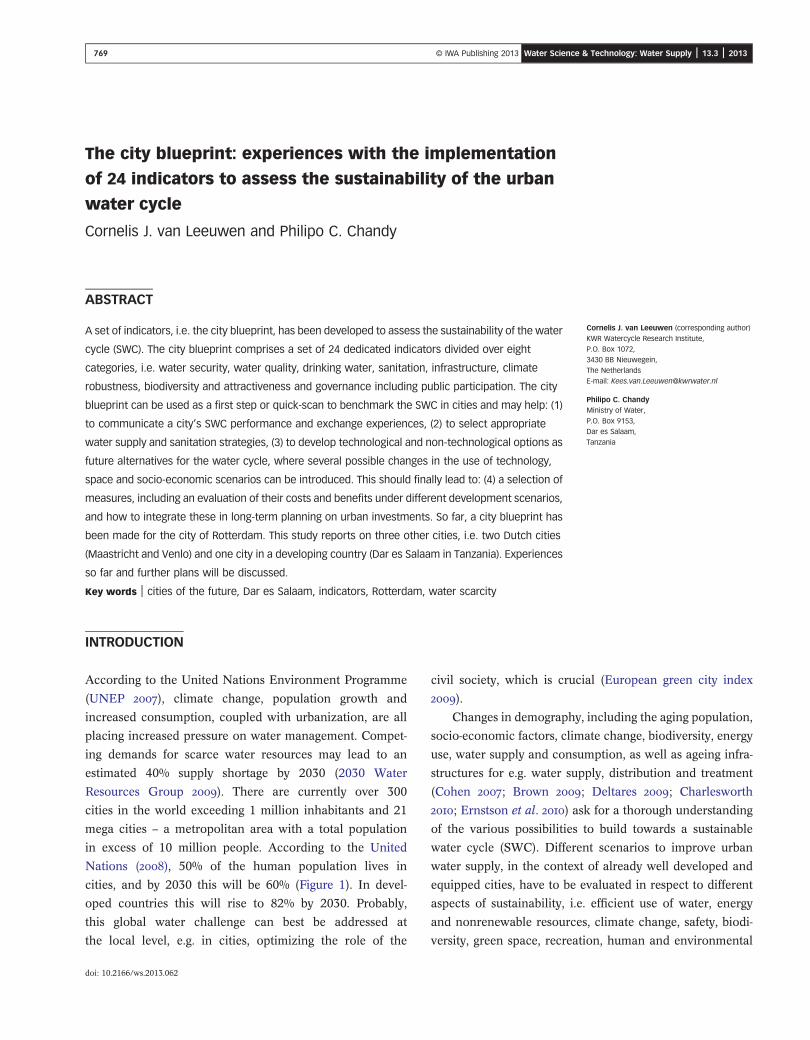
cities, and by 2030 this will be 60% (Figure 1). In devel-
oped countries this will rise to 82% by 2030. Probably,
this global water challenge can best be addressed at
the local level, e.g. in cities, optimizing the role of the
civil society, which is crucial (European green city index
).
Changes in demography, including the aging population,
socio-economic factors, climate change, biodiversity, energy
use, water supply and consumption, as well as ageing infra-
structures for e.g. water supply, distribution and treatment
(Cohen ; Brown ; Deltares ; Charlesworth
; Ernstson et al. ) ask for a thorough understanding
of the various possibilities to build towards a sustainable
water cycle (SWC). Different scenarios to improve urban
water supply, in the context of already well developed and
equipped cities, have to be evaluated in respect to different
aspects of sustainability, i.e. efficient use of water, energy
and nonrenewable resources, climate change, safety, biodi-
versity, green space, recreation, human and environmental
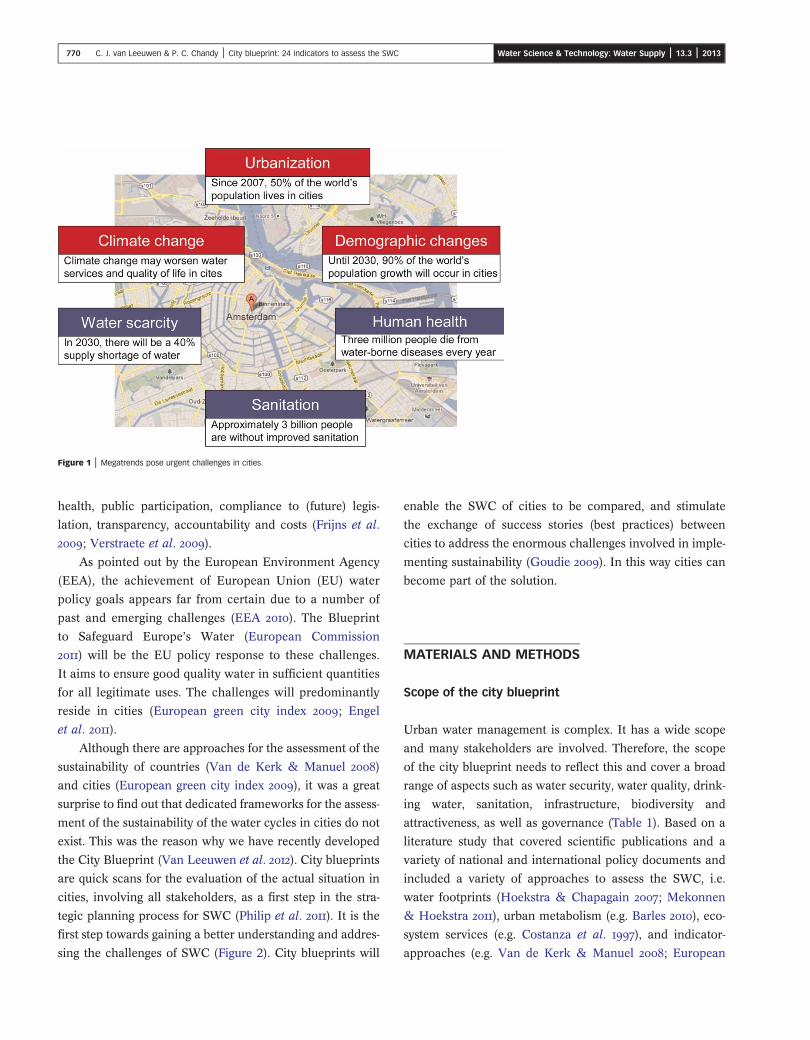
Figure 1 | Megatrends pose urgent challenges in cities.
770 C. J. van Leeuwen & P. C. Chandy | City blueprint: 24 indicators to assess the SWC Water Science & Technology: Water Supply | 13.3 | 2013
health, public participation, compliance to (future) legis-
lation, transparency, accountability and costs (Frijns et al.
; Verstraete et al. ).
As pointed out by the European Environment Agency
(EEA), the achievement of European Union (EU) water
policy goals appears far from certain due to a number of
past and emerging challenges (EEA ). The Blueprint
to Safeguard Europe’s Water (European Commission
) will be the EU policy response to these challenges.
It aims to ensure good quality water in sufficient quantities
for all legitimate uses. The challenges will predominantly
reside in cities (European green city index ; Engel
et al. ).
Although there are approaches for the assessment of the
sustainability of countries (Van de Kerk & Manuel )
and cities (European green city index ), it was a great
surprise to find out that dedicated frameworks for the assess-
ment of the sustainability of the water cycles in cities do not
exist. This was the reason why we have recently developed
the City Blueprint (Van Leeuwen et al. ). City blueprints
are quick scans for the evaluation of the actual situation in
cities, involving all stakeholders, as a first step in the stra-
tegic planning process for SWC (Philip et al. ). It is the
first step towards gaining a better understanding and addres-
sing the challenges of SWC (Figure 2). City blueprints will
enable the SWC of cities to be compared, and stimulate
the exchange of success stories (best practices) between
cities to address the enormous challenges involved in imple-
menting sustainability (Goudie ). In this way cities can
become part of the solution.
MATERIALS AND METHODS
Scope of the city blueprint
Urban water management is complex. It has a wide scope
and many stakeholders are involved. Therefore, the scope
of the city blueprint needs to reflect this and cover a broad
range of aspects such as water security, water quality, drink-
ing water, sanitation, infrastructure, biodiversity and
attractiveness, as well as governance (Table 1). Based on a
literature study that covered scientific publications and a
variety of national and international policy documents and
included a variety of approaches to assess the SWC, i.e.
water footprints (Hoekstra & Chapagain ; Mekonnen
& Hoekstra ), urban metabolism (e.g. Barles ), eco-
system services (e.g. Costanza et al. ), and indicator-
approaches (e.g. Van de Kerk & Manuel ; European
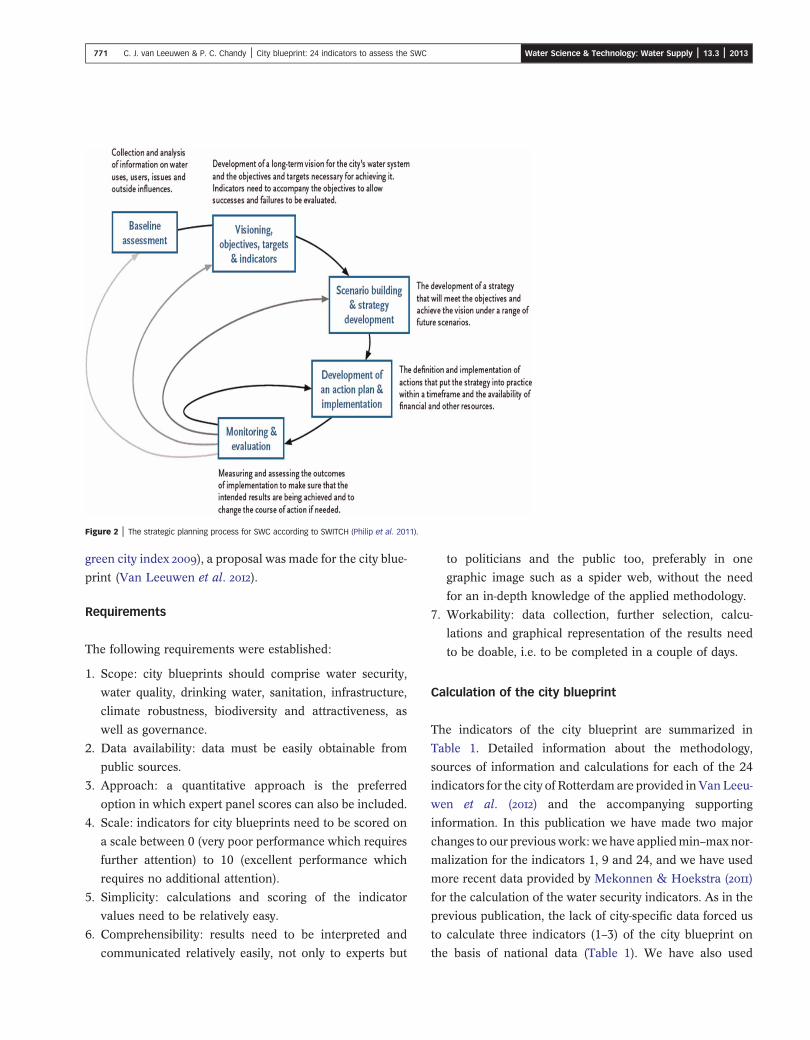
Figure 2 | The strategic planning process for SWC according to SWITCH (Philip et al. 2011).
771 C. J. van Leeuwen & P. C. Chandy | City blueprint: 24 indicators to assess the SWC Water Science & Technology: Water Supply | 13.3 | 2013
green city index ), a proposal was made for the city blue-
print (Van Leeuwen et al. ).
Requirements
The following requirements were established:
1. Scope: city blueprints should comprise water security,
water quality, drinking water, sanitation, infrastructure,
climate robustness, biodiversity and attractiveness, as
well as governance.
2. Data availability: data must be easily obtainable from
public sources.
3. Approach: a quantitative approach is the preferred
option in which expert panel scores can also be included.
4. Scale: indicators for city blueprints need to be scored on
a scale between 0 (very poor performance which requires
further attention) to 10 (excellent performance which
requires no additional attention).
5. Simplicity: calculations and scoring of the indicator
values need to be relatively easy.
6. Comprehensibility: results need to be interpreted and
communicated relatively easily, not only to experts but
to politicians and the public too, preferably in one
graphic image such as a spider web, without the need
for an in-depth knowledge of the applied methodology.
7. Workability: data collection, further selection, calcu-
lations and graphical representation of the results need
to be doable, i.e. to be completed in a couple of days.
Calculation of the city blueprint
The indicators of the city blueprint are summarized in
Table 1. Detailed information about the methodology,
sources of information and calculations for each of the 24
indicators for the city of Rotterdam are provided inVanLeeu-
wen et al. () and the accompanying supporting
information. In this publication we have made two major
changes to our previous work: wehave appliedmin–max nor-
malization for the indicators 1, 9 and 24, and we have used
more recent data provided by Mekonnen & Hoekstra ()
for the calculation of the water security indicators. As in the
previous publication, the lack of city-specific data forced us
to calculate three indicators (1–3) of the city blueprint on
the basis of national data (Table 1). We have also used
Table 1 | Indicators of the city blueprinta
Indicator Description
Water security
1. Total water footprint (N) Total volume of freshwater that is used to produce the goods and services consumed by thecommunity (Hoekstra & Chapagain ; Hoekstra et al. ; Mekonnen & Hoekstra )
2. Water scarcity (N) Ratio of total water footprint to total renewable water resources (Hoekstra & Chapagain ;Hoekstra et al. ; Mekonnen & Hoekstra )
3. Water self-sufficiency (N) Ratio of the internal to the total water footprint. Self-sufficiency is 100% if all the water needed isavailable and taken from within own territory (Hoekstra & Chapagain ; Hoekstra et al.; Mekonnen & Hoekstra )
Water quality
4. Surface water quality Assessment of the water quality preferably based on international standards for e.g. microbialrisks, nutrients, BOD and organic/inorganic micro-contaminants (European Commission )
5. Groundwater quality Assessment of quality preferably based on international standards for e.g. microbial risks,nutrients, BOD and organic/inorganic micro-contaminants (European Commission )
Drinking water
6. Sufficient to drink Percentage of city population, with potable water supply service (UN ; Global city indicatorsfacility ; Sustainable Society Foundation )
7. Water system leakages Percentage of water lost in the distribution system (European green city index )
8. Water efficiency Assessment of the comprehensiveness of measures to improve the efficiency of water usage(Jenerette & Larsen )
9. Consumption Domestic water consumption per capita (liters/day) (Global city indicators facility )
10. Quality Percentage of drinking water meeting the WHO water quality guidelines or the EU DrinkingWater Directive (European Commission ; Global city indicators facility ; SustainableSociety Foundation ; EBC )
Sanitation
11. Safe sanitation Percentage of city population served by wastewater collection and treatment (UN ; Globalcity indicators facility ; European green city index ; Sustainable Society Foundation)
12. Sewage sludge quality Percentage of sewage sludge that can be safely used in agriculture based on organic/inorganicmicro-contaminants (Vinjé et al. ; De Graaf et al. a, b; Fewtrell & Kay )
13. Energy efficiency Assessment of the comprehensiveness of measures to improve the efficiency of wastewatertreatment (UN ; European green city index )
14. Energy recovery Percentage of wastewater treated with techniques to generate and recover energy (Daigger ;Frijns et al. ; Verstraete et al. )
15. Nutrient recovery Percentage of wastewater treated with techniques to recover nutrients, especially phosphate(Cohen ; Frijns et al. ; Verstraete et al. ; Daigger )
Infrastructure
16. Maintenance Percentage of infrastructure for wastewater collection, distribution and treatment younger than 40years (RIONED )
17. Separation of wastewater andstormwater
Percentage of separation of the infrastructures for wastewater and stormwater collection (Tredouxet al. ; UN ; Sustainable Society Foundation ; EBC )
Climate robustness
18. Local authority commitments onclimate change
Assessment of how ambitious and comprehensive strategies and actual commitments are onclimate change (Global city indicators facility ; European green city index ; AustralianConservation Foundation ; Forum for the future )
(continued)
772 C. J. van Leeuwen & P. C. Chandy | City blueprint: 24 indicators to assess the SWC Water Science & Technology: Water Supply | 13.3 | 2013

Table 1 | continued
Indicator Description
19. Climate change adaptationmeasures
Assessment of measures taken to protect citizens against flooding and water scarcity, includingsustainable drainage (Deltares ; Nederlof et al. )
20. Climate-robust buildings Assessment of energy efficiency for heating and cooling, including geothermal energy(Charlesworth )
Biodiversity and attractiveness
21. Biodiversity Biodiversity of aquatic ecosystems according to the WFD (European Commission )
22. Attractiveness Water supporting the quality of the urban landscape as measured by community sentiment withinthe city (Costanza et al. ; European green city index )
Governance
23. Management and action plans Measure of local and regional commitments to adaptive, multifunctional, infrastructure anddesign for SWC as demonstrated by the ambition of the action plans and actual commitments(Fleming ; Brown & Farrelly ; European green city index )
24. Public participation (N) Proportion of individuals who volunteer for a group or organization as a measure of localcommunity strength and the willingness of residents to engage in activities for which they arenot remunerated. Public participation is an indicator of stakeholder equity in the planningprocess (EFILWC ; Brown ; Brown & Farrelly ; European green city index )
aAll indicators are at the level of the city, except for indicators 1–3 and 24 which are based on national (N) data.
Figure 3 | The relation between internet use and the voluntary participation based on
data provided by EFILWC (2006).
773 C. J. van Leeuwen & P. C. Chandy | City blueprint: 24 indicators to assess the SWC Water Science & Technology: Water Supply | 13.3 | 2013
national data for the calculation of indicator 24, i.e. public
participation based on the data provided by the European
Foundation for the Improvement of Living and Working
Conditions (EFILWC ). All other calculations are
identical to the methodology used for the city blueprint
calculations of Rotterdam (Van Leeuwen et al. ).
In a few cases the requirements of scale and comprehen-
sibility necessitated the transformation of the original data.
For instance, the total water footprint of the Netherlands
is 1,466 m3/yr/cap and slightly above the world average of
1,385 m3/yr/cap (Mekonnen & Hoekstra ). This value
was transformed using min–max normalization using data
from the Democratic Republic of Congo (552 m3/yr/cap)
as minimum and Niger (3,519 m3/yr/cap) as maximum
values, respectively. These data are provided in Appendix
VII of Mekonnen & Hoekstra (). The value for the Neth-
erlands thus becomes (1466–552)/3519–552)¼ 0.30805. In
order to transform this into a ‘concern score’ on a scale of
0–10, we arrive at a score of (1–0.30805) × 10¼ 6.92 for
the Netherlands. In other words, the total water footprint
in the Netherlands is about average and this is reflected in
a score of 6.9.
Information on voluntary participation in Tanzania
is not well documented, but does exist at low levels of
the community, e.g. village water committees, water users
associations in the catchment and community owned
water supply organizations (COWSO), which is also the
case for Dar es Salaam. The index of voluntary participation
(by country) was not available for Tanzania as only infor-
mation was provided on European countries (EFILWC
). Therefore only a rough estimate for Tanzania could
be provided. This estimate was obtained from the relation
between the internet use in 2003 (%) and the index of volun-
tary participation in 2004 as provided in the report of
EFILWC (). Based on this information (Figure 3), inter-
net use by country (URL1) and the fact that approximately a
doubling of internet use took place in the last 8 years, the
774 C. J. van Leeuwen & P. C. Chandy | City blueprint: 24 indicators to assess the SWC Water Science & Technology: Water Supply | 13.3 | 2013
internet connectivity for Tanzania in 2003 was estimated to
be approximately 5%, leading to an estimated score for
voluntary participation of 0.3 (on a scale from 0–10), using
min–max normalization with 0 as minimum and 3.0 (the
EFILWC score for Sweden) as maximum.
The process
Integration is most successful when there is a process of
interaction rather than a one-way delivery of knowledge
on the doorstep of the policy maker (Ison et al. ).
Rather than collecting information ourselves, as in the
case of the cities of Rotterdam and Dar es Salaam, the stake-
holders (representatives of municipalities, water utilities,
wastewater utilities and water boards) were asked to com-
plete a questionnaire in an interactive manner. This
interactive multi-stakeholder approach to problem formu-
lation (Van Leeuwen ), assessment and evaluation of
SWC as applied for the cities of Venlo and Maastricht was
much more effective, as it underlined the connectivity
between the technical, economic and sociopolitical pro-
cesses (Ison et al. ; Godden et al. ).
RESULTS
Cities in the Netherlands
Based on the publication of the city blueprint for Rotterdam
(Van Leeuwen et al. ), KWR Watercycle Research Insti-
tute was asked to provide city blueprints for another two
cities. These Dutch cities, Maastricht and Venlo, are situated
along the river Meuse in the province of Limburg. A differ-
ent approach was taken however. Rather than collecting
information ourselves, as in the case of the city of Rotterdam
(Van Leeuwen et al. ), the stakeholders (representatives
of municipalities, water utilities, wastewater utilities and
water boards) were asked to complete a questionnaire in
an interactive manner. The assessment and evaluation of
Maastricht and Venlo were done in an interactive and inter-
disciplinary manner taking a bottom-up approach (Van Pelt
& Swart ) in accordance with the principles and man-
agement strategies of the implementation challenge
approach as applied in the former Dutch Ministry of
Housing, Spatial Planning and the Environment (VROM
). Not surprisingly, the results of the scoring were
quite similar to those of Rotterdam, as all three cities are
in the same country, situated on the same downstream
water bodies (Klauer et al. ), with many similarities for
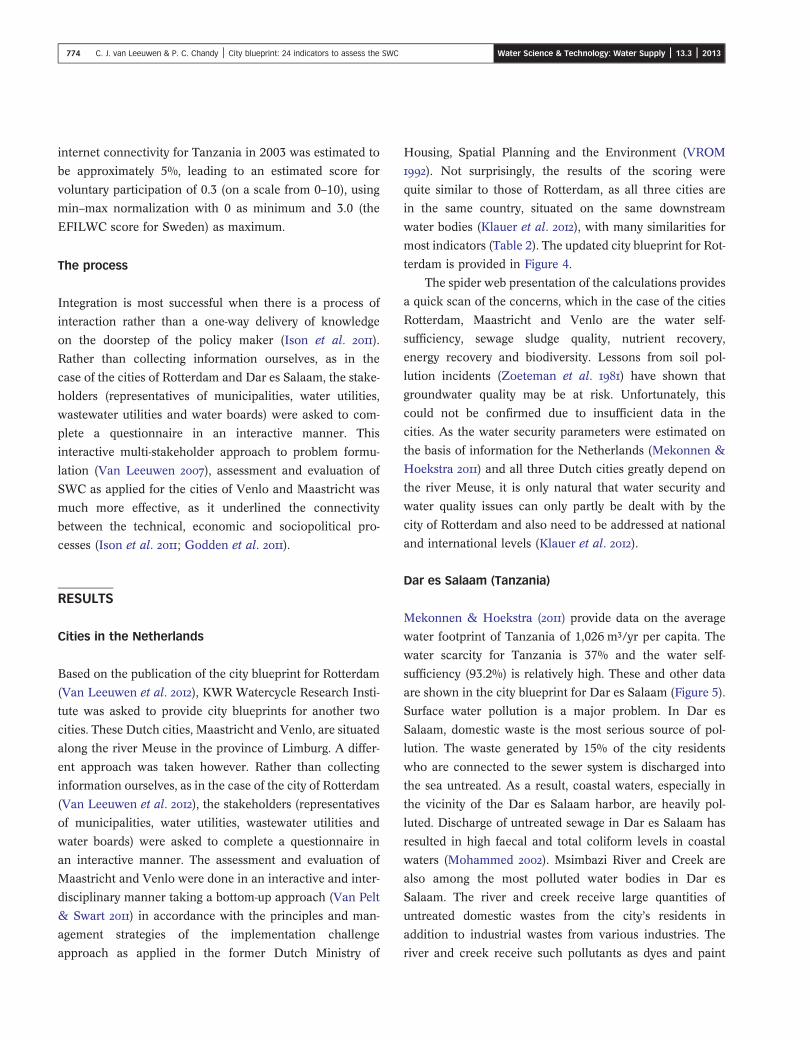
most indicators (Table 2). The updated city blueprint for Rot-
terdam is provided in Figure 4.
The spider web presentation of the calculations provides
a quick scan of the concerns, which in the case of the cities
Rotterdam, Maastricht and Venlo are the water self-
sufficiency, sewage sludge quality, nutrient recovery,
energy recovery and biodiversity. Lessons from soil pol-
lution incidents (Zoeteman et al. ) have shown that
groundwater quality may be at risk. Unfortunately, this
could not be confirmed due to insufficient data in the
cities. As the water security parameters were estimated on
the basis of information for the Netherlands (Mekonnen &
Hoekstra ) and all three Dutch cities greatly depend on
the river Meuse, it is only natural that water security and
water quality issues can only partly be dealt with by the
city of Rotterdam and also need to be addressed at national
and international levels (Klauer et al. ).
Dar es Salaam (Tanzania)
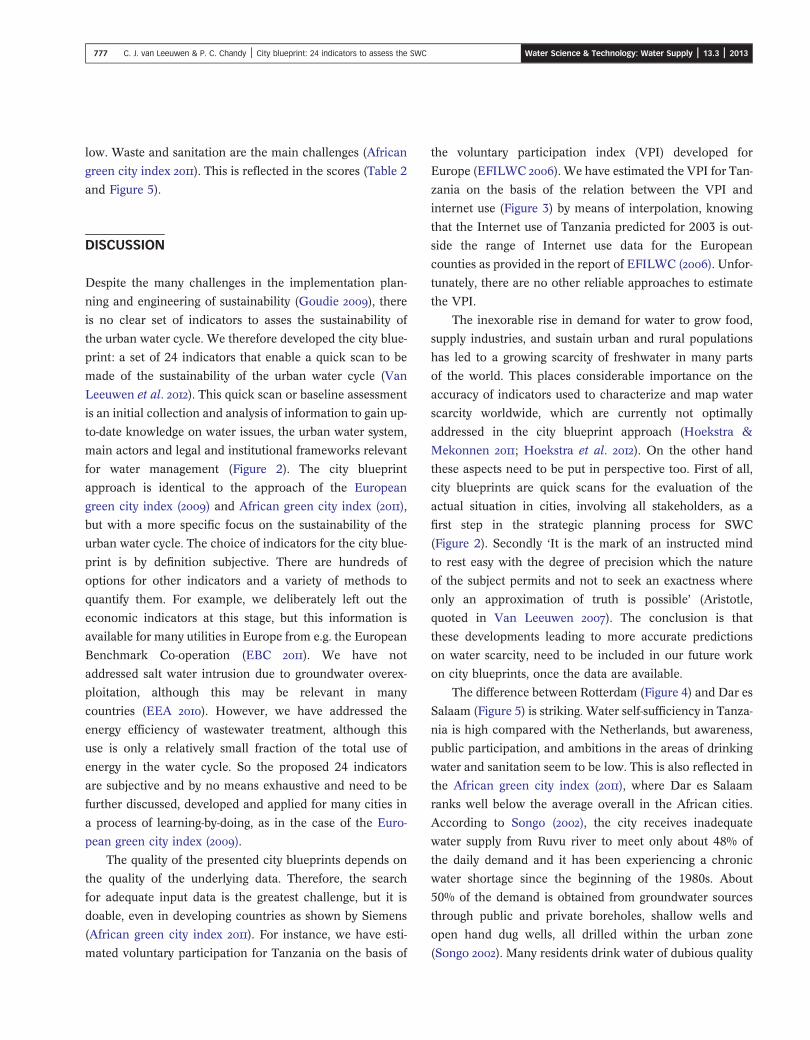
Mekonnen & Hoekstra () provide data on the average
water footprint of Tanzania of 1,026 m³/yr per capita. The
water scarcity for Tanzania is 37% and the water self-
sufficiency (93.2%) is relatively high. These and other data
are shown in the city blueprint for Dar es Salaam (Figure 5).
Surface water pollution is a major problem. In Dar es
Salaam, domestic waste is the most serious source of pol-
lution. The waste generated by 15% of the city residents
who are connected to the sewer system is discharged into
the sea untreated. As a result, coastal waters, especially in
the vicinity of the Dar es Salaam harbor, are heavily pol-
luted. Discharge of untreated sewage in Dar es Salaam has
resulted in high faecal and total coliform levels in coastal
waters (Mohammed ). Msimbazi River and Creek are
also among the most polluted water bodies in Dar es
Salaam. The river and creek receive large quantities of
untreated domestic wastes from the city’s residents in
addition to industrial wastes from various industries. The
river and creek receive such pollutants as dyes and paint
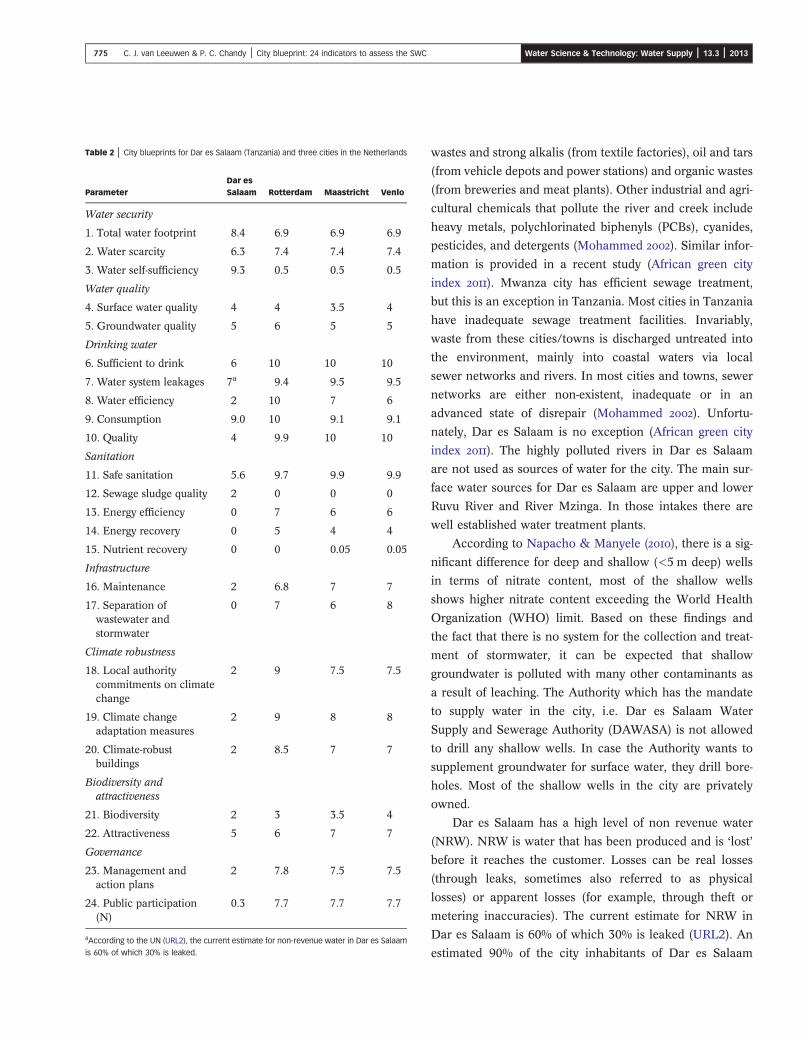
Table 2 | City blueprints for Dar es Salaam (Tanzania) and three cities in the Netherlands
ParameterDar esSalaam Rotterdam Maastricht Venlo
Water security
1. Total water footprint 8.4 6.9 6.9 6.9
2. Water scarcity 6.3 7.4 7.4 7.4
3. Water self-sufficiency 9.3 0.5 0.5 0.5
Water quality
4. Surface water quality 4 4 3.5 4
5. Groundwater quality 5 6 5 5
Drinking water
6. Sufficient to drink 6 10 10 10
7. Water system leakages 7a 9.4 9.5 9.5
8. Water efficiency 2 10 7 6
9. Consumption 9.0 10 9.1 9.1
10. Quality 4 9.9 10 10
Sanitation
11. Safe sanitation 5.6 9.7 9.9 9.9
12. Sewage sludge quality 2 0 0 0
13. Energy efficiency 0 7 6 6
14. Energy recovery 0 5 4 4
15. Nutrient recovery 0 0 0.05 0.05
Infrastructure
16. Maintenance 2 6.8 7 7
17. Separation ofwastewater andstormwater
0 7 6 8
Climate robustness
18. Local authoritycommitments on climatechange
2 9 7.5 7.5
19. Climate changeadaptation measures
2 9 8 8
20. Climate-robustbuildings
2 8.5 7 7
Biodiversity andattractiveness
21. Biodiversity 2 3 3.5 4
22. Attractiveness 5 6 7 7
Governance
23. Management andaction plans
2 7.8 7.5 7.5
24. Public participation(N)
0.3 7.7 7.7 7.7
aAccording to the UN (URL2), the current estimate for non-revenue water in Dar es Salaam
is 60% of which 30% is leaked.
775 C. J. van Leeuwen & P. C. Chandy | City blueprint: 24 indicators to assess the SWC Water Science & Technology: Water Supply | 13.3 | 2013
wastes and strong alkalis (from textile factories), oil and tars
(from vehicle depots and power stations) and organic wastes
(from breweries and meat plants). Other industrial and agri-
cultural chemicals that pollute the river and creek include
heavy metals, polychlorinated biphenyls (PCBs), cyanides,
pesticides, and detergents (Mohammed ). Similar infor-
mation is provided in a recent study (African green city
index ). Mwanza city has efficient sewage treatment,
but this is an exception in Tanzania. Most cities in Tanzania
have inadequate sewage treatment facilities. Invariably,
waste from these cities/towns is discharged untreated into
the environment, mainly into coastal waters via local
sewer networks and rivers. In most cities and towns, sewer
networks are either non-existent, inadequate or in an
advanced state of disrepair (Mohammed ). Unfortu-
nately, Dar es Salaam is no exception (African green city
index ). The highly polluted rivers in Dar es Salaam
are not used as sources of water for the city. The main sur-
face water sources for Dar es Salaam are upper and lower
Ruvu River and River Mzinga. In those intakes there are
well established water treatment plants.
According to Napacho & Manyele (), there is a sig-
nificant difference for deep and shallow (<5 m deep) wells
in terms of nitrate content, most of the shallow wells
shows higher nitrate content exceeding the World Health
Organization (WHO) limit. Based on these findings and
the fact that there is no system for the collection and treat-
ment of stormwater, it can be expected that shallow
groundwater is polluted with many other contaminants as
a result of leaching. The Authority which has the mandate
to supply water in the city, i.e. Dar es Salaam Water
Supply and Sewerage Authority (DAWASA) is not allowed
to drill any shallow wells. In case the Authority wants to
supplement groundwater for surface water, they drill bore-
holes. Most of the shallow wells in the city are privately
owned.
Dar es Salaam has a high level of non revenue water
(NRW). NRW is water that has been produced and is ‘lost’
before it reaches the customer. Losses can be real losses
(through leaks, sometimes also referred to as physical
losses) or apparent losses (for example, through theft or
metering inaccuracies). The current estimate for NRW in
Dar es Salaam is 60% of which 30% is leaked (URL2). An
estimated 90% of the city inhabitants of Dar es Salaam
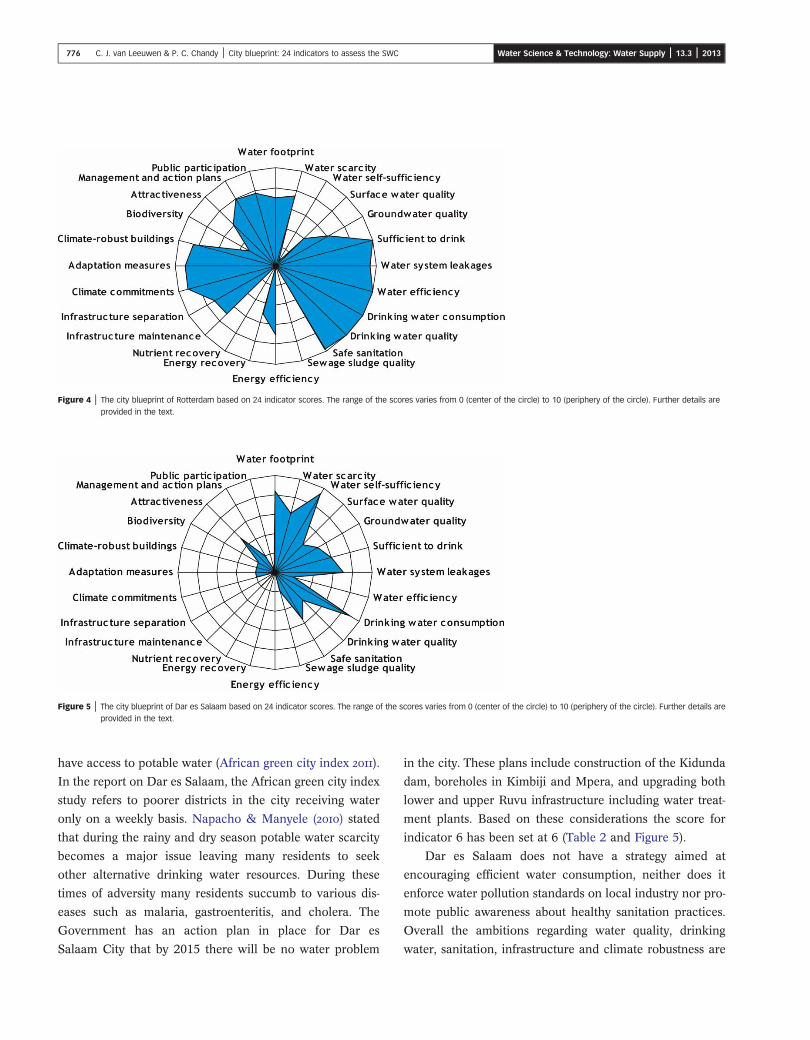
Figure 4 | The city blueprint of Rotterdam based on 24 indicator scores. The range of the scores varies from 0 (center of the circle) to 10 (periphery of the circle). Further details are
provided in the text.
Figure 5 | The city blueprint of Dar es Salaam based on 24 indicator scores. The range of the scores varies from 0 (center of the circle) to 10 (periphery of the circle). Further details are
provided in the text.
776 C. J. van Leeuwen & P. C. Chandy | City blueprint: 24 indicators to assess the SWC Water Science & Technology: Water Supply | 13.3 | 2013
have access to potable water (African green city index ).
In the report on Dar es Salaam, the African green city index
study refers to poorer districts in the city receiving water
only on a weekly basis. Napacho & Manyele () stated
that during the rainy and dry season potable water scarcity
becomes a major issue leaving many residents to seek
other alternative drinking water resources. During these
times of adversity many residents succumb to various dis-
eases such as malaria, gastroenteritis, and cholera. The
Government has an action plan in place for Dar es
Salaam City that by 2015 there will be no water problem
in the city. These plans include construction of the Kidunda
dam, boreholes in Kimbiji and Mpera, and upgrading both
lower and upper Ruvu infrastructure including water treat-
ment plants. Based on these considerations the score for
indicator 6 has been set at 6 (Table 2 and Figure 5).
Dar es Salaam does not have a strategy aimed at
encouraging efficient water consumption, neither does it
enforce water pollution standards on local industry nor pro-
mote public awareness about healthy sanitation practices.
Overall the ambitions regarding water quality, drinking
water, sanitation, infrastructure and climate robustness are
777 C. J. van Leeuwen & P. C. Chandy | City blueprint: 24 indicators to assess the SWC Water Science & Technology: Water Supply | 13.3 | 2013
low. Waste and sanitation are the main challenges (African
green city index ). This is reflected in the scores (Table 2
and Figure 5).
DISCUSSION
Despite the many challenges in the implementation plan-
ning and engineering of sustainability (Goudie ), there
is no clear set of indicators to asses the sustainability of
the urban water cycle. We therefore developed the city blue-
print: a set of 24 indicators that enable a quick scan to be
made of the sustainability of the urban water cycle (Van
Leeuwen et al. ). This quick scan or baseline assessment
is an initial collection and analysis of information to gain up-
to-date knowledge on water issues, the urban water system,
main actors and legal and institutional frameworks relevant
for water management (Figure 2). The city blueprint
approach is identical to the approach of the European
green city index () and African green city index (),
but with a more specific focus on the sustainability of the
urban water cycle. The choice of indicators for the city blue-
print is by definition subjective. There are hundreds of
options for other indicators and a variety of methods to
quantify them. For example, we deliberately left out the
economic indicators at this stage, but this information is
available for many utilities in Europe from e.g. the European
Benchmark Co-operation (EBC ). We have not
addressed salt water intrusion due to groundwater overex-
ploitation, although this may be relevant in many
countries (EEA ). However, we have addressed the
energy efficiency of wastewater treatment, although this
use is only a relatively small fraction of the total use of
energy in the water cycle. So the proposed 24 indicators
are subjective and by no means exhaustive and need to be
further discussed, developed and applied for many cities in
a process of learning-by-doing, as in the case of the Euro-
pean green city index ().
The quality of the presented city blueprints depends on
the quality of the underlying data. Therefore, the search
for adequate input data is the greatest challenge, but it is
doable, even in developing countries as shown by Siemens
(African green city index ). For instance, we have esti-
mated voluntary participation for Tanzania on the basis of
the voluntary participation index (VPI) developed for
Europe (EFILWC ). We have estimated the VPI for Tan-
zania on the basis of the relation between the VPI and
internet use (Figure 3) by means of interpolation, knowing
that the Internet use of Tanzania predicted for 2003 is out-
side the range of Internet use data for the European
counties as provided in the report of EFILWC (). Unfor-
tunately, there are no other reliable approaches to estimate
the VPI.
The inexorable rise in demand for water to grow food,
supply industries, and sustain urban and rural populations
has led to a growing scarcity of freshwater in many parts
of the world. This places considerable importance on the
accuracy of indicators used to characterize and map water
scarcity worldwide, which are currently not optimally
addressed in the city blueprint approach (Hoekstra &
Mekonnen ; Hoekstra et al. ). On the other hand
these aspects need to be put in perspective too. First of all,
city blueprints are quick scans for the evaluation of the
actual situation in cities, involving all stakeholders, as a
first step in the strategic planning process for SWC
(Figure 2). Secondly ‘It is the mark of an instructed mind
to rest easy with the degree of precision which the nature
of the subject permits and not to seek an exactness where
only an approximation of truth is possible’ (Aristotle,
quoted in Van Leeuwen ). The conclusion is that
these developments leading to more accurate predictions
on water scarcity, need to be included in our future work
on city blueprints, once the data are available.
The difference between Rotterdam (Figure 4) and Dar es
Salaam (Figure 5) is striking. Water self-sufficiency in Tanza-
nia is high compared with the Netherlands, but awareness,
public participation, and ambitions in the areas of drinking
water and sanitation seem to be low. This is also reflected in
the African green city index (), where Dar es Salaam
ranks well below the average overall in the African cities.
According to Songo (), the city receives inadequate
water supply from Ruvu river to meet only about 48% of
the daily demand and it has been experiencing a chronic
water shortage since the beginning of the 1980s. About
50% of the demand is obtained from groundwater sources
through public and private boreholes, shallow wells and
open hand dug wells, all drilled within the urban zone
(Songo ). Many residents drink water of dubious quality

778 C. J. van Leeuwen & P. C. Chandy | City blueprint: 24 indicators to assess the SWC Water Science & Technology: Water Supply | 13.3 | 2013
from several of these wells (Napacho &Manyele ).With-
out a plan or strategy to improve the city’s environmental
affairs, the majority of city inhabitants are unlikely to see a
rise in their environmental living standards (African green
city index ) and this is why Tanzania is one of the
focal points of UNEP in areas of drinking water, chemicals
and pesticides, and water pollution (URL2; Van Leeuwen
). Recently, the Tanzanian government has established
an action plan for Dar es Salaam to improve the access to
safe drinking water.
Transforming cities to become water aware will require
a major social and technical overhaul of conventional
approaches (Brown et al. ). Fleming () made this
very clear: ‘Ultimately the design, function and sustainability
of cities are a function of aspiration, imagination and choice,
which is why sustainability is more a socio-political than an
environmental issue. We will get what we will choose as a
society, whether through passive inaction or proactive
design.’ The city of Hamburg is a good example of a city
who has put this into practice (Fiedler ; German green
city index ).
Floods, water scarcity and droughts have enormous
environmental, social and economic impacts. Insufficient
water quality levels pose threats for public health and biodi-
versity and the supply of safe drinking water and sanitation
still poses problems, both within Europe and outside. To sus-
tainably manage the increasing pressures on water resources,
new and innovative approaches are needed (European Com-
mission ). This is why we are currently assessing city
blueprints of several European cities. From amethodological
point of view these case studies are needed to arrive at a
more definitive set of indicators, where the challenge will
be to strike a balance between what we need and the data
that is available. From a science-policy point of view it is
essential to demonstrate that quick scans of the SWC of
European cities are doable and can contribute to more sus-
tainable urban water cycles. Awareness of these challenges,
the involvement of the civil society (European green city
index ), and the focus on cities (Figure 1), particularly
in developing countries (African green city index ), is
essential to address the global challenges that were recently
discussed and reported by e.g. the European Commission
(, ), EEA () and UNEP ().
CONCLUSIONS
• The city blueprint is an interactive multi-stakeholder
method and process. It can be used as a first step or
quick-scan to benchmark the sustainability of the urban
water cycle and facilitates awareness and receptiveness
to the current water challenges.
• The city blueprint process can play a role in our work on
cities of the future, i.e. in creating the capacity to accom-
modate the growing water-related needs of cities in the
context of fixed or diminished resources and competition
for water between food, cities, energy and industry.
• City Blueprints may help: (1) to communicate a city’s
SWC performance and exchange experiences, (2) to
select appropriate water supply and sanitation strategies,
and (3) to develop technological and non-technological
options as future alternatives for the water cycle.
• City blueprints are a snapshot and can be made in a
couple of days. The obvious limitation is that the assess-
ment is static and not dynamic. For instance in the case
of Dar es Salaam we were informed about the need for
Dar es Salaam to provide more drinking water in the
very near future, as the population is expected to
double in size in the next decade. This information has
not been included in the calculations but has been pro-
vided as additional information in this publication.
• In some cases, simplifications and assumptions have
been made to quantify the indicators. This should be
borne in mind when critically evaluating the results.
However, the process of comparing cities and highlight-
ing best practices in cities, is the ultimate goal as
communication with all stakeholders, public partici-
pation and implementation are what matters (Brown
; European green city index, ; Van Leeuwen
et al. ).
• Further case studies on cities are needed to implement
and test the approach in practice by following the ‘learn-
ing by doing’ approach. This will require a clear
questionnaire and an expert panel process as used for
the European green city index (). This has been
done and a total of 13 cities have now been assessed in
a European research project TRUST (Transitions to the
Urban Water Services of Tomorrow).
779 C. J. van Leeuwen & P. C. Chandy | City blueprint: 24 indicators to assess the SWC Water Science & Technology: Water Supply | 13.3 | 2013
• The focus on cities is essential to address the water-
related challenges as recently published by the European
Commission (, ), EEA () and UNEP ().
ACKNOWLEDGEMENTS
The research was funded by the European Innovation Fund
from the Dutch water utilities and UNEP’s Scientific Expert
Group on Chemicals and the Environment (SECE). The
authors wish to thank Mr Daniel Z. Matata, Mrs Josephine
Kalima and Mr Daniel W. Ndiyo of the Government
Chemist Laboratory Agency in Dar es Salaam, for the
excellent way in which they organized the meeting to
discuss the progress made in UNEP-SECE on water scarcity
and water pollution related topics. The authors also
acknowledge the support from Nicolas A. Franke from the
Waterfootprint Network in Enschede (the Netherlands), for
providing data and comments on this paper.
REFERENCES
African green city index Assessing The EnvironmentalPerformance of Africa’s Major Cities. A Research ProjectConducted by the Economist Intelligence Unit. SiemensMünchen, Germany.
Australian Conservation Foundation Sustainable CitiesIndex. Ranking Australia’s 20 Largest Cities in 2010.Melbourne, Australia.
Barles, S. Society, energy and materials: the contribution ofurban metabolism studies to sustainable urban developmentissues. Environ. Plan. Manag. 53, 439–455.
Brown, P. The changing face of urban water management.Water 21 (2), 28–29.
Brown, R. R. & Farrelly, M. A. Delivering sustainable urbanwater management: a review of the hurdles we face. Water.Sci. Technol. 59, 839–846.
Brown, R. R., Keath, N. & Wong, T. H. F. Urban watermanagement in cities: historical, current and future regimes.Water. Sci. Technol. 59, 847–855.
Charlesworth, S. M. A review of the adaptation andmitigation of global climate change using sustainabledrainage in cities. J. Water. Climate Change 1, 165–180.
Cohen, D. Earth audit. Cover story. New Scientist 194 (2605),34–41.
Costanza, R., d’Arge, R., de Groot, R., Farber, S., Grasso, M.,Hannon, B., Limburg, K., Naeem, S., O’Neil, R., Paruelo, J.,
Raskin, R.G., Sutton, P. & van den Belt, M. The valueof the world’s ecosystem services and natural capital.Nature 387, 253–260.
Daigger, G. T. Evolving urban water and residualsmanagement paradigms: water reclamation and reuse,decentralization, and resource recovery. Water Environ. Res.81, 809–823.
DeGraaf,R., vandeGiessen,N.&VanDeVen, F. aAlternativewater management options to reduce vulnerability for climatechange in the Netherlands. Nat. Hazards 5, 407–422.
De Graaf, R. E., van de Giessen, N. C. & Van De Ven, F. H. M.b The closed city as a strategy to reduce vulnerabilityof urban areas for climate change. Water Sci. Technol. 56,165–173.
Deltares Land and Water Management in the UrbanEnvironment. Utrecht, the Netherlands.
EBC European Benchmarking Co-operation. Learning fromInternational Best Practices. 2010 Water & WastewaterBenchmark. Rijswijk, the Netherlands.
EEA European Environment Agency. The EuropeanEnvironment. State and Outlook 2010. Synthesis.Copenhagen, Denmark.
EFILWC (European Foundation for the Improvement of Livingand Working Conditions) First European Quality of LifeSurvey: Participation in Civil Society. Dublin, Ireland.
Engel, K., Jokiel, D., Kraljevic, A., Geiger, M. & Smith, K. BigCities. Big Water. Big Challenges. Water in an UrbanizingWorld. World Wildlife Fund, Koberich, Germany.
Ernstson, H., van der Leeuw, S. E., Redman, C. L., Meffert, D. J.,Davis, G., Alfsen, C. & Elmqvist, T. Urban transitions:on urban resilience and human dominated ecosystems.Ambio 39, 531–545.
European Commission Council Directive 98/83/EC of 3November 1998 on the quality of water intended for humanconsumption.Official Journal of the EuropeanUnionL 330/32.
European Commission Directive 2000/60/EC of theEuropean Parliament and of the Council of 23 October 2000establishing a framework for Community action in the field ofwater policy. Official Journal of the European Union L 327/1.
European Commission Directive 2006/118/EC of theEuropean Parliament and of the Council of 12 December 2006on the protection of groundwater against pollution anddeterioration.Official Journal of the EuropeanUnion L 372/19.
European Commission A Blueprint to Safeguard Europe’sWaters. Brussels, Belgium. Available from: http://ec.europa.eu/environment/water/blueprint/index_en.htm (accessedDecember 2011).
European Commission Communication from the Commissionto the European Parliament, the Council, the EuropeanEconomic and Social Committee and the Committee of theRegions on the European Innovation Partnership on Water.Brussels, 10.5.2012 COM(2012) 216 final. Available from:http://ec.europa.eu/environment/water/innovationpartnership/pdf/com_2012_216.pdf (accessedMay 2012).

780 C. J. van Leeuwen & P. C. Chandy | City blueprint: 24 indicators to assess the SWC Water Science & Technology: Water Supply | 13.3 | 2013
European green city index Assessing the EnvironmentalImpact of Europe’s Major Cities. A Research ProjectConducted by the Economist Intelligence Unit, Siemens.München, Germany.
Fewtrell, L. & Kay, D. Health Impact Assessment forSustainable Water Management. IWA Publ., London.
Fiedler, R. Sustainable Waste Management in the EuropeanGreen Capital 2011. Hamburg, Germany. Available from:http://www.iswa.org/uploads/tx_iswaknowledgebase/Fiedler.pdf.
Fleming, N. Understanding ‘what’s really going on’ as a basisfor transforming thinking, action and our cities. Paperpresented at Enviro 08 Australasia’s Environmental &Sustainability Conference & Exhibition, Melbourne,Australia.
Forum for the future The sustainable cities index. Ranking the20 largest British cities. Available from: http://www.forumforthefuture.org/sites/default/files/images/Forum/Projects/Sustainable_Cities_Index/Sustainable_Cities_Index_2010_FINAL_15-10-10.pdf(accessed February 2011).
Frijns, J., Hofman, J. & van Wezel, A. Water as energycarrier: climate mitigation and renewable energy options inthe water sector. Proceedings IWA Water & EnergyConference, Copenhagen, Denmark.
German green city index Assessing the EnvironmentalPerformance of 12 Major German Cities. A Research ProjectConducted by the Economist Intelligence Unit, Siemens.München, Germany.
Global city indicators facility Global City Indicators ProgramReport. Preliminary report. Available from: http://www.cityindicators.org/Deliverables/Final%20Indicators%20Report%203_21_08_4-23-2008-924597.pdf (accessedFebruary 2011).
Godden, L., Ison, R. L. & Wallis, P. J. Water governancein a climate change world: appraising systemic andadaptive effectiveness.Water Resour.Manage. 25, 3971–3976.
Goudie, D. The emergent science of engineering andsustainable urban environment. Water Air Soil Pollut. 9,469–484.
Hoekstra, A. Y. & Chapagain, A. K. Water footprints ofnations: water use by people as a function of theirconsumption. Water. Resour. Manage. 21, 35–48.
Hoekstra, A. Y. & Mekonnen, M. M. Global water scarcity:monthly blue water footprint compared to blue wateravailability for the world’s major river basins. Value of WaterResearch Report Series No. 53, UNESCO-IHE, Delft, theNetherlands.
Hoekstra, A. Y., Chapagain, A. K., Aldaya, M. M. & Mekonnen,M. M. The Water Footprint Manual. Setting the GlobalStandard, Earthscan, London, UK.
Hoekstra, A. Y., Mekonnen, M. M., Chapagain, A. K., Mathews, R.E. & Richter, B. D. Global monthly water scarcity: Bluewater footprints versus blue water availability. PLoS ONE 7(2), e32688.
Ison, R., Collins, K., Colvin, J., Jiggins, J., Roggero, P. P., Seddaiu, G.,Steyaert, P., Toderi, M. & Zanolla, C. Sustainablecatchment managing in a climate changing world: newintegrative modalities for connecting policy maker, scientistsand other stakeholders.Water Resour. Manage. 25, 3977–3992.
Jenerette, G. D. & Larsen, L. A global perspective onchanging sustainable urban water supplies. Global PlanetChange 50, 202–211.
Klauer, B., Rode, M., Schiller, J., Franko, U. & Mewes, M. Decision support for the selection of measures according tothe requirements of the EU Water Framework Directive.Water Resour. Manage. 26 (3), 775–798.
Mekonnen, M. M. & Hoekstra, A. Y. National water footprintaccounts: the green, blue and greywater footprint of productionand consumption. Volumes 1 and 2. Value of Water ResearchReport Series No. 50. UNESCO-IHE, Delft, the Netherlands.
Mohammed, S. M. A review of water quality and pollutionstudies in Tanzania. Ambio 13 (7–8), 617–620.
Napacho, Z. A. & Manyele, S. V. Quality assessment ofdrinking water in Temeke district (part II): Characterizationof chemical paprameters. African Journal of EnvironmentalScience and Technology 4 (11), 775–789.
Nederlof, M. M., Frijns, J. & Groenedijk, M. Cradle to cradledrinking water production: sense or nonsense? ProceedingsIWA Water &Energy Conference, Amsterdam.
Philip, R., Anton, B. & van der Steen, P. SWITCH Training Kit.Integrated UrbanWater Management in the City of the Future.Module 1. Strategic Planning. ICLEI, Freiburg, Germany.
RIONED (RIONED Foundation) Factual Information onSewage Systems in the Netherlands 2009–2010 (Riolering inbeeld. Benchmark Rioleringszorg, 2010). Stichting Rioned,Ede, the Netherlands.
Songo, M. A. M. Current and Future Groundwater ResourcesManagement Strategies in dar es Salaam, Tanzania.Department of Geology. University of Dar es Salaam.Available from: http://www.bscw.ihe.nl/pub/bscw.cgi/d2606824/Songo.pdf (accessed May 2012).
Sustainable Society Foundation The Sustainable SocietyIndex 2010. The Hague, the Netherlands.
Tredoux, G., King, P. & Cave, L. Managing urban wastewaterfor maximising water resource utilisation.Water Sci. Technol.39, 353–356.
UN (United Nations) Indicators of Sustainable Development:Guidelines and Methodologies. 3rd edn, New York, USA.
UN (United Nations) World Urbanization Prospects: The2007 Revision Population Database. New York, USA.Available from: http://esa.un.org/unup/ (accessed February2011).
UNEP (United Nations Environment Programme) FourthGlobal Environment Outlook: Environment forDevelopment. Geneva, Switzerland.
URL1: http://www.internetworldstats.com/stats1.htm, accessedMay 2012.
URL2: http://www.unhabitat.org/content.asp?cid=3221&catid=237&typeid=13, accessed May 2012.

781 C. J. van Leeuwen & P. C. Chandy | City blueprint: 24 indicators to assess the SWC Water Science & Technology: Water Supply | 13.3 | 2013
Van de Kerk, G. & Manuel, A. R. A comprehensive index fora sustainable society: the SSI-the Sustainable Society Index.Ecol Econ 66, 228–242.
Van Leeuwen, C. J. Introduction. In: Risk Assessment ofChemicals. An Introduction (C. J. Van Leeuwen & T. G.Vermeire, eds). Springer, Dordrecht, 2nd edn, pp. 1–36.
Van Leeuwen, C. J., Frijns, J., Van Wezel, A. & Van De Ven,F. H. M. City blueprints: 24 indicators to assess thesustainability of the urban water cycle. Water Resour.Manage. 26, 2177–2197.
Van Leeuwen, C. J. Guidance documents on chemicals andthe environment: ecosystem services, water pollution andwater scarcity. Project A308915. Report prepared forUNEP-SECE. KWR Report 2012.041. KWR WatercycleResearch Institute, Nieuwegein, the Netherlands.
Van Pelt, S. & Swart, R. J. Climate change risk management intransnational River basins: the Rhine.Water Resour. Manage.25, 3837–3861.
Verstraete, W., Van de Caveye, P. & Diamantis, V. Maximumuse of resources in domestic ‘used water’. Resource Technol.100, 5537–5545.
Vinjé, J., Altena, S. A. & Koopmans, M. P. G. The incidenceand genetic variability of small round-structured viruses inoutbreaks of gastroenteritis in The Netherlands. InfectiousDiseases 176 (5), 1374–1378.
VROM (Ministry of Housing, Spatial Planning and theEnvironment) The Implementation Challenge.Managing Environment Development Trade-offs. The Hague,the Netherlands.
2030 Water Resources Group Charting our Water Future.Economic Frameworks to Inform Decision-making. WestPerth, USA.
Zoeteman, B. C. J., De Greef, E. & Brinkmann, F. J. J. Persistency of organic contaminants in groundwater, lessonsfrom soil pollution incidents in the Netherlands. Sci.TotalEnviron. 21, 187–202.
First received 22 October 2012; accepted in revised form 14 November 2012