the city of new york department of finance office of … · 2018-04-26 · the city of new york •...
TRANSCRIPT

The City of New York • Department of Finance • Office of Tax Policy
Michael R. Bloomberg • Mayor Martha E. Stark • Commissioner

ANNUAL REPORT ON THE NYC
REAL PROPERTY TAX Fiscal Year 2006
MICHAEL R. BLOOMBERG MAYOR
MARTHA E. STARK
COMMISSIONER
REPORT PREPARED BY THE OFFICE OF TAX POLICY
SEPTEMBER 2006

Table of Contents Fast Facts ………………………………………………………………………. i Highlights ………………………………………………………………………. ii Part I. Current Year Profiles …………………………………………. 1 Market and Assessed Value by Property Type ………………………….. 1 “Tax Dollar Value” of Real Property Tax Exemptions
by Property Type ……………………..………………………….. 7 Exemptions by Exemption Type ………………………………………… 13 Part II. Tax Levy ………………………………………………………… 25 Reconciliation of Assessment Roll, Tax Levy and Net Levy Billed ……. 27 Abatements by Property Type and Abatement Type ……………………. 28 Part III. Office Buildings ………………………………………………… 29 Part IV. Home Sales ……………………………………………………… 33 Part V. Cooperative and Condominium Tax Abatement Program ….. 35 Part VI. Delinquencies …………………………………………………… 36 Part VII. Historical Data ………………………………………………….. 39 Market Value by Tax Class and Borough FY 1993 – 2006 ……………… 39
Assessed Value by Tax Class FY 1992 – 2006 ………………………….. 40 Taxable Billable Assessed Value by Borough FY 1992 – 2006 ………… 41 Tax Levy by Tax Class FY 1992 – 2006 …………………………………. 42 Tax Rates FY 1991 – 2006 ……………………………………………….. 43 Tax Levy and Revenue FY 1992 – 2006 ………………………………….. 44 Unused Operating Margin FY 1992 – 2006 ……………………………… 45 Appendix ………………………………………………………………………… 46 The Real Property Tax System at a Glance ………………………………. 46 A Chronology of Tax Class Changes …………………………………….. 47 Glossary of Common Real Estate Terms …………………………………. 48

OTE: Class One is primarily one-, two-, and three-family homes; Class Two is all other residential
"Fast Facts" for FY 2006 ($ Millions/% Change from FY2005)
Taxable Status Number % Change Amount % Change
Citywide 996,295 0.78% $192,644.9 6.07%
Fully Taxable 387,674 -6.93% $76,527.4 4.78%Partially Taxable* 571,684 6.61% 44,576.8 14.61%Fully Exempt 36,937 3.15% 71,540.7 2.66%
* Total billable AV for this category includes both taxable and exempt assessed value.
Amount % Change Amount % Change Amount % ChangeCitywide $614,003.7 13.62% $122,481.6 11.03% $110,014.1 7.47%
Manhattan $205,579.4 13.75% $77,359.5 11.36% $67,876.4 7.47%Bronx 40,000.8 13.78% 6,854.1 11.84% 6,438.9 9.46%Brooklyn 141,576.4 12.83% 14,855.9 8.01% 14,063.0 5.71%Queens 174,669.5 13.80% 19,567.8 12.02% 17,938.6 7.99%Staten Island 52,177.5 14.58% 3,844.3 9.87% 3,697.2 8.35%
Class 1 $325,068.5 14.64% $12,146.9 5.19% $12,146.9 5.19%Class 2 131,377.0 13.37% 43,941.4 12.36% 38,630.6 7.45%Class 3 18,909.9 13.52% 8,502.0 13.53% 8,502.0 13.53%Class 4 138,648.3 11.55% 57,891.3 10.96% 50,734.6 7.08%
Table excludes fully exempt properties.
Percent Tax RateLevy of Levy % Change (Per $100 of A. V.)
Citywide $13,668.1 100.0% 7.45% 12.283
Class 1 $2,043.4 15.0% 9.39% 15.746Class 2 $4,842.0 35.4% 9.16% 12.396Class 3 $1,046.5 7.7% 11.33% 12.309Class 4 $5,736.1 42.0% 4.75% 11.306
Market Value
Properties Assessed ValueTotal Billable
Taxable BillableAssessed Value
Taxable ActualAssessed Value
Nproperty; Class Three is utility property and Class Four is all other commercial property.
i

FY 2006 HIGHLIGHTS
Y 2006 Highlights
arket and assessed values continued to grow at a strong pace in FY 2006. The total
ince the average tax rate remained at $12.283 per $100 of assessed value, the $7.6
esidential Property
he strong growth in values for the City’s residential sector continued for the FY 2006
ousing sales data for calendar year 2005 indicate a continued increase in home values
lass Two market values rose $15.5 billion to $131.4 billion, an increase of 13.4 percent.
ommercial Property
lass Four market value grew by 11.6 percent, or $14.4 billion, to $138.6 billion in FY
elinquency
he delinquency rate for FY 2005 decreased slightly to 2.31 percent as of June 30, 2005, the last day of the fiscal year, while total delinquencies grew 3.8 percent to $300.3
F MCitywide market value of fully and partially taxable property reached $614.0 billion, a $73.6 billion or 13.6 percent increase over FY 2005. This increase was largely driven by the strength of residential properties, which accounted for 77 percent of the growth. Sbillion increase in billable assessed value resulted in $948.1 million in additional property tax levy for FY 2006. R Ttax roll. Class One properties (primarily 1-, 2-, and 3-family homes) increased 14.6 percent in market value, reaching $325.1 billion. The rate of increase declined from 21.8 percent the previous year. Legislatively mandated caps on assessment increases limited the assessed value growth to 5.2 percent. Hthroughout the City. Median prices in 2005 for 1-family homes grew by 16.9 percent over the previous year. CCondominium market values increased 21.1 percent, while cooperative apartments increased by 15.8 percent. Class Two’s billable assessed value increased by 7.4 percent in FY 2006. C C2006. The rate of growth was almost four times greater than in the previous year. Billable assessed value grew by 7.1 percent. Office building market values increased by 9.3 percent. D T
ii

million. For Class One, the number of delinquent parcels decreased 41.5 percent, to 63,005, while the amount delinquent decreased only 10.4 percent to $60.3 million.
iii

Part I Current Year Profiles
Parcels Residential Market ValueProperty Type Units or Actual
Area1 $ Millions % of Total $ Millions % of Total $ Millions % of Total
CITYWIDE TOTAL 959,358 614,003.7 100% 122,481.6 100% 110,014.1 100%CLASS 1 691,736 1,051,733 325,068.5 52.94% 12,146.9 9.92% 12,146.9 11.04%1-Family 324,319 324,319 150,824.7 24.56% 5,705.4 4.66% 5,705.4 5.19%2-Family 251,998 503,996 126,010.3 20.52% 4,698.9 3.84% 4,698.9 4.27%3-Family 66,870 200,610 40,458.9 6.59% 1,428.4 1.17% 1,428.4 1.30%Condominiums 18,792 18,792 3,722.5 0.61% 166.6 0.14% 166.6 0.15%Vacant Land 26,187 0 3,153.4 0.51% 108.2 0.09% 108.2 0.10%Other 3,570 4,016 898.6 0.15% 39.4 0.03% 39.4 0.04%
CLASS 2 186,974 1,742,068 131,377.0 21.40% 43,941.4 35.88% 38,630.6 35.11%Rentals 24,030 953,454 51,291.8 8.35% 19,668.5 16.06% 17,585.1 15.98%Cooperatives 4,845 362,793 30,073.1 4.90% 12,841.0 10.48% 10,793.2 9.81%Condominiums2 98,466 99,618 14,910.9 2.43% 5,641.2 4.61% 4,761.2 4.33%Condops 223 24,981 2,999.1 0.49% 1,271.9 1.04% 972.3 0.88%4-10 Fam Rentals 53,507 284,523 30,145.5 4.91% 3,939.8 3.22% 3,939.8 3.58%2-10 Fam Co-ops 1,880 12,409 1,296.4 0.21% 381.4 0.31% 381.4 0.35%2-10 Fam Condos 3,974 3,974 597.8 0.10% 181.3 0.15% 181.3 0.16%2-10 Fam Condops 49 316 62.4 0.01% 16.3 0.01% 16.3 0.01%
CLASS 3 421 - 18,909.9 3.08% 8,502.0 6.94% 8,502.0 7.73%Special Franch. 121 - 12,892.8 2.10% 5,801.8 4.74% 5,801.8 5.27%Locally Assessed 288 - 6,015.7 0.98% 2,699.6 2.20% 2,699.6 2.45%Other 12 - 1.4 0.00% 0.6 0.00% 0.6 0.00%
CLASS 4 80,227 1,037.4 138,648.3 22.58% 57,891.3 47.27% 50,734.6 46.12%Office Buildings 5,832 386.3 68,987.1 11.24% 29,726.2 24.27% 25,627.3 23.29%Store Buildings 18,476 149.8 19,836.1 3.23% 7,936.7 6.48% 6,793.4 6.17%Loft Buildings 1,671 71.0 5,153.5 0.84% 2,282.6 1.86% 1,926.6 1.75%Utility Property 3,430 - 3,741.2 0.61% 1,667.4 1.36% 1,589.0 1.44%Hotels 549 48.1 7,479.8 1.22% 2,940.5 2.40% 2,836.1 2.58%Factories 5,557 98.8 3,039.2 0.49% 1,256.3 1.03% 1,188.8 1.08%Comm'l Condos 12,754 69.6 14,101.4 2.30% 5,720.8 4.67% 4,930.1 4.48%Garages 12,193 50.1 4,377.6 0.71% 1,904.7 1.56% 1,752.3 1.59%Warehouses 5,391 101.2 3,822.3 0.62% 1,539.4 1.26% 1,409.4 1.28%Vacant Land 9,187 2.0 1,432.9 0.23% 623.3 0.51% 512.3 0.47%Health & Educational 987 27.0 3,025.0 0.49% 985.0 0.80% 932.2 0.85%Theaters 156 7.3 653.9 0.11% 207.3 0.17% 192.8 0.18%Cultural&Rec 904 8.5 919.9 0.15% 321.0 0.26% 302.9 0.28%Other 3,140 17.8 2,078.3 0.34% 780.0 0.64% 741.4 0.67%
BillableAssessed Value
MARKET AND ASSESSED VALUE PROFILE CITYWIDE by PROPERTY TYPE
FY 2006 - TAXABLE PROPERTIES
1. Classes One and Two show residential unit counts. Class Four shows gross building area in millions of square feet. Area figures are not available for Class Three and Class Four Utility property.2. Condominium unit count exceeds the parcel count because some condominium parcels contain multiple rental units.
Totals may not add due to rounding.
1

Part I Current Year Profiles
Parcels Residential Market ValueProperty Type Units or Actual
Area1 $ Millions % of Total $ Millions % of Total $ Millions % of Total
MANHATTAN 104,381 205,579.4 100% 77,359.5 100% 67,876.4 100%CLASS 1 5,979 10,333 13,463.6 6.55% 504.0 0.65% 504.0 0.74%1-Family 1,805 1,805 6,067.5 2.95% 250.0 0.32% 250.0 0.37%2-Family 2,114 4,228 4,652.0 2.26% 170.7 0.22% 170.7 0.25%3-Family 1,369 4,107 2,574.7 1.25% 75.7 0.10% 75.7 0.11%Condominiums 193 193 119.3 0.06% 5.8 0.01% 5.8 0.01%Vacant Land 496 0 49.8 0.02% 1.9 0.00% 1.9 0.00%Other 2 0 0.3 0.00% 0.0 0.00% 0.0 0.00%
CLASS 2 82,482 706,741 81,879.8 39.83% 29,567.7 38.22% 25,925.4 38.19%Rentals 10,634 400,981 33,968.9 16.52% 12,556.9 16.23% 11,230.4 16.55%Cooperatives 2,555 161,988 20,482.1 9.96% 8,837.6 11.42% 7,570.1 11.15%Condominiums2 58,032 59,137 12,687.4 6.17% 4,958.3 6.41% 4,186.7 6.17%Condops 171 20,663 2,749.6 1.34% 1,166.3 1.51% 889.4 1.31%4-10 Fam Rentals 8,388 55,377 10,606.8 5.16% 1,610.1 2.08% 1,610.1 2.37%2-10 Fam Co-ops 935 6,638 917.1 0.45% 282.6 0.37% 282.6 0.42%2-10 Fam Condos 1,732 1,732 410.4 0.20% 141.4 0.18% 141.4 0.21%2-10 Fam Condops 35 225 57.5 0.03% 14.7 0.02% 14.7 0.02%
CLASS 3 100 - 7,057.8 3.43% 3,175.2 4.10% 3,175.2 4.68%Special Franch. 48 - 4,641.2 2.26% 2,088.5 2.70% 2,088.5 3.08%Locally Assessed 52 - 2,416.7 1.18% 1,086.6 1.40% 1,086.6 1.60%Other 0 - 0.0 0.00% 0.0 0.00% 0.0 0.00%
CLASS 4 15,820 572.6 103,178.1 50.19% 44,112.6 57.02% 38,271.8 56.38%Office Buildings 1,975 337.0 64,736.0 31.49% 28,156.8 36.40% 24,232.7 35.70%Store Buildings 2,831 29.3 6,289.1 3.06% 2,695.3 3.48% 2,197.8 3.24%Loft Buildings 1,473 57.1 4,880.7 2.37% 2,166.3 2.80% 1,819.0 2.68%Utility Property 738 - 1,719.7 0.84% 773.9 1.00% 741.8 1.09%Hotels 383 43.0 6,877.4 3.35% 2,781.4 3.60% 2,688.7 3.96%Factories 102 2.9 144.6 0.07% 42.0 0.05% 40.2 0.06%Comm'l Condos 5,473 61.1 13,417.4 6.53% 5,521.7 7.14% 4,756.2 7.01%Garages 1,117 13.1 1,545.4 0.75% 690.4 0.89% 624.8 0.92%Warehouses 295 12.2 581.9 0.28% 251.2 0.32% 220.5 0.32%Vacant Land 908 1.0 463.7 0.23% 193.4 0.25% 160.2 0.24%Health & Educational 140 5.3 921.5 0.45% 237.8 0.31% 219.8 0.32%Theaters 105 5.2 449.6 0.22% 163.3 0.21% 152.5 0.22%Cultural&Rec 84 1.9 296.9 0.14% 108.8 0.14% 101.1 0.15%Other 196 3.4 854.1 0.42% 330.1 0.43% 316.8 0.47%
BillableAssessed Value
MARKET AND ASSESSED VALUE PROFILE MANHATTAN by PROPERTY TYPEFY 2006 - TAXABLE PROPERTIES
1. Classes One and Two show residential unit counts. Class Four shows gross building area in millions of square feet. Area figures are not available for Class Three and Class Four Utility property.2. Condominium unit count exceeds the parcel count because some condominium parcels contain multiple rental units.
Totals may not add due to rounding.
2

Part I Current Year Profiles
Parcels Residential Market ValueProperty Type Units or Actual
Area1 $ Millions % of Total $ Millions % of Total $ Millions % of Total
BRONX 99,269 40,000.8 100% 6,854.1 100% 6,438.9 100%CLASS 1 66,466 111,089 24,087.5 60.22% 1,005.8 14.67% 1,005.8 15.62%1-Family 22,639 22,639 8,490.8 21.23% 357.6 5.22% 357.6 5.55%2-Family 28,848 57,696 10,896.5 27.24% 460.6 6.72% 460.6 7.15%3-Family 9,484 28,452 3,966.7 9.92% 160.3 2.34% 160.3 2.49%Condominiums 1,127 1,127 191.3 0.48% 5.0 0.07% 5.0 0.08%Vacant Land 3,575 0 336.9 0.84% 12.9 0.19% 12.9 0.20%Other 793 1,175 205.2 0.51% 9.4 0.14% 9.4 0.15%
CLASS 2 22,768 264,368 8,049.7 20.12% 2,743.7 40.03% 2,537.3 39.41%Rentals 4,736 198,909 5,108.5 12.77% 1,962.8 28.64% 1,812.0 28.14%Cooperatives 389 30,339 1,138.4 2.85% 459.0 6.70% 412.9 6.41%Condominiums 13,427 13,427 326.0 0.81% 106.9 1.56% 97.5 1.51%Condops 3 213 9.8 0.02% 4.4 0.06% 4.1 0.06%4-10 Fam Rentals 4,163 21,206 1,457.3 3.64% 208.2 3.04% 208.2 3.23%2-10 Fam Co-ops 33 257 8.8 0.02% 2.2 0.03% 2.2 0.03%2-10 Fam Condos 17 17 0.9 0.00% 0.4 0.01% 0.4 0.01%2-10 Fam Condops 0 0 0.0 0.00% 0.0 0.00% 0.0 0.00%
CLASS 3 51 - 1,987.3 4.97% 894.3 13.05% 894.3 13.89%Special Franch. 24 - 1,646.1 4.12% 740.7 10.81% 740.7 11.50%Locally Assessed 27 - 341.3 0.85% 153.6 2.24% 153.6 2.38%Other 0 - 0.0 0.00% 0.0 0.00% 0.0 0.00%
CLASS 4 9,984 75.9 5,876.4 14.69% 2,210.3 32.25% 2,001.6 31.09%Office Buildings 439 6.3 565.5 1.41% 181.8 2.65% 155.4 2.41%Store Buildings 2,681 23.6 2,592.7 6.48% 936.8 13.67% 829.9 12.89%Loft Buildings 20 0.4 9.9 0.02% 3.9 0.06% 3.6 0.06%Utility Property 526 - 197.7 0.49% 88.6 1.29% 87.2 1.35%Hotels 33 0.7 72.9 0.18% 28.9 0.42% 24.7 0.38%Factories 591 11.7 327.4 0.82% 135.8 1.98% 131.4 2.04%Comm'l Condos 202 0.6 52.9 0.13% 19.2 0.28% 17.8 0.28%Garages 2,458 8.2 538.7 1.35% 231.9 3.38% 210.3 3.27%Warehouses 704 14.8 469.7 1.17% 189.0 2.76% 174.0 2.70%Vacant Land 1,428 0.0 119.7 0.30% 53.6 0.78% 44.1 0.68%Health & Educational 146 5.1 467.2 1.17% 166.2 2.42% 156.9 2.44%Theaters 4 0.1 13.0 0.03% 5.9 0.09% 5.7 0.09%Cultural&Rec 214 1.1 109.0 0.27% 38.1 0.56% 35.2 0.55%Other 538 3.2 340.1 0.85% 130.9 1.91% 125.4 1.95%
Billable
FY 2006 - TAXABLE PROPERTIES
Assessed Value
BRONX by PROPERTY TYPEMARKET AND ASSESSED VALUE PROFILE
1. Classes One and Two show residential unit counts. Class Four shows gross building area in millions of square feet. Area figures are not available for Class Three and Class Four Utility property.
Totals may not add due to rounding.
3
Part I Current Year Profiles
Parcels Residential Market ValueProperty Type Units or Actual
Area1 $ Millions % of Total $ Millions % of Total $ Millions % of Total
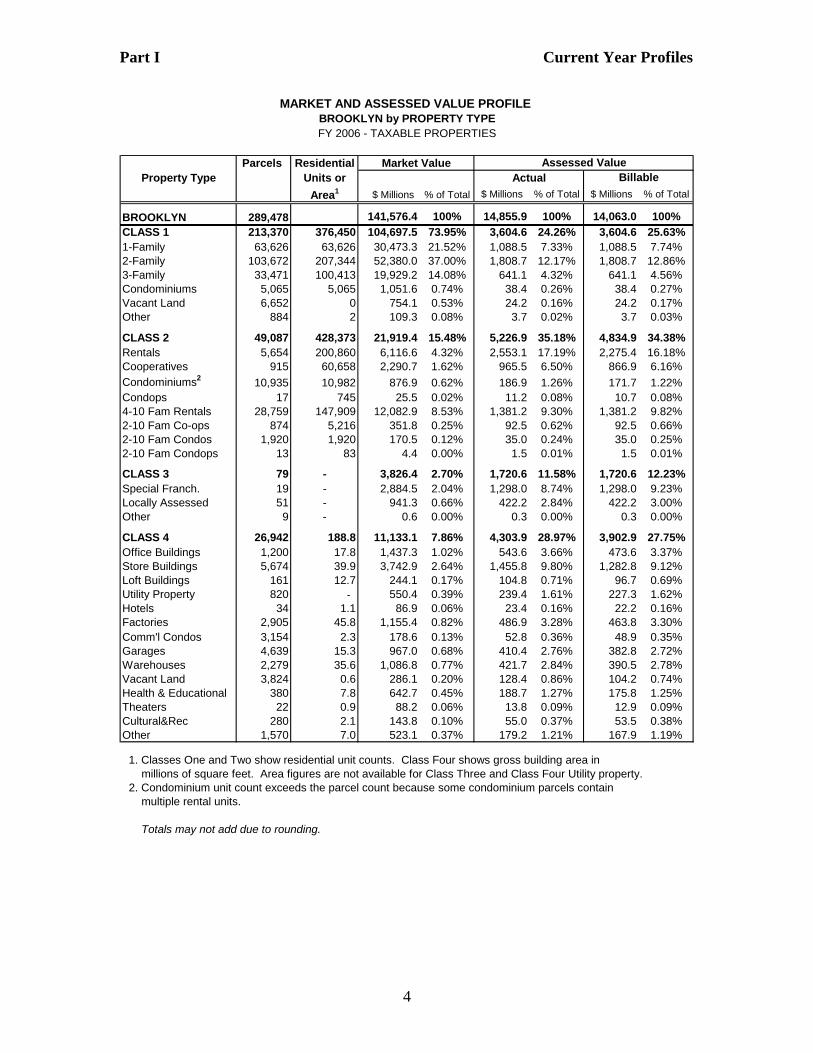
BROOKLYN 289,478 141,576.4 100% 14,855.9 100% 14,063.0 100%CLASS 1 213,370 376,450 104,697.5 73.95% 3,604.6 24.26% 3,604.6 25.63%1-Family 63,626 63,626 30,473.3 21.52% 1,088.5 7.33% 1,088.5 7.74%2-Family 103,672 207,344 52,380.0 37.00% 1,808.7 12.17% 1,808.7 12.86%3-Family 33,471 100,413 19,929.2 14.08% 641.1 4.32% 641.1 4.56%Condominiums 5,065 5,065 1,051.6 0.74% 38.4 0.26% 38.4 0.27%Vacant Land 6,652 0 754.1 0.53% 24.2 0.16% 24.2 0.17%Other 884 2 109.3 0.08% 3.7 0.02% 3.7 0.03%
CLASS 2 49,087 428,373 21,919.4 15.48% 5,226.9 35.18% 4,834.9 34.38%Rentals 5,654 200,860 6,116.6 4.32% 2,553.1 17.19% 2,275.4 16.18%Cooperatives 915 60,658 2,290.7 1.62% 965.5 6.50% 866.9 6.16%Condominiums2 10,935 10,982 876.9 0.62% 186.9 1.26% 171.7 1.22%Condops 17 745 25.5 0.02% 11.2 0.08% 10.7 0.08%4-10 Fam Rentals 28,759 147,909 12,082.9 8.53% 1,381.2 9.30% 1,381.2 9.82%2-10 Fam Co-ops 874 5,216 351.8 0.25% 92.5 0.62% 92.5 0.66%2-10 Fam Condos 1,920 1,920 170.5 0.12% 35.0 0.24% 35.0 0.25%2-10 Fam Condops 13 83 4.4 0.00% 1.5 0.01% 1.5 0.01%
CLASS 3 79 - 3,826.4 2.70% 1,720.6 11.58% 1,720.6 12.23%Special Franch. 19 - 2,884.5 2.04% 1,298.0 8.74% 1,298.0 9.23%Locally Assessed 51 - 941.3 0.66% 422.2 2.84% 422.2 3.00%Other 9 - 0.6 0.00% 0.3 0.00% 0.3 0.00%
CLASS 4 26,942 188.8 11,133.1 7.86% 4,303.9 28.97% 3,902.9 27.75%Office Buildings 1,200 17.8 1,437.3 1.02% 543.6 3.66% 473.6 3.37%Store Buildings 5,674 39.9 3,742.9 2.64% 1,455.8 9.80% 1,282.8 9.12%Loft Buildings 161 12.7 244.1 0.17% 104.8 0.71% 96.7 0.69%Utility Property 820 - 550.4 0.39% 239.4 1.61% 227.3 1.62%Hotels 34 1.1 86.9 0.06% 23.4 0.16% 22.2 0.16%Factories 2,905 45.8 1,155.4 0.82% 486.9 3.28% 463.8 3.30%Comm'l Condos 3,154 2.3 178.6 0.13% 52.8 0.36% 48.9 0.35%Garages 4,639 15.3 967.0 0.68% 410.4 2.76% 382.8 2.72%Warehouses 2,279 35.6 1,086.8 0.77% 421.7 2.84% 390.5 2.78%Vacant Land 3,824 0.6 286.1 0.20% 128.4 0.86% 104.2 0.74%Health & Educational 380 7.8 642.7 0.45% 188.7 1.27% 175.8 1.25%Theaters 22 0.9 88.2 0.06% 13.8 0.09% 12.9 0.09%Cultural&Rec 280 2.1 143.8 0.10% 55.0 0.37% 53.5 0.38%Other 1,570 7.0 523.1 0.37% 179.2 1.21% 167.9 1.19%
Billable
BROOKLYN by PROPERTY TYPEFY 2006 - TAXABLE PROPERTIES
Assessed Value
MARKET AND ASSESSED VALUE PROFILE
1. Classes One and Two show residential unit counts. Class Four shows gross building area in millions of square feet. Area figures are not available for Class Three and Class Four Utility property.2. Condominium unit count exceeds the parcel count because some condominium parcels contain multiple rental units.
Totals may not add due to rounding.
4

Part I Current Year Profiles
Parcels Residential Market ValueProperty Type Units or Actual
Area1 $ Millions % of Total $ Millions % of Total $ Millions % of Total
QUEENS 337,655 174,669.5 100% 19,567.8 100% 17,938.6 100%CLASS 1 286,501 413,236 135,735.7 77.71% 5,168.3 26.41% 5,168.3 28.81%1-Family 160,593 160,593 74,665.9 42.75% 2,794.4 14.28% 2,794.4 15.58%2-Family 89,907 179,814 44,916.1 25.71% 1,729.1 8.84% 1,729.1 9.64%3-Family 21,638 64,914 13,593.6 7.78% 535.4 2.74% 535.4 2.98%Condominiums 5,076 5,076 1,159.1 0.66% 57.3 0.29% 57.3 0.32%Vacant Land 7,781 0 853.6 0.49% 27.2 0.14% 27.2 0.15%Other 1,506 2,839 547.5 0.31% 24.9 0.13% 24.9 0.14%
CLASS 2 28,918 323,535 18,617.4 10.66% 6,126.9 31.31% 5,097.8 28.42%Rentals 2,827 142,268 5,726.8 3.28% 2,446.1 12.50% 2,145.0 11.96%Cooperatives 958 107,782 6,081.2 3.48% 2,546.4 13.01% 1,916.6 10.68%Condominiums 13,430 13,430 912.3 0.52% 343.8 1.76% 267.6 1.49%Condops 32 3,360 214.3 0.12% 90.0 0.46% 68.1 0.38%4-10 Fam Rentals 11,333 56,127 5,650.8 3.24% 691.9 3.54% 691.9 3.86%2-10 Fam Co-ops 32 255 15.9 0.01% 3.9 0.02% 3.9 0.02%2-10 Fam Condos 305 305 16.0 0.01% 4.6 0.02% 4.6 0.03%2-10 Fam Condops 1 8 0.4 0.00% 0.2 0.00% 0.2 0.00%
CLASS 3 118 - 4,712.0 2.70% 2,115.1 10.81% 2,115.1 11.79%Special Franch. 20 - 2,960.8 1.70% 1,332.3 6.81% 1,332.3 7.43%Locally Assessed 96 - 1,750.9 1.00% 782.6 4.00% 782.6 4.36%Other 2 - 0.3 0.00% 0.1 0.00% 0.1 0.00%
CLASS 4 22,118 173.1 15,604.4 8.93% 6,157.5 31.47% 5,557.3 30.98%Office Buildings 1,545 20.8 1,882.3 1.08% 719.0 3.67% 654.4 3.65%Store Buildings 5,826 45.2 5,888.4 3.37% 2,317.8 11.84% 2,001.3 11.16%Loft Buildings 16 .8 18.7 0.01% 7.5 0.04% 7.2 0.04%Utility Property 1,020 - 1,061.3 0.61% 472.0 2.41% 448.6 2.50%Hotels 88 3.0 407.2 0.23% 98.1 0.50% 92.7 0.52%Factories 1,872 37.1 1,344.0 0.77% 562.9 2.88% 526.0 2.93%Comm'l Condos 3,767 5.4 445.3 0.25% 123.9 0.63% 104.1 0.58%Garages 3,462 11.5 1,169.5 0.67% 509.4 2.60% 474.3 2.64%Warehouses 1,871 34.7 1,594.7 0.91% 645.4 3.30% 593.6 3.31%Vacant Land 1,577 0.2 249.3 0.14% 111.8 0.57% 92.2 0.51%Health & Educational 254 7.6 907.2 0.52% 357.1 1.82% 345.4 1.93%Theaters 20 0.8 80.5 0.05% 19.4 0.10% 16.9 0.09%Cultural&Rec 222 3.0 260.1 0.15% 101.4 0.52% 96.1 0.54%Other 578 3.0 295.9 0.17% 112.0 0.57% 104.5 0.58%
Billable
QUEENS by PROPERTY TYPEFY 2006 - TAXABLE PROPERTIES
Assessed Value
MARKET AND ASSESSED VALUE PROFILE
1. Classes One and Two show residential unit counts. Class Four shows gross building area in millions of square feet. Area figures are not available for Class Three and Class Four Utility property.
Totals may not add due to rounding.
5

Part I Current Year Profiles
Parcels Residential Market ValueProperty Type Units or Actual
Area1 $ Millions % of Total $ Millions % of Total $ Millions % of Total
STATEN ISLAND 128,575 52,177.5 100% 3,844.3 100% 3,697.2 100%CLASS 1 119,420 140,625 47,084.2 90.24% 1,864.3 48.50% 1,864.3 50.42%1-Family 75,656 75,656 31,127.3 59.66% 1,215.0 31.61% 1,215.0 32.86%2-Family 27,457 54,914 13,165.7 25.23% 529.8 13.78% 529.8 14.33%3-Family 908 2,724 394.6 0.76% 15.9 0.41% 15.9 0.43%Condominiums 7,331 7,331 1,201.3 2.30% 60.2 1.57% 60.2 1.63%Vacant Land 7,683 0 1,159.0 2.22% 42.0 1.09% 42.0 1.14%Other 385 0 36.2 0.07% 1.4 0.04% 1.4 0.04%
CLASS 2 3,719 19,051 910.8 1.75% 276.2 7.18% 235.2 6.36%Rentals 179 10,436 371.0 0.71% 149.7 3.89% 122.3 3.31%Cooperatives 28 2,026 80.7 0.15% 32.5 0.85% 26.7 0.72%Condominiums 2,642 2,642 108.4 0.21% 45.3 1.18% 37.7 1.02%Condops 0 0 0.0 0.00% 0.0 0.00% 0.0 0.00%4-10 Fam Rentals 864 3,904 347.8 0.67% 48.4 1.26% 48.4 1.31%2-10 Fam Co-ops 6 43 2.9 0.01% 0.2 0.01% 0.2 0.01%2-10 Fam Condos 0 0 0.0 0.00% 0.0 0.00% 0.0 0.00%2-10 Fam Condops 0 0 0.0 0.00% 0.0 0.00% 0.0 0.00%
CLASS 3 73 - 1,326.3 2.54% 596.8 15.53% 596.8 16.14%Special Franch. 10 - 760.3 1.46% 342.1 8.90% 342.1 9.25%Locally Assessed 62 - 565.6 1.08% 254.5 6.62% 254.5 6.88%Other 1 - 0.4 0.00% 0.2 0.00% 0.2 0.01%
CLASS 4 5,363 27.1 2,856.3 5.47% 1,107.0 28.80% 1,000.9 27.07%Office Buildings 673 4.4 366.0 0.70% 125.0 3.25% 111.2 3.01%Store Buildings 1,464 11.8 1,323.0 2.54% 531.1 13.81% 481.5 13.02%Loft Buildings 1 0.0 0.2 0.00% 0.1 0.00% 0.1 0.00%Utility Property 326 - 212.1 0.41% 93.5 2.43% 84.1 2.28%Hotels 11 0.3 35.4 0.07% 8.7 0.23% 7.9 0.21%Factories 87 1.4 67.7 0.13% 28.8 0.75% 27.3 0.74%Comm'l Condos 158 0.1 7.2 0.01% 3.3 0.08% 3.2 0.09%Garages 517 2.1 157.0 0.30% 62.6 1.63% 60.1 1.63%Warehouses 242 4.0 89.3 0.17% 32.1 0.84% 30.8 0.83%Vacant Land 1,450 0.1 314.0 0.60% 136.1 3.54% 111.7 3.02%Health & Educational 67 1.2 86.4 0.17% 35.2 0.92% 34.4 0.93%Theaters 5 0.2 22.6 0.04% 5.0 0.13% 4.9 0.13%Cultural&Rec 104 0.4 110.2 0.21% 17.7 0.46% 16.9 0.46%Other 258 1.1 65.2 0.12% 27.7 0.72% 26.8 0.72%
Billable
STATEN ISLAND by PROPERTY TYPEFY 2006 - TAXABLE PROPERTIES
Assessed Value
MARKET AND ASSESSED VALUE PROFILE
1. Classes One and Two show residential unit counts. Class Four shows gross building area in millions of square feet. Area figures are not available for Class Three and Class Four Utility property.
Totals may not add due to rounding.
6

Part I Current Year Profiles
# Parcels $ # Parcels $ # Parcels $ CITYWIDE 36,952 8,191,868,140 571,684 1,378,156,316 608,636 9,570,024,456
CLASS 1 6,851 22,910,143 497,572 238,857,098 504,423 261,767,241 1-Family 1,831 8,234,969 265,088 116,280,502 266,919 124,515,471 2-Family 1,606 4,963,358 175,963 86,322,230 177,569 91,285,588 3-Family 507 1,700,615 42,770 27,927,484 43,277 29,628,099 Condominiums 310 284,135 13,630 8,264,816 13,940 8,548,951 Vacant Land 2,553 7,631,563 70 48,507 2,623 7,680,070 Other 44 95,503 51 13,558 95 109,062
CLASS 2 6,414 985,545,484 65,714 646,874,726 72,128 1,632,420,210 Rentals 2,202 740,442,728 3,197 403,676,609 5,399 1,144,119,337 Cooperatives 168 192,595,681 4,552 75,002,600 4,720 267,598,280 Condominiums 3,337 35,196,341 48,218 121,354,223 51,555 156,550,564 Condops 7 5,353,543 205 9,394,939 212 14,748,482 4-10 Fam Rentals 646 8,719,696 5,907 27,569,823 6,553 36,289,519 2-10 Fam Co-ops 19 304,612 1,536 2,624,961 1,555 2,929,573 2-10 Fam Condos 34 2,920,464 2,057 6,623,677 2,091 9,544,140 2-10 Fam Condops 1 12,419 42 627,894 43 640,314
CLASS 3 97 127,146,420 12 918,685 109 128,065,105
CLASS 4 23,590 7,056,266,093 8,386 491,505,807 31,976 7,547,771,900 Office Buildings 459 408,912,278 846 146,768,164 1,305 555,680,442 Store Buildings 120 27,317,367 2,066 109,824,424 2,186 137,141,792 Loft Buildings 27 2,239,730 62 4,020,134 89 6,259,864 Utility Property 6,241 2,067,019,002 17 1,822,738 6,258 2,068,841,740 Hotels 86 69,802,007 112 46,769,471 198 116,571,478 Factories 222 26,151,171 526 12,604,845 748 38,756,016 Comm'l Condos 709 154,487,494 2,759 63,512,785 3,468 218,000,279 Garages 686 36,653,455 526 7,145,731 1,212 43,799,186 Warehouses 203 21,847,784 773 19,788,938 976 41,636,723 Vacant Land 1,943 100,826,739 58 2,244,844 2,001 103,071,583 Health&Educatn'l 2,862 1,671,993,265 194 40,844,126 3,056 1,712,837,391 Theaters 45 15,741,677 30 9,458,912 75 25,200,589 Cultural&Rec 2,063 973,314,966 80 10,055,324 2,143 983,370,290 Other 7,924 1,479,959,156 337 16,645,371 8,261 1,496,604,528
"TAX DOLLAR VALUE" OF
Fully Exempt Partially Exempt Total Exempt
REAL PROPERTY TAX EXEMPTIONS*CITYWIDE by PROPERTY TYPE
FY 2006
* Tax dollar value of exemption equals exempt property value times tax rate. The exempt property value is actual assessed value (or a portion of actual assessed value for partially exempt properties). Actual assessed value is the product of the assessment ratio applied to market value.
7

Part I Current Year Profiles
# Parcels $ # Parcels $ # Parcels $ MANHATTAN 9,139 3,363,735,220 35,523 724,965,210 44,662 4,088,700,430
CLASS 1 222 4,305,284 3,549 3,018,055 3,771 7,323,339 1-Family 63 3,584,634 1,120 619,168 1,183 4,203,802 2-Family 39 391,040 1,295 648,702 1,334 1,039,742 3-Family 43 212,204 976 1,659,191 1,019 1,871,396 Condominiums - - 158 90,993 158 90,993 Vacant Land 77 117,406 - - 77 117,406 Other - - - - - -
CLASS 2 4,248 483,844,162 30,182 470,073,933 34,430 953,918,095 Rentals 754 353,453,922 1,298 322,899,602 2,052 676,353,524 Cooperatives 71 83,495,326 2,387 40,174,824 2,458 123,670,150 Condominiums 3,219 34,737,305 23,889 84,095,072 27,108 118,832,378 Condops 6 5,274,836 158 8,581,633 164 13,856,469 4-10 Fam Rentals 174 3,885,811 957 10,323,035 1,131 14,208,846 2-10 Fam Co-ops 7 193,502 774 1,347,862 781 1,541,364 2-10 Fam Condos 17 2,803,459 687 2,031,762 704 4,835,221 2-10 Fam Condops - - 32 620,143 32 620,143
CLASS 3 1 125,160 5 105,143 6 230,303
CLASS 4 4,668 2,875,460,614 1,787 251,768,079 6,455 3,127,228,693 Office Buildings 221 326,337,098 198 109,126,711 419 435,463,809 Store Buildings 33 12,986,293 168 14,806,179 201 27,792,472 Loft Buildings 22 2,079,575 46 3,284,475 68 5,364,050 Utility Property 766 826,890,210 - - 766 826,890,210 Hotels 65 60,322,698 62 34,447,928 127 94,770,626 Factories 5 238,050 5 2,604,180 10 2,842,230 Comm'l Condos 609 124,038,357 1,130 53,361,814 1,739 177,400,171 Garages 72 10,607,033 22 513,568 94 11,120,601 Warehouses 11 1,786,336 8 1,178,474 19 2,964,810 Vacant Land 283 21,449,888 24 1,641,496 307 23,091,384 Health&Educatn'l 736 592,599,804 37 18,615,179 773 611,214,984 Theaters 37 13,028,875 12 4,069,239 49 17,098,114 Cultural&Rec 405 511,153,496 12 2,499,458 417 513,652,953 Other 1,403 371,942,900 63 5,619,378 1,466 377,562,278
"TAX DOLLAR VALUE" OF
Fully Exempt Partially Exempt Total Exempt
REAL PROPERTY TAX EXEMPTIONS*MANHATTAN by PROPERTY TYPE
FY 2006
* Tax dollar value of exemption equals exempt property value times tax rate. The exempt property value is actual assessed value (or a portion of actual assessed value for partially exempt properties). Actual assessed value is the product of the assessment ratio applied to market value.
8

Part I Current Year Profiles
# Parcels $ # Parcels $ # Parcels $ BRONX 5,727 961,032,539 57,735 125,945,995 63,462 1,086,978,534
CLASS 1 1,383 2,990,360 45,195 24,706,218 46,578 27,696,578 1-Family 302 751,577 17,838 7,462,099 18,140 8,213,676 2-Family 368 1,086,497 20,501 11,179,226 20,869 12,265,723 3-Family 187 668,974 5,819 5,039,253 6,006 5,708,228 Condominiums 197 183,329 1,024 1,022,308 1,221 1,205,636 Vacant Land 318 295,377 4 1,065 322 296,441 Other 11 4,606 9 2,267 20 6,873
CLASS 2 869 200,091,691 11,680 53,300,089 12,549 253,391,780 Rentals 705 161,917,509 1,146 40,695,674 1,851 202,613,183 Cooperatives 42 37,071,500 358 5,950,147 400 43,021,648 Condominiums 38 51,273 9,651 4,736,594 9,689 4,787,867 Condops - - 2 3,106 2 3,106 4-10 Fam Rentals 83 1,044,535 497 1,854,852 580 2,899,386 2-10 Fam Co-ops 1 6,874 20 58,320 21 65,194 2-10 Fam Condos - - 6 1,396 6 1,396 2-10 Fam Condops - - - - - -
CLASS 3 2 11,078,100 - - 2 11,078,100
CLASS 4 3,473 746,872,388 860 47,939,688 4,333 794,812,077 Office Buildings 48 8,899,563 107 8,085,221 155 16,984,783 Store Buildings 15 4,803,116 366 25,568,947 381 30,372,063 Loft Buildings 1 11,488 1 66,038 2 77,526 Utility Property 942 177,128,155 2 44,486 944 177,172,641 Hotels - - 5 435,442 5 435,442 Factories 33 8,545,945 56 1,329,963 89 9,875,908 Comm'l Condos 10 435,807 5 515,065 15 950,871 Garages 130 9,387,989 120 1,163,878 250 10,551,867 Warehouses 34 3,923,452 88 2,294,092 122 6,217,543 Vacant Land 310 3,364,856 9 21,456 319 3,386,312 Health&Educatn'l 467 302,936,231 35 4,827,951 502 307,764,183 Theaters - - - - - - Cultural&Rec 386 80,133,492 22 1,171,611 408 81,305,103 Other 1,097 147,302,295 44 2,415,539 1,141 149,717,834
"TAX DOLLAR VALUE" OF
Fully Exempt Partially Exempt Total Exempt
REAL PROPERTY TAX EXEMPTIONS*BRONX by PROPERTY TYPE
FY 2006
* Tax dollar value of exemption equals exempt property value times tax rate. The exempt property value is actual assessed value (or a portion of actual assessed value for partially exempt properties). Actual assessed value is the product of the assessment ratio applied to market value.
9

Part I Current Year Profiles
# Parcels $ # Parcels $ # Parcels $ BROOKLYN 10,310 1,408,190,939 163,173 215,875,517 173,483 1,624,066,457
CLASS 1 2,375 5,762,603 147,494 69,404,201 149,869 75,166,804 1-Family 593 1,391,533 50,534 21,281,361 51,127 22,672,894 2-Family 926 2,612,967 71,556 32,315,056 72,482 34,928,023 3-Family 248 704,338 21,738 12,077,952 21,986 12,782,289 Condominiums 25 26,418 3,628 3,706,391 3,653 3,732,808 Vacant Land 566 957,765 26 19,473 592 977,238 Other 17 69,583 12 3,969 29 73,551
CLASS 2 1,136 216,617,826 12,881 68,322,771 14,017 284,940,597 Rentals 639 170,815,405 589 23,254,686 1,228 194,070,092 Cooperatives 40 41,569,539 832 7,446,519 872 49,016,058 Condominiums 62 373,939 6,437 24,650,727 6,499 25,024,666 Condops 1 78,706 15 29,190 16 107,897 4-10 Fam Rentals 365 3,546,574 3,080 7,585,412 3,445 11,131,986 2-10 Fam Co-ops 11 104,237 705 1,029,298 716 1,133,535 2-10 Fam Condos 17 117,004 1,213 4,319,188 1,230 4,436,193 2-10 Fam Condops 1 12,419 10 7,751 11 20,171
CLASS 3 4 19,468,210 3 164,177 7 19,632,387
CLASS 4 6,795 1,166,342,300 2,795 77,984,368 9,590 1,244,326,668 Office Buildings 112 48,902,911 222 11,447,816 334 60,350,727 Store Buildings 46 6,341,252 623 25,232,625 669 31,573,877 Loft Buildings 4 148,668 13 567,612 17 716,280 Utility Property 1,842 381,191,196 11 932,937 1,853 382,124,133 Hotels 17 5,834,742 8 1,773,606 25 7,608,348 Factories 94 4,253,771 257 3,555,347 351 7,809,118 Comm'l Condos 44 28,699,221 880 3,080,375 924 31,779,595 Garages 253 7,817,313 172 2,783,054 425 10,600,367 Warehouses 69 6,533,332 338 7,166,732 407 13,700,064 Vacant Land 528 18,613,023 15 36,675 543 18,649,697 Health&Educatn'l 927 334,721,641 77 11,304,724 1,004 346,026,365 Theaters 5 1,273,050 8 2,883,302 13 4,156,352 Cultural&Rec 539 110,143,880 19 1,088,191 558 111,232,071 Other 2,315 211,868,301 152 6,131,373 2,467 217,999,674
"TAX DOLLAR VALUE" OF
Fully Exempt Partially Exempt Total Exempt
REAL PROPERTY TAX EXEMPTIONS*BROOKLYN by PROPERTY TYPE
FY 2006
* Tax dollar value of exemption equals exempt property value times tax rate. The exempt property value is actual assessed value (or a portion of actual assessed value for partially exempt properties). Actual assessed value is the product of the assessment ratio applied to market value.
10

Part I Current Year Profiles
# Parcels $ # Parcels $ # Parcels $ QUEENS 7,567 2,082,818,086 220,840 240,176,965 228,407 2,322,995,051
CLASS 1 1,686 5,978,738 208,686 93,856,123 210,372 99,834,861 1-Family 703 1,996,405 130,008 53,991,596 130,711 55,988,001 2-Family 235 755,196 61,378 29,049,553 61,613 29,804,748 3-Family 27 107,536 13,836 9,008,251 13,863 9,115,787 Condominiums 60 60,057 3,436 1,792,622 3,496 1,852,679 Vacant Land 647 3,039,900 6 8,550 653 3,048,450 Other 14 19,645 22 5,551 36 25,196
CLASS 2 111 75,162,198 9,731 52,207,393 9,842 127,369,591 Rentals 76 44,511,496 147 14,952,642 223 59,464,138 Cooperatives 15 30,459,315 948 20,928,225 963 51,387,540 Condominiums 5 12,926 7,109 7,483,035 7,114 7,495,961 Condops - - 30 781,010 30 781,010 4-10 Fam Rentals 15 178,461 1,314 7,721,112 1,329 7,899,573 2-10 Fam Co-ops - - 32 70,037 32 70,037 2-10 Fam Condos - - 151 271,331 151 271,331 2-10 Fam Condops - - - - - -
CLASS 3 85 95,985,021 4 649,365 89 96,634,386
CLASS 4 5,685 1,905,692,128 2,419 93,464,085 8,104 1,999,156,213 Office Buildings 55 18,628,475 196 13,680,033 251 32,308,508 Store Buildings 25 3,162,038 687 36,545,550 712 39,707,588 Loft Buildings - - 2 102,008 2 102,008 Utility Property 1,947 570,080,342 2 632,187 1,949 570,712,530 Hotels 3 3,123,586 36 9,285,236 39 12,408,822 Factories 87 9,333,898 196 4,915,168 283 14,249,066 Comm'l Condos 43 1,311,933 742 6,555,107 785 7,867,040 Garages 221 7,725,295 142 1,792,174 363 9,517,469 Warehouses 85 9,480,891 296 8,250,020 381 17,730,911 Vacant Land 443 41,503,075 4 44,493 447 41,547,568 Health&Educatn'l 543 333,570,590 32 5,723,307 575 339,293,897 Theaters 3 1,439,751 7 1,914,919 10 3,354,670 Cultural&Rec 538 221,794,364 20 1,695,662 558 223,490,026 Other 1,692 684,537,889 57 2,328,220 1,749 686,866,110
"TAX DOLLAR VALUE" OF
Fully Exempt Partially Exempt Total Exempt
REAL PROPERTY TAX EXEMPTIONS*QUEENS by PROPERTY TYPE
FY 2006
* Tax dollar value of exemption equals exempt property value times tax rate. The exempt property value is actual assessed value (or a portion of actual assessed value for partially exempt properties). Actual assessed value is the product of the assessment ratio applied to market value.
11

Part I Current Year Profiles
# Parcels $ # Parcels $ # Parcels $ STATEN ISLAND 4,207 376,091,356 94,413 71,192,627 98,620 447,283,983
CLASS 1 1,185 3,873,158 92,648 47,872,501 93,833 51,745,659 1-Family 170 510,820 65,588 32,926,279 65,758 33,437,099 2-Family 38 117,659 21,233 13,129,693 21,271 13,247,352 3-Family 2 7,563 401 142,836 403 150,399 Condominiums 28 14,331 5,384 1,652,502 5,412 1,666,833 Vacant Land 945 3,221,116 34 19,419 979 3,240,535 Other 2 1,670 8 1,771 10 3,441
CLASS 2 50 9,829,607 1,240 2,970,540 1,290 12,800,147 Rentals 28 9,744,395 17 1,874,005 45 11,618,400 Cooperatives - - 27 502,884 27 502,884 Condominiums 13 20,897 1,132 388,795 1,145 409,692 Condops - - - - - - 4-10 Fam Rentals 9 64,315 59 85,412 68 149,727 2-10 Fam Co-ops - - 5 119,444 5 119,444 2-10 Fam Condos - - - - - - 2-10 Fam Condops - - - - - -
CLASS 3 3 489,929 - - 3 489,929
CLASS 4 2,969 361,898,662 525 20,349,587 3,494 382,248,249 Office Buildings 23 6,144,231 123 4,428,383 146 10,572,614 Store Buildings 1 24,668 222 7,671,123 223 7,695,791 Loft Buildings - - - - - - Utility Property 744 111,729,098 2 213,129 746 111,942,227 Hotels 1 520,980 1 827,260 2 1,348,241 Factories 3 3,779,507 12 200,186 15 3,979,693 Comm'l Condos 3 2,177 2 425 5 2,602 Garages 10 1,115,824 70 893,058 80 2,008,882 Warehouses 4 123,774 43 899,621 47 1,023,394 Vacant Land 379 15,895,898 6 500,724 385 16,396,622 Health&Educatn'l 189 108,164,999 13 372,964 202 108,537,963 Theaters - - 3 591,452 3 591,452 Cultural&Rec 195 50,089,735 7 3,600,401 202 53,690,137 Other 1,417 64,307,771 21 150,861 1,438 64,458,632
"TAX DOLLAR VALUE" OF
Fully Exempt Partially Exempt Total Exempt
REAL PROPERTY TAX EXEMPTIONS*STATEN ISLAND by PROPERTY TYPE
FY 2006
* Tax dollar value of exemption equals exempt property value times tax rate. The exempt property value is actual assessed value (or a portion of actual assessed value for partially exempt properties). Actual assessed value is the product of the assessment ratio applied to market value.
12

Part I Current Year Profiles
TYPE Number % of Total Amount % of Total($ millions)
CITYWIDE TOTAL 705,216 100% 82,630.8 100%PUBLIC PROPERTY 20,171 2.9% 56,161.1 68.0%GOVERNMENT 10,898 1.55% 36,536.7 44.22%
New York City 9,137 1.30% 32,612.7 39.47%New York State 1,182 0.17% 1,202.6 1.46%U.S. Government 285 0.04% 2,181.7 2.64%Foreign Governments 294 0.04% 539.7 0.65%
PUBLIC AUTHORITIES 9,273 1.31% 19,624.4 23.75%Battery Park City Authority 2,467 0.35% 1,528.1 1.85%Economic Development Corporation 214 0.03% 169.1 0.20%Industrial Development Agency 679 0.10% 1,232.1 1.49%Metropolitan Transportation Authority 3,622 0.51% 7,101.7 8.59%Nat'l Passenger Rail Corp.- AMTRAK 434 0.06% 484.0 0.59%NYC Educational Construction Fund 43 0.01% 510.2 0.62%NYC Housing Authority 1,374 0.19% 3,044.3 3.68%NYS Dormitory Authority 166 0.02% 1,129.0 1.37%NYS Urban Development Corporation 76 0.01% 1,620.2 1.96%Port Authority of NY & NJ 164 0.02% 1,852.2 2.24%Port Authority Trans-Hudson Railroad 14 0.00% 27.9 0.03%Power Authority of the State of NY 20 0.00% 925.6 1.12%
REAL PROPERTY TAX EXEMPTIONSCITYWIDE by EXEMPTION TYPE
FY 2006EXEMPTIONS EXEMPT VALUE
Citywide Exempt Values
Government44.2%
Public Authorities23.7%
Individual Assistance2.1%
Institutional14.8%
Comm'l/Ind'l4.5%Residential
10.7%
13

Part I Current Year Profiles
TYPE Number % of Total Amount % of Total($ millions)
PRIVATE PROPERTY 685,045 97.1% 26,469.7 32.0%INSTITUTIONAL 14,864 2.11% 12,197.9 14.76%
Cemeteries 185 0.03% 422.6 0.51%Charitable 2,258 0.32% 1,149.4 1.39%Cultural Institutions 360 0.05% 631.3 0.76%Educational Facilities 1,025 0.15% 2,546.8 3.08%Medical Care 1,211 0.17% 3,470.9 4.20%Religious 9,485 1.34% 3,740.6 4.53%Special Interest 340 0.05% 236.2 0.29%
RESIDENTIAL 63,135 8.95% 8,850.6 10.71%Fall Out Shelters 3 0.00% 0.0 0.00%Housing Development Fund Companies 319 0.05% 510.5 0.62%HPD Div. of Alternative Management(DAMP) 934 0.13% 105.2 0.13%J-51 Exemption 13,961 1.98% 863.4 1.04%Limited Dividend Companies 11 0.00% 41.1 0.05%Ltd Profit Housing Companies/Mitchell-Lama 338 0.05% 2,213.5 2.68%New Multiple Dwellings - 421a 21,369 3.03% 3,286.2 3.98%New Multiple Dwellings - 421b 14,332 2.03% 173.2 0.21%Redevelopment Companies 432 0.06% 629.5 0.76%Residential Conv. Lower Manhattan 246 0.03% 308.1 0.37%Special Incentive Programs 509 0.07% 111.3 0.13%State Assisted Private Housing 78 0.01% 184.0 0.22%Urban Development Action Area Projects 10,048 1.42% 164.3 0.20%420-c Low-Income Housing 555 0.08% 260.4 0.32%
COMMERCIAL/INDUSTRIAL 5,702 0.81% 3,726.8 4.51%Environmental Protection Exemption 7 0.00% 0.1 0.00%Industrial & Commercial Incentive Board 13 0.00% 4.0 0.00%Industrial & Commercial Incentive Program 5,540 0.79% 3,521.7 4.26%Industrial Waste Facility 19 0.00% 7.1 0.01%Jamaica Water Supply 121 0.02% 91.0 0.11%Madison Square Garden 1 0.00% 102.8 0.12%Mixed-Use Lower Manhattan 1 0.00% 0.2 0.00%
INDIVIDUAL ASSISTANCE 601,344 85.27% 1,694.4 2.05%Crime Victims 1 0.00% 0.0 0.00%Disabled Homeowner 1,013 0.14% 9.1 0.01%School Tax Relief 514,654 72.98% 1,112.4 1.35%Senior Citizen Homeowner 28,764 4.08% 284.8 0.34%Veterans Exemption 56,912 8.07% 288.1 0.35%
REAL PROPERTY TAX EXEMPTIONSCITYWIDE by EXEMPTION TYPE
FY 2006EXEMPTIONS EXEMPT VALUE
14

Part I Current Year Profiles
TYPE Number % of Total Amount % of Total($ millions)
BOROUGH TOTAL 49,733 100% 35,403.7 100%PUBLIC PROPERTY 5,363 10.8% 22,384.4 63.2%GOVERNMENT 1,626 3.27% 12,654.5 35.74%
New York City 1,215 2.44% 10,735.5 30.32%New York State 79 0.16% 472.8 1.34%U.S. Government 55 0.11% 915.2 2.59%Foreign Governments 277 0.56% 531.0 1.50%
PUBLIC AUTHORITIES 3,737 7.51% 9,729.8 27.48%Battery Park City Authority 2,467 4.96% 1,528.1 4.32%Economic Development Corporation 1 0.00% 0.0 0.00%Industrial Development Agency 276 0.55% 788.7 2.23%Metropolitan Transportation Authority 317 0.64% 2,955.2 8.35%Nat'l Passenger Rail Corp.- AMTRAK 179 0.36% 308.1 0.87%NYC Educational Construction Fund 14 0.03% 227.5 0.64%NYC Housing Authority 297 0.60% 1,203.0 3.40%NYS Dormitory Authority 37 0.07% 507.6 1.43%NYS Urban Development Corporation 56 0.11% 1,491.2 4.21%Port Authority of NY & NJ 78 0.16% 664.6 1.88%Port Authority Trans-Hudson Railroad 12 0.02% 27.8 0.08%Power Authority of the State of NY 3 0.01% 27.9 0.08%
REAL PROPERTY TAX EXEMPTIONSManhattan by Exemption Type
FY 2006EXEMPTIONS EXEMPT VALUE
Manhattan Exempt Values
Government35.7%
Public Authorities27.5%
Individual Assistance0.8%
Institutional17.7%
Comm'l/Ind'l4.3%Residential
13.9%
15

Part I Current Year Profiles
TYPE Number % of Total Amount % of Total($ millions)
PRIVATE PROPERTY 44,370 89.2% 13,019.4 36.8%INSTITUTIONAL 3,695 7.43% 6,282.0 17.74%
Cemeteries 7 0.01% 5.7 0.02%Charitable 630 1.27% 621.9 1.76%Cultural Institutions 338 0.68% 622.4 1.76%Educational Facilities 742 1.49% 1,639.3 4.63%Medical Care 610 1.23% 2,022.8 5.71%Religious 1,283 2.58% 1,236.7 3.49%Special Interest 85 0.17% 133.2 0.38%
RESIDENTIAL 10,294 20.70% 4,935.4 13.94%Housing Development Fund Companies 76 0.15% 165.6 0.47%HPD Div. of Alternative Management(DAMP) 473 0.95% 73.4 0.21%J-51 Exemption 1,632 3.28% 307.2 0.87%Limited Dividend Companies 2 0.00% 29.9 0.08%Ltd Profit Housing Companies/Mitchell-Lama 82 0.16% 862.9 2.44%New Multiple Dwellings - 421a 6,378 12.82% 2,623.2 7.41%New Multiple Dwellings - 421b 22 0.04% 1.1 0.00%Redevelopment Companies 108 0.22% 286.7 0.81%Residential Conv. Lower Manhattan 246 0.49% 308.1 0.87%Special Incentive Programs 149 0.30% 44.1 0.12%State Assisted Private Housing 37 0.07% 69.5 0.20%Urban Development Action Area Projects 910 1.83% 37.6 0.11%420-c Low-Income Housing 179 0.36% 126.1 0.36%
COMMERCIAL/INDUSTRIAL 882 1.77% 1,528.3 4.32%Industrial & Commercial Incentive Program 875 1.76% 1,424.4 4.02%Industrial Waste Facility 5 0.01% 0.9 0.00%Madison Square Garden 1 0.00% 102.8 0.29%Mixed-Use Lower Manhattan 1 0.00% 0.2 0.00%
INDIVIDUAL ASSISTANCE 29,499 59.31% 273.7 0.77%Disabled Homeowner 32 0.06% 0.6 0.00%School Tax Relief 26,498 53.28% 187.9 0.53%Senior Citizen Homeowner 547 1.10% 17.0 0.05%Veterans Exemption 2,422 4.87% 68.3 0.19%
REAL PROPERTY TAX EXEMPTIONSManhattan by Exemption Type
FY 2006EXEMPTIONS EXEMPT VALUE
16

Part I Current Year Profiles
TYPE Number % of Total Amount % of Total($ millions)
BOROUGH TOTAL 73,479 100% 9,340.0 100%PUBLIC PROPERTY 2,574 3.5% 6,015.6 64.4%GOVERNMENT 1,659 2.26% 4,334.5 46.41%
New York City 1,501 2.04% 3,876.4 41.50%New York State 112 0.15% 209.4 2.24%U.S. Government 39 0.05% 240.5 2.57%Foreign Governments 7 0.01% 8.3 0.09%
PUBLIC AUTHORITIES 915 1.25% 1,681.0 18.00%Economic Development Corporation 6 0.01% 2.9 0.03%Industrial Development Agency 57 0.08% 84.8 0.91%Metropolitan Transportation Authority 379 0.52% 564.9 6.05%Nat'l Passenger Rail Corp.- AMTRAK 133 0.18% 29.5 0.32%NYC Educational Construction Fund 14 0.02% 35.7 0.38%NYC Housing Authority 263 0.36% 721.7 7.73%NYS Dormitory Authority 48 0.07% 109.2 1.17%NYS Urban Development Corporation 8 0.01% 39.0 0.42%Port Authority of NY & NJ 2 0.00% 2.9 0.03%Power Authority of the State of NY 5 0.01% 90.4 0.97%
REAL PROPERTY TAX EXEMPTIONSBronx by Exemption Type
FY 2006EXEMPTIONS EXEMPT VALUE
Bronx Exempt Values
Government46.4%
Public Authorities18.0%
Individual Assistance1.4%
Institutional14.6%
Residential15.5%
Comm'l/Ind'l4.0%
17

Part I Current Year Profiles
TYPE Number % of Total Amount % of Total($ millions)
PRIVATE PROPERTY 70,905 96.5% 3,324.5 35.6%INSTITUTIONAL 1,843 2.51% 1,364.5 14.61%
Cemeteries 23 0.03% 35.2 0.38%Charitable 387 0.53% 152.9 1.64%Cultural Institutions 3 0.00% 0.9 0.01%Educational Facilities 80 0.11% 352.6 3.77%Medical Care 137 0.19% 414.8 4.44%Religious 1,182 1.61% 388.8 4.16%Special Interest 31 0.04% 19.3 0.21%
RESIDENTIAL 15,410 20.97% 1,451.7 15.54%Housing Development Fund Companies 92 0.13% 132.2 1.42%HPD Div. of Alternative Management(DAMP) 253 0.34% 20.6 0.22%J-51 Exemption 9,601 13.07% 298.7 3.20%Ltd Profit Housing Companies/Mitchell-Lama 102 0.14% 523.2 5.60%New Multiple Dwellings - 421a 1,489 2.03% 95.6 1.02%New Multiple Dwellings - 421b 1,052 1.43% 14.0 0.15%Redevelopment Companies 173 0.24% 171.9 1.84%Special Incentive Programs 197 0.27% 43.8 0.47%State Assisted Private Housing 18 0.02% 42.6 0.46%Urban Development Action Area Projects 2,311 3.15% 39.7 0.42%420-c Low-Income Housing 122 0.17% 69.4 0.74%
COMMERCIAL/INDUSTRIAL 745 1.01% 376.0 4.03%Industrial & Commercial Incentive Program 745 1.01% 376.0 4.03%
INDIVIDUAL ASSISTANCE 52,907 72.00% 132.3 1.42%Disabled Homeowner 94 0.13% 0.6 0.01%School Tax Relief 45,408 61.80% 91.2 0.98%Senior Citizen Homeowner 2,939 4.00% 23.5 0.25%Veterans Exemption 4,466 6.08% 16.9 0.18%
REAL PROPERTY TAX EXEMPTIONSBronx by Exemption Type
FY 2006EXEMPTIONS EXEMPT VALUE
18

Part I Current Year Profiles
TYPE Number % of Total Amount % of Total($ millions)
BOROUGH TOTAL 199,410 100% 13,941.4 100%PUBLIC PROPERTY 4,472 2.2% 9,288.6 66.6%GOVERNMENT 2,311 1.16% 6,475.7 46.45%
New York City 2,140 1.07% 5,807.9 41.66%New York State 100 0.05% 209.4 1.50%U.S. Government 71 0.04% 458.4 3.29%
PUBLIC AUTHORITIES 2,161 1.08% 2,812.9 20.18%Economic Development Corporation 36 0.02% 128.2 0.92%Industrial Development Agency 183 0.09% 144.2 1.03%Metropolitan Transportation Authority 1,416 0.71% 1,406.9 10.09%NYC Educational Construction Fund 10 0.01% 23.4 0.17%NYC Housing Authority 482 0.24% 829.2 5.95%NYS Dormitory Authority 13 0.01% 87.8 0.63%NYS Urban Development Corporation 8 0.00% 64.2 0.46%Port Authority of NY & NJ 8 0.00% 61.1 0.44%Port Authority Trans-Hudson Railroad 2 0.00% 0.1 0.00%Power Authority of the State of NY 3 0.00% 67.9 0.49%
REAL PROPERTY TAX EXEMPTIONSBrooklyn by Exemption Type
FY 2006EXEMPTIONS EXEMPT VALUE
Brooklyn Exempt Values
Government46.4%
Public Authorities20.2%
Individual Assistance2.8%
Institutional14.4%
Comm'l/Ind'l4.8%Residential
11.3%
19

Part I Current Year Profiles
TYPE Number % of Total Amount % of Total($ millions)
PRIVATE PROPERTY 194,938 97.8% 4,652.8 33.4%INSTITUTIONAL 5,234 2.62% 2,008.4 14.41%
Cemeteries 30 0.02% 95.8 0.69%Charitable 628 0.31% 206.8 1.48%Cultural Institutions 6 0.00% 2.9 0.02%Educational Facilities 106 0.05% 203.2 1.46%Medical Care 256 0.13% 472.0 3.39%Religious 4,129 2.07% 1,000.6 7.18%Special Interest 79 0.04% 27.0 0.19%
RESIDENTIAL 18,853 9.45% 1,580.0 11.33%Fall Out Shelters 1 0.00% 0.0 0.00%Housing Development Fund Companies 126 0.06% 154.4 1.11%HPD Div. of Alternative Management(DAMP) 201 0.10% 10.8 0.08%J-51 Exemption 2,553 1.28% 188.6 1.35%Limited Dividend Companies 9 0.00% 11.2 0.08%Ltd Profit Housing Companies/Mitchell-Lama 107 0.05% 551.6 3.96%New Multiple Dwellings - 421a 8,244 4.13% 315.7 2.26%New Multiple Dwellings - 421b 1,017 0.51% 16.4 0.12%Redevelopment Companies 135 0.07% 138.2 0.99%Special Incentive Programs 152 0.08% 16.6 0.12%State Assisted Private Housing 15 0.01% 46.7 0.33%Urban Development Action Area Projects 6,046 3.03% 73.0 0.52%420-c Low-Income Housing 247 0.12% 56.9 0.41%
COMMERCIAL/INDUSTRIAL 1,725 0.87% 667.3 4.79%Environmental Protection Exemption 2 0.00% 0.1 0.00%Industrial & Commercial Incentive Board 6 0.00% 0.0 0.00%Industrial & Commercial Incentive Program 1,710 0.86% 666.8 4.78%Industrial Waste Facility 7 0.00% 0.4 0.00%
INDIVIDUAL ASSISTANCE 169,126 84.81% 397.1 2.85%Disabled Homeowner 270 0.14% 2.5 0.02%School Tax Relief 148,232 74.34% 271.3 1.95%Senior Citizen Homeowner 8,056 4.04% 76.8 0.55%Veterans Exemption 12,568 6.30% 46.5 0.33%
REAL PROPERTY TAX EXEMPTIONSBrooklyn by Exemption Type
FY 2006EXEMPTIONS EXEMPT VALUE
20

Part I Current Year Profiles
TYPE Number % of Total Amount % of Total($ millions)
BOROUGH TOTAL 267,982 100% 20,128.8 100%PUBLIC PROPERTY 4,420 1.6% 15,758.9 78.3%GOVERNMENT 2,541 0.95% 11,049.2 54.89%
New York City 2,212 0.83% 10,338.9 51.36%New York State 220 0.08% 217.8 1.08%U.S. Government 99 0.04% 492.1 2.44%Foreign Governments 10 0.00% 0.4 0.00%
PUBLIC AUTHORITIES 1,879 0.70% 4,709.7 23.40%Economic Development Corporation 16 0.01% 11.4 0.06%Industrial Development Agency 157 0.06% 182.3 0.91%Metropolitan Transportation Authority 1,179 0.44% 1,973.5 9.80%Nat'l Passenger Rail Corp.- AMTRAK 122 0.05% 146.4 0.73%NYC Educational Construction Fund 2 0.00% 9.3 0.05%NYC Housing Authority 317 0.12% 243.2 1.21%NYS Dormitory Authority 62 0.02% 391.2 1.94%NYS Urban Development Corporation 3 0.00% 0.3 0.00%Port Authority of NY & NJ 14 0.01% 1,013.4 5.03%Power Authority of the State of NY 7 0.00% 738.6 3.67%
REAL PROPERTY TAX EXEMPTIONSQueens by Exemption Type
FY 2006EXEMPTIONS EXEMPT VALUE
Queens Exempt Values
Government54.9%
Public Authorities23.4%
Individual Assistance3.4%
Institutional9.7%
Comm'l/Ind'l5.0%
Residential3.6%
21

Part I Current Year Profiles
TYPE Number % of Total Amount % of Total($ millions)
PRIVATE PROPERTY 263,562 98.4% 4,369.9 21.7%INSTITUTIONAL 3,216 1.20% 1,952.5 9.70%
Cemeteries 81 0.03% 209.5 1.04%Charitable 410 0.15% 104.9 0.52%Cultural Institutions 11 0.00% 5.0 0.02%Educational Facilities 57 0.02% 292.0 1.45%Medical Care 174 0.06% 429.8 2.14%Religious 2,393 0.89% 879.0 4.37%Special Interest 90 0.03% 32.3 0.16%
RESIDENTIAL 7,655 2.86% 718.2 3.57%Fall Out Shelters 2 0.00% 0.0 0.00%Housing Development Fund Companies 20 0.01% 48.0 0.24%HPD Div. of Alternative Management(DAMP) 7 0.00% 0.4 0.00%J-51 Exemption 172 0.06% 63.5 0.32%Ltd Profit Housing Companies/Mitchell-Lama 42 0.02% 262.9 1.31%New Multiple Dwellings - 421a 4,538 1.69% 237.4 1.18%New Multiple Dwellings - 421b 2,089 0.78% 32.3 0.16%Redevelopment Companies 8 0.00% 28.0 0.14%Special Incentive Programs 11 0.00% 6.8 0.03%State Assisted Private Housing 7 0.00% 23.3 0.12%Urban Development Action Area Projects 756 0.28% 13.7 0.07%420-c Low-Income Housing 3 0.00% 1.9 0.01%
COMMERCIAL/INDUSTRIAL 1,852 0.69% 1,006.2 5.00%Industrial & Commercial Incentive Board 6 0.00% 2.1 0.01%Industrial & Commercial Incentive Program 1,720 0.64% 907.4 4.51%Industrial Waste Facility 5 0.00% 5.7 0.03%Jamaica Water Supply 121 0.05% 91.0 0.45%
INDIVIDUAL ASSISTANCE 250,839 93.60% 693.0 3.44%Crime Victims 1 0.00% 0.0 0.00%Disabled Homeowner 417 0.16% 3.9 0.02%School Tax Relief 211,875 79.06% 433.0 2.15%Senior Citizen Homeowner 13,919 5.19% 142.6 0.71%Veterans Exemption 24,627 9.19% 113.5 0.56%
REAL PROPERTY TAX EXEMPTIONSQueens by Exemption Type
FY 2006EXEMPTIONS EXEMPT VALUE
22

Part I Current Year Profiles
TYPE Number % of Total Amount % of Total($ millions)
BOROUGH TOTAL 114,612 100% 3,816.8 100%PUBLIC PROPERTY 3,342 2.9% 2,713.7 71.1%GOVERNMENT 2,761 2.41% 2,022.7 52.99%
New York City 2,069 1.81% 1,854.0 48.57%New York State 671 0.59% 93.2 2.44%U.S. Government 21 0.02% 75.6 1.98%
PUBLIC AUTHORITIES 581 0.51% 691.0 18.10%Economic Development Corporation 155 0.14% 26.5 0.69%Industrial Development Agency 6 0.01% 32.2 0.84%Metropolitan Transportation Authority 331 0.29% 201.2 5.27%NYC Educational Construction Fund 3 0.00% 214.2 5.61%NYC Housing Authority 15 0.01% 47.1 1.23%NYS Dormitory Authority 6 0.01% 33.3 0.87%NYS Urban Development Corporation 1 0.00% 25.5 0.67%Port Authority of NY & NJ 62 0.05% 110.1 2.89%Power Authority of the State of NY 2 0.00% 0.8 0.02%
REAL PROPERTY TAX EXEMPTIONSStaten Island by Exemption Type
FY 2006EXEMPTIONS EXEMPT VALUE
Staten Island Exempt Values
Government53.0%
Public Authorities18.1%
Individual Assistance5.2%
Institutional15.5%
Residential4.3%
Comm'l/Ind'l3.9%
23

Part I Current Year Profiles
TYPE Number % of Total Amount % of Total($ millions)
PRIVATE PROPERTY 111,270 97.1% 1,103.1 28.9%INSTITUTIONAL 876 0.76% 590.5 15.47%
Cemeteries 44 0.04% 76.4 2.00%Charitable 203 0.18% 62.9 1.65%Cultural Institutions 2 0.00% 0.1 0.00%Educational Facilities 40 0.03% 59.8 1.57%Medical Care 34 0.03% 131.4 3.44%Religious 498 0.43% 235.4 6.17%Special Interest 55 0.05% 24.3 0.64%
RESIDENTIAL 10,923 9.53% 165.4 4.33%Housing Development Fund Companies 5 0.00% 10.2 0.27%J-51 Exemption 3 0.00% 5.4 0.14%Ltd Profit Housing Companies/Mitchell-Lama 5 0.00% 12.9 0.34%New Multiple Dwellings - 421a 720 0.63% 14.3 0.37%New Multiple Dwellings - 421b 10,152 8.86% 109.3 2.86%Redevelopment Companies 8 0.01% 4.8 0.13%State Assisted Private Housing 1 0.00% 1.9 0.05%Urban Development Action Area Projects 25 0.02% 0.3 0.01%420-c Low-Income Housing 4 0.00% 6.1 0.16%
COMMERCIAL/INDUSTRIAL 498 0.43% 149.0 3.90%Environmental Protection Exemption 5 0.00% 0.0 0.00%Industrial & Commercial Incentive Board 1 0.00% 1.9 0.05%Industrial & Commercial Incentive Program 490 0.43% 147.0 3.85%Industrial Waste Facility 2 0.00% 0.1 0.00%
INDIVIDUAL ASSISTANCE 98,973 86.35% 198.3 5.20%Disabled Homeowner 200 0.17% 1.6 0.04%School Tax Relief 82,641 72.11% 128.9 3.38%Senior Citizen Homeowner 3,303 2.88% 24.9 0.65%Veterans Exemption 12,829 11.19% 42.9 1.12%
REAL PROPERTY TAX EXEMPTIONSStaten Island by Exemption Type
FY 2006EXEMPTIONS EXEMPT VALUE
24

Part II Tax Levy
TAX LEVY Property Tax Revenue and the Tax Levy When the City’s budget is adopted, budgeted expenditures and the forecasted revenue from all non-property tax sources are determined. The difference between these amounts is the property tax revenue needed to balance the budget. Because of the property tax’s unique role in balancing the budget, it is the only tax over which the City has the discretion to determine the rate without prior legislation from the State. In order to assure that the property tax revenue needed to balance the budget will be achieved, allowances must be made for such items as uncollectible taxes, abatements, prior year collections and refunds. As a group, these items are referred to as the property tax reserve. The tax levy is equal to the property tax revenue plus the property tax reserve. It is the total amount of tax charged (or levied) based on assessed values. Class Shares There are four classes of property in New York City. Class One is primarily 1-, 2-, and 3-family homes. Class Two is other residential property. Class Three is utility property, and Class Four is all other commercial property. Each class is responsible for a specific share of the property tax levy, called the class share or class levy. The class shares are determined each year according to a formula in State law. The percentages of the levy represented by the class shares that were in place in 1989 are the base proportions. These base proportions are adjusted according to changes in market value, as determined by the State Office of Real Property Services (ORPS). The resulting proportions are called the current base proportions. The current base proportions are adjusted to reflect physical and other non-equalization (non-market) changes that are reflected on the current assessment roll. The results are the adjusted base proportions, which are multiplied by the total levy to determine the levy for each class of property. Assessment Roll The assessment roll includes the assessed value of all taxable real property in the City. All taxable property is subject to the property rate applied to taxable assessed value, with one exception. For the purposes of determining the property tax levy and rates, exempt value attributable to the School Tax Relief (STAR) program is not deducted from the
25

Part II Tax Levy
assessment roll. The value of the STAR exemption is addressed as one of the components of the property tax reserve. In addition to the general property tax rate that is applied to taxable assessed value, exempt value attributable to the veterans exemption is subject to tax for school purposes (the school tax). Property Tax Reserve The property tax reserve accounts for items that affect property tax revenue but are independent of the tax levy. Reserve components include provisions for uncollectible taxes, abatements, refunds and collections for prior year periods. Many of the reserve components are adjustments to revenue and do not affect tax bills. However, some components, such as abatements and the STAR allowance, are reflected in the actual tax bills that are sent to property owners. These items are summarized in a table in this section presenting the net tax levy amount that is billed.
Reconciliation of the Assessment Roll, Tax Levy and Net Levy Billed FY 2006
TABLE GUIDE
Column Action Amount Comment($ millions)
Assessment Roll 110,014.1 Total of all taxable billable assessed valueSTAR add 1,112.4 Value of STAR exemptionLevy Roll 111,126.5 Assessment roll used for tax fixing
Tax excl. veterans 13,646.5 Levy roll times tax rate for each classVeterans (school tax) add 21.6 Veterans' exemption times school tax rateTotal Levy 13,668.1 Total property tax levy
Billing AdjustmentsTotal Levy 13,668.1STAR subtract -162.6 Tax value of STAR exemption added back earlierAbatements subtract -427.3 Tax abatements that reduce liabilityNet Levy Billed 13,078.2 Amount of levy that is billed to property owners
26

Part II Tax Levy
Assessment STAR Levy Tax Veterans Tax Levy Net LevyProperty Type Roll Addback Roll Excl. Vets (Sch. Tax) STAR Abatements BilledCLASS 1 12,146.9 738.7 12,885.6 2,029.0 14.5 2,043.4 -116.3 -0.3 1,926.91-Family 5,705.4 397.2 6,102.6 960.9 9.1 970.0 -62.5 0.0 907.52-Family 4,698.9 262.2 4,961.1 781.2 4.5 785.6 -41.3 -0.1 744.33-Family 1,428.4 62.3 1,490.7 234.7 0.7 235.4 -9.8 -0.1 225.5Condominiums 166.6 13.6 180.3 28.4 0.1 28.5 -2.1 -0.1 26.3Vacant Land 108.2 0.0 108.2 17.0 0.0 17.0 0.0 0.0 17.0Other 39.4 3.5 42.9 6.8 0.1 6.8 -0.5 0.0 6.3
CLASS 2 38,630.6 372.9 39,003.6 4,834.9 7.1 4,842.0 -46.2 -409.6 4,386.2Rentals 17,585.1 0.3 17,585.4 2,179.9 0.0 2,179.9 0.0 -68.3 2,111.5Cooperatives 10,793.2 288.7 11,081.9 1,373.7 6.2 1,379.9 -35.8 -217.7 1,126.4Condominiums 4,761.2 50.0 4,811.2 596.4 0.6 597.0 -6.2 -90.3 500.5Condops 972.3 17.2 989.6 122.7 0.2 122.9 -2.1 -17.6 103.24-10 Fam Rentals 3,939.8 6.6 3,946.3 489.2 0.1 489.3 -0.8 -5.7 482.82-10 Fam Co-op 381.4 8.2 389.7 48.3 0.1 48.4 -1.0 -7.2 40.12-10 Fam Condo 181.3 1.6 182.8 22.7 0.0 22.7 -0.2 -2.3 20.22-10 Fam Condop 16.3 0.3 16.6 2.1 0.0 2.1 0.0 -0.5 1.6
CLASS 3 8,502.0 0.0 8,502.0 1,046.5 0.0 1,046.5 0.0 0.0 1,046.5Special Franchise 5,801.8 0.0 5,801.8 714.1 0.0 714.1 0.0 0.0 714.1Locally Assessed 2,699.6 0.0 2,699.6 332.3 0.0 332.3 0.0 0.0 332.3Other 0.6 0.0 0.6 0.1 0.0 0.1 0.0 0.0 0.1
CLASS 4 50,734.6 0.8 50,735.3 5,736.1 0.0 5,736.1 -0.1 -17.1 5,718.9Office Buildings 25,627.3 0.1 25,627.4 2,897.4 0.0 2,897.4 0.0 -7.5 2,889.9Store Buildings 6,793.4 0.2 6,793.6 768.1 0.0 768.1 0.0 -0.3 767.8Loft Buildings 1,926.6 0.0 1,926.6 217.8 0.0 217.8 0.0 -1.1 216.8Utility Property 1,589.0 0.0 1,589.0 179.7 0.0 179.7 0.0 0.0 179.7Hotels 2,836.1 0.0 2,836.1 320.7 0.0 320.7 0.0 -0.4 320.3Factories 1,188.8 0.0 1,188.8 134.4 0.0 134.4 0.0 -4.0 130.4Comm'l condos 4,930.1 0.3 4,930.4 557.4 0.0 557.4 0.0 -2.3 555.1Garages 1,752.3 0.1 1,752.4 198.1 0.0 198.1 0.0 0.0 198.1Warehouses 1,409.4 0.0 1,409.4 159.3 0.0 159.4 0.0 -1.1 158.2Vacant Land 512.3 0.0 512.3 57.9 0.0 57.9 0.0 0.0 57.9Health&Educatn'l 932.2 0.0 932.2 105.4 0.0 105.4 0.0 -0.1 105.3Theaters 192.8 0.0 192.8 21.8 0.0 21.8 0.0 -0.1 21.7Cultural&Rec 302.9 0.0 302.9 34.2 0.0 34.2 0.0 0.0 34.2Other 741.4 0.0 741.4 83.8 0.0 83.8 0.0 -0.3 83.6TOTAL 110,014.1 1,112.4 111,126.5 13,646.5 21.6 13,668.1 -162.6 -427.0 13,078.5
Billing AdjustmentsAssessed Value ($ millions) Tax Amounts ($ millions)
Reconciliation of the Assessment Roll, Tax Levy and Net Levy Billed - FY 2006By Property Type
Note: Senior Citizen Rent Increase Exemption (SCRIE) abatements are excluded from this table because the abatements are applied as data is received from outside agencies rather than with the annual billing. For FY 2005 SCRIE abatements totaled $85.9 million.
27

Part II Tax Levy
Property Type Lease Res. Conversion ICIP Coop/Condo J51 TotalAll $10,095,675 $12,179,026 $6,097,311 $302,240,531 $96,355,753 $426,968,296
CLASS 1 - - - 958 251,690 252,648 1-Family - - - - 12,142 12,142 2-Family - - - - 60,595 60,595 3-Family - - - - 123,157 123,157 Condominiums - - - 958 54,367 55,325 Vacant Land - - - - 1,429 1,429 Other - - - - - -
CLASS 2 - 12,053,742 - 302,239,573 95,285,058 409,578,373 Rentals - 9,717,077 - - 58,607,632 68,324,709 Cooperatives - - - 201,737,450 15,999,878 217,737,328 Condominiums - 1,761,094 - 75,247,481 13,273,500 90,282,075 Condops - 139,031 - 16,424,561 990,694 17,554,286 4-10 Fam. Rentals - 161,296 - - 5,545,190 5,706,486 2-10 Fam. Co-ops - - - 6,852,912 394,192 7,247,104 2-10 Fam. Condos - 133,803 - 1,687,069 454,390 2,275,262 2-10 Fam. Condops - 141,441 - 290,100 19,582 451,123
CLASS 4 10,095,675 125,284 6,097,311 - 819,005 17,137,275 Office Buildings 7,139,006 - 320,672 - 67,468 7,527,146 Store Buildings 37,515 53,425 116,477 - 70,397 277,814 Loft Buildings 42,796 - 1,006,600 - 13,200 1,062,596 Hotels - - - - 362,033 362,033 Factories 231,854 - 3,780,918 - - 4,012,772 Comm'l condos 2,152,862 71,859 23,114 - 44,826 2,292,661 Garages 14,254 - 30,143 - 5,110 49,507 Warehouses 477,388 - 648,812 - - 1,126,200 Vacant Land - - 21,555 - - 21,555 Health&Educatn'l - - - - 50,792 50,792 Theaters - - 87,044 - - 87,044 Cultural&Rec - - - - 4,992 4,992 Other - - 61,976 - 200,187 262,163
FY 2006 ABATEMENTSCITYWIDE BY PROPERTY TYPE
Abatement TypeComm. Revitalization Prog.
Abatement Types Commercial Revitalization Program – includes tax abatements for certain commercial
leases in lower Manhattan and other parts of the City and for certain properties in lower Manhattan that convert to residential use.
Industrial and Commercial Incentive Program - provides tax abatements as well as exemptions to encourage industrial and commercial development throughout the City.
Cooperative and Condominium Abatement – provides tax relief to owners of cooperative and condominium apartments.
J-51 – encourages the maintenance of buildings primarily with three or more residential units.
28

Part III Office Buildings
FY 2006
Citywide Manhattan Bronx Brooklyn Queens Staten Is.All Parcels
Number of Parcels 6,291 2,196 487 1,312 1,600 696 Sq. Ft. (000) 443,404.0 377,916.1 8,037.0 26,946.3 24,864.6 5,640.0
Market Value $77,933.8 $71,956.3 $754.0 $2,453.9 $2,275.1 $494.5Billable AV $25,627.3 $24,232.7 $155.4 $473.6 $654.4 $111.2Exempt AV $4,914.9 $3,851.6 $150.2 $533.8 $285.8 $93.5
Fully TaxableNumber of Parcels 4,986 1,777 332 978 1,349 550
Sq. Ft. (000) 300,929.0 271,092.2 3,768.6 10,813.3 12,288.4 2,966.5Market Value $55,032.0 $52,537.9 $314.2 $900.6 $1,063.0 $216.4
Billable AV $21,454.2 $20,458.2 $120.1 $358.8 $430.0 $87.1Exempt AV $0.0 $0.0 $0.0 $0.0 $0.0 $0.0
Partially TaxableNumber of Parcels 846 198 107 222 196 123
Sq. Ft. (000) 85,360.9 65,903.2 2,574.5 6,975.0 8,509.2 1,399.0Market Value $13,955.1 $12,198.2 $251.3 $536.7 $819.3 $149.6
Billable AV $4,173.0 $3,774.4 $35.3 $114.8 $224.4 $24.2Exempt AV $1,298.1 $965.2 $71.5 $101.3 $121.0 $39.2
Fully ExemptNumber of Parcels 459 221 48 112 55 23
Sq. Ft. (000) 57,114.1 40,920.7 1,693.9 9,158.0 4,067.0 1,274.5Market Value $8,946.7 $7,220.3 $188.5 $1,016.6 $392.8 $128.5
Billable AV $0.0 $0.0 $0.0 $0.0 $0.0 $0.0Exempt AV $3,616.8 $2,886.4 $78.7 $432.5 $164.8 $54.3
Totals may not add due to rounding.
OFFICE BUILDING PROFILE
(Dollars in millions)
29

Part III Office Buildings
Parcels Sq. Ft. FMV Billable AV ExemptMANHATTAN (000)Financial/WTC 107 55,187.0 7,228.6 1,925.7 1,032.7Fully Taxable 63 20,329.0 2,671.6 1,095.4 0.0
Partially Taxable 33 20,375.7 2,516.5 830.3 147.4Fully Exempt 11 14,482.3 2,040.5 0.0 885.3
Insurance/Civic Ctr 201 37,641.4 4,448.7 1,229.9 543.2Fully Taxable 163 20,206.9 2,238.5 881.3 0.0
Partially Taxable 18 8,185.5 1,045.9 348.7 75.2Fully Exempt 20 9,249.1 1,164.3 0.0 468.0
Midtown South 592 52,282.5 7,315.8 2,510.5 237.7Fully Taxable 527 43,536.4 5,949.2 2,220.8 0.0
Partially Taxable 36 6,258.0 1,026.3 289.6 103.6Fully Exempt 29 2,488.1 340.2 0.0 134.1
Midtown West 341 70,538.4 13,136.7 4,132.2 944.3Fully Taxable 300 56,256.2 9,859.7 3,827.5 0.0
Partially Taxable 22 7,314.2 1,403.9 304.6 246.2Fully Exempt 19 6,968.0 1,873.1 0.0 698.1
Grand Central 349 76,494.8 16,218.1 5,633.2 729.2Fully Taxable 272 57,178.5 11,477.4 4,535.8 0.0
Partially Taxable 34 13,882.5 3,401.0 1,097.4 213.7Fully Exempt 43 5,433.8 1,339.7 0.0 515.5
Plaza 369 79,460.5 22,703.2 8,572.4 240.0Fully Taxable 298 69,639.2 19,778.9 7,677.6 0.0
Partially Taxable 34 8,928.6 2,709.1 894.8 147.8Fully Exempt 37 892.8 215.1 0.0 92.1
BROOKLYNDowntown 110 13,988.7 1,430.3 176.7 418.7
Fully Taxable 64 3,669.0 310.5 125.6 0.0Partially Taxable 15 2,162.9 178.4 51.1 16.4
Fully Exempt 31 8,156.8 941.4 0.0 402.4
Totals may not add due to rounding.
$ (millions)
OFFICE BUILDING PROFILE - Selected AreasFY 2006
30

Part III Office Buildings
Parcels Sq. Ft. Parcels Sq. Ft. Parcels Sq. Ft.MANHATTAN (000) (000) (000)Financial/WTC 43 36,592.5 48 16,678.4 16 1,916.1Fully Taxable 22 13,326.3 29 6,812.6 12 190.1
Partially Taxable 14 13,163.7 16 7,122.0 3 90.0Fully Exempt 7 10,102.6 3 2,743.8 1 1,636.0
Insurance/Civic Ctr 25 16,802.2 78 17,934.0 98 2,905.2Fully Taxable 14 8,122.8 59 9,771.2 90 2,312.9
Partially Taxable 6 4,336.2 10 3,759.2 2 90.1Fully Exempt 5 4,343.3 9 4,403.6 6 502.2
Midtown South 14 6,181.7 203 34,617.2 375 11,483.6Fully Taxable 12 5,609.2 183 28,726.6 332 9,200.6
Partially Taxable 2 572.5 15 4,819.9 19 865.5Fully Exempt - 0.0 5 1,070.6 24 1,417.4
Midtown West 37 32,271.8 162 32,470.0 142 5,796.6Fully Taxable 25 23,300.4 143 27,761.7 132 5,194.1
Partially Taxable 5 3,061.3 14 4,075.6 3 177.3Fully Exempt 7 5,910.1 5 632.7 7 425.2
Grand Central 107 59,271.4 107 14,156.2 135 3,067.3Fully Taxable 83 41,892.1 95 13,225.3 94 2,061.1
Partially Taxable 15 13,180.3 5 336.7 14 365.5Fully Exempt 9 4,199.1 7 594.1 27 640.6
Plaza 160 72,885.3 44 3,399.7 165 3,175.5Fully Taxable 129 63,892.0 39 3,238.3 130 2,508.9
Partially Taxable 27 8,600.4 - 0.0 7 328.2Fully Exempt 4 392.9 5 161.5 28 338.4
BROOKLYNDowntown 11 6,515.9 37 4,484.7 62 2,988.1
Fully Taxable - 0.0 26 2,789.6 38 879.5Partially Taxable 2 835.2 6 749.1 7 578.7
Fully Exempt 9 5,680.8 5 946.0 17 1,530.0
Other BuildingsClass B BuildingsClass A Buildings
OFFICE BUILDING PROFILE - Selected Areas
FY 2006By Office Class
31

Part III Office Buildings
Billable Billable BillableMANHATTAN FMV AV Exempt FMV AV Exempt FMV AV ExemptFinancial/WTC 5,545.7 1,453.2 848.9 1,618.5 462.5 157.6 64.5 10.0 26.2Fully Taxable 1,947.6 824.4 0.0 702.2 262.5 0.0 21.8 8.5 0.0
Partially Taxable 1,839.9 628.8 99.5 667.6 200.0 45.9 9.1 1.5 2.0Fully Exempt 1,758.2 0.0 749.4 248.7 0.0 111.7 33.6 0.0 24.2
Insurance/Civic Ctr 2,247.0 649.6 248.9 1,734.5 471.9 218.4 467.2 108.5 76.0Fully Taxable 1,025.4 411.9 0.0 933.2 364.0 0.0 279.9 105.4 0.0
Partially Taxable 651.2 237.7 22.1 384.4 107.9 52.3 10.3 3.1 0.8Fully Exempt 570.4 0.0 226.7 416.9 0.0 166.1 177.0 0.0 75.2
Midtown South 1,114.1 394.7 31.5 4,671.6 1,637.0 101.3 1,530.1 478.8 104.9Fully Taxable 945.9 367.0 0.0 3,799.6 1,402.7 0.0 1,203.6 451.1 0.0
Partially Taxable 168.2 27.7 31.5 752.5 234.3 58.0 105.6 27.7 14.1Fully Exempt 0.0 0.0 0.0 119.4 0.0 43.3 220.8 0.0 90.8
Midtown West 7,773.7 2,236.3 824.5 4,629.6 1,640.4 89.2 733.4 255.4 30.6Fully Taxable 5,292.5 2,110.6 0.0 3,919.4 1,467.6 0.0 647.8 249.3 0.0
Partially Taxable 757.9 125.7 189.9 627.9 172.8 54.9 18.1 6.1 1.3Fully Exempt 1,723.2 0.0 634.5 82.4 0.0 34.3 67.5 0.0 29.3
Grand Central 13,512.1 4,705.6 612.2 2,258.7 804.9 53.4 447.3 122.8 63.6Fully Taxable 9,124.1 3,636.6 0.0 2,090.2 793.0 0.0 263.1 106.3 0.0
Partially Taxable 3,289.9 1,069.0 194.9 47.6 11.9 7.7 63.6 16.5 11.1Fully Exempt 1,098.1 0.0 417.3 120.9 0.0 45.7 120.6 0.0 52.4
.Plaza 21,237.3 8,055.4 182.2 759.7 268.9 13.5 706.2 248.1 44.2
Fully Taxable 18,497.9 7,180.1 0.0 727.5 268.9 0.0 553.5 228.6 0.0Partially Taxable 2,634.5 875.3 136.4 0.0 0.0 0.0 74.6 19.5 11.4
Fully Exempt 104.9 0.0 45.8 32.2 0.0 13.5 78.1 0.0 32.8
BROOKLYNDowntown 813.6 22.3 315.7 393.9 122.4 36.9 222.8 32.1 66.1
Fully Taxable 0.0 0.0 0.0 246.8 100.1 0.0 63.7 25.5 0.0Partially Taxable 86.5 22.3 6.7 63.3 22.3 3.4 28.6 6.5 6.2
Fully Exempt 727.1 0.0 309.0 83.9 0.0 33.5 130.5 0.0 59.9
Totals may not add due to rounding.
Other Buildings
OFFICE BUILDING MARKET & ASSESSMENT PROFILE - Selected AreasBy Office Class - FY 2006
($ millions)
Class A Buildings Class B Buildings
32

Part IV Home Sales
1Qtr 2005 2Qtr 2005 3Qtr 2005 4Qtr 2005One-family
Number of Sales 4,080 4,469 4,947 3,983 Median Price $395,000 $405,000 $439,800 $445,000
Two-familyNumber of Sales 3,688 3,842 4,039 3,228 Median Price $480,210 $500,000 $535,000 $550,000
Three-familyNumber of Sales 967 1,076 1,095 904 Median Price $555,000 $598,704 $614,000 $630,000
Home Sales - Most Recent Four Quarters
Number of SalesYear Manhattan Bronx Brooklyn Queens Staten Island1999 103 1,304 3,217 8,819 5,209 2000 82 1,153 3,008 8,128 4,466 2001 54 1,090 2,714 8,180 4,623 2002 78 1,119 3,033 8,659 4,836 2003 73 1,161 2,850 8,587 4,816 2004 83 1,404 3,192 9,346 4,613 2005 70 1,279 2,961 8,965 4,204
Median Sales PriceYear Manhattan Bronx Brooklyn Queens Staten Island1999 $ 1,375,000 $ 175,000 $ 195,000 $ 193,980 $ 175,0002000 2,570,000 185,400 220,000 214,000 198,7672001 1,440,000 200,595 245,000 239,500 230,0002002 1,875,000 230,000 277,500 275,000 265,0002003 2,575,000 260,000 325,000 325,000 304,0992004 2,950,000 309,000 378,000 370,000 349,9002005 4,268,750 355,000 450,000 445,000 395,000
Single Family Home Sales Transactions and Pricesby Borough
33

Part IV Home Sales
Transactions
Year Number Year/Year Number Year/Year Number Year/Yearof Sales Change of Sales Change of Sales Change
1990 12,213 7,635 1,508 1991 11,454 -6.2% 6,735 -11.8% 1,361 -9.7%1992 11,703 2.2% 7,094 5.3% 1,446 6.2%1993 12,955 10.7% 8,402 18.4% 1,952 35.0%1994 14,765 14.0% 10,491 24.9% 2,504 28.3%1995 14,705 -0.4% 10,893 3.8% 2,709 8.2%1996 16,131 9.7% 11,967 9.9% 3,168 16.9%1997 16,793 4.1% 12,599 5.3% 3,392 7.1%1998 17,729 5.6% 13,028 3.4% 3,540 4.4%1999 18,652 5.2% 13,722 5.3% 3,680 4.0%2000 16,837 -9.7% 12,724 -7.3% 3,555 -3.4%2001 16,661 -1.0% 12,843 0.9% 3,380 -4.9%2002 17,725 6.4% 13,797 7.4% 3,569 5.6%2003 17,487 -1.3% 13,916 0.9% 3,626 1.6%2004 18,638 6.6% 15,000 7.8% 3,897 7.5%2005 17,479 -6.2% 14,797 -1.4% 4,042 3.7%
Median Price
Year Median Year/Year Median Year/Year Median Year/YearPrice Change Price Change Price Change
1990 $ 170,000 $ 200,000 $ 226,5001991 160,000 -5.9% 185,000 -7.5% 210,000 -7.3%1992 157,000 -1.9% 178,000 -3.8% 204,394 -2.7%1993 155,000 -1.3% 174,000 -2.2% 190,000 -7.0%1994 155,600 0.4% 175,000 0.6% 192,000 1.1%1995 155,000 -0.4% 174,000 -0.6% 190,000 -1.0%1996 158,550 2.3% 175,500 0.9% 190,000 0.0%1997 162,139 2.3% 185,000 5.4% 210,000 10.5%1998 172,500 6.4% 200,000 8.1% 227,809 8.5%1999 186,000 7.8% 225,000 12.5% 250,000 9.7%2000 209,900 12.8% 248,000 10.2% 275,000 10.0%2001 235,000 12.0% 279,000 12.5% 315,000 14.5%2002 269,000 14.5% 315,000 12.9% 350,000 11.1%2003 315,000 17.1% 370,000 17.5% 412,250 17.8%2004 360,000 14.3% 430,000 16.2% 499,000 21.0%2005 420,810 16.9% 515,000 19.8% 600,000 20.2%
Two-Family Three-Family
Citywide Home Sales
One-Family Two-Family Three-Family
1990 - 2005
One-Family
34

Part V Cooperative and Condominium Tax Abatement Program
Develop- Develop- Develop-ments Units Amount ments Units Amount ments Units Amount
Cooperatives25.0% 245 10,019 3,044,075 23 560 179,962 18 2,676 779,054 17.5% 5,329 351,598 222,300,345 2,973 171,908 171,960,051 181 18,498 4,430,206
TOTAL 5,574 361,617 225,344,420 2,996 172,468 172,140,013 199 21,174 5,209,260
Condominiums25.0% 27 1,542 482,670 3 36 10,269 3 214 69,286 17.5% 958 53,113 76,448,418 710 40,892 70,755,306 9 1,303 290,410
TOTAL 985 54,655 76,931,088 713 40,928 70,765,575 12 1,517 359,696
All Apartments25.0% 272 11,561 3,526,745 26 596 190,231 21 2,890 848,340 17.5% 6,287 404,711 298,748,763 3,683 212,800 242,715,357 190 19,801 4,720,616
GRAND TOTAL 6,559 416,272 302,275,508 3,709 213,396 242,905,588 211 22,691 5,568,956
Develop- Develop- Develop-ments Units Amount ments Units Amount ments Units Amount
Cooperatives25.0% 175 4,504 1,354,545 23 1,807 600,698 6 472 129,816 17.5% 1,198 54,343 14,065,373 958 105,341 31,478,140 19 1,508 366,575
TOTAL 1,373 58,847 15,419,918 981 107,148 32,078,838 25 1,980 496,391
Condominiums25.0% 14 853 255,063 3 72 27,198 4 367 120,854 17.5% 124 1,923 1,162,631 98 7,641 3,693,161 17 1,354 546,910
TOTAL 138 2,776 1,417,694 101 7,713 3,720,359 21 1,721 667,764
All Apartments25.0% 189 5,357 1,609,608 26 1,879 627,896 10 839 250,670 17.5% 1,322 56,266 15,228,004 1,056 112,982 35,171,301 36 2,862 913,485
GRAND TOTAL 1,511 61,623 16,837,612 1,082 114,861 35,799,197 46 3,701 1,164,155
Queens
COOPERATIVE AND CONDOMIMINUM ABATEMENT PROGRAMFY 2006
AbatementLevel
AbatementBronxManhattan
Brooklyn Staten Island
Level
Citywide
Note: Eligible units in buildings with an average assessed value per unit of $15,000 or less receive a 25 percent abatement. All other eligible units receive a 17.5 percent abatement.
35

Part VI Delinquencies
PROPERTY TAX DELINQUENCIES Property tax delinquencies reflect the amount of property tax that is due but not yet collected. Delinquencies may be attributable to tax amounts owed for the current fiscal year or prior fiscal years and reflect the status of payments at a given point in time. This section presents property tax delinquencies reported as of June 30th of a year for the “current fiscal year,” i.e., the amount unpaid of that year’s property tax levy. Since the levy changes from year, this allows for a meaningful year to year comparison. The following tables show the tax delinquency for the three most recent fiscal years, distributed by quarter, tax class and borough. An additional table presents delinquency data for selected property types.
36

Part VI Delinquencies
6/30/2005 6/30/2004 6/30/2003 6/30/2005 6/30/2004 6/30/2003First Quarter 33,371 39,723 42,473 93.0 91.3 81.7Second Quarter 38,399 48,166 50,200 18.2 19.4 16.7Third Quarter 67,197 79,808 119,555 147.5 129.8 143.4Fourth Quarter 76,358 116,697 137,365 41.7 48.9 46.3Fiscal Year
Total 89,676 144,665 182,755 300.3 289.3 288.1Delinquency rate 2.31% 2.33% 2.90%
6/30/2005 6/30/2004 6/30/2003 6/30/2005 6/30/2004 6/30/2003Class One 63,005 107,742 137,578 60.3 67.3 62.9Class Two 13,505 23,199 29,019 75.3 88.4 85.0Class Three 42 42 40 6.1 7.5 9.0Class Four 13,083 13,648 16,074 154.3 124.6 126.7Unidentified* 41 34 44 4.4 1.5 4.5
6/30/2005 6/30/2004 6/30/2003 6/30/2005 6/30/2004 6/30/2003Manhattan 7,527 11,808 14,691 116.3 108.2 102.8Bronx 10,488 15,305 19,738 36.6 31.4 29.8Brooklyn 31,258 49,225 61,333 70.5 71.5 76.8Queens 28,401 49,265 63,617 56.8 56.2 59.1Staten Island 12,002 19,062 23,376 20.1 22.0 19.5
* For these properties the tax class is not identified on the database used to generate the delinquency report.
Delinquency Amount ($ millions)By Borough
By Tax Class
Current Fiscal Year as ofNumber of Parcels
Current Fiscal Year as of
Number of ParcelsCurrent Fiscal Year as of
Delinquency Amount ($ millions)
By Quarter
Tax Delinquency ComparisonFiscal Years 2005, 2004 and 2003
Current Fiscal Year as of
Delinquency Amount ($ millions)Current Fiscal Year as of
Number of ParcelsCurrent Fiscal Year as of
37

Part VI Delinquencies
Parcels Arrears Rate Parcels Arrears Rate($ millions) ($ millions)
CLASS 11-Family 22,318 22.8 2.8% 42,273 26.3 3.5%2-Family 17,842 19.4 3.1% 32,471 21.9 3.8%3-Family 5,518 6.6 3.2% 9,621 7.5 4.0%Condominiums 1,269 0.9 3.1% 2,389 1.0 3.8%Res. Multi Use 3,126 4.0 5.4% 4,869 4.3 6.3%Vacant Land 11,970 6.3 36.5% 14,832 5.9 37.2%
CLASS 2Walk-ups 5,230 26.9 2.9% 8,472 33.6 3.8%Elevator 330 20.6 1.3% 386 25.6 1.7%Cooperatives 712 8.9 0.6% 810 8.4 0.6%Condominiums 6,047 14.3 2.5% 11,477 15.6 2.9%Res. Multi Use 1,185 4.6 3.3% 2,054 5.2 3.9%
CLASS 4Office Buildings 344 14.6 0.5% 310 8.9 0.3%Store Buildings 1,664 15.3 2.1% 1,510 14.2 2.0%Loft Buildings 87 1.8 0.8% 75 1.4 0.6%Hotels 27 1.4 0.4% 22 2.0 0.6%Factories 650 6.1 4.2% 652 7.2 4.6%Comm'l Condos 1,996 13.1 2.5% 2,251 3.2 0.7%Garages 2,206 11.6 5.9% 2,420 13.7 6.8%Warehouses 510 7.1 4.5% 479 5.0 3.2%Vacant Land 3,864 14.3 24.6% 4,209 15.2 27.7%Hospitals & Health 119 7.2 11.0% 66 3.2 5.0%Educational 80 6.9 15.9% 53 3.9 13.2%Theaters 20 0.3 1.5% 17 0.4 1.7%
FY2005 as of 6/30/2005
Citywide Real Property Tax Delinquenciesfor Selected Property Types
FY2004 as of 6/30/2004
38

Part VII Historical Data
FiscalYear Class 1 Class 2 Class 3 Class 4 Total
1993 137,937.2 70,226.1 13,926.0 100,836.4 322,925.71994 126,787.3 66,511.3 14,037.5 92,947.8 300,283.91995 127,179.0 63,731.1 13,642.3 88,456.3 293,008.71996 128,230.9 63,835.8 13,675.8 88,327.3 294,069.81997 129,215.6 63,668.0 14,190.8 87,305.0 294,379.31998 130,899.2 64,914.6 14,584.1 87,959.0 298,357.01999 136,194.5 68,070.3 14,498.9 92,604.9 311,368.72000 143,143.5 72,470.3 14,730.6 96,577.4 326,921.82001 158,939.6 77,994.6 14,064.2 103,350.0 354,348.42002 180,721.7 85,930.3 14,536.2 111,159.4 392,347.62003 205,031.6 94,015.4 15,213.7 115,549.8 429,810.42004 232,904.4 97,425.6 15,622.4 120,725.2 466,677.72005 283,559.0 115,880.3 16,657.2 124,288.0 540,384.42006 325,068.5 131,377.0 18,909.9 138,648.3 614,003.7
Fiscal Staten Year Manhattan Bronx Brooklyn Queens Island
1993 126,158.0 23,395.8 66,354.1 83,988.4 23,029.41994 115,685.8 21,734.7 61,920.4 78,905.0 22,038.01995 109,710.8 21,460.4 61,336.0 78,334.2 22,167.51996 110,203.1 21,416.3 61,695.0 78,454.5 22,300.81997 109,326.3 21,220.0 62,211.6 79,098.9 22,522.51998 110,905.4 21,439.7 63,631.6 79,692.4 22,688.01999 117,047.3 22,389.6 65,838.5 82,592.7 23,500.62000 124,472.1 23,427.2 68,556.6 86,283.2 24,182.72001 134,687.4 24,932.6 74,624.3 93,377.2 26,726.92002 148,642.5 27,177.1 82,730.5 103,654.3 30,143.12003 159,490.7 29,706.8 91,667.8 114,621.4 34,323.62004 167,674.5 31,635.9 101,292.7 127,371.2 38,703.42005 180,730.2 35,155.0 125,473.3 153,488.1 45,537.92006 205,579.4 40,000.8 141,576.4 174,669.5 52,177.5
NOTE: 1. Market values represent values for fully and partially taxable properties only. 2. The Department of Finance began reporting market values in fiscal year 1993.Market value totals may not add due to rounding.
MARKET VALUES BY TAX CLASS AND BY BOROUGHFY 1993 - 2006
($ Millions)
39

Part VII Historical Data
FiscalYear Class 1 Class 2 Class 3 Class 4 Total
1992 8,676.8 25,354.4 4,965.5 44,614.3 83,611.0 1993 8,619.1 25,441.3 4,312.4 43,341.8 81,714.6 1994 8,521.3 24,447.9 6,309.8 40,017.5 79,296.5 1995 8,702.2 23,852.8 6,129.3 38,122.8 76,807.1 1996 8,871.5 24,308.9 6,140.2 38,102.9 77,423.6 1997 8,976.8 24,585.4 6,370.8 37,576.3 77,509.3 1998 9,164.4 25,351.0 6,548.9 37,706.0 78,770.3 1999 9,234.8 26,734.9 6,512.5 39,672.5 82,154.7 2000 9,424.7 28,524.5 6,619.5 41,299.3 85,868.0 2001 9,778.9 30,597.6 6,320.5 43,872.8 90,569.7 2002 10,096.6 33,653.8 6,530.8 47,205.2 97,486.4 2003 10,611.6 36,552.1 6,836.1 48,704.9 102,704.7 2004 11,132.5 37,738.2 7,021.6 50,897.1 106,789.5 2005 11,547.1 39,108.8 7,488.7 52,171.8 110,316.4 2006 12,146.9 43,941.4 8,502.0 57,891.3 122,481.6
FiscalYear Class 1 Class 2 Class 3 Class 4 Total
1992 8,676.8 23,557.2 4,965.5 41,268.1 78,467.6 1993 8,619.1 24,552.3 4,312.4 41,695.3 79,179.1 1994 8,521.3 24,079.9 6,309.8 39,266.5 78,177.5 1995 8,702.2 23,604.4 6,129.3 37,583.5 76,019.3 1996 8,871.5 23,751.2 6,140.2 37,088.7 75,851.6 1997 8,976.8 23,838.8 6,370.8 36,308.6 75,495.0 1998 9,164.4 24,228.8 6,548.9 36,078.6 76,020.7 1999 9,234.8 24,965.2 6,512.5 36,986.2 77,698.7 2000 9,424.7 26,126.4 6,619.5 37,918.8 80,089.4 2001 9,778.9 27,501.7 6,320.5 39,657.0 83,258.0 2002 10,096.6 29,674.9 6,530.8 41,987.3 88,289.6 2003 10,611.6 31,993.7 6,836.1 43,845.9 93,287.4 2004 11,132.5 34,151.9 7,021.6 46,328.4 98,634.5 2005 11,547.1 35,950.8 7,488.7 47,380.7 102,367.3 2006 12,146.9 38,630.6 8,502.0 50,734.6 110,014.1
NOTE: Totals may not add due to rounding.
TAXABLE BILLABLE ASSESSED VALUE
ACTUAL AND BILLABLE ASSESSED VALUE BY TAX CLASSFY 1992 - 2006
($ Millions)TAXABLE ACTUAL ASSESSED VALUE
40

Part VII Historical Data
($ Millions)
Fiscal StatenYear Citywide Manhattan Bronx Brooklyn Queens Island
1992 78,467.6 48,754.9 4,516.4 9,896.0 12,665.6 2,634.7 1993 79,179.1 49,143.1 4,719.3 9,950.2 12,776.1 2,590.4 1994 78,177.5 46,891.5 4,982.7 10,440.0 13,185.2 2,678.1 1995 76,019.3 44,956.1 4,830.9 10,390.0 13,111.9 2,730.5 1996 75,851.6 44,747.6 4,788.6 10,423.1 13,172.8 2,719.5 1997 75,495.0 44,002.7 4,830.2 10,545.9 13,351.8 2,764.4 1998 76,020.7 44,061.8 4,821.6 10,893.0 13,473.5 2,770.8 1999 77,698.7 45,405.0 4,860.9 10,957.9 13,656.7 2,818.2 2000 80,089.4 47,029.9 5,008.5 11,168.2 14,037.3 2,845.5 2001 83,258.0 49,285.1 5,123.2 11,483.4 14,439.7 2,926.6 2002 88,289.6 53,088.4 5,244.1 11,927.5 14,984.6 3,045.0 2003 93,287.4 56,635.9 5,455.0 12,449.5 15,577.5 3,169.5 2004 98,634.5 60,412.5 5,723.7 12,965.0 16,229.1 3,304.2 2005 102,367.3 63,157.1 5,882.7 13,304.0 16,611.4 3,412.2 2006 110,014.1 67,876.4 6,438.9 14,063.0 17,938.6 3,697.2
NOTE: Totals may not add due to rounding.
REAL PROPERTY TAXABLE BILLABLE ASSESSMENTS BY BOROUGHFY 1992 - 2006
41

Part VII Historical Data
FY 1992 - 2006
FiscalYear Class 1 Class 2 Class 3 Class 4 Total
1992 11.46% 28.00% 7.80% 52.74% 100.0%1993 11.28% 29.00% 6.57% 53.15% 100.0%1994 11.56% 30.78% 5.76% 51.90% 100.0%1995 11.92% 31.57% 5.98% 50.53% 100.0%1996 12.19% 32.61% 6.18% 49.01% 100.0%1997 12.47% 33.64% 6.37% 47.51% 100.0%1998 12.73% 33.92% 6.87% 46.48% 100.0%1999 12.96% 33.22% 7.08% 46.74% 100.0%2000 13.26% 34.08% 7.43% 45.23% 100.0%2001 13.50% 34.50% 7.63% 44.37% 100.0%2002 13.65% 34.94% 7.43% 43.98% 100.0%2003 13.87% 34.92% 7.41% 43.80% 100.0%2004 14.09% 35.56% 7.12% 43.23% 100.0%2005 14.69% 34.87% 7.39% 43.05% 100.0%2006 14.95% 35.43% 7.66% 41.97% 100.0%
FiscalYear Class 1 Class 2 Class 3 Class 4 Total
1992 953.0 2,328.9 649.6 4,387.3 8,318.8 1993 946.9 2,433.4 551.8 4,460.4 8,392.5 1994 938.1 2,497.0 467.2 4,210.9 8,113.2 1995 940.1 2,490.9 472.1 3,986.7 7,889.8 1996 959.9 2,567.0 486.4 3,858.1 7,871.4 1997 977.4 2,635.8 499.5 3,722.5 7,835.1 1998 1,004.4 2,676.5 542.4 3,667.2 7,890.4 1999 1,049.8 2,690.6 573.1 3,785.9 8,099.3 2000 1,110.2 2,854.1 622.1 3,787.8 8,374.3 2001 1,178.4 3,012.1 666.2 3,873.6 8,730.3 2002 1,265.2 3,239.7 688.4 4,077.9 9,271.2 2003 1,482.8 3,732.1 792.0 4,681.8 10,688.8 2004 1,726.1 4,356.7 871.9 5,295.9 12,250.7 2005 1,868.0 4,435.8 940.0 5,476.2 12,720.0 2006 2,043.4 4,842.0 1,046.5 5,736.1 13,668.1
Note: Totals may not add due to rounding.
($ millions)CLASS LEVIES
CLASS SHARES
TAX LEVY DISTRIBUTION BY CLASS
42

Part VII Historical Data
(Per $100 of Assessed Value)FY 1991 - 2006
FiscalYear Citywide Class 1 Class 2 Class 3 Class 4
1991 10.135 9.920 9.228 15.200 10.0041992 10.591 10.888 9.885 13.083 10.6311993 10.591 10.888 9.910 12.794 10.6981994 10.366 10.900 10.369 7.404 10.7241995 10.366 10.694 10.552 7.702 10.6081996 10.366 10.725 10.807 7.922 10.4021997 10.366 10.785 11.056 7.840 10.2521998 10.366 10.849 11.046 8.282 10.1641999 10.366 10.961 10.739 8.800 10.2362000 10.366 11.167 10.851 9.398 9.9892001 10.366 11.255 10.847 10.540 9.7682002 10.366 11.609 10.792 10.541 9.7122003 1st half 10.366 11.936 10.564 10.607 9.776
2nd half 12.283 14.160 12.517 12.565 11.5802004 12.283 14.550 12.620 12.418 11.4312005* 12.283 15.094 12.216 12.553 11.5582006 12.283 15.746 12.396 12.309 11.306
Note: Citywide tax rates are weighted averages shown for comparative purposes only.
FiscalYear Class 1 Class 2 Class 3 Class 41991 4.164 3.923 - 4.2531992 4.339 3.990 - 4.2921993 4.513 4.160 - 4.4911994 5.063 4.871 - 5.0381995 5.256 5.240 - 5.2681996 4.837 4.925 - 4.7411997 5.442 5.631 - 5.2221998 6.153 6.313 - 5.8091999 6.195 6.112 - 5.8332000 6.720 6.569 - 6.0542001 6.809 6.598 - 5.9492002 7.002 6.543 - 5.8952003 1st half 7.096 6.312 - 5.848
2nd half 7.096 6.312 - 5.8482004 7.761 6.764 - 6.1352005* 8.225 6.687 - 6.3352006 8.693 6.892 - 6.276
* adopted 6/24/04
FY 1991 - 2006
REAL PROPERTY TAX RATES
SCHOOL TAX RATES(Per $100 of Assessed Value)
43

Part VII Historical Data
FY 1992 - 2006($ Millions)
Revenue asFiscal a PercentYear Tax Levy Revenue of Levy
1992 8,318.8 7,817.8 94.0%1993 8,392.5 7,886.3 94.0%1994 8,113.2 7,773.3 95.9%1995 7,889.8 7,473.6 94.7%1996 7,871.4 7,100.4 90.2%1997 7,835.1 7,290.7 93.1%1998 7,890.4 7,239.4 91.7%1999 8,099.3 7,630.7 94.2%2000 8,374.3 7,850.0 93.7%2001 8,730.3 8,245.6 94.4%2002 9,271.2 8,760.9 94.5%2003 10,688.8 10,062.9 94.1%2004 12,250.7 11,582.3 94.5%2005 12,720.0 11,495.4 90.4%2006 13,668.1 12,434.5 91.0%
REAL PROPERTY TAX LEVY AND REVENUE
44

Part VII Historical Data
($ Millions)
Amount of Tax Levy For:Fiscal Debt Operating Abatements Operating District BID Unused Margin1
Year Service Expenses Limit Charges
1992 2,056.0 6,262.8 10,631.8 4,369.0 41.1%1993 1,922.6 6,469.9 11,945.0 5,475.1 45.8%1994 2,192.2 5,920.9 13,853.8 7,932.9 57.3%1995 2,275.9 5,613.9 13,446.5 7,832.6 58.3%1996 2,609.8 5,261.6 8,756.7 43.9 3,451.2 39.4%1997 2,827.4 5,007.7 7,977.7 46.1 2,923.9 36.7%1998 1,872.9 6,017.5 7,737.1 48.4 1,671.1 21.6%1999 1,134.2 6,965.1 7,237.4 52.1 220.2 3.0%2000 1,138.9 7,235.5 7,333.0 52.1 45.4 0.6%2001 1,274.6 7,455.7 7,648.3 52.2 140.4 1.8%2002 1,148.9 8,122.4 8,216.8 52.3 42.1 0.5%2003 1,982.2 8,706.5 8,998.3 61.3 230.6 2.6%2004 2,821.2 9,429.5 9,997.7 62.1 506.1 5.1%2005 2,485.6 10,234.4 579.8 10,778.8 63.3 1,060.9 9.8%2006 1,141.0 12,527.1 867.3 11,762.7 70.3 32.6 0.3%
NOTE: Beginning in FY 2005, the Unused Margin includes an adjustment for abatements.
1 Operating expenses, including the self-imposed Business Improvement District (BID)charges, are subject to a Constitutional operating limit of 2.5% of market value. Theunused margin represents the amount of additional tax levy that may be applied tooperating expenses without exceeding the Constitutional limit.Totals may not add due to rounding.
DETERMINATION OF THE UNUSED OPERATING MARGINFY 1992 - 2006
45

Appendix
THE REAL PROPERTY TAX CLASS SYSTEM AT A GLANCETaxClass Definition Assessment Guidelines
Class 1 One-, two-, and three-family homes; Assessment increases cannot exceed Single family homes on cooperatively 6 percent annually and 20 percent overowned land; any five year period.Condominiums: (a) with no more than three dwelling units, provided such property was previous classified as Class One; or (b) no more than three stories in height and built as condominiums;Mixed-use property with threeunits or less, provided 50 percentor more of the space is used forresidential purposes;Vacant land, primarily residentiallyzoned, except in Manhattan below110th Street.
Class 2 All other residential property not in For buildings with fewer than eleven units,Class One, except hotels and motels; including rentals, cooperatives andMixed-use property with four or more condominiums, assessment increases units, provided 50 percent or more of cannot exceed 8 percent annually andthe space is used for residential 30 percent over any five-year period.purposes.
For all other Class Two properties,there are no limitations on assessmentincreases; however, any increase mustbe phased-in over a five-year period.
Unless specifically excluded, Section581 of the Real Property Tax Lawprohibits the use of sales data thatreflect actual or potential cooperativeor condominium ownership in theassessment of multiple-family housing.
Class 3 Utility real property owned by utility There are no limitations on assessmentcorporations, except land and increases or a phase-in requirement.buildings.
Class 4 All other real property. There are no limitations on assessmentincreases; however, increases must bephased-in over a five-year period.
These limitations apply only to equalization increases. There are no limitations on assessmentincreases resulting from new construction, alterations, or the restoration of exempt propertyto the tax roll.
46

Appendix
A CHRONOLOGY OF TAX CLASS CHANGESFiscal Year Property Type Modification From To
1985 Residential properties containing Subclassification, imposition of -- --4-6 dwelling units (Class Two). assessment increase limitations.
1986 Condominiums of three stories or Reclassification. Two Oneless and built as condominiums.
1987 Residential properties containing Subclassification, imposition of -- --7-10 dwelling units (Class Two). assessment increase limitations.
1988- Central office and telecommuni- Redefinition of real property sub- -- -- 1993 cations equipment. ject to taxation, excluding these
properties from the assessment roll.However, the legislation maintainedthese properties on the fiscal 1988and 1989 tax rolls at their fiscal1987 taxable assessed value. Com-mencing with fiscal 1990 assess-ment roll, these properties werephased-out over four years, at 25% per year.
1991 Land and structures owned by Reclassification. Three Fourutility companies.
1991 Condominiums with no more than Reclassification. Two Onethree residential units, providedsuch property was previouslyclassified as Class One.
1991 a) Residentially zoned vacant land, Reclassification. Four Oneexcept such land located in Man-hattan south of or adjacent to thesouth side of 110th Street.
b) Non-residentially zoned vacantland, provided the property (1) issituated immediately adjacent to aproperty improved with a Class Onestructure, (2) is owned by the sameowner as the improved lot prior toand since 1/1/89, and (3) has nomore than 10,000 square feet, exceptsuch land located in Manhattan southof or adjacent to the south side of110th Street.
1992 Mixed commercial/residential Reclassificationproperties where at least 50%of total square footage is used for residential purposes.a) If three units or less Four Oneb) If more than three units Four Two
1992 Single family homes on Reclassification Two Onecooperatively owned land.
1994 Class Two cooperatives and Subclassification, imposition of -- --condominiums in buildings assessment increase limitations.with 2-10 units.
47

Appendix
GLOSSARY OF COMMON REAL ESTATE TERMS Abatement - A reduction in real estate tax liability through a credit rather than a reduction
in taxable assessed value. The City has several abatements: the J-51 housing rehabilitation, the Senior Citizen Rent Increase Exemption, the Lower Manhattan Revitalization, and the Cooperative and Condominium abatements.
Actual Assessed Value - The assessment established for all tax classes and without regard
to the five-year phase-in requirement for most Class Two and all Class Four properties. Adjusted Base Proportion - The redistribution of the tax levy among the four tax classes,
adjusted for market value trends. Ad Valorem Tax - A tax based on the value of the object being taxed. The real property
tax is an ad valorem tax. Article 18 - The portion of the New York State Real Property Tax Law that established the
classification system in New York City and Nassau County. The Article contains definitions of each tax class, imposes assessment limitations, and spells out the method of distributing the tax levy.
Assessed Value - The value of a property for real property taxation purposes. In New York
City, property may have three assessed values: actual assessed value, transition assessed value, and billable assessed value (see definitions).
Assessment Ratio - The ratio of assessed value to market value. Assessment Roll - The public record of all properties in a taxing jurisdiction and their
assessed values. Base Proportion - Under Article 18 of the Real Property Tax Law, the taxable assessed
value of each tax class as a proportion of total taxable assessed value in a base year. These proportions establish the basis for the distribution of the tax levy among the four tax classes.
Billable Assessed Value - The assessed value on which tax liability is based. For properties
in Classes Two or Four, the billable assessed value is the lower of the actual or transitional assessed value.
Capitalization - The process by which anticipated future income and benefits are converted
to a present value. Capitalization Rate - A rate of return used to produce the capital value of an income
stream.
48

Appendix
Class Share - The proportion of the tax levy allocated to a tax class. Comparable Sales Method (Market Approach) - The process by which a property's
market value is estimated based on the sales prices of similar (comparable) properties. Condominium - A form of ownership that combines individual ownership of residential or commercial units with joint ownership of common areas such as hallways, etc. Cooperative - A form of corporate ownership of real property whereby shareholders are
entitled to use dwelling units or other units of space. Cost Approach - A method of valuing real property, by estimating the reproduction or
replacement cost of the improvement, as adjusted for depreciation, obsolescence, etc., plus the site value.
Debt Service - The amount required to repay principal and interest on the City's outstanding
debt. Delinquency - The amount of tax liability that remains outstanding after the due date,
allowing for any grace period, if applicable. Demolition - Destruction and removal of an existing improvement. Depreciation - In appraisal, a charge against the reproduction cost of an improvement for
estimated wear and obsolescence. Due Date - The date on which an obligation must be satisfied. Equalization - Changes in assessed value made by a taxing jurisdiction to ensure that all
properties (or all properties within a tax class, if applicable) are assessed at the same percentage of market value.
Exemption - A provision of law that reduces taxable value or income. Exempt Value - The amount or percentage of assessed value that is not subject to taxation.
Property may be fully exempt or partially exempt; in the case of Veterans Exemptions, the exempt amount is taxable for education purposes.
Fiscal Year - A 12-month period used for financial reporting. The City's fiscal year runs
from July 1 to June 30. Fractional Assessment - Assessment of real property at a percentage of market value (i.e.,
at less than 100 percent of market value).
49

Appendix
Grace Period - The period of time, beyond the due date, in which a payment may be made without incurring a penalty.
Improvements - Additions to raw land that increase value. Improvements include
buildings, streets, sewers, etc. Income Capitalization Approach - A method of valuing real estate by discounting net
operating income to arrive at a present worth estimate. In Rem - A Latin term meaning "against the thing." A proceeding directly against the
property rather than the owner of such property. In tax foreclosures, in rem proceedings are used by the City to enforce payment of delinquent real estate taxes and related charges.
Levy - An assessment of tax. Liability - A debt or financial obligation. Market Value - The most probable price that a property should command in a competitive
and open market. This definition also requires that the buyer and seller should be willing but not compelled to act.
Multi-family Housing - A residential structure with more than one dwelling unit. Obsolescence - One of the causes of depreciation. A loss in value due to reduced
desirability and usefulness because the property does not meet current standards or needs.
Operating Expenses – The term includes all expenses necessary to maintain a property
and/or its income, excluding debt service. For purposes of assessment, real estate taxes are omitted.
Parcel - A piece of land under one ownership. Replacement Cost - The cost to construct, at current prices, an improvement that is
equivalent in utility to an existing structure, using modern building materials and according to current standards.
Reproduction Cost - The cost to replicate, at current prices, an existing structure, using the
same materials, construction standards, quality, design, etc., as the original structure. Reserve - With regard to real property taxation, an amount allocated for tax delinquency,
cancellation and abatement of taxes and refunds. Special Franchise - Cables, conduits, pipes, and other utility property located in or along
the public right-of-way.
50

Appendix
Tax Rate - The amount, usually expressed in dollars per hundred of assessed value, applied to the tax base to determine tax liability. In New York City, a tax rate is established for each tax class.
Taxable Assessed Value - The amount of assessed value remaining after application of any
tax exemption. Taxable Status Date - The date on which the assessed value, taxable status and, if
applicable, tax class are fixed for all properties in a taxing jurisdiction. Transitional Assessed Value - The assessed value, during the five-year phase-in of
equalization changes, of all Class Four properties and cooperatives, condominiums and rental buildings with more than 10 units in Class Two.
51