the climate reality project philippines, community in
TRANSCRIPT
1
Organized by: Institute for Climate and Sustainable Cities, The Climate Reality Project Philippines, MNL Moves, 350.org Pilipinas, and the Pinay Bike Commuter Community
In collaboration with: Government of Marikina City, Marikina Bikeways Office, Government of Quezon City, Green Transport Office - Department of Public Order and (GTO-DPOS), Government of Pasig City, Pasig Transport Office, Government of San Juan City, San Juan Traffic Parking Management Office (TPMO)

2
Arielle Celine Tabinga, Maria Golda Hilario, Aldrin Pelicano Bianca Ma. Krista Angeles, Margaret Bernice [email protected]; [email protected] Leonard Soriano Joseph Manalo, Gerimara Manuel
Editorial board:
Correspondence: Maps: Graphic Design:
Published by:
August 2021
3
Table of Contents
I. Acknowledgements 4
II. Summary 6
III. Background 8
IV. Count Methodology 9
V. Count Results 14
Snapshot Results per City 17
VI. Key Observations 21
VII. Recommendations 32
VIII. References 33
IX. Annexes 34

4
I. AcknowledgementsThe organizers of the Metro Manila Counts would like to thank the 168 volunteers who contributed to this effort:
Reymundo NillamaDouglas CastorCherilou Futalan Restituto Cruz Diane BuenaventuraEphraim Amburo Dankarl MagpayoAngel SarmientoDana Varela Shirly Labrador Ryan CubillasBenjamin Salarzon Jr.Rulen Catalo Brandon ElmagaRolando SumaoangFelesita Alawin Lauren Villarama Joana RagaDan Abriol Maiko Tenorio Gene Itable Rico Gutierrez Jr. James PerezJohn Brillantes Mary Villar Fernando Dela Cruz Perlin BonJhim ValenciaRio Constantino Derrick LimIan Canzon
Gab Ferrer Jimuel JimenezCandeze MongayaJoseph CaresosaJoary Cervantes Aariann AmascualSavyna Lalo Virginia LucasFrancis Silva Daniel Ricaro Anais Rama Faye Ferrer Golda Hilario Lara Cerilo Susan CandidoJoan LiraPatrick Aman Karl Gonzales Richard MendozaRonah de la PenaElvin SantosJossel EbesateT-Jay CadeteIvy PangilinanGarhly GlovoRuby MagturoRaul CiprianoTrisha SapiterAriez CapistranoAriel CapistranoDominic Maboot
Nico SampanGianina SyCeline TabingaMary SabioEric JohnsonLeonard SorianoEdmund Theodore DelesMichael YmataPaige SyHana SarciaMariel UyAlvin ReyesBettina FenomenoDaniel SenaRoy MacedaMarco SantiagoRommel RomeroJay ErlanoErwin ChinchillaGil Dela CruzHans BosshardElijah Go TianRamiro GarciaHoney De PeraltaHailey ObaloJake FranciscoLuisito GepuelaRandolf CunananAngelo PoetentoPaul De SilvaRhoenald San Juan
Jasper ChupitaMark CabeltoRodolfo Santos Jr.Artemio GonzalesEduardo FernandezChristopher EstorninosMerilyn LanquinoJonard GarciaJulius Angelo GarciaAnthony BulosKeisha MayugaGlenn DentonCarleen ReyesJose CanillasGlo GuevarraKaren ResurreccionKevin SkinkerOmar CastanarCharisse AlvarezGinina DiazMaria SarmientoApril AleaAdrian ArbonTom MorenoCaezar RegisAlimaye BacaniNicolas AsenjoRobert CamachoLawrence LaurinoGilbert LubiganJulius Bergonia

5
John UsmanDana ClaverAbigail DaquiganMariella CabusogDavid SantanaReggie JuanicoMoireen EspinosaLiezel OdeFe Isabel AdarneNisshamae GonzalesJanelle Uy
Anton NemenzoJulius BayaniIan GuarinJericho BalbinAries OrioqueRichard SalcedaJan DucaySeth MacapagalJan SamoyMarc SparkzVictor Chiu
Abigail BautistaMa. Theresa PascualJonalyn MauricioConrado Mendoza Jr.Christian DayaoRay TayotoLloyd MarioFranklyn FranciscoCatalino Soyoso Jr.Ma. MadlangbayanIan Carabeo
Joel LlosalaHannah AngconHerman SalvadorFhely AlawunRonie SerranaJerry FederioRichard LazalaJennylyn VeraqueMa. Catherine LabellesMary MaribbayRigobert Reyes
We would like to thank the following local government units and departments for their partnership and support for this event:
Government of Marikina City, Marikina Bikeways OfficeGovernment of Quezon City, Green Transport Office - Department of Public Order and Safety (GTO-DPOS)Government of Pasig City, Pasig Transport OfficeGovernment of San Juan City, San Juan Traffic Parking Management Office (TPMO)
Special thanks also to ChinSpres Herbal Lozenges for sponsoring the event by ensuring the safety and well-being of the volunteers by providing anti-covid essential kits.
We would also like to extend our appreciation to the Active Transport Team of the Department of Transport (DoTr) for their technical review and inputs, to the Department of Interior and Local Government - Bureau of Local Government Supervision (BLGS) and the Metro Manila Development Authority Bike Program for their valuable comments and insights.
This initiative would not have been possible without all of your collective effort. Thank you for advocating for safer and more inclusive streets!

6
II. SummaryThe Philippines have established conventions of data collection that capture movements of motorized vehicles on the road (i.e. number of trips generated, or number of motor vehicles according to different sizes and wheels). However, this has yet to be instituted for other modes of transport, particularly non-motorized transport (NMT). The lack of data on road use especially by active transport1 has made it difficult for urban planners and decision-makers to design the appropriate transport infrastructure and program, justify investments and value the socio-economic benefits of active transport to cities and businesses.
The Metro Manila Counts! (MMC) Project is a citizen-led collaborative capacity-sharing effort by the Institute for Climate and Sustainable Cities, MNL Moves, The Climate Reality Project Philippines, 350.Org Pilipinas, and the Pinay Bike Commuter Community in partnership with the local government units (LGUs) of Marikina City, San Juan City, Pasig City, and Quezon City.
On June 8, 2021, 168 volunteers implemented the first Metro Manila Count; 132 volunteers were stationed in 32 locations in different parts of Quezon City, Marikina City, San Juan City and Pasig city and conducted a bike and pedestrian count. Volunteers counted during a two-hour peak count in the morning (6-8 am) and afternoon (4-6 pm) using adapted forms from the United States’ National Bicycle and Pedestrian Documentation Project.
Results of the bike and pedestrian count revealed that during the four-hour window in 32 locations in 4 cities:
1Active transport, or active mobility refers to non-motorized means of transport (NMT) of people and goods, which requires human physical activity.
• There were 38,932 cyclists,12,787 pedestrians and 1,658users of personal mobilitydevices (PMDs) recorded;
• Majority of the cyclistscounted were men and only3.1% (1,145) are women;
• 71.3% (26, 478) of the cyclistsuse helmets;
• There were 127 uniquemovements observed in the 32locations in the four cities;
• ‘Counter-flowing’ or goingagainst the flow of motor-vehicle traffic is commonamong cyclists.
38,93212,787
71.3%
127
1,658
96.6%3.1%
7
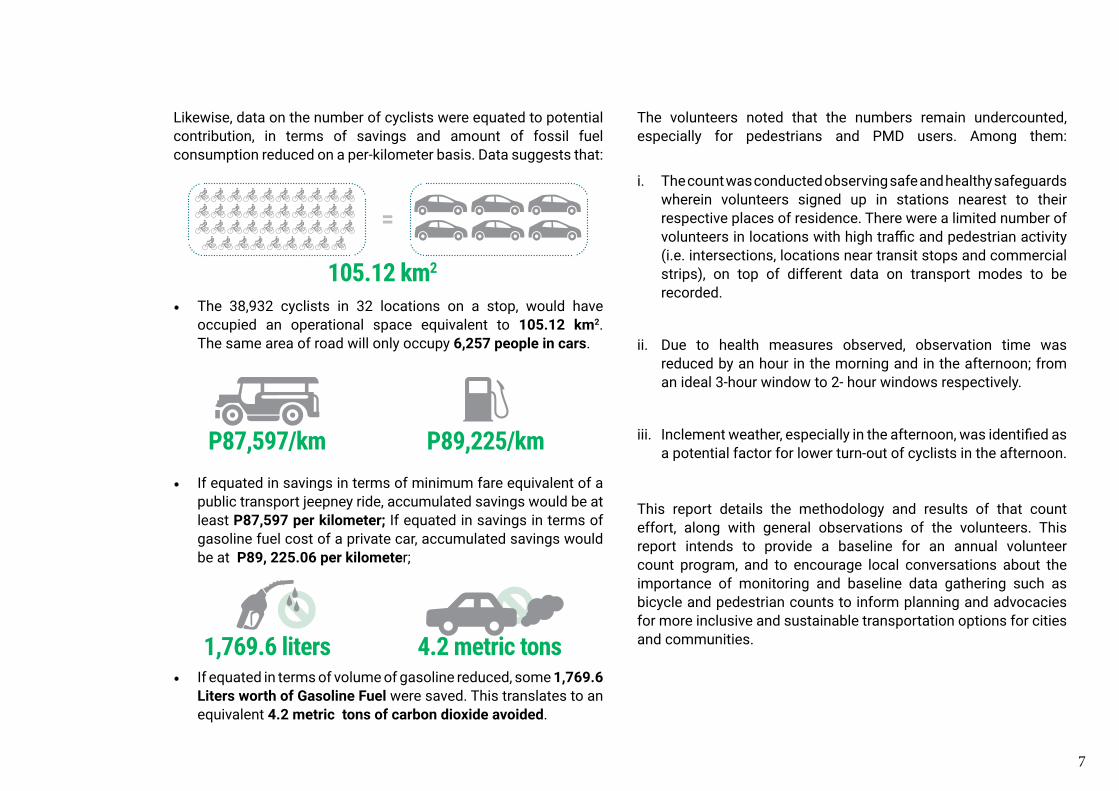
Likewise, data on the number of cyclists were equated to potential contribution, in terms of savings and amount of fossil fuel consumption reduced on a per-kilometer basis. Data suggests that:
• The 38,932 cyclists in 32 locations on a stop, would haveoccupied an operational space equivalent to 105.12 km2.The same area of road will only occupy 6,257 people in cars.
The volunteers noted that the numbers remain undercounted, especially for pedestrians and PMD users. Among them:
i. The count was conducted observing safe and healthy safeguards wherein volunteers signed up in stations nearest to theirrespective places of residence. There were a limited number ofvolunteers in locations with high traffic and pedestrian activity(i.e. intersections, locations near transit stops and commercialstrips), on top of different data on transport modes to berecorded.
ii. Due to health measures observed, observation time wasreduced by an hour in the morning and in the afternoon; froman ideal 3-hour window to 2- hour windows respectively.
iii. Inclement weather, especially in the afternoon, was identified asa potential factor for lower turn-out of cyclists in the afternoon.
This report details the methodology and results of that count effort, along with general observations of the volunteers. This report intends to provide a baseline for an annual volunteer count program, and to encourage local conversations about the importance of monitoring and baseline data gathering such as bicycle and pedestrian counts to inform planning and advocacies for more inclusive and sustainable transportation options for cities and communities.
105.12 km2
=
• If equated in savings in terms of minimum fare equivalent of apublic transport jeepney ride, accumulated savings would be atleast P87,597 per kilometer; If equated in savings in terms ofgasoline fuel cost of a private car, accumulated savings wouldbe at P89, 225.06 per kilometer;
• If equated in terms of volume of gasoline reduced, some 1,769.6Liters worth of Gasoline Fuel were saved. This translates to anequivalent 4.2 metric tons of carbon dioxide avoided.
P87,597/km
1,769.6 liters
P89,225/km
4.2 metric tons
8
III. BackgroundThe Philippines have established conventions of data collection that capture movements of motorized vehicles on the road i.e. number of trips generated, or number of motor vehicles according to different sizes and wheels. However, this has yet to be instituted for other modes of transport, especially non-motorized transport (NMT). The lack of consistent data on road use especially through active transport has made it difficult for urban planners and decision-makers to design the appropriate transport infrastructure and program, justify investments and value the socio-economic benefits of active transport to cities and businesses.
The observance of physical distancing as a public health safety measure, along with the travel restrictions on mass public transport during this COVID-19 pandemic, has created a momentum for for citizens who do not own motorized vehicles to resort to active transport2 including cycling, walking and use of personal mobility devices (i.e. e-kick scooters, e-bikes, rollerblades). Likewise, there is a growing call to develop interconnected dedicated bicycle lane networks across the country to ensure safe passage for workers cycling to work. .
In recognition over this lack of data number of cyclists and pedestrians on the road, the convenors of the 2020 Mobility Awards, namely the Institute for Climate and Sustainable Cities (ICSC), MNL Moves, The Philippine Branch of The Climate Reality Project, 350.org Pilipinas and the Pinay Bike Commuter Community initiated the Metro Manila Counts! (MMC) Project.
The MMC is a citizen-led collaborative capacity-sharing effort that aims to mobilize volunteers to count people on bicycles, users of personal mobility devices (PMDs) and pedestrians to help planners, local government units, and active transport advocates put baseline figures of foot traffic on commonly used roads as we collectively advance more inclusive, safer and more connected roads for citizens. As a capacity-sharing effort, the MMC mobilized online citizen volunteers who were oriented on the bike and pedestrian counting. This pilot was implemented in partnership with Metro Manila city governments of Pasig, San Juan, Marikina and Quezon City.
This report details the methodology and results of that count effort, along with an analysis of major observations identified by the volunteers themselves. This information is intended to provide a baseline for an annual volunteer count program, and to encourage regional conversations about the importance of bicycle and pedestrian counts.
2Active transport, or active mobility refers to non-motorized means of transport (NMT) of people and goods, which requires human physical activity.
9
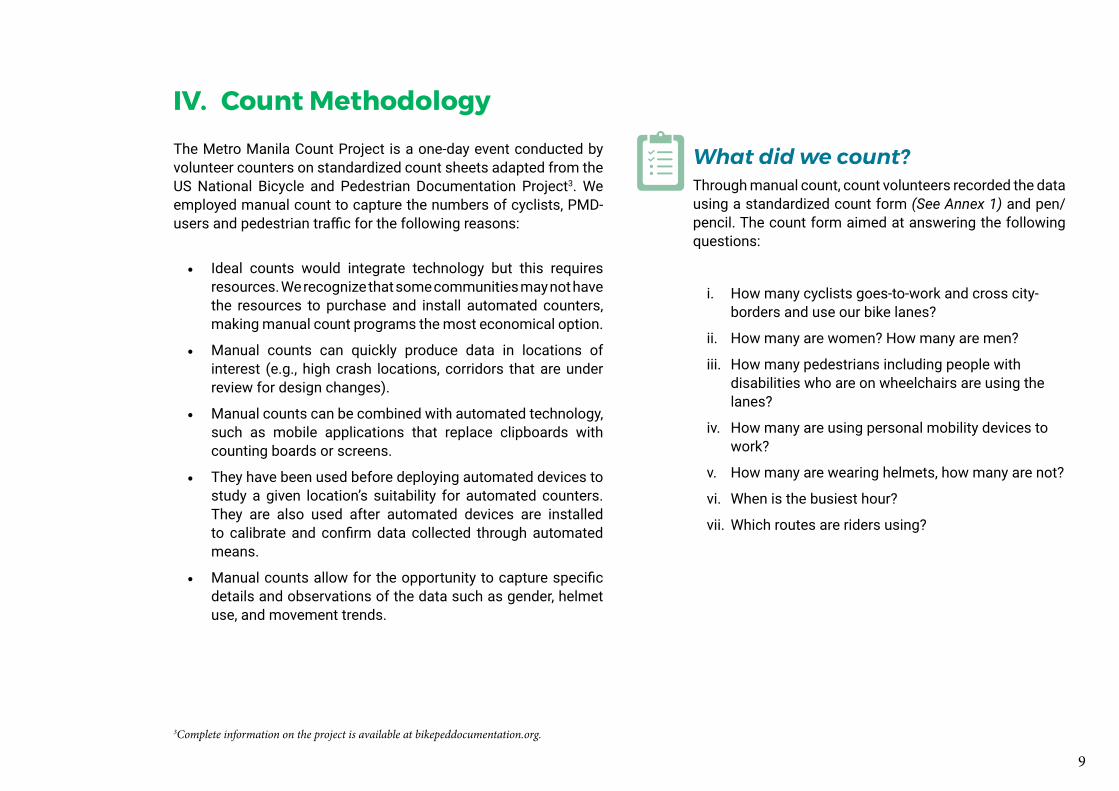
IV. Count MethodologyThe Metro Manila Count Project is a one-day event conducted by volunteer counters on standardized count sheets adapted from the US National Bicycle and Pedestrian Documentation Project3. We employed manual count to capture the numbers of cyclists, PMD-users and pedestrian traffic for the following reasons:
• Ideal counts would integrate technology but this requiresresources. We recognize that some communities may not have the resources to purchase and install automated counters,making manual count programs the most economical option.
• Manual counts can quickly produce data in locations ofinterest (e.g., high crash locations, corridors that are underreview for design changes).
• Manual counts can be combined with automated technology,such as mobile applications that replace clipboards withcounting boards or screens.
• They have been used before deploying automated devices tostudy a given location’s suitability for automated counters.They are also used after automated devices are installedto calibrate and confirm data collected through automatedmeans.
• Manual counts allow for the opportunity to capture specificdetails and observations of the data such as gender, helmetuse, and movement trends.
What did we count? Through manual count, count volunteers recorded the data using a standardized count form (See Annex 1) and pen/pencil. The count form aimed at answering the following questions:
i. How many cyclists goes-to-work and cross city-borders and use our bike lanes?
ii. How many are women? How many are men?
iii. How many pedestrians including people withdisabilities who are on wheelchairs are using thelanes?
iv. How many are using personal mobility devices towork?
v. How many are wearing helmets, how many are not?
vi. When is the busiest hour?
vii. Which routes are riders using?
3Complete information on the project is available at bikepeddocumentation.org.
10
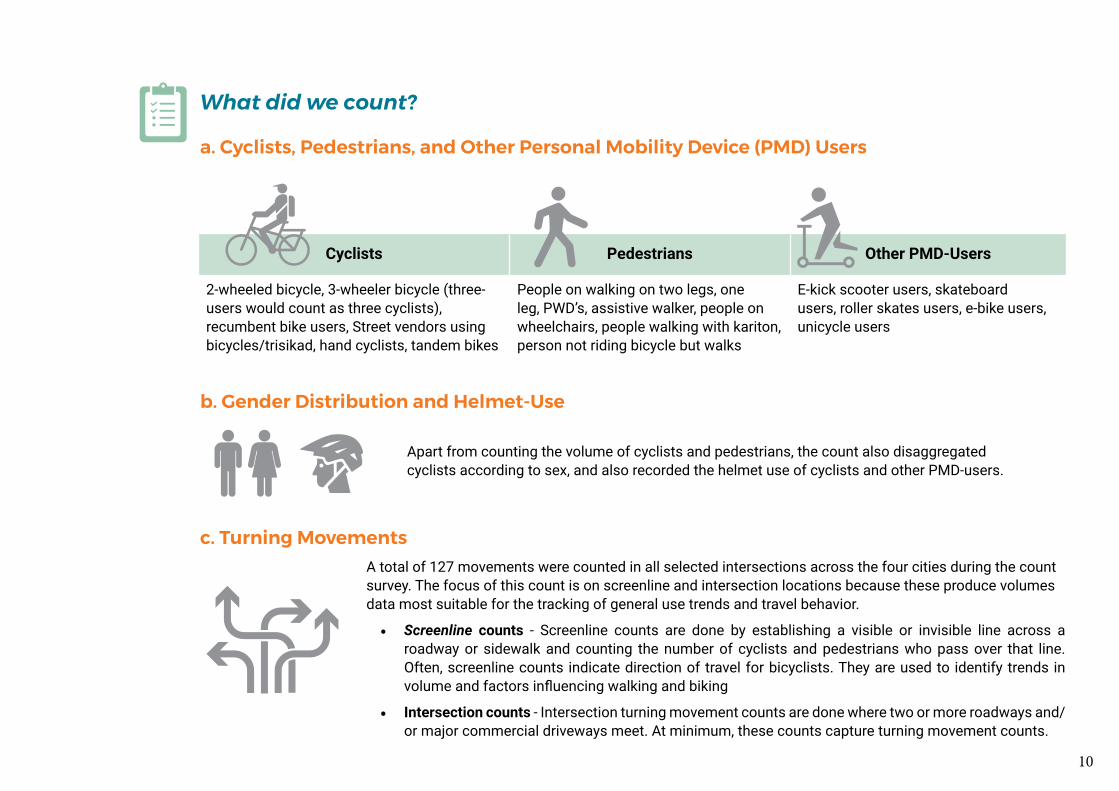
a. Cyclists, Pedestrians, and Other Personal Mobility Device (PMD) Users
b. Gender Distribution and Helmet-Use
c. Turning Movements
Cyclists Pedestrians Other PMD-Users
2-wheeled bicycle, 3-wheeler bicycle (three-users would count as three cyclists),recumbent bike users, Street vendors usingbicycles/trisikad, hand cyclists, tandem bikes
People on walking on two legs, one leg, PWD’s, assistive walker, people on wheelchairs, people walking with kariton, person not riding bicycle but walks
E-kick scooter users, skateboardusers, roller skates users, e-bike users,unicycle users
Apart from counting the volume of cyclists and pedestrians, the count also disaggregated cyclists according to sex, and also recorded the helmet use of cyclists and other PMD-users.
A total of 127 movements were counted in all selected intersections across the four cities during the count survey. The focus of this count is on screenline and intersection locations because these produce volumes data most suitable for the tracking of general use trends and travel behavior.
• Screenline counts - Screenline counts are done by establishing a visible or invisible line across aroadway or sidewalk and counting the number of cyclists and pedestrians who pass over that line.Often, screenline counts indicate direction of travel for bicyclists. They are used to identify trends involume and factors influencing walking and biking
• Intersection counts - Intersection turning movement counts are done where two or more roadways and/or major commercial driveways meet. At minimum, these counts capture turning movement counts.
What did we count?

11
When did we do the count? June 08, 2021 | 6AM-8AM and 4PM-6PM
This pilot project was conducted on Tuesday, June 08, 2021, within the peak hour periods of 6AM-8AM and 4PM-6PM in order to capture riders who cycle, walk, and use other modes of non-motorized transport or personal mobility devices who get to work. The assumption behind the peak hours selected is attributed to the traditional working hour variant of a Filipino worker scheduled from 9:00 AM to 5:00 PM, Monday through Friday.
On June 08, the overall weather during the morning count session (6AM-8AM) was fair. Prior to the afternoon count (4PM-6PM), heavy rainfall was observed across the four cities. Rain slowed down around 4PM, allowing counters to safely proceed with the count.
Where did we count?
Marikina City, Quezon City, Pasig City, San Juan City (32 Count Locations)
There were 32 count sites across the four cities considering borders connecting exit and entry points across neighboring cities, historical count locations, areas with bike lanes and bike facilities, high collision areas, major streets near transit, and locations as recommended by respective LGUs. The count locations were also determined by the availability and number of volunteers per city. [See Figure 1]
Who did the count?
168 Volunteers
The count was conducted by 168 active volunteers who responded to the call for volunteers that we have circulated in our respective social media pages.
Volunteers were not only involved in the actual count. Some of the volunteers facilitated the orientation workshops, helped consolidate and organize the data, and generate maps and infographics. The recruitment of volunteers and the training for the count were all conducted online to minimize physical gathering as precaution against COVID-19 transmissions.
The volunteers are also being complemented by city traffic enforcers and deputized personnel by Marikina Bikeways Office, San Juan Traffic Parking Management Office (TPMO), Pasig Transport Office, and the Quezon City Green Transport Office under the Department of Public Order and Safety (GTO-DPOS) who have endorsed this undertaking.

12
LimitationsThe count was implemented within the COVID-19 pandemic quarantine period as an operating context. Given such, we identified several limitations which affect the overall accuracy of particular data parameters. Among these limitation include:
i. Scope of Count Locations - Ideally, bike counts are to be done in a variety of locations around an identified area, and that a random sample of all possible locations is chosen to provide a representative sample. However, manual counts depend on the availability and number of counters. Given the limited number of volunteers, the scope for the count locations was narrowed to 32 locations focusing on known high-volume bicycle and pedestrian traffic. This proved to be tedious for volunteers that were assigned in multiple-laned intersections that have high cycling and pedestrian traffic, and where the area coverage was expansive but had blind spots. Likewise, there were a limited number of volunteers that were assigned in these locations. This prompted the volunteers and the organizers to focus counting and observing the movements of cyclists, then PMD-users and pedestrians.
ii. Count duration and frequency - In this pilot count, the ability to mobilize more volunteers on the ground was limited mainly because the project is operating under a COVID-19 pandemic wherein physical distancing is the norm and that social gathering is highly discouraged. Given such, the observation period in the morning and afternoon were reduced by an hour; from a three-hour window to two-hour window respectively. As such, it is recognized that we were not able to adequately capture the ‘peak hours’ of foot traffic.
iii. Weather Condition - Inclement weather is known to heavily influence bicycle/non-motorized transport (NMT) ridership and pedestrian activity. It is presupposed that the unexpected heavy rainfall during the afternoon count has caused a lower turnout rate
iv. Unanticipated disturbances - Some counters have expressed that there have been instances in which they were being distracted by inquisitive public and officers who inquired about their activity during the two-hour window.

13
Figure 1: Map of 32 count locations in Marikina, Quezon, Pasig, and San Juan Cities
Count Location SitesSite 1: Marikina - Infanta Highway (R6) In front of SM City MarikinaSite 2: Marikina - Infanta Highway (R6) cor Nicanor Roxas StSite 3: Gen Ordoñez Avenue corner Katipunan StreetSite 4:Gen Ordoñez Avenue corner East DriveSite 5: Bayan-Bayanan Avenue corner Gen Ordoñez AvenueSite 6: A Bonifacio Avenue corner Riverbanks AvenueSite 7: Commonwealth Avenue - PHILCOA JollibeeSite 8: Commonwealth Avenue - Holy Spirit DriveSite 9: Commonwealth Avenue - Batasan RoadSite 10: Commonwealth Avenue - Regalado Highway (going to QC Circle) Site: 11 Congressional Avenue - EDSA / Roosevelt Avenue (Going to Monumento)Site 12: Congressional Avenue - EDSA / Roosevelt Avenue (Going to E-Rodriguez)Site 13: E Rodriguez Avenue - Tomas Morato Avenue (Going to Manila/ Welcome Rotonda) Site 14: E Rodriguez Avenue - Tomas Morato Avenue (Going to Cubao/Aurora Blvd) Site 15: Aurora Boulevard - EDSASite 16: Aurora Boulevard - C5 / Katipunan Site 17: East Avenue - BIR Road (Going to EDSA)Site 18: Quezon Avenue -West Avenue (Going to QC Circle)Site 19: Quezon Avenue -West Avenue (Going to Manila) Site 20: Ortigas Ave Intersection between Col. Bonny Serrano Ave, and Granada Street Site 21: Ortigas Ave cor Wilson StreetSite 22: EDSA corner Annapolis St.Site 23: Pinaglabanan St. corner N. Domingo and P. GuevarraSite 24: N. Domingo St. corner Gregoria Araneta Ave Site 25: Ortigas Ave - Meralco IntersectionSite 26: Shaw boulevard corner Meralco Ave Site 27: Ortigas Ave cor C5 (Intersection)Site 28: Eastbank Rd (Underneath jenny's bridge)Site 29: Kaginhawaan BridgeSite 30: C. Raymundo Ave corner F. Legaspi St.Site 31: Pasig Boulevard Site 32: Sandoval Ave corner Urbano Velasco

14
V. Count Results Counted on June 08, 2021 from 6AM-8AM and 4PM-6PM) | Counted in 32 Locations in Marikina, Pasig, Quezon City, San Juan
Total CyclistsCounted:
38,932Total PedestriansCounted:
12,787Total “Others”Counted:
1,658
Overall Cyclist Gender Distribution
96.6%MALE
3.1%FEMALE
.3%UNDETERMINED
Cyclist Helmet User Distribution
71.3%HELMET USERS
28.7%NON-HELMET USERS
Bike Count: AM vs PM
0
5000
10000
15000
20000
25000
20,9536-8AM COUNT TOTAL 17,979
4-6PM COUNT TOTAL
Cyclist Count & Gender Distribution per City
0
5000
10000
15000
20000
MARIKINA
112315,762
6323715,403
5349310,613
11844,101
QUEZON CITY PASIG4,286SAN JUAN
11,15916,7096,778

15
Figure 2: Bicycle Flow Volume for AM Bike Count
16
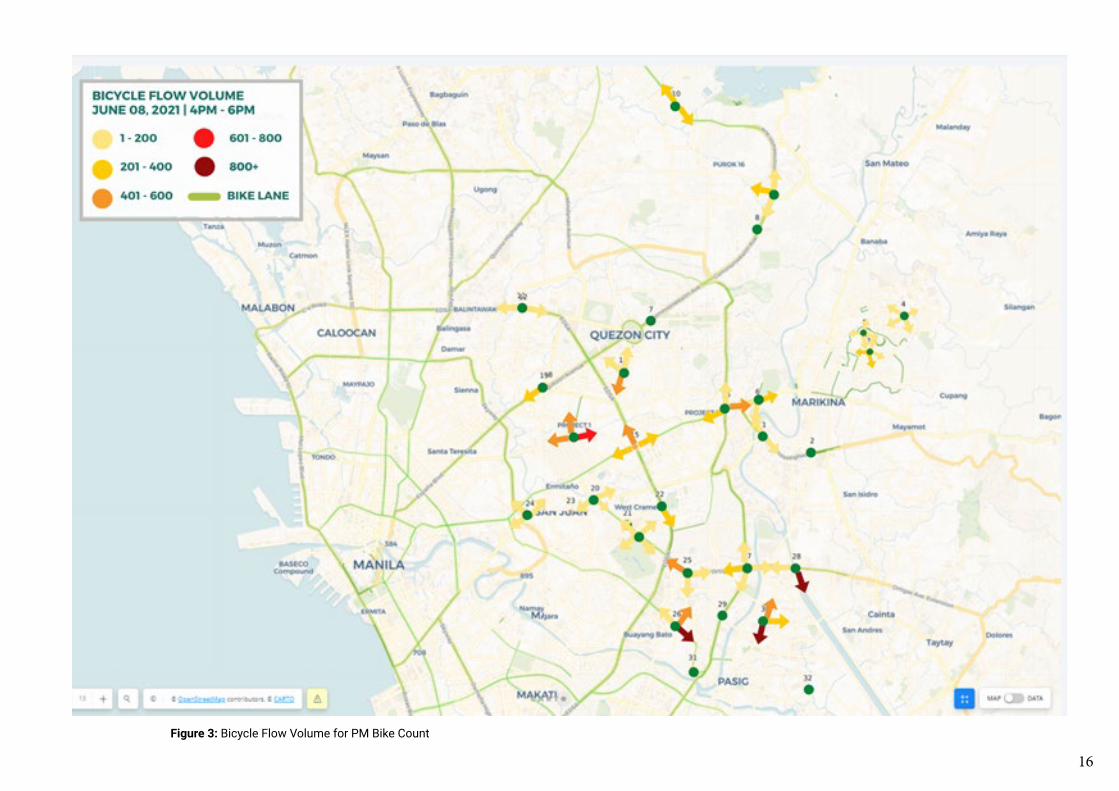
Figure 3: Bicycle Flow Volume for PM Bike Count

17
Snapshot Results per City
Marikina
Figure 4: Marikina Cyclists per Location
Total Count Summary for both timeslots
Total Cyclists 6,778
Total Pedestrians 2,763
Total Others 251
Pedestrians by Gender
Total Male Pedestrians 1,086
Total Female Pedestrians 1,093
Undetermined Pedestrians 161
Total Pedestrians 2,763
Others by Gender
Total Male Others 129
Total Female Others 54
Undetermined Others 0
Total Others 183
Others by Helmet Use
Total Helmet Users 98
Total Non-helmet Users 85
Total Others 183
Figure 5: Marikina Cyclists Gender Distribution
Figure 6: Marikina Cyclists Helmet-Users Distribution
18
Quezon City
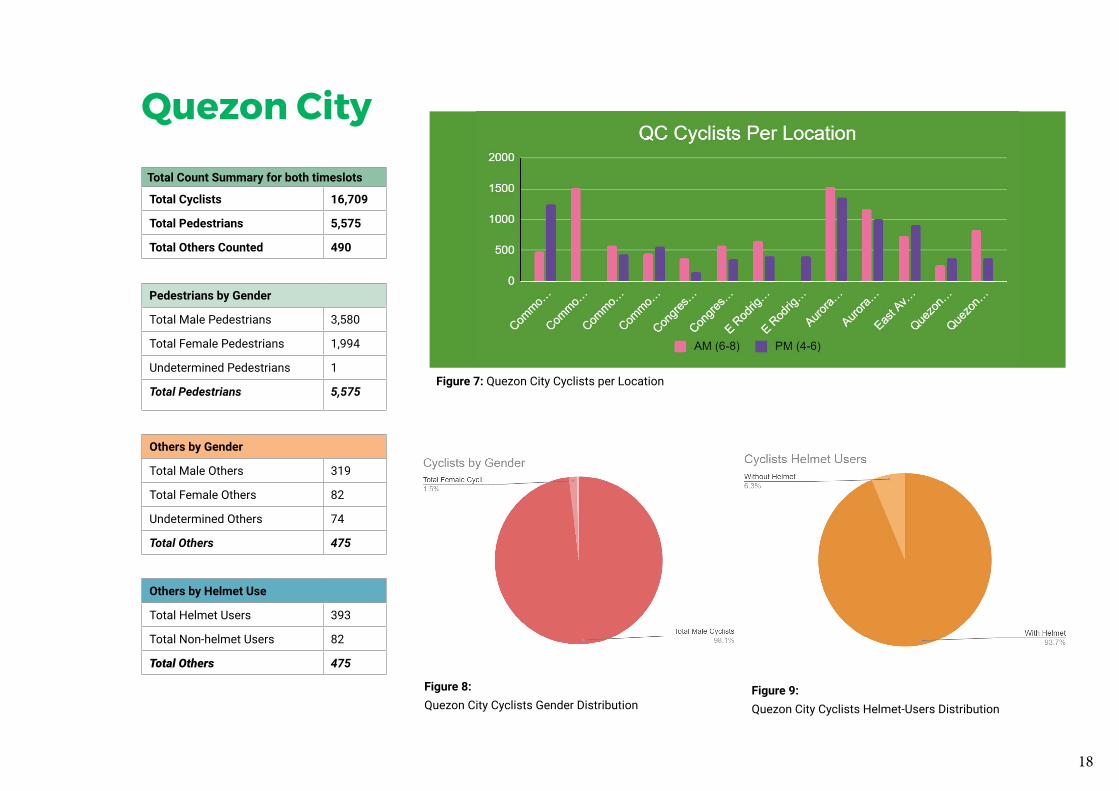
Figure 7: Quezon City Cyclists per Location
Total Count Summary for both timeslots
Total Cyclists 16,709
Total Pedestrians 5,575
Total Others Counted 490
Pedestrians by Gender
Total Male Pedestrians 3,580
Total Female Pedestrians 1,994
Undetermined Pedestrians 1
Total Pedestrians 5,575
Others by Gender
Total Male Others 319
Total Female Others 82
Undetermined Others 74
Total Others 475
Others by Helmet Use
Total Helmet Users 393
Total Non-helmet Users 82
Total Others 475
Figure 8: Quezon City Cyclists Gender Distribution
Figure 9: Quezon City Cyclists Helmet-Users Distribution

19
Pasig City
Figure 10: Pasig City Cyclists per Location
Total Count Summary for both timeslots
Total Cyclists 11,159
Total Pedestrians 2,370
Total Others Counted 559
Pedestrians by Gender
Total Male Pedestrians 1,362
Total Female Pedestrians 1,016
Undetermined Pedestrians 12
Total Pedestrians 2,390
Others by Gender
Total Male Others 321
Total Female Others 237
Undetermined Others 1
Total Others 559
Others by Helmet Use
Total Helmet Users 318
Total Non-helmet Users 230
Total Others 548Figure11: Pasig City Cyclists Gender Distribution
Figure 12: Pasig City Cyclists Helmet-Users Distribution
20
San Juan City
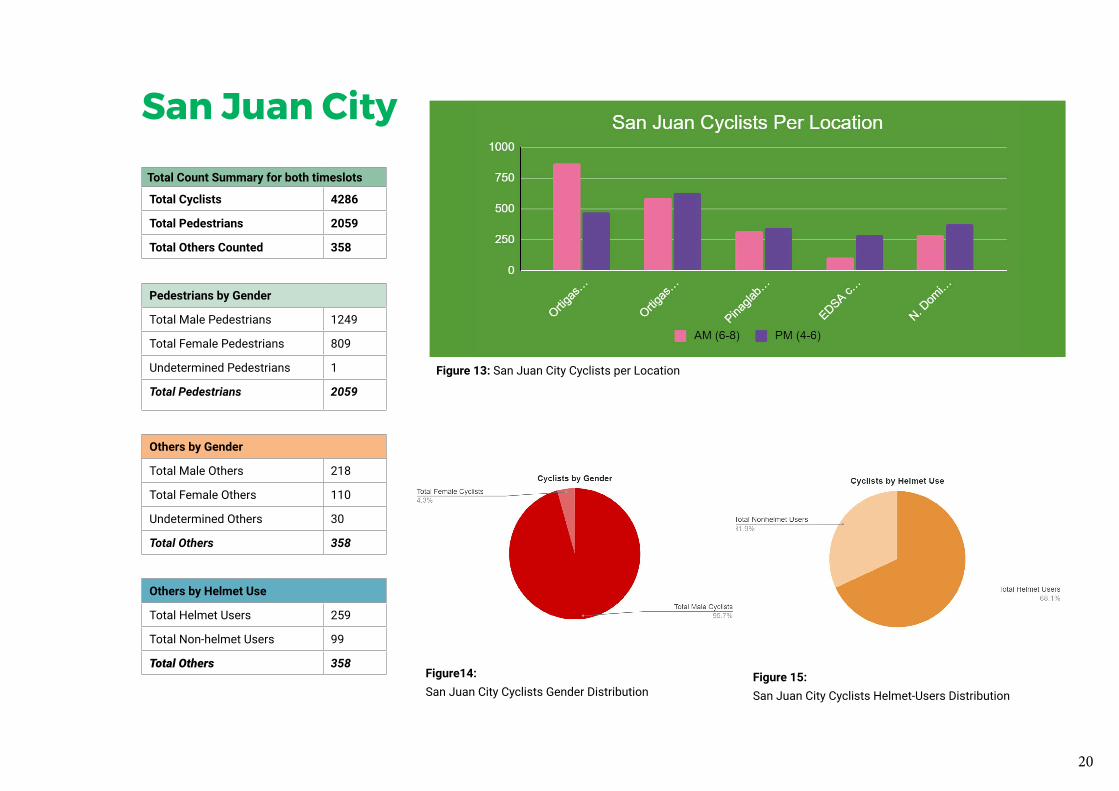
Figure 13: San Juan City Cyclists per Location
Total Count Summary for both timeslots
Total Cyclists 4286
Total Pedestrians 2059
Total Others Counted 358
Pedestrians by Gender
Total Male Pedestrians 1249
Total Female Pedestrians 809
Undetermined Pedestrians 1
Total Pedestrians 2059
Others by Gender
Total Male Others 218
Total Female Others 110
Undetermined Others 30
Total Others 358
Others by Helmet Use
Total Helmet Users 259
Total Non-helmet Users 99
Total Others 358Figure14: San Juan City Cyclists Gender Distribution
Figure 15: San Juan City Cyclists Helmet-Users Distribution
21
VI. Key Observations
1. Cyclist Count Analysis
Gender
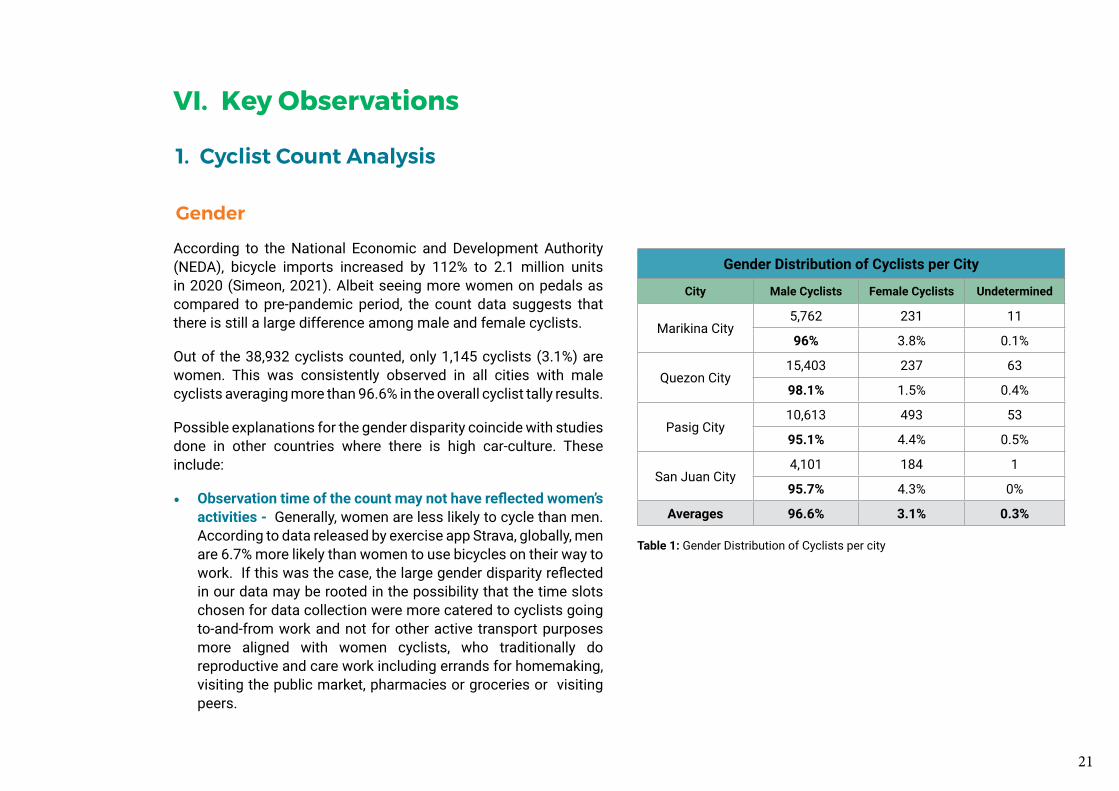
According to the National Economic and Development Authority (NEDA), bicycle imports increased by 112% to 2.1 million units in 2020 (Simeon, 2021). Albeit seeing more women on pedals as compared to pre-pandemic period, the count data suggests that there is still a large difference among male and female cyclists.
Out of the 38,932 cyclists counted, only 1,145 cyclists (3.1%) are women. This was consistently observed in all cities with male cyclists averaging more than 96.6% in the overall cyclist tally results.
Possible explanations for the gender disparity coincide with studies done in other countries where there is high car-culture. These include:
• Observation time of the count may not have reflected women’s activities - Generally, women are less likely to cycle than men. According to data released by exercise app Strava, globally, men are 6.7% more likely than women to use bicycles on their way to work. If this was the case, the large gender disparity reflected in our data may be rooted in the possibility that the time slots chosen for data collection were more catered to cyclists going to-and-from work and not for other active transport purposes more aligned with women cyclists, who traditionally do reproductive and care work including errands for homemaking, visiting the public market, pharmacies or groceries or visiting peers.
Gender Distribution of Cyclists per City
City Male Cyclists Female Cyclists Undetermined
Marikina City5,762 231 11
96% 3.8% 0.1%
Quezon City15,403 237 63
98.1% 1.5% 0.4%
Pasig City10,613 493 53
95.1% 4.4% 0.5%
San Juan City4,101 184 1
95.7% 4.3% 0%
Averages 96.6% 3.1% 0.3%
Table 1: Gender Distribution of Cyclists per city

22
• Location of observation points might not be women’s preferred routes - The stations designated for volunteer counters were mostly busy streets with high car-traffic which women, especially new cyclists, might generally avoid. Similarly, a study conducted by Deakin University researchers revealed that the majority (84.5%) of women cyclists in their population preferred and used off-road bicycle lanes while men often used on-road bike lanes. A study by the University of Minnesota shows that drivers were significantly more likely to encroach—i.e. to pass closer than three feet—on a female cyclist than on male cyclists, thus creating and confirming a major female cyclist concern about safety on the road.
• Lack of confidence due to inadequate safe infrastructures for women cyclists - Safety has been identified as an overarching concern for women in cycling, where ‘cycling gender gap’ persists in areas where there is a lack of bike infrastructure (Moore, 2019). The risks of being cornered into vulnerable situations or even fatal accidents are much higher when without bicycle lanes, barriers, greenways, and the like. Data by Strava in New York City suggests an increase of 40% - 50% in the number of trips made by women when the city has installed parking-protected lanes on two corridors of avenues on its streets. Additionally, women have more to fear as drivers or motorists are more likely to invade a female cyclist’s space, which may be more due to patriarchal standards and chauvinist male culture.
Gender disparity and cycling behavior on secondary roads in Metro Manila should be further explored as a follow-up study. It is likely that the gender distribution will differ, due to the varying characteristics of secondary roads compared to primary roads or highways.
Helmet Use
Overall helmet use is relatively high among cyclists with 71.3% (26,478 cyclists) helmet-users out of the 38,932 total cyclists counted. Results also show that more cyclists wear helmets during the morning hours rather than in the afternoon. This is evident in all four cities.
Helmet use among the four cities exceeds more than 50% of the total cyclists counted except in Pasig city where only 48.3% of cyclists are helmet-users. Of the 28.7% (10,664 cyclists) not wearing helmets, Pasig City cyclists who are not helmet-users amount to 14.79% (5,759 cyclists) of that total. Meanwhile, only 2.5% (987 cyclists) are not wearing helmets in Quezon City where helmet use is compulsory for all cyclists.
MovementBased on observation of turning movements in screen-line and intersections, the volunteers noted the following :
1. There is an increased volume of cyclists at intersections and screenline count locations that connect major streets.
2. There is a difference in cyclist movement during the morning and the afternoon. General movement of morning cyclists are heading westbound ( to the direction of Manila-bound/ Makati bound) especially in boundary locations;
3. Cyclists counterflow in mostly major roads (Marikina-Infanta Highway, Commonwealth Avenue - PHILCOA Jollibee (Going to Fairview, Quezon City); E. Rodriguez Avenue, and Shaw Boulevard
4. Cyclists tend to use footbridges to cross along major roads.
23
Marikina
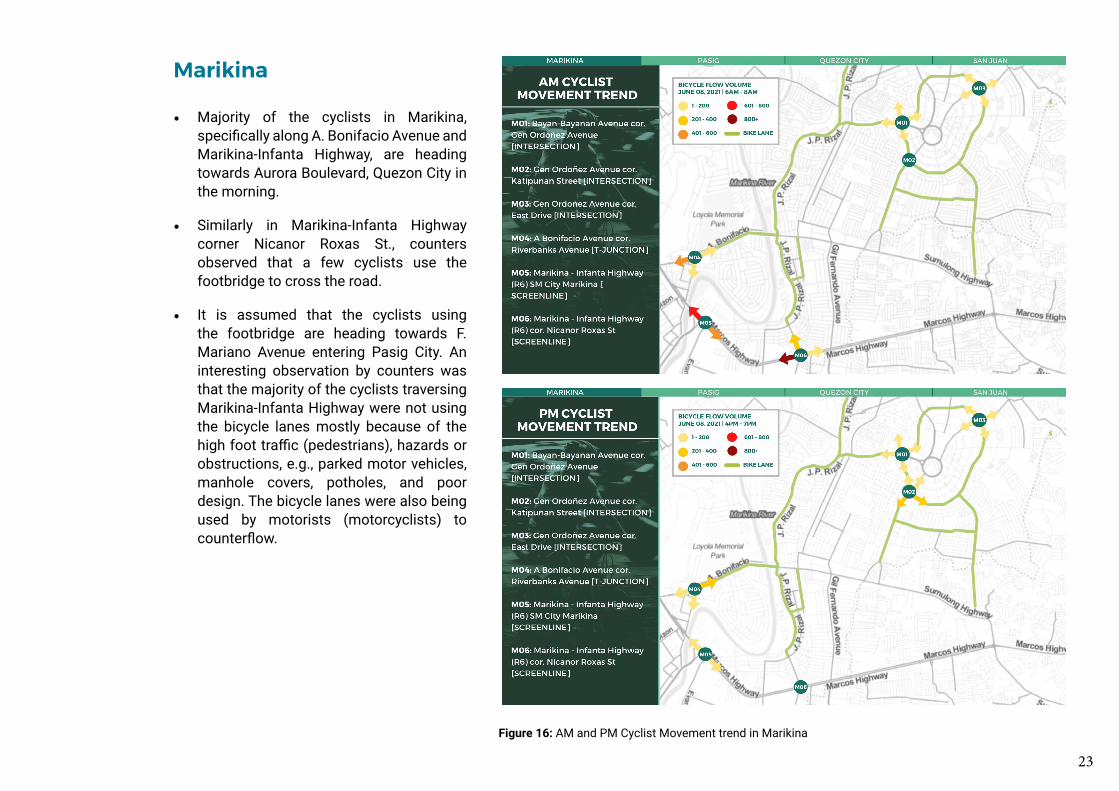
Figure 16: AM and PM Cyclist Movement trend in Marikina
• Majority of the cyclists in Marikina, specifically along A. Bonifacio Avenue and Marikina-Infanta Highway, are heading towards Aurora Boulevard, Quezon City in the morning.
• Similarly in Marikina-Infanta Highway corner Nicanor Roxas St., counters observed that a few cyclists use the footbridge to cross the road.
• It is assumed that the cyclists using the footbridge are heading towards F. Mariano Avenue entering Pasig City. An interesting observation by counters was that the majority of the cyclists traversing Marikina-Infanta Highway were not using the bicycle lanes mostly because of the high foot traffic (pedestrians), hazards or obstructions, e.g., parked motor vehicles, manhole covers, potholes, and poor design. The bicycle lanes were also being used by motorists (motorcyclists) to counterflow.
24
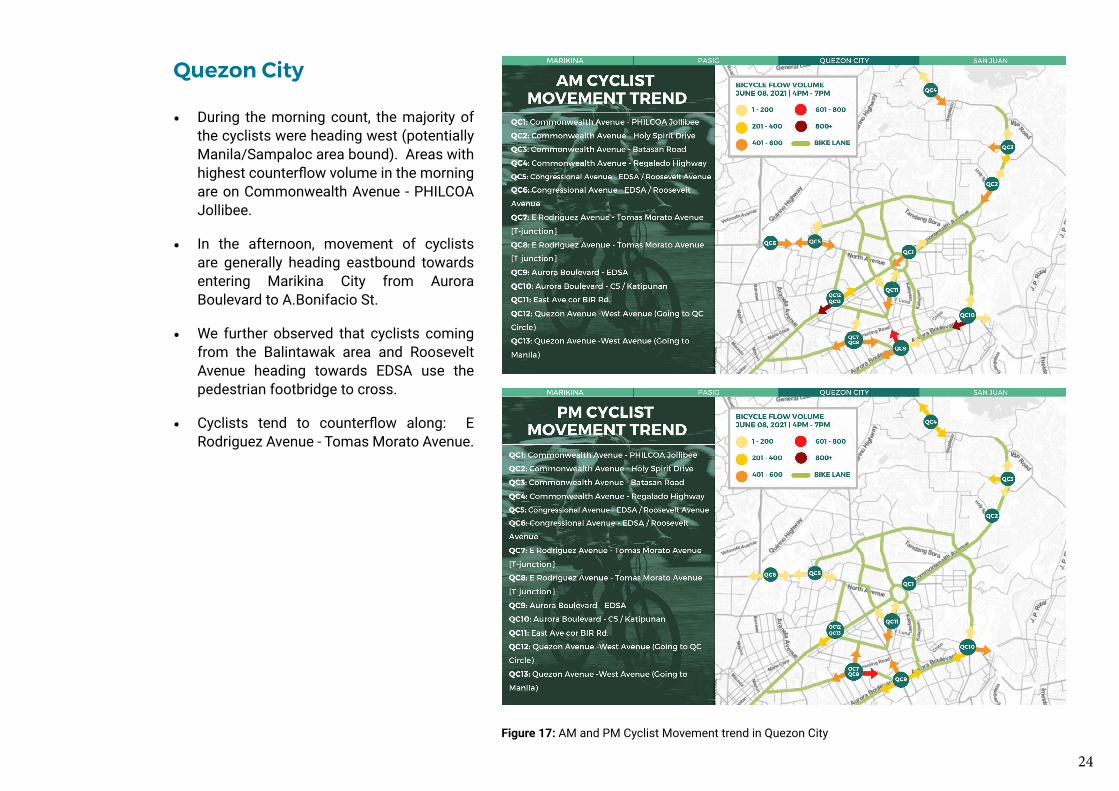
Figure 17: AM and PM Cyclist Movement trend in Quezon City
Quezon City
• During the morning count, the majority of the cyclists were heading west (potentially Manila/Sampaloc area bound). Areas with highest counterflow volume in the morning are on Commonwealth Avenue - PHILCOA Jollibee.
• In the afternoon, movement of cyclists are generally heading eastbound towards entering Marikina City from Aurora Boulevard to A.Bonifacio St.
• We further observed that cyclists coming from the Balintawak area and Roosevelt Avenue heading towards EDSA use the pedestrian footbridge to cross.
• Cyclists tend to counterflow along: E Rodriguez Avenue - Tomas Morato Avenue.

25
Figure 18: AM and PM Cyclist Movement trend in Pasig City
Pasig City
• There is a higher volume of cyclists in the morning, than in the afternoon. The movement trend observed is that cyclists are riding to exit premises of Pasig City.
• Cyclists along Shaw Boulevard coming from EDSA were observed to position themselves ahead of motorists at the T-junction or use the road island while waiting for the green light turning left to Meralco Avenue.
• Counters also observed that there was a high volume of cyclists who counterflow in Shaw Boulevard corner Meralco Ave.
• Notably, there was a high volume of cyclists and PMD-users going to F. Legaspi St. (no bike lanes) from C. Raymundo during the afternoon count.

26
Figure 19: AM and PM Cyclist Movement trend in San Juan City
San Juan City
• San Juan had only five locations counted. This could be related to the overall population of the city (126,347 residents, 2020 consensus with a land area of 7.77 km²). Based on the results, there’s not much of a difference in the movement between the morning and afternoon count.
• However, as observed during the morning count, cyclists usually counterflow along Ortigas Ave specifically in the intersection between Col. Bonny Serrano Ave, and Granada St. and in Ortigas Ave corner Wilson St.
27
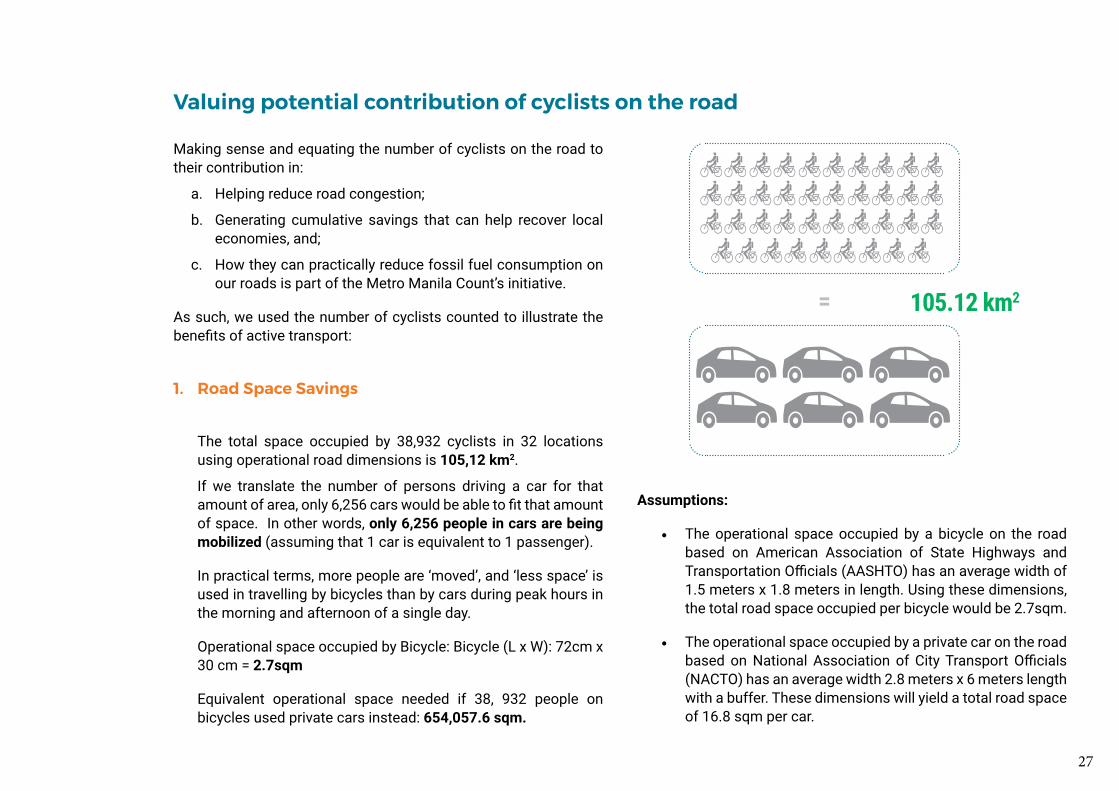
Valuing potential contribution of cyclists on the road
Making sense and equating the number of cyclists on the road to their contribution in:
a. Helping reduce road congestion;
b. Generating cumulative savings that can help recover local economies, and;
c. How they can practically reduce fossil fuel consumption on our roads is part of the Metro Manila Count’s initiative.
As such, we used the number of cyclists counted to illustrate the benefits of active transport:
1. Road Space Savings
The total space occupied by 38,932 cyclists in 32 locations using operational road dimensions is 105,12 km2.
If we translate the number of persons driving a car for that amount of area, only 6,256 cars would be able to fit that amount of space. In other words, only 6,256 people in cars are being mobilized (assuming that 1 car is equivalent to 1 passenger).
In practical terms, more people are ‘moved’, and ‘less space’ is used in travelling by bicycles than by cars during peak hours in the morning and afternoon of a single day.
Operational space occupied by Bicycle: Bicycle (L x W): 72cm x 30 cm = 2.7sqm
Equivalent operational space needed if 38, 932 people on bicycles used private cars instead: 654,057.6 sqm.
105.12 km2=
Assumptions:
• The operational space occupied by a bicycle on the road based on American Association of State Highways and Transportation Officials (AASHTO) has an average width of 1.5 meters x 1.8 meters in length. Using these dimensions, the total road space occupied per bicycle would be 2.7sqm.
• The operational space occupied by a private car on the road based on National Association of City Transport Officials (NACTO) has an average width 2.8 meters x 6 meters length with a buffer. These dimensions will yield a total road space of 16.8 sqm per car.
28
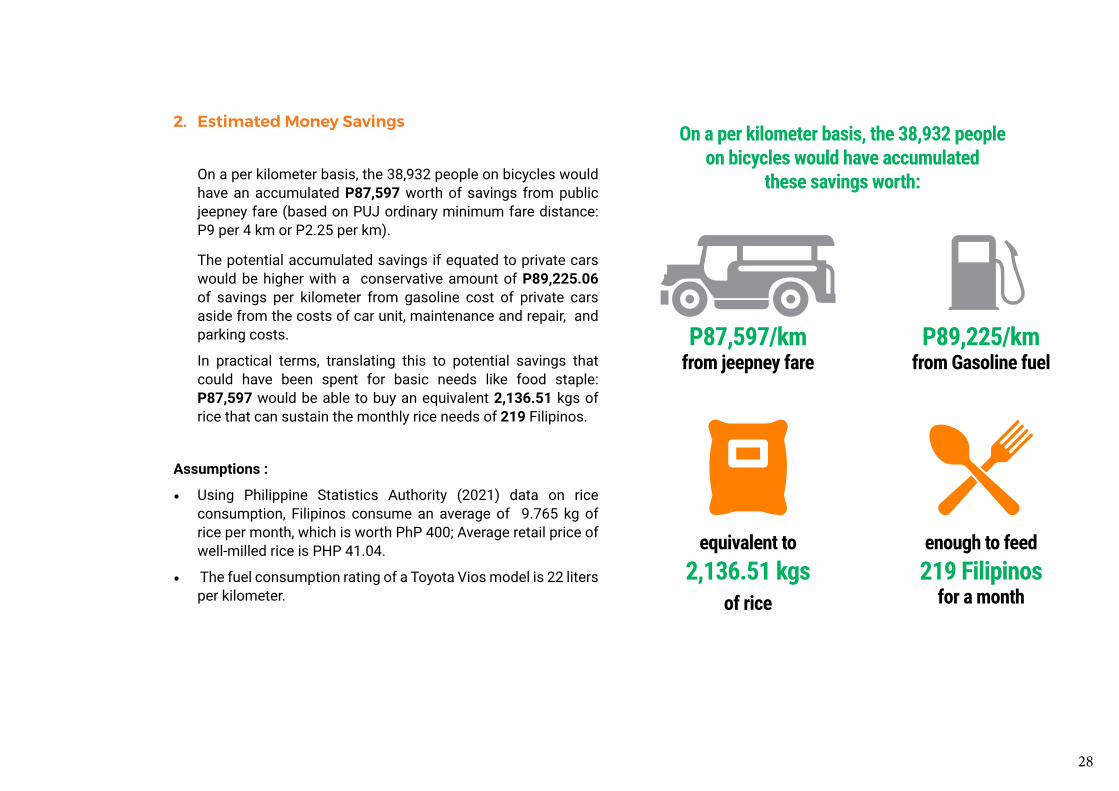
2. Estimated Money Savings
On a per kilometer basis, the 38,932 people on bicycles would have an accumulated P87,597 worth of savings from public jeepney fare (based on PUJ ordinary minimum fare distance: P9 per 4 km or P2.25 per km).
The potential accumulated savings if equated to private cars would be higher with a conservative amount of P89,225.06 of savings per kilometer from gasoline cost of private cars aside from the costs of car unit, maintenance and repair, and parking costs.
In practical terms, translating this to potential savings that could have been spent for basic needs like food staple: P87,597 would be able to buy an equivalent 2,136.51 kgs of rice that can sustain the monthly rice needs of 219 Filipinos.
Assumptions :
• Using Philippine Statistics Authority (2021) data on rice consumption, Filipinos consume an average of 9.765 kg of rice per month, which is worth PhP 400; Average retail price of well-milled rice is PHP 41.04.
• The fuel consumption rating of a Toyota Vios model is 22 liters per kilometer.
P87,597/kmfrom jeepney fare
On a per kilometer basis, the 38,932 people on bicycles would have accumulated
these savings worth:
equivalent to2,136.51 kgs
of rice
P89,225/kmfrom Gasoline fuel
enough to feed219 Filipinos
for a month

29
3. Estimated Fossil Fuel displaced
Using the Greenhouse Gas Equivalencies Calculator of the United States Environmental Protection Agency (US EPA, March 2021), the 38,932 people who chose to cycle rather than drive a car were able to displace an estimated 1,769.6 liters worth of gasoline fuel. This translates to an equivalent 4.2 metric tons of carbon dioxide avoided. The 1,769.6 liters worth of gasoline fuel displaced can only fuel 42 full-tanked vehicles.
Assumptions:
• A toyota vios has an fuel efficiency rating of 22 km/liter;
• Average retail price of gasoline fuel Php 50.42/liter;
• An average car, based on the specifications of Toyota Vios Sedan would have a full tank of 42 liters.
1,769.6 litersworth of gasoline fuel
= 4.2 metric tonsof CO2 avoided
The 38,932 people who chose to cycle ratherthan drive a car were able to displace an estimated:
30
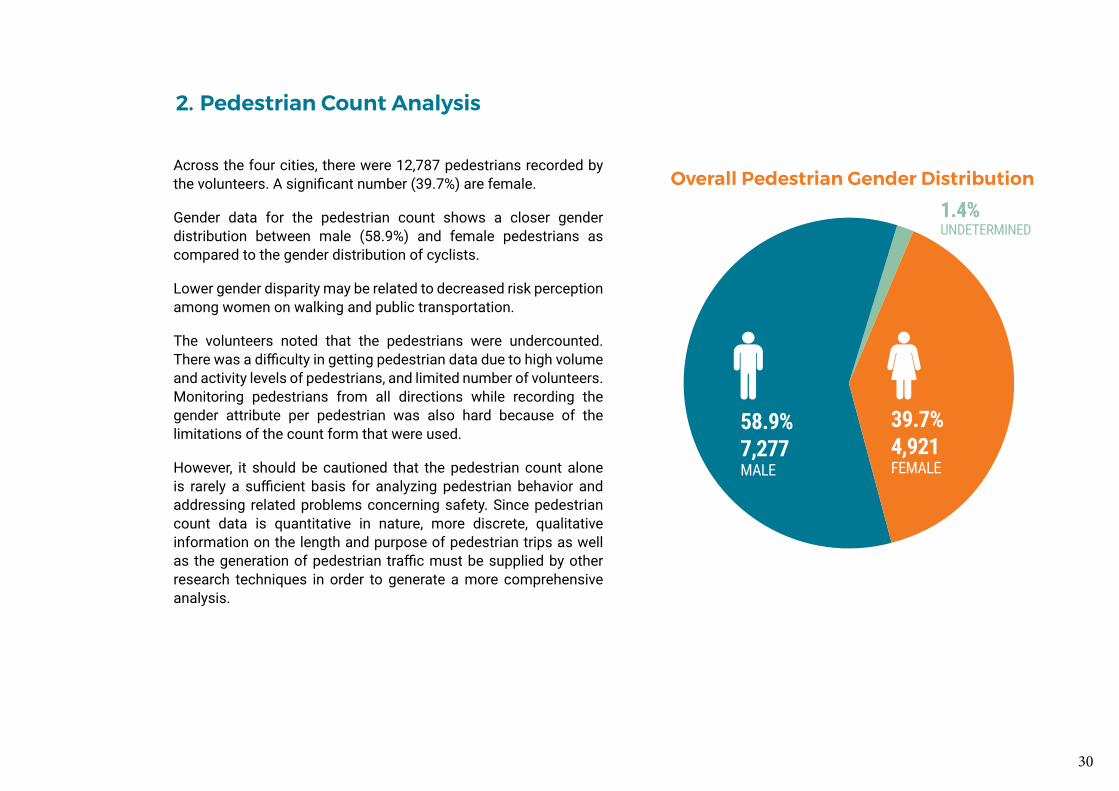
2. Pedestrian Count Analysis
Across the four cities, there were 12,787 pedestrians recorded by the volunteers. A significant number (39.7%) are female.
Gender data for the pedestrian count shows a closer gender distribution between male (58.9%) and female pedestrians as compared to the gender distribution of cyclists.
Lower gender disparity may be related to decreased risk perception among women on walking and public transportation.
The volunteers noted that the pedestrians were undercounted. There was a difficulty in getting pedestrian data due to high volume and activity levels of pedestrians, and limited number of volunteers. Monitoring pedestrians from all directions while recording the gender attribute per pedestrian was also hard because of the limitations of the count form that were used.
However, it should be cautioned that the pedestrian count alone is rarely a sufficient basis for analyzing pedestrian behavior and addressing related problems concerning safety. Since pedestrian count data is quantitative in nature, more discrete, qualitative information on the length and purpose of pedestrian trips as well as the generation of pedestrian traffic must be supplied by other research techniques in order to generate a more comprehensive analysis.
Overall Pedestrian Gender Distribution
39.7%4,921FEMALE
58.9%7,277MALE
1.4%UNDETERMINED

31
3. Other PMD-User Count Analysis
There were a total of 1,658 PMD users counted in the 32 locations in four cities; 62.7% and 30.7% of these were male and female respectively.
As for the distribution for helmet users, 68.5% were observed to be using helmet or other safety headgears while the remaining were seen without it.
Additionally, the mobility devices frequently used by the PMD-users monitored were e-scooters and skateboards.
Similar to the observations on pedestrians, the number of PMD users were observed to be undercounted, mainly because of limitations in the number of volunteers stationed in count locations.
32
VII. Recommendations The volunteers held an online debriefing session to provide feedback and initial observations on the Bike Count. The following were the general recommendations to further improve the Count Methodology:
i. To address the limitations on the number of volunteers - Rather than a simultaneous count in all cities, counts can be done per city on a common day on different working weeks ;
ii. Make the Count Regular - Bike and Pedestrian Count to be replicated in another season, or in a quarter basis to determine patterns and trends;
iii. Expand the scope to capture movement routes and potential gender-related factors - Consider doing counts on secondary roads to also capture potential cycling routes and explore and validate assumption on gender differences;
iv. Longer observation period needed - Workers especially those engaged in construction sector reports to work as early as 7 in the morning, and starts their commute as early as 4 in the morning; Likewise, women may have different commute time than men;
v. Assign dedicated volunteers to do separate counts for pedestrians, and PMD users and to monitor their movements respectively;
vi. Count Forms needs to be modified (Annex 1, Annex 2) to allocate more spaces for writing and separate data fields for other modes of non-motorised transport;
vii. Do simulation videos and actual count simulations during trainings;
viii. Invest visibility and safety gears for counters;
ix. Consider other data Sources to complement the Count - Other potential data sources such as Strava, personal smartphone health apps, bicycle share programs, and public security cameras are beyond the scope of this study but could be considered in the future as part of expanded non-motorized counting efforts;
x. Counts should be supplemented with other researches on non-motorized transport, including but not limited to: surveys on distance and route of travels, perceptions on pedestrian and cycling infrastructures, movements behavior (especially on specific factors on counter-flowing).

33
VIII. ReferencesHeesch et al. (2012). International Journal of Behavioral Nutrition and Physical Activity 2012, 9:106
James Carroll, William Brazil, Bruno Morando, Eleanor Denny. What drives the gender-cycling-gap? Census analysis from Ireland, Transport Policy, Volume 97, 2020, Pages 95-102, ISSN 0967-070X,
Lindsey, G. (2019, July 15). Bicycles, gender, and risk: Driver behaviors when passing cyclists. University of Minnesota Gender Policy Report. (2019, November 11).
Moore, D. (n.d.). Women love bikes-so why don’t they cycle to work? Quartz. https://qz.com/quartzy/1745124/why-women-dont-cycle-and-what-cities-can-do-about-it/.
Moore, D. (2019, October 28). Share of bike commuters by gender. Atlas. https://theatlas.com/charts/KV9Ra90XF.
Philippine Statistics Authority. (n.d.). Updates on Palay, rice and corn prices. https://psa.gov.ph/content/updates-palay-rice-and-corn-prices-0
Sanchez, R. (2020, May 09). Which is more fuel-efficient, Toyota Vios or Honda City? Retrieved from https://philkotse.com/car-buying-and-selling/which-is-more-fuel-efficient-toyota-vios-or-honda-city-6837
Strava (2019). Year in Sport 2019. Strava. https://1n4rcn88bk4ziht713dla5ub-wpengine.netdna-ssl.com/wp-content/uploads/2019/12/YIS-2019-Press-Book_US-1.pdf
Simeon, L. (2021, March 9). Bike imports double to 2.1 million amid pandemic. Philstar. https://www.philstar.com/business/2021/03/09/2082903/bike-imports-double-21-million-amid-pandemic
Szczepanski, C. (2013, August 6). New report: Women on a roll. League of American Bicyclists. https://bikeleague.org/content/new-report-women-roll.
US EPA. (n.d.) Greenhouse gas equivalencies calculator. US EPA. https://www.epa.gov/energy/greenhouse-gas-equivalencies-calculator

34
IX. AnnexAnnex 1: Count Forms Table Count FormDesigned to capture gender distribution, helmet-use, and peak hours

35
Diagram Count FormDesigned to capture movement trends
36
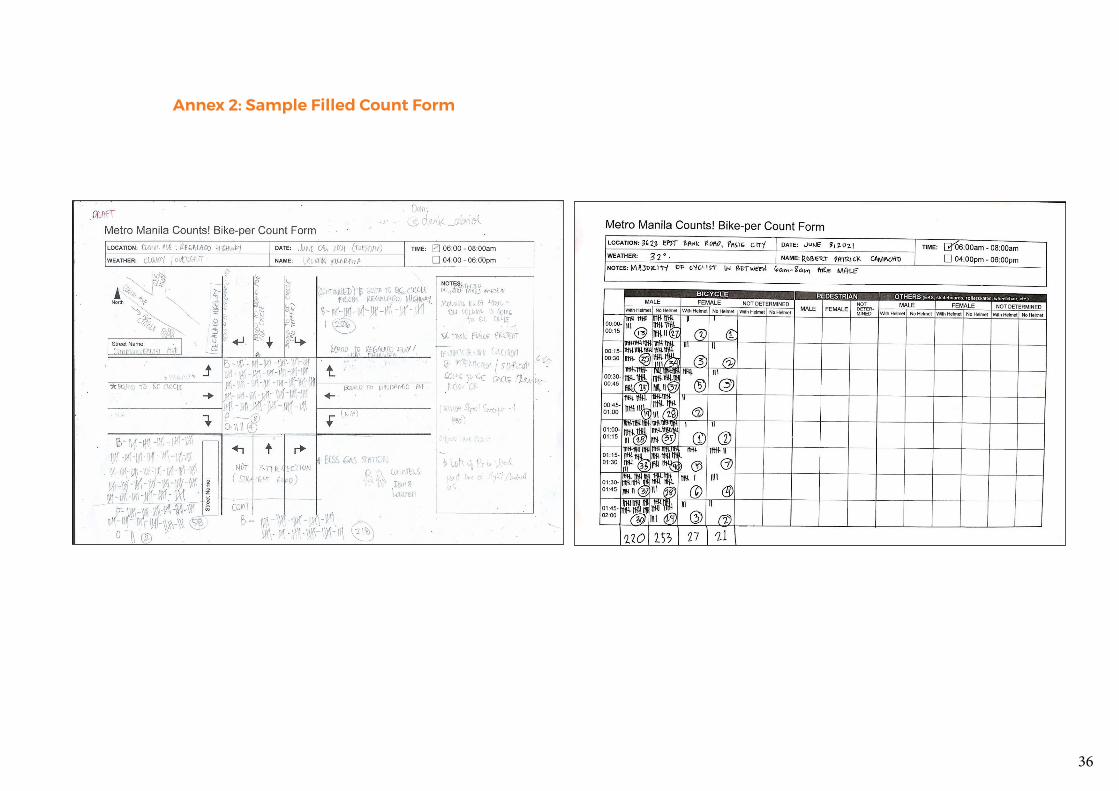
Annex 2: Sample Filled Count Form
37
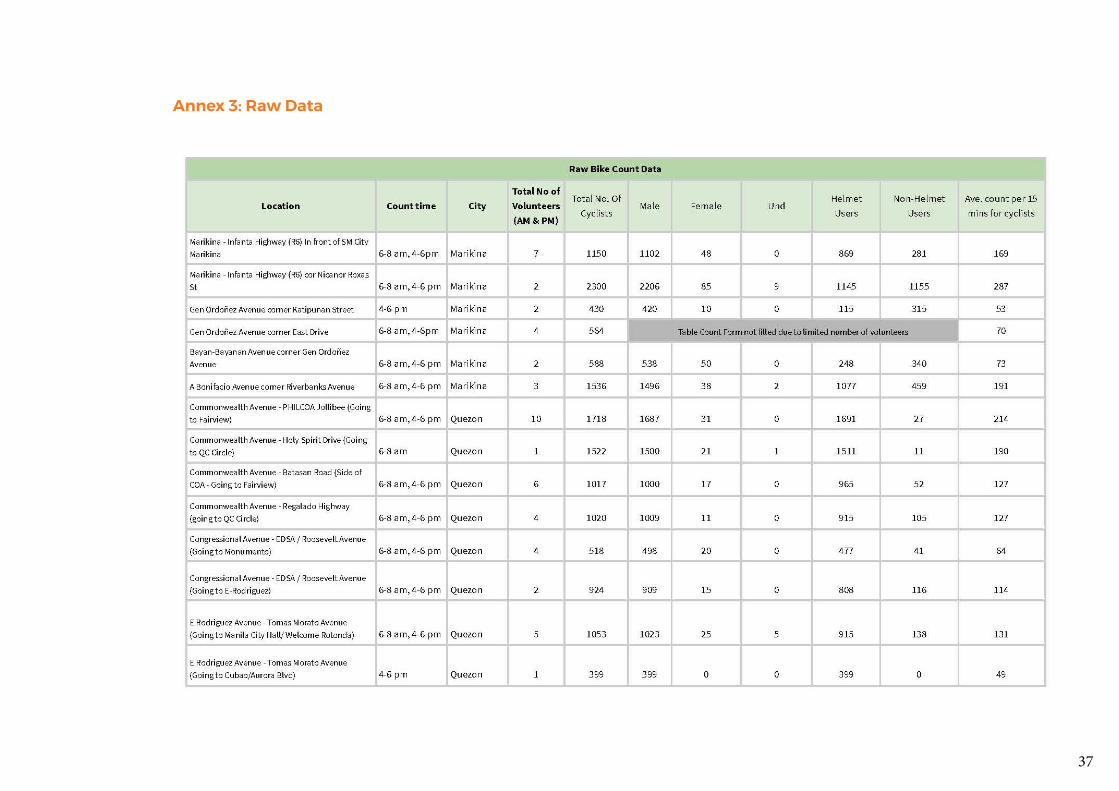
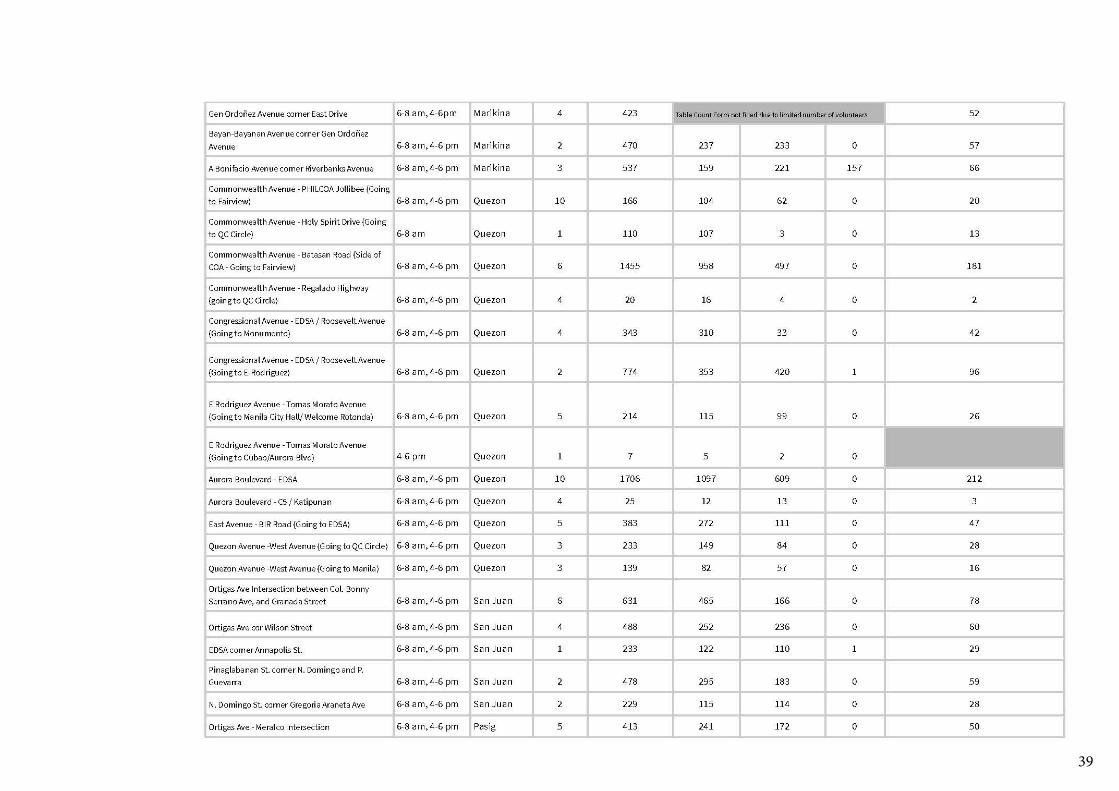
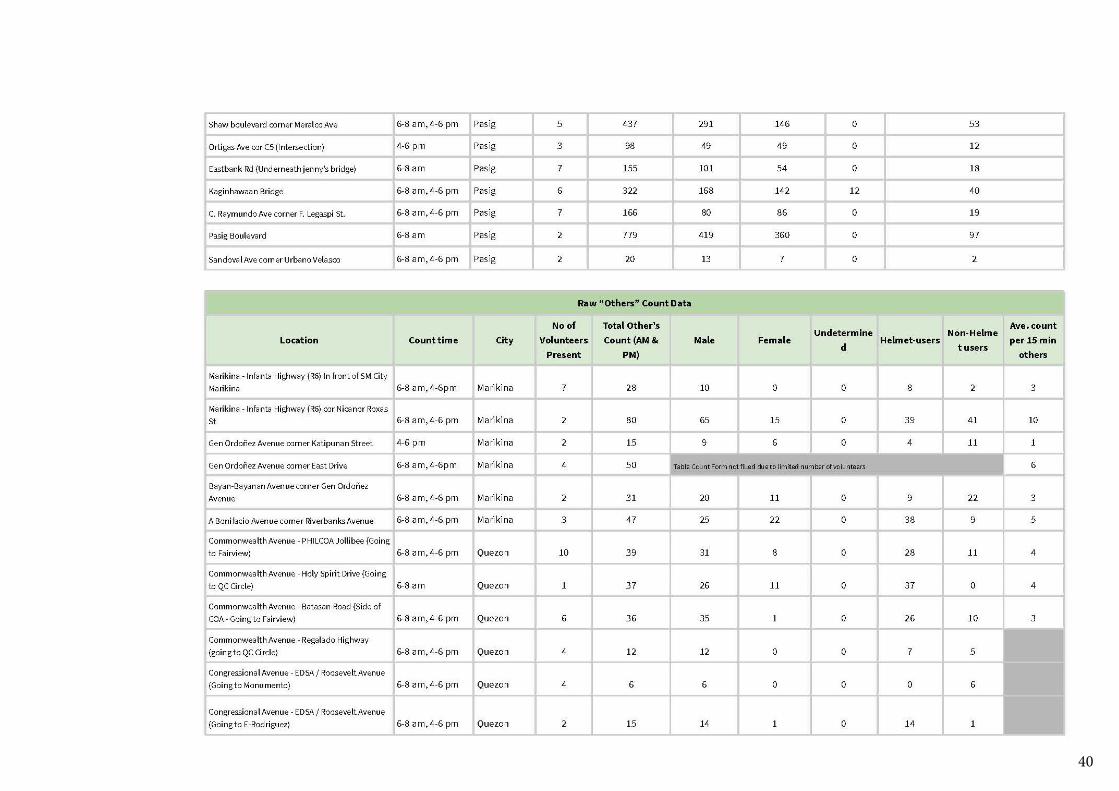
Annex 3: Raw Data

38
39
40
41