the co-operative bank plc pillar 3 disclosures 2015 · the pillar 3 disclosures in this document...
TRANSCRIPT

The Co-operative Bank plcPillar 3 Disclosures 2015

Page
2 1. Overview2 1.1 Background
2 1.2 Basis and frequency of disclosures
3 1.3 Location and verification
3 1.4 Scope of disclosure
4 1.5 Non-disclosure
4 1.6 Pillar 3 requirements disclosed in the 2015 Annual Report and Accounts
4 1.6.1 Biographies of the Board
4 1.6.2 Remuneration
4 1.7 Regulatory position
4 1.8 Summary of key capital ratios
5 2. Changes to disclosures
7 3. Capital adequacy7 3.1 Assessing the adequacy of internal capital
8 3.2 Capital stress testing
8 3.3 Capital adequacy
9 3.4 Capital ratios
9 3.5 Capital buffers
10 3.6 Capital resources
13 3.7 Pillar 1 capital requirements and Risk Weighted Assets
17 3.8 Leverage ratio
18 4. Risk Management governance18 4.1 Overview
18 4.2 Risk governance structure
19 4.3 Board and sub-committees
20 4.4 Executive and management committees
21 4.5 Risk Committee (RC)
Page
22 5. Risks and their management22 5.1 Overview
23 5.2 Risk Management objectives and policies
23 5.3 Risks Management Strategy and Appetite
23 5.4 Principal Risks categories
25 5.5 Credit risk
25 5.5.1 Management of credit risk
25 5.5.2 Credit risk control
27 5.5.3 Models used
30 5.5.4 Approach to validation
31 5.5.5 Credit risk exposures
33 5.5.6 Impaired and past due exposures
35 5.5.7 Analysis of Corporate exposures impaired and past due
37 5.5.8 IRB approach
42 5.5.9 Standardised approach
43 5.5.10 Supervisory slotting approach
43 5.5.11 Credit risk mitigation
45 5.5.12 Derivative credit exposure
51 5.5.13 Impairment
53 5.5.14 Securitisations
56 5.6 Liquidity and funding risk
56 5.6.1 Overview
57 5.6.2 Liquidity risk management framework
57 5.6.3 Liquidity risk policies
61 5.7 Market risk
61 5.7.1 Market risk management framework
62 5.7.2 Market risk appetite
62 5.7.3 Primary risk metrics and sources of market risk
64 5.8 Operational risk
66 5.9 Pension risk
66 5.10 Regulatory risk
66 5.10.1 Regulatory environment
67 5.10.2 Regulatory risk management
67 5.11 Conduct risk
67 5.12 People risk
67 5.13 Strategic and business risk
67 5.14 Reputational risk
68 Glossary
73 Appendix 1 – Capital Resources
77 Appendix 2 – Capital Instruments
78 Appendix 3 – Tables Index
The Co-operative Bank plc Pillar 3 Disclosures for the year ended 31 December 2015 1
Contents

1.1 BackgroundThis document sets out the Pillar 3 disclosures for The Co-operative Bank plc and its subsidiaries (the Bank) as at 31 December 2015. These disclosures havebeen prepared to give information on the basis of calculating capital requirements and on the management of risks faced by the Bank in accordance with therules laid out in the Capital Requirements Regulation (Part 8), unless otherwise stated and should be read in conjunction with the Risk sections of the Bank’sAnnual Report and Accounts including the Risk Management section and the Principal risks and uncertainties section. These are available on the InvestorRelations section of the Bank’s website www.co-operativebank.co.uk/investorrelations/financialresults
The European Union Capital Requirements Directive (CRD) came into effect on 1 January 2007. Commonly referred to as Basel II, the legislative frameworkintroduced capital adequacy standards and an associated supervisory framework in the European Union (EU). This was replaced by Capital RequirementsRegulation (CRR) and Capital Requirements Directive (together collectively known as CRD IV) which came into force 1 January 2014. In the UK, implementationof the Directive has been through rules introduced by the Prudential Regulation Authority (PRA). These are known as Pillar 3 disclosures because theycomplement the minimum capital requirements in Pillar 1 and the supervisory review process in Pillar 2. The Pillar 3 disclosures are aimed at promoting marketdiscipline by providing information on risk exposures and the management of those risks.
The Bank has a PRA waiver to use the Internal Ratings Based (IRB) approach to credit risk. This allows the Bank to calculate capital requirements for some of theRetail, Corporate and Treasury assets classes using internally developed models that reflect the credit quality of the assets.The Bank is in discussion with thePRA to remediate areas of non-compliance related to the use of IRB approaches. Please refer to the Bank’s 2015 Annual Report and Accounts, Principal risksand uncertainties section, for further details of this issue.
The Bank currently has approval to use the following IRB approaches outlined below:
• Retail IRB - internal calculations of Probability of Default (PD), Loss Given Default (LGD) and credit conversion factors are used to model risk exposures;
• Foundation IRB – uses internal calculation of PD, but standardised regulatory defined LGD and credit conversion factors;
• Foundation IRB (slotting approach) – exposures are modelled and mapped to five supervisory categories from strong to default (slotting categories 1–5respectively) with prescribed risk weights and expected losses;
• Foundation IRB (securitisation ratings based approach) – external credit ratings are used to map exposures to regulatory defined risk weights.
The table below illustrates the portfolios where the Bank has permission to use each of the IRB approaches:
For other exposures and risk areas, the standardised approach is adopted, which uses capital risk weighting percentages set by CRD IV requirements.
1.2 Basis and frequency of disclosuresIn meeting these disclosure requirements, the Bank has also considered recommendations made by the Enhanced Disclosure Task Force (EDTF) which seeks togive enhanced information above and beyond the minimum Pillar 3 disclosure requirements. These are set out in more detail in Section 2: Changes todisclosures.
Basel III was implemented in the UK from 1 January 2014, through both the European CRR and the Capital Requirements Directive (CRD IV) and through thePRA’s policy statement PS7/13 www.bankofengland.co.uk/pra/Pages/publications/implemcrdiv.aspx. The term CRD IV is used throughout these disclosures asa collective term for CRD IV, CRR and the PRA's policy statement.
Asset Portfolio IRB exposure classes CRD approach
Retail Mortgages (including Buy to LetMortgages) Credit cards/OverdraftsLoans
Retail – secured by immovable property
Qualifying revolving retail exposuresRetail other non-SME
Retail IRB
Retail IRBRetail IRB
Corporate Corporate (total assets >£350k)Business BankingRegistered social landlords (RSL)/housingassociationsSpecialised lending
CorporatesCorporatesCorporates
Corporates
Foundation IRBFoundation IRBFoundation IRB
Foundation IRB(slotting approach)
Treasury Financial institutionsStructured investments/credit tradingfundsSecuritisation
InstitutionsCorporates
Securitisation
Foundation IRBFoundation IRB (securitisationratings based method)Foundation IRB (securitisationratings based method)
2 The Co-operative Bank plc Pillar 3 Disclosures for the year ended 31 December 2015
1. Overview

1.2 Basis and frequency of disclosures continuedThese disclosures may differ from similar information in the 2015 Annual Report and Accounts prepared in accordance with International Financial ReportingStandards, with the information included in Pillar 3 being prepared in accordance with CRD IV; the information in these disclosures may therefore not be directlycomparable with that information. All figures are as at 31 December 2015, the Bank’s year end, unless otherwise stated.
Disclosures are issued on an annual basis and published on the same day as publication of the Annual Report and Accounts.
1.3 Location and verificationThis report was prepared and approved in line with the Bank’s Pillar 3 policy, which is approved on a yearly basis by the Audit Committee (AC). No significantchanges have been made to the Pillar 3 policy compared to the prior year.
Business owners attest accuracy of their data and at the same time consistency checks and reconciliations were performed with the Bank’s 2015 Annual Reportand Accounts and regulatory returns where applicable. The disclosures have been subject to internal verification and reviewed by the Bank’s Audit Committee(AC) and Risk Committee (RC) on behalf of the Board but have not been, and are not required to be subject to independent external audit. They are published onthe Bank’s website www.co-operativebank.co.uk/investorrelations/financialresults
1.4 Scope of disclosureThe Pillar 3 disclosures in this document relate to The Co-operative Bank plc (PRA firm reference number 121885). The principal subsidiary undertakingsincluded within these disclosures are:
* A capital deduction is made at a solo consolidated level to represent the equity investment in these companies. No equity investment is held in securitisation vehicles hence there is no capital deduction ata solo consolidated level.
All entities are fully consolidated (i.e. none are proportionally consolidated) and registered and operating in the UK.
Until its expiry in September 2014, the Bank had regulatory approval to operate with a ‘solo-consolidation’ permission, which allowed it to be regulated forprudential purposes as though the Bank and specified solo-consolidated subsidiaries formed a single legal entity. In March 2015, the Bank was granted a newpermission to apply solo consolidation, though with respect to a smaller number of subsidiaries as per the table above. In addition the Bank has been grantedregulatory approval for a Core UK Group permission to allow its exposures to those FCA-authorised subsidiaries no longer part of its solo-consolidation, to beexempt from large exposure thresholds. The scope of the Bank’s prudential consolidation is the same as its consolidation for accounting purposes.
Operating company Nature of business
Consolidatedcapital
regulatoryreturns
Soloconsolidated
capitalreturns
The Co-operative Bank plc Banking Yes Yes
Co-operative Commercial Limited Investment company Yes No*
Britannia Treasury Services Limited Holding company Yes Yes
Platform Funding Limited, Platform Home Loans Limited Mortgage origination, Platform servicingcompany
Yes No*
Platform Group Holdings Limited, Platform Consumer Services Limited Holding companies Yes Yes
Platform Funding No.2 Limited, Platform Funding No.3 Limited, PlatformFunding No.4 Limited, Platform Funding No.5 Limited, Platform FundingNo.6 Limited
Dormant entities in liquidation Yes Yes
Mortgage Agency Services Number One, Two, Four, Five, Six Limited Mortgage lending (acquired) Yes No*
First Roodhill Leasing, Second Roodhill Leasing, Third Roodhill Leasing,Fourth Roodhill Leasing, Roodhill Leasing Limited
Leasing Yes Yes
Britannia Asset Management Limited Holding company Yes Yes
Britannia Development and Management Company Limited Property Investments Yes Yes
Britannia Life Direct Limited Financial Services Yes Yes
Moorland Covered Bonds LLP Mortgage acquisition and guarantor ofcovered bonds
Yes No
Leek Finance (Number Seventeen, Eighteen, Nineteen) plc Securitisation vehicles Yes No
Silk Road Finance Number Three plc Securitisation vehicle Yes No
Meerbrook Finance Number Eight Limited Securitisation vehicle Yes No
Calico Finance Number One Limited Securitisation vehicle Yes No
The Co-operative Bank plc Pillar 3 Disclosures for the year ended 31 December 2015 3
1. Overview continued

1.5 Non-disclosure In accordance with European Banking Authority (EBA) guidelines on materiality, proprietary and confidentiality and on disclosure frequency, the Bank has notincluded the following disclosures on the grounds of immateriality:
• CRR Article 442(d),(h) split of geographical exposures. The Bank’s exposures are predominately within the UK and therefore the geographical split has notbeen disclosed;
• CRR Article 447 regarding equity disclosures (Exposure At Default (EAD) of £60.5m as at 31 December 2015 and £8.1m as at 31 December 2014).
The Bank did not omit any disclosures on the grounds of proprietary or confidential information.
1.6 Pillar 3 requirements disclosed in the 2015 Annual Report and Accounts1.6.1 Biographies of the BoardThe number of directorships held by members of the management body, their actual knowledge, skills and expertise have been disclosed in the 2015 AnnualReport and Accounts, Corporate Governance section, while the policy on diversity with regard to selection of members of management body and recruitmentpolicy has been disclosed in the 2015 Annual Report and Accounts, Nomination Committee report. The 2015 Annual Report and Accounts are published on theBank’s website www.co-operativebank.co.uk/investorrelations/financialresults
1.6.2 RemunerationIn order to comply with the disclosure requirements of CRD IV and the PRA’s Remuneration Code, the responsibilities and decision making process fordetermining remuneration policy, the link between pay and performance and the design and structure of remuneration, including performance pay plans, havebeen disclosed in the 2015 Annual Report and Accounts, Directors’ Remuneration report. The 2015 Annual Report and Accounts are published on the Bank’swebsite www.co-operativebank.co.uk/investorrelations/financialresults
1.7 Regulatory positionIn December 2014, the Bank submitted a Revised Plan to the PRA.The Revised Plan was designed to help the Bank comply with Financial Conduct Authority(FCA) and PRA regulatory requirements and expectations.The Bank has an Updated Plan covering the period 2016-2020. The Board have reassessed theOptimum Portfolio and given current market conditions, expect to hold this portfolio for at least the short term future. However the Bank will continue to reassessthis position, considering market conditions, over time. Please see 2015 Annual Report and Accounts, Principal risks and uncertainties, for further informationregarding the Bank’s regulatory position.
There are no current or foreseen material restrictions or legal impediments to the movement of capital or to the repayment of liabilities between UK basedconsolidated entities, with the exception of:
• securitisation vehicles and Covered Bond LLP with assets being ring-fenced within such entities.
1.8 Summary of key capital ratiosThe Bank’s key capital ratios are included below:
Table 1 CRD IV key capital ratios2015 2014
Transitional Fully Loaded Transitional Fully Loaded
Common Equity Tier 1 ratio 15.5% 15.5% 12.7% 13.0%
Total Capital Ratio 21.6% 21.6% 14.9% 15.0%
Risk Weighted Assets (£m) 7,422.9 7,422.9 12,632.2 12,632.2
Leverage ratio 3.8% 4.2%
The Banks leverage ratio is calculated on a fully loaded basis in line with PRA guidance. Further details on the Bank’s capital and leverage positions can be foundin section 3 of this document.
4 The Co-operative Bank plc Pillar 3 Disclosures for the year ended 31 December 2015
1. Overview continued

Basel III has been implemented in the EU through publication of CRR and a further iteration of CRD. Together this package of requirements is known as CRD IVand came into force 1 January 2014. The European Banking Authority is providing technical standards relating to CRD IV some of which are not yet finalised.CRD IV disclosures in this document are based on the Bank’s interpretation of published rules. The Bank publishes its Pillar 3 disclosures on an annual basis;hence its 31 December 2014 Pillar 3 disclosures were the first to be fully disclosed on a CRD IV basis. Both the 2015 and 2014 comparatives included withinthese disclosures are reported on a CRD IV basis.
The Bank has continued to review its disclosures in line with EDTF recommendations and has made the following improvements to its EDTF disclosures:
• EDTF 19 – qualitative disclosure on the impact of encumbrance on business model;
• EDTF 20 – maturity split on tables 40 and 41;
• EDTF 31 – description of other risks (i.e. Fraud risk, Information and Data risk, Anti-Money Laundering risk, Technology risk, Legal risk, Insurance risk).
Further information regarding the EDTF recommendations can be found at www.fsb.org/2014/09/r_140930a/
Table 2 EDTF disclosure The table below provides an index to the Bank’s disclosures in accordance with the EDTF’s recommendations either within its Annual Report and Accounts orPillar 3 disclosures.
Type of risk Recommendation DisclosureSection inPillar 3
Section in RiskManagement
Other sections ofthe accounts
General 123
4
Risks to which the business is exposed Definition of risk terminology, principles and appetite Top and emerging risks and the changes during the reportingperiod Analysis of future regulatory developments affecting our businessmodel and the Bank’s profitability
555
5
RiskManagementobjectives andpolicies 3.1-3.6
Strategic review
Riskgovernanceand riskmanagement
5
678
The Bank’s risk management organisation, process and keyfunctions Risk culture and risk governance and ownership Key risks, risk appetite and risk managementStress testing and the underlying assumptions
4
44, 53
RiskManagementobjectives andpolicies 3.1-3.6
CapitalManagement
Strategic review
Capitaladequacy
9
10
11
12
13141516
17
Minimum Pillar 3 disclosure requirements
Reconciliation of accounting balance sheet to regulatory balancesheet Flow statement of movements in regulatory capital since theprevious reporting period including changes in Common EquityTier 1, Tier 1 and Tier 2 Capital Discussion of targeted level of capital and how this will beestablishedAnalysis of Risk Weighted AssetsAnalysis of capital requirements for each Basel asset classAnalysis of credit risk for each Basel asset class Flow statements reconciling the movements in Risk WeightedAssets for each Risk Weighted Asset typeDiscussion of Basel credit risk model performance
3
3
3
1,3,5
3333
5
CapitalManagement
The Co-operative Bank plc Pillar 3 Disclosures for the year ended 31 December 2015 5
2. Changes to disclosures

Type of risk Recommendation DisclosureSection inPillar 3
Section in RiskManagement
Other sections ofthe accounts
Liquidity andfunding
1819
20
21
Analysis of the Bank’s liquid asset buffer Encumbered and unencumbered assets analysed by balancesheet category Consolidated total assets, liabilities and off-balance sheetcommitments analysed by remaining contract maturity at thebalance sheet dateAnalysis of the Bank’s sources of funding
55
5
5
Liquidity risk 2.4Liquidity risk 2.6
Liquidity risk 2.5
Liquidity risk 2.4
Market risk 22
23
2425
Relationship between the market risk measures for trading andnon-trading portfolios and the balance sheetDiscussion of significant trading and non-trading market riskfactorsVaR assumptions, limitations and validation Description of the primary risk management techniquesemployed by the Bank
5
5
55
Market risk 3.1
Market risk 3.4
Market risk 3.1Market risk 3.4
Credit risk 26
27
28
29
30
Analysis of the aggregate credit risk exposures
Describe the policies for identifying impaired and non-performingloans
Reconciliation of the opening and closing balances of non-performing or impaired loans in the period
Analysis of counterparty credit risk that arises from derivativetransactions
Discussion of credit risk mitigation, including collateral held for allsources of risk
5
5
5
5
5
Credit risk 1.1,1.2, 1.3
Credit risk 1.1
Credit risk 1.1
Credit risk 1.2
Credit risk 1.1,1.2, 1.3
Note 16: loansand advances tobanksNote 17: loansand advances tocustomersNote 18:investmentsecuritiesNote 19:derivativefinancialinstruments
Other risks 31
32
Description of other risks
Discussion of publicly known risk events
5
5
4-10
4-10
Note 32:Provisions forliabilities andchargesNote 35:Contingentliabilities andcommitments
6 The Co-operative Bank plc Pillar 3 Disclosures for the year ended 31 December 2015
2. Changes to disclosures continued
3.1 Assessing the adequacy of internal capital Capital is held by the Bank to protect its depositors, to cover its inherent risks, to absorb unexpected losses and to support the development of the business. TheBank’s objective is to achieve a capital base in excess of regulatory requirements.
Assessment of capital adequacy is made on a forward looking basis with reference to prevailing and forthcoming prudential rules including those underconsultation. From 1 January 2014 the Bank has been subject to CRD IV which implemented Basel III within the European Union.
The Asset and Liability Committee (ALCO) is responsible for ensuring that the capital and solvency position of the Bank is managed in line with policy. The CapitalManagement Forum (CMF) is a sub-forum of ALCO and is responsible for oversight of all aspects of the Bank’s capital risk management, monitoring and controlincluding consideration of prudential regulations. CMF has specific responsibility as follows:
• review, challenge and monitor current and forecast capital adequacy with reference to regulatory requirements, Board risk appetite and financial plan;
• review and ratify the Bank’s Internal Capital Adequacy Assessment Process (ICAAP) and capital adequacy stress testing;
• assess and report on risks and opportunities to plan and on capital management actions;
• review and monitor the Bank’s capital management control standards; and
• report to and make recommendations to ALCO as appropriate.
The Bank’s approach to assessing capital adequacy to support current and future requirements is conducted via the Bank’s ICAAP, the financial planningprocess and through stress testing and scenario analysis. Stress testing is performed at least annually, with a formal ICAAP submission required to be submittedto the PRA at least once every two years. The Bank’s ICAAP is constructed in two stages:
Stage 1 – initially assesses the capital adequacy of the Bank’s Pillar 1 charge (credit, market and operational risks), and analyses and quantifies, whereappropriate, additional Pillar 2 risks (including operational risk add-on, concentration risk, pension scheme risk, interest rate risk in the banking book,securitisation risk, resilience, reputational risk and contagion risk).
Stage 2 – models the Bank’s five year plan earnings and balance sheet in order to ensure that its Pillar 1 and Pillar 2 capital requirements are met during asevere but plausible stressed environment over the plan period, utilising appropriate management actions. The Bank’s most material risk is credit risk, makingup 87.8% of its Risk Weighted Assets (RWAs). On this basis, the Bank’s principal stress in determining its Pillar 2 capital is that of credit quality deterioration as aresult of the Bank’s chosen view of stress conditions.
Through most of 2015 the Bank was compliant with its Individual Capital Guidance (ICG), being the PRA’s statement as to the regulatory capital it expects theBank to hold. However, due to the Bank’s ongoing losses, this position should be regarded as a temporary situation as the Bank is not expected to be sustainablycompliant until the latter stages of the planning period. This unsustainable non-compliance relies on the PRA’s continued acceptance of the Bank’s Updated Plan(2016-2020). There is therefore a risk that the PRA may exercise any of its wide-ranging powers over the Bank, including the imposition of a special resolutionprocedure. The Bank met the Pillar 1 capital requirement throughout the year.
The Bank is mindful of the capital implications of the Bank of England’s minimum requirement for own funds and eligible liabilities (MREL) regime and theincreased debt issuance this will drive, for the banking industry in general but also for the Bank.
The Bank of England published a consultation paper in December 2015 proposing a methodology for setting a firm’s individual MREL requirement at a minimumof 2 x (Pillar 1 + Pillar 2a).
The Bank’s Updated Plan (2016-2020) incorporates MREL qualifying issuance commencing in 2018 which is the Board’s current view of the earliest time whensuch issuance may be feasible.The PRA and the Bank of England have indicated their strong preference that the Bank incorporates an earlier profile of MRELissuance than currently contemplated by the Bank’s Updated Plan. Such expectations have been confirmed by the regulators as not intended yet to representthe formal setting of a required MREL issuance plan and the Bank of England has stated that it will consult with the Bank before setting binding requirements,which it will be able to do at any point following publication of its MREL policy (expected to be sometime in 2016).
Should the Bank be able to issue MREL earlier than currently considered feasible, then it would do so, which might further delay ICG and PRA buffer complianceand Core Bank operating profitability. The PRA and Bank of England are aware of these possible outcomes and the PRA has accepted the Bank’s Updated Plan. Ifin due course the Bank becomes subject to a binding requirement to issue MREL and it is unable to do so when required, the Bank’s regulators can agree toaccept the Bank’s original issuance plan, a revised issuance plan, require some other action on the part of the Bank or in the absence of any of these the Bank ofEngland may exercise its powers under the Banking Act 2009.1 In considering the viability the Board has taken note of the contents of PRA consultation paper(CP 44/15) and the Board believes that resolution is less likely than the other outcomes while the Bank is executing its plan as approved by the PRA andcontinuing to de-risk the Bank.2
Both regulators acknowledge and recognise that any change to the Bank’s current planning assumptions for MREL would have to be subject to the overallfeasibility of the Bank being able to issue MREL which would need to take into account multiple factors including (without limitation): market conditions, investorappetite, pricing, the Bank’s financial performance and plans, and its then existing capital position.
This issue will be kept under close review by the Board, the Bank of England and the PRA periodically over the life of the plan period.
The Co-operative Bank plc Pillar 3 Disclosures for the year ended 31 December 2015 7
3. Capital adequacy
(1) Details of how the Bank of England’s resolution powers operate under the Banking Act 2009 generally operate can be found set out in a document “The Bank of England’s approach to resolution,October 2014” which can be found on its website at www.bankofengland.co.uk/financialstability/Documents/resolution/apr231014.pdf
(2) PRA CP 44/15 “The minimum requirements for own funds and eligible liabilities (MREL) Buffer and Threshold Conditions” was published on 11 December 2015 and sets out that PRA processesto adopt a policy that if a firm is in breach of its MREL requirement, it would not automatically mean that the PRA will consider the firm is failing, or likely to fail, to satisfy Threshold Conditions.

3.1 Assessing the adequacy of internal capital (continued)There is no guarantee that the Bank’s regulators will not enforce stricter regulatory capital requirements on the Bank (whether specifically applicable to the Bankor to banks more generally) or that the Bank will not be required to issue additional capital to satisfy MREL.
The Bank’s Updated Plan anticipates that the Bank will meet the 7% Common Equity Tier 1 (CET1) ratio throughout the planning period and will have sustainablymet ICG by the latter stages of the planning period. The Updated Plan aims to build a sustainable Core Bank and is designed to create a capital buffer whichwould withstand a severe stress scenario equivalent to the 2014 Bank of England stress test by the latter stages of the planning period.
3.2 Capital stress testingThe Bank uses stress testing as part of its assessment of capital adequacy within its:
• Strategic Plan;
• ICAAP; and
• forecasting exercise.
Stress testing is embedded within the Bank’s financial planning process, with stressed scenarios applied to the Bank’s latest forecasts, at least on an annualbasis or more frequent, where required. This enables the Bank’s senior management and Board to assess the Plan under adverse scenarios to ensure the Planremains within the risk appetite or that appropriate strategic decisions can be taken. Where outcomes fall outside of the risk appetite, they are either riskaccepted or management actions are identified and embedded to return the position within the risk appetite.
Scenarios capture a multitude of macroeconomic variables including Gross Domestic Product (GDP), interest rates, unemployment, house prices andcommercial real estate prices. An example scenario includes Euro sovereign debt concerns and weakening global economic activity, causing UK exports torecede. The Bank performs stress testing according to PRA’s defined scenarios, as well as its own bespoke scenarios.
Individual business areas prepare business plans as part of the Strategic Planning process. Stress testing models are utilised to stress test business plans over aforward looking planning horizon.
Stress testing results are prepared on both a pre and post management action basis, and compared to both risk appetite and minimum regulatory requirements.Review and challenge of stress testing results are undertaken by the business and the second line of defence, as part of the Bank’s Risk ManagementFramework (RMF).
The Bank also undertakes reverse stress testing to assess the point at which the Bank is likely to fail on both an individual and combined event basis.
The Bank was a participant in the Bank of England 2014 UK concurrent stress test of the eight major UK banks and building societies. This was designedspecifically to assess resilience to a very severe housing market shock and to a sharp rise or change in interest rates. This was not a forecast or expectation bythe Bank of England regarding the likelihood of a set of events materialising, but a coherent, severe ‘tail risk’ scenario.
Results of this exercise were published on 16 December 2014 and can be found on the Bank of England website www.bankofengland.co.uk
As a result of the stress test, the Bank submitted a Revised Plan which was accepted by the PRA in December 2014.This Plan was designed to enable the Bankto withstand a severe stress by the end of the planning horizon.
Following the stress assessment, the Bank was not included in the 2015 Bank of England stress test since this test was designed to assess resilience to adeterioration in global economic conditions. The Bank was not included as a result of the size of the Bank’s balance sheet, which is significantly smaller than theother banks which were included in the stress test; therefore the resilience of the Bank is unlikely to affect the resilience of the financial system as a whole.
Following the approval of the Bank’s Updated Plan, the Bank’s risk appetite is to ensure that the Bank is capital resilient and achieves Individual Capital Guidance(ICG) and PRA Buffer compliance by the end of the Plan.
The Bank’s Updated Plan is complex and the execution risk is significant. Please see the Principal risks and uncertainties section of the 2015 Annual Report andAccounts for further details.
3.3 Capital adequacyAll CRD IV disclosures are shown on a transitional and fully loaded basis except for the leverage ratio which is only calculated on a fully loaded basis. Through itsPolicy Statement PS7/13, the PRA implemented CET1 deductions and prudential filters in full from 1 January 2014, with the exception of available for saleunrealised gains, which had a transitional provision for 2014 only. The Bank’s fully loaded and transitional positions for Additional Tier 1 and Tier 2 capital weresimilar during 2014, however minority interests retained a transitional element. Given the Bank disposed of a 20.0% share in Unity Trust Bank (UTB), reducingit’s shareholding to 6.7%, UTB is no longer a minority interest and is treated as an equity investment. Therefore the Bank no longer has any transitionalprovisions in December 2015.
During 2015 the Bank has continued to make progress towards improving its capital position and reducing its overall risk profile. The Bank closed its inauguralwhole structure securitisation as part of its Non-core Optimum residential mortgages portfolio through the issuance of notes and residential certificates byWarwick Finance Residential Mortgages Number One plc (Warwick Finance One), followed by the securitisation of Warwick Finance Residential MortgagesNumber Two plc (Warwick Finance Two) later in the period (collectively called Warwick Finance One & Two).
• Fully loaded Common Equity Tier 1 ratio has increased to 15.5% as at 31 December 2015 (2014: 13.0%). Further details can be found in the sub-section 3.4Capital ratios.
8 The Co-operative Bank plc Pillar 3 Disclosures for the year ended 31 December 2015
3. Capital adequacy continued
The Co-operative Bank plc Pillar 3 Disclosures for the year ended 31 December 2015 9
3. Capital adequacy continued
3.3 Capital adequacy (continued)• Fully loaded leverage ratio has decreased to 3.8% as at 31 December 2015 (2014: 4.2%). Further details can be found in the sub-section 3.8 Leverage ratio.
• the PRA issued PS27/15 in December 2015 to implement a UK leverage ratio framework. The framework as currently stands only applies to firms withgreater than £50bn retail deposits. The UK framework will be reviewed by the Financial Policy Committee in 2017, and as part of this review, the PRA mayextend the requirement to other firms including the Bank. Therefore at present, the Bank does not have a minimum leverage ratio requirement, however itcontinues to monitor framework developments and the leverage ratio is included within the Bank's Updated Plan and Risk Appetite as a key metric. TheBank’s leverage ratio will be sustainably above 3.0% by the end of the planning period.
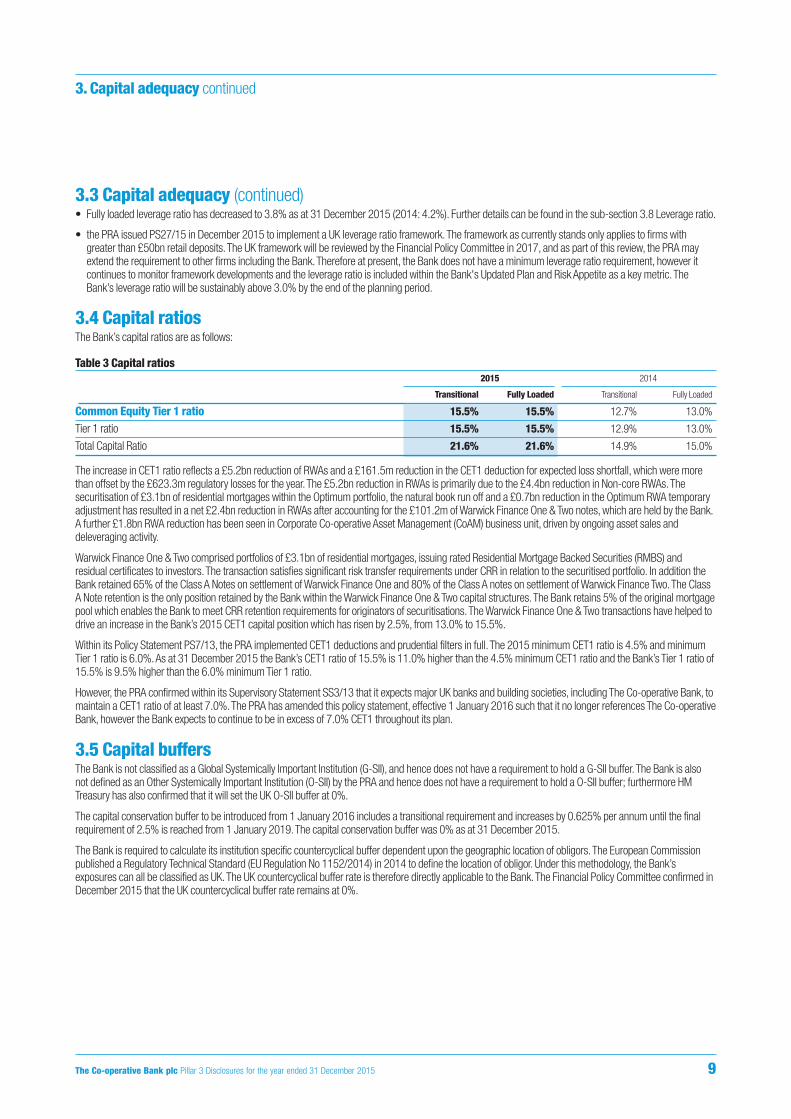
3.4 Capital ratiosThe Bank’s capital ratios are as follows:
Table 3 Capital ratios2015 2014
Transitional Fully Loaded Transitional Fully Loaded
Common Equity Tier 1 ratio 15.5% 15.5% 12.7% 13.0%
Tier 1 ratio 15.5% 15.5% 12.9% 13.0%
Total Capital Ratio 21.6% 21.6% 14.9% 15.0%
The increase in CET1 ratio reflects a £5.2bn reduction of RWAs and a £161.5m reduction in the CET1 deduction for expected loss shortfall, which were morethan offset by the £623.3m regulatory losses for the year. The £5.2bn reduction in RWAs is primarily due to the £4.4bn reduction in Non-core RWAs. Thesecuritisation of £3.1bn of residential mortgages within the Optimum portfolio, the natural book run off and a £0.7bn reduction in the Optimum RWA temporaryadjustment has resulted in a net £2.4bn reduction in RWAs after accounting for the £101.2m of Warwick Finance One & Two notes, which are held by the Bank.A further £1.8bn RWA reduction has been seen in Corporate Co-operative Asset Management (CoAM) business unit, driven by ongoing asset sales anddeleveraging activity.
Warwick Finance One & Two comprised portfolios of £3.1bn of residential mortgages, issuing rated Residential Mortgage Backed Securities (RMBS) andresidual certificates to investors. The transaction satisfies significant risk transfer requirements under CRR in relation to the securitised portfolio. In addition theBank retained 65% of the Class A Notes on settlement of Warwick Finance One and 80% of the Class A notes on settlement of Warwick Finance Two. The ClassA Note retention is the only position retained by the Bank within the Warwick Finance One & Two capital structures. The Bank retains 5% of the original mortgagepool which enables the Bank to meet CRR retention requirements for originators of securitisations. The Warwick Finance One & Two transactions have helped todrive an increase in the Bank’s 2015 CET1 capital position which has risen by 2.5%, from 13.0% to 15.5%.
Within its Policy Statement PS7/13, the PRA implemented CET1 deductions and prudential filters in full. The 2015 minimum CET1 ratio is 4.5% and minimumTier 1 ratio is 6.0%. As at 31 December 2015 the Bank’s CET1 ratio of 15.5% is 11.0% higher than the 4.5% minimum CET1 ratio and the Bank’s Tier 1 ratio of15.5% is 9.5% higher than the 6.0% minimum Tier 1 ratio.
However, the PRA confirmed within its Supervisory Statement SS3/13 that it expects major UK banks and building societies, including The Co-operative Bank, tomaintain a CET1 ratio of at least 7.0%. The PRA has amended this policy statement, effective 1 January 2016 such that it no longer references The Co-operativeBank, however the Bank expects to continue to be in excess of 7.0% CET1 throughout its plan.
3.5 Capital buffersThe Bank is not classified as a Global Systemically Important Institution (G-SII), and hence does not have a requirement to hold a G-SII buffer. The Bank is alsonot defined as an Other Systemically Important Institution (O-SII) by the PRA and hence does not have a requirement to hold a O-SII buffer; furthermore HMTreasury has also confirmed that it will set the UK O-SII buffer at 0%.
The capital conservation buffer to be introduced from 1 January 2016 includes a transitional requirement and increases by 0.625% per annum until the finalrequirement of 2.5% is reached from 1 January 2019. The capital conservation buffer was 0% as at 31 December 2015.
The Bank is required to calculate its institution specific countercyclical buffer dependent upon the geographic location of obligors. The European Commissionpublished a Regulatory Technical Standard (EU Regulation No 1152/2014) in 2014 to define the location of obligor. Under this methodology, the Bank’sexposures can all be classified as UK. The UK countercyclical buffer rate is therefore directly applicable to the Bank. The Financial Policy Committee confirmed inDecember 2015 that the UK countercyclical buffer rate remains at 0%.
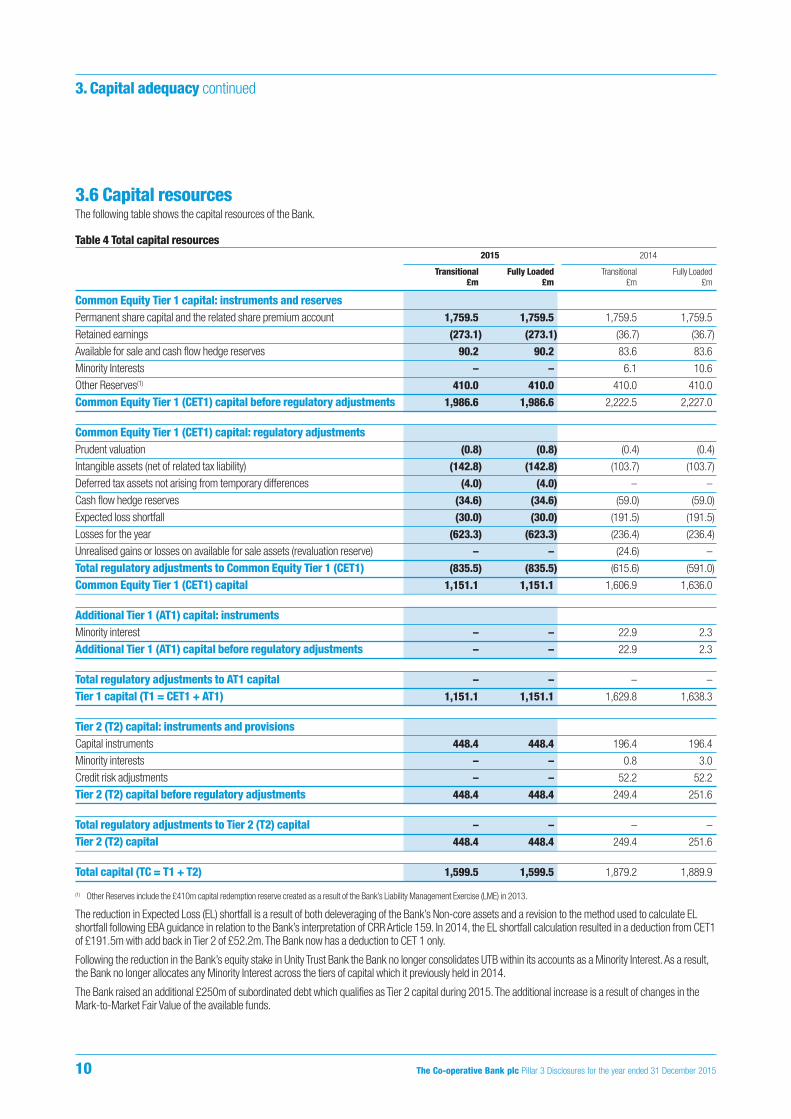
3.6 Capital resourcesThe following table shows the capital resources of the Bank.
Table 4 Total capital resources2015 2014
Transitional Fully Loaded Transitional Fully Loaded£m £m £m £m
Common Equity Tier 1 capital: instruments and reservesPermanent share capital and the related share premium account 1,759.5 1,759.5 1,759.5 1,759.5
Retained earnings (273.1) (273.1) (36.7) (36.7)
Available for sale and cash flow hedge reserves 90.2 90.2 83.6 83.6
Minority Interests – – 6.1 10.6
Other Reserves(1) 410.0 410.0 410.0 410.0
Common Equity Tier 1 (CET1) capital before regulatory adjustments 1,986.6 1,986.6 2,222.5 2,227.0
Common Equity Tier 1 (CET1) capital: regulatory adjustments Prudent valuation (0.8) (0.8) (0.4) (0.4)
Intangible assets (net of related tax liability) (142.8) (142.8) (103.7) (103.7)
Deferred tax assets not arising from temporary differences (4.0) (4.0) – –
Cash flow hedge reserves (34.6) (34.6) (59.0) (59.0)
Expected loss shortfall (30.0) (30.0) (191.5) (191.5)
Losses for the year (623.3) (623.3) (236.4) (236.4)
Unrealised gains or losses on available for sale assets (revaluation reserve) – – (24.6) –
Total regulatory adjustments to Common Equity Tier 1 (CET1) (835.5) (835.5) (615.6) (591.0)
Common Equity Tier 1 (CET1) capital 1,151.1 1,151.1 1,606.9 1,636.0
Additional Tier 1 (AT1) capital: instruments Minority interest – – 22.9 2.3
Additional Tier 1 (AT1) capital before regulatory adjustments – – 22.9 2.3
Total regulatory adjustments to AT1 capital – – – –
Tier 1 capital (T1 = CET1 + AT1) 1,151.1 1,151.1 1,629.8 1,638.3
Tier 2 (T2) capital: instruments and provisionsCapital instruments 448.4 448.4 196.4 196.4
Minority interests – – 0.8 3.0
Credit risk adjustments – – 52.2 52.2
Tier 2 (T2) capital before regulatory adjustments 448.4 448.4 249.4 251.6
Total regulatory adjustments to Tier 2 (T2) capital – – – –
Tier 2 (T2) capital 448.4 448.4 249.4 251.6
Total capital (TC = T1 + T2) 1,599.5 1,599.5 1,879.2 1,889.9
(1) Other Reserves include the £410m capital redemption reserve created as a result of the Bank’s Liability Management Exercise (LME) in 2013.
The reduction in Expected Loss (EL) shortfall is a result of both deleveraging of the Bank’s Non-core assets and a revision to the method used to calculate ELshortfall following EBA guidance in relation to the Bank’s interpretation of CRR Article 159. In 2014, the EL shortfall calculation resulted in a deduction from CET1of £191.5m with add back in Tier 2 of £52.2m. The Bank now has a deduction to CET 1 only.
Following the reduction in the Bank’s equity stake in Unity Trust Bank the Bank no longer consolidates UTB within its accounts as a Minority Interest. As a result,the Bank no longer allocates any Minority Interest across the tiers of capital which it previously held in 2014.
The Bank raised an additional £250m of subordinated debt which qualifies as Tier 2 capital during 2015. The additional increase is a result of changes in theMark-to-Market Fair Value of the available funds.
10 The Co-operative Bank plc Pillar 3 Disclosures for the year ended 31 December 2015
3. Capital adequacy continued

3.6 Capital resources continuedTable 5 Movement in transitional capital resources during the year The following table is a flow statement of movements in the Bank’s available capital resources detailing the change between opening and closing position for theperiod.
2015 2014£m £m
CET1 capital after regulatory adjustments at the beginning of the year 1,606.9 1,074.3
Permanent share capital – 12.8
Retained earnings – –
Minority Interests (6.1) (0.8)
Losses for the period (623.3) (236.4)
Share premium account – 687.4
Intangible assets (39.1) 7.0
Available for Sale reserve 55.6 14.1
Capital Redemption Reserve – –
Expected loss shortfall 161.5 46.8
Prudent valuation (0.4) 1.7
Unrealised gains or losses on available for sale assets (revaluation reserve) (4.0) –
CET1 capital after regulatory adjustments at the end of year 1,151.1 1,606.9
AT1 capital after regulatory adjustments at the beginning of the year 22.9 21.7
Minority Interest (22.9) 1.2
AT1 capital after regulatory adjustments at the end of year – 22.9
Total Tier 1 after regulatory adjustments at the end of year 1,151.1 1,629.8
T2 capital after regulatory adjustments at the beginning of the year 249.4 261.1
Paid up capital instruments and subordinated loans 252.0 0.1
Minority Interest (0.8) (0.1)
IRB Excess of provisions over expected losses eligible (52.2) (11.7)
T2 capital after regulatory adjustments at the end of year 448.4 249.4
Total capital resources at the end of year 1,599.5 1,879.2
An explanation of the key movements in capital during the course of the year have been noted below Table 4.
The Co-operative Bank plc Pillar 3 Disclosures for the year ended 31 December 2015 11
3. Capital adequacy continued
12 The Co-operative Bank plc Pillar 3 Disclosures for the year ended 31 December 2015
3. Capital adequacy continued
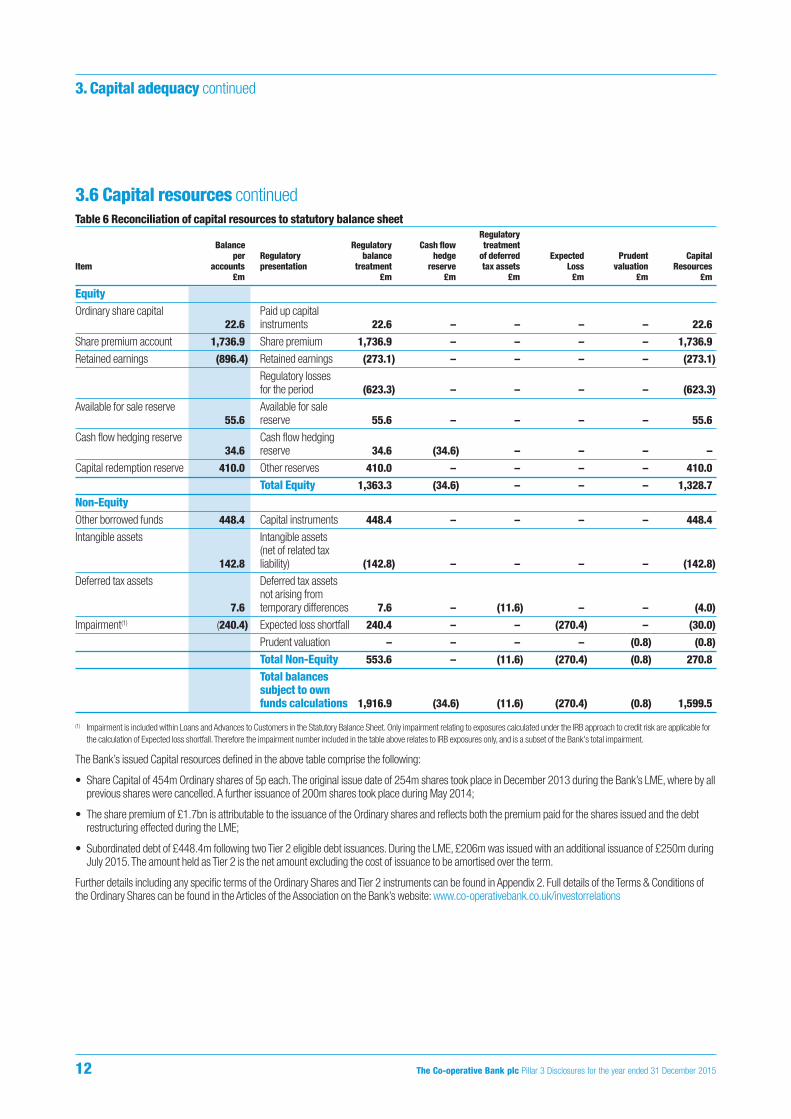
3.6 Capital resources continuedTable 6 Reconciliation of capital resources to statutory balance sheet
RegulatoryBalance Regulatory Cash flow treatment
per Regulatory balance hedge of deferred Expected Prudent CapitalItem accounts presentation treatment reserve tax assets Loss valuation Resources
£m £m £m £m £m £m £m
EquityOrdinary share capital Paid up capital
22.6 instruments 22.6 – – – – 22.6
Share premium account 1,736.9 Share premium 1,736.9 – – – – 1,736.9
Retained earnings (896.4) Retained earnings (273.1) – – – – (273.1)
Regulatory losses for the period (623.3) – – – – (623.3)
Available for sale reserve Available for sale 55.6 reserve 55.6 – – – – 55.6
Cash flow hedging reserve Cash flow hedging 34.6 reserve 34.6 (34.6) – – – –
Capital redemption reserve 410.0 Other reserves 410.0 – – – – 410.0
Total Equity 1,363.3 (34.6) – – – 1,328.7
Non-EquityOther borrowed funds 448.4 Capital instruments 448.4 – – – – 448.4
Intangible assets Intangible assets (net of related tax
142.8 liability) (142.8) – – – – (142.8)
Deferred tax assets Deferred tax assets not arising from
7.6 temporary differences 7.6 – (11.6) – – (4.0)
Impairment(1) (240.4) Expected loss shortfall 240.4 – – (270.4) – (30.0)
Prudent valuation – – – – (0.8) (0.8)
Total Non-Equity 553.6 – (11.6) (270.4) (0.8) 270.8
Total balancessubject to ownfunds calculations 1,916.9 (34.6) (11.6) (270.4) (0.8) 1,599.5
(1) Impairment is included within Loans and Advances to Customers in the Statutory Balance Sheet. Only impairment relating to exposures calculated under the IRB approach to credit risk are applicable forthe calculation of Expected loss shortfall. Therefore the impairment number included in the table above relates to IRB exposures only, and is a subset of the Bank's total impairment.
The Bank’s issued Capital resources defined in the above table comprise the following:
• Share Capital of 454m Ordinary shares of 5p each. The original issue date of 254m shares took place in December 2013 during the Bank’s LME, where by allprevious shares were cancelled. A further issuance of 200m shares took place during May 2014;
• The share premium of £1.7bn is attributable to the issuance of the Ordinary shares and reflects both the premium paid for the shares issued and the debtrestructuring effected during the LME;
• Subordinated debt of £448.4m following two Tier 2 eligible debt issuances. During the LME, £206m was issued with an additional issuance of £250m duringJuly 2015. The amount held as Tier 2 is the net amount excluding the cost of issuance to be amortised over the term.
Further details including any specific terms of the Ordinary Shares and Tier 2 instruments can be found in Appendix 2. Full details of the Terms & Conditions ofthe Ordinary Shares can be found in the Articles of the Association on the Bank’s website: www.co-operativebank.co.uk/investorrelations

The Co-operative Bank plc Pillar 3 Disclosures for the year ended 31 December 2015 13
3. Capital adequacy continued
3.7 Pillar 1 capital requirements and Risk Weighted AssetsThe following table analyses the Pillar 1 capital requirement by approach and exposure class. In the table below and throughout the document, unless otherwisestated, the documented exposures are reported as EAD (see Table 10). For IRB exposures EAD is defined as the amount estimated to be outstanding at the timeof default, including the estimation of credit conversion factors to undrawn commitments. For standardised exposures EAD includes undrawn commitments postcredit conversion factors defined in CRR Article 111 and is net of eligible provision.In accordance with CRR Article 150 (Conditions for permanent partial use) the Bank has received permission from the regulator to exempt its exposures tocertain counterparty classes, namely Central governments and central banks and Multilateral development banks from the IRB Approach for the purposes of thecalculation of both risk-weighted exposure and expected loss amounts, instead applying the Standardised Approach for these exposures. The revised approachwas implemented for the purposes of the Bank's regulatory reporting submissions as at 1 January 2014.The exposure classes not applicable to the Bank and which haven’t been presented in the tables disclosing exposures classes throughout this document, are asfollows:• IRB approach: Central government and central bank, Retail SME, Equity exposures and Other non-credit obligation assets; and• Standardised approach: International organisations, Securitisation positions, Exposures associated with particularly high risks, Short term claims on
institutions and corporates and Collective investment undertakings.The following table analyses the capital requirements by approach and exposure class:
Table 7 Pillar 1 capital requirements 2015
Risk AverageCapital weighted Exposure Average exposure at
requirement asset at default risk weight defaultIRB exposure class £m £m £m % £m
Institutions 17.6 220.5 836.0 26% 945.8
Corporates 48.6 606.9 1,152.2 53% 1,220.5
Retail secured by immovable property 159.0 1,987.5 15,563.6 13% 16,764.9
Qualifying revolving retail exposures 35.6 444.9 2,031.9 22% 2,075.8
Retail other non-SME 23.6 294.4 288.7 102% 350.9
Securitisation positions 52.7 658.2 3,038.0 22% 2,501.1
Total IRB 337.1 4,212.4 22,910.4 18% 23,859.0
Specialised lending 104.0 1,299.4 1,496.2 87% 2,085.7
Standardised exposure classCentral government or central banks – – 5,465.4 0% 7,092.9
Regional governments or local authorities 0.1 1.0 5.0 20% 11.3
Public sector entities 0.3 4.0 20.0 20% 27.9
Multilateral development banks – – 500.9 0% 557.2
Institutions 8.6 107.7 72.8 148% 185.8
Corporates 25.6 320.1 320.1 100% 648.1
Retail exposures 4.6 58.1 77.4 75% 113.0
Secured by mortgages on immoveable property(1) – 0.1 0.2 75% 28.4
Exposures in default 4.8 60.4 41.0 147% 50.2
Covered bonds – – – – 70.8
Equity exposures 5.4 67.8 60.5 112% 21.1
Other items(2) 30.9 386.6 461.8 84% 609.6
Total standardised 80.3 1,005.8 7,025.1 14% 9,416.3
Total credit risk 521.4 6,517.6 31,431.7 21% 35,361.0
Total market risk – – N/A N/A N/A
Operational risk 72.4 905.3 N/A N/A N/A
Total Pillar 1 593.8 7,422.9 N/A N/A N/A
(1) The Standardised Secured by mortgages on immovable property class contains a small number of legacy mortgages not included within the IRB portfolio. The 75% RW% is accurate however due to thesmall level of exposure rounded values do not allow the arithmetic calculation in the table.
(2) Other items relate to accounting adjustment applied to customer balances and investments, and non-customer related assets on the balance sheet (e.g. Cash, Property Plant & Equipment, Tax). Thevarying Risk weights applied to these assets under CRR have resulted in a reduction in overall RWAs, in part related to the reduction in exposure amounts.
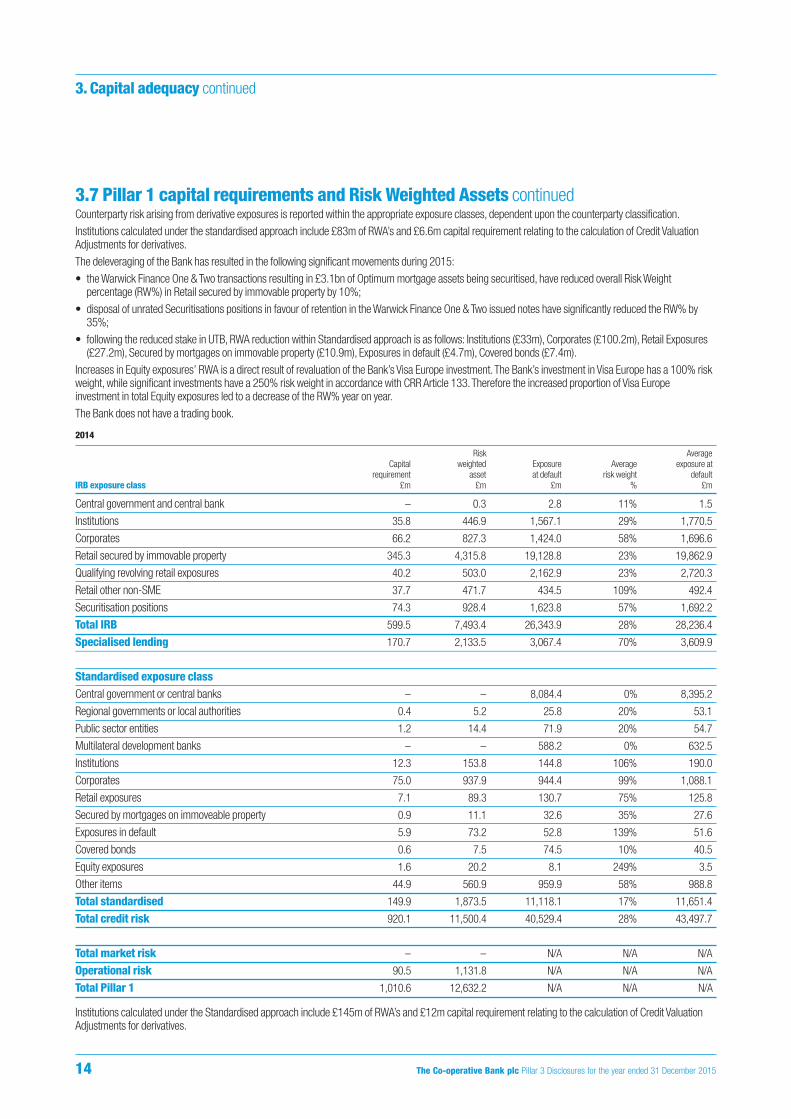
3.7 Pillar 1 capital requirements and Risk Weighted Assets continuedCounterparty risk arising from derivative exposures is reported within the appropriate exposure classes, dependent upon the counterparty classification.Institutions calculated under the standardised approach include £83m of RWA’s and £6.6m capital requirement relating to the calculation of Credit ValuationAdjustments for derivatives.The deleveraging of the Bank has resulted in the following significant movements during 2015:• the Warwick Finance One & Two transactions resulting in £3.1bn of Optimum mortgage assets being securitised, have reduced overall Risk Weight
percentage (RW%) in Retail secured by immovable property by 10%;• disposal of unrated Securitisations positions in favour of retention in the Warwick Finance One & Two issued notes have significantly reduced the RW% by
35%;• following the reduced stake in UTB, RWA reduction within Standardised approach is as follows: Institutions (£33m), Corporates (£100.2m), Retail Exposures
(£27.2m), Secured by mortgages on immovable property (£10.9m), Exposures in default (£4.7m), Covered bonds (£7.4m).Increases in Equity exposures’ RWA is a direct result of revaluation of the Bank’s Visa Europe investment. The Bank’s investment in Visa Europe has a 100% riskweight, while significant investments have a 250% risk weight in accordance with CRR Article 133. Therefore the increased proportion of Visa Europeinvestment in total Equity exposures led to a decrease of the RW% year on year.The Bank does not have a trading book.
2014
Risk AverageCapital weighted Exposure Average exposure at
requirement asset at default risk weight defaultIRB exposure class £m £m £m % £m
Central government and central bank – 0.3 2.8 11% 1.5
Institutions 35.8 446.9 1,567.1 29% 1,770.5
Corporates 66.2 827.3 1,424.0 58% 1,696.6
Retail secured by immovable property 345.3 4,315.8 19,128.8 23% 19,862.9
Qualifying revolving retail exposures 40.2 503.0 2,162.9 23% 2,720.3
Retail other non-SME 37.7 471.7 434.5 109% 492.4
Securitisation positions 74.3 928.4 1,623.8 57% 1,692.2
Total IRB 599.5 7,493.4 26,343.9 28% 28,236.4
Specialised lending 170.7 2,133.5 3,067.4 70% 3,609.9
Standardised exposure classCentral government or central banks – – 8,084.4 0% 8,395.2
Regional governments or local authorities 0.4 5.2 25.8 20% 53.1
Public sector entities 1.2 14.4 71.9 20% 54.7
Multilateral development banks – – 588.2 0% 632.5
Institutions 12.3 153.8 144.8 106% 190.0
Corporates 75.0 937.9 944.4 99% 1,088.1
Retail exposures 7.1 89.3 130.7 75% 125.8
Secured by mortgages on immoveable property 0.9 11.1 32.6 35% 27.6
Exposures in default 5.9 73.2 52.8 139% 51.6
Covered bonds 0.6 7.5 74.5 10% 40.5
Equity exposures 1.6 20.2 8.1 249% 3.5
Other items 44.9 560.9 959.9 58% 988.8
Total standardised 149.9 1,873.5 11,118.1 17% 11,651.4
Total credit risk 920.1 11,500.4 40,529.4 28% 43,497.7
Total market risk – – N/A N/A N/A
Operational risk 90.5 1,131.8 N/A N/A N/A
Total Pillar 1 1,010.6 12,632.2 N/A N/A N/A
Institutions calculated under the Standardised approach include £145m of RWA’s and £12m capital requirement relating to the calculation of Credit ValuationAdjustments for derivatives.
14 The Co-operative Bank plc Pillar 3 Disclosures for the year ended 31 December 2015
3. Capital adequacy continued

3.7 Pillar 1 capital requirements and Risk Weighted Assets continuedTable 8 Flow statement of Risk Weighted Assets A flow statement for the movement in Credit risk RWAs during the year is set out in the table below:
Retail RetailCorporate Unsecured Secured Treasury Total
£m £m £m £m £m
Credit Risk RWAs as at 31 December 2014 4,384.0 1,076.7 4,315.9 1,723.8 11,500.4
Book size(1) (1,467.1) (233.8) 56.5 (172.2) (1,816.6)
Book quality(2) (165.4) (5.5) 46.6 – (124.3)
Model updates(3) – – – – –
Methodology and policy(4) – – – (121.1) (121.1)
Acquisitions and Disposals(5) (461.6) (38.0) (2,462.6) 41.4 (2,920.8)
Credit Risk RWAs as at 31 December 2015 2,289.9 799.4 1,956.4 1,471.9 6,517.6
(1) Book size – organic changes in book size and composition (including new business, maturing loans and individual customer deleverage).(2) Book quality – quality of book changes caused by experience such as underlying customer behaviour or demographics, including changes through model calibrations/realignments.(3) Model updates – Model implementation, change in model scope or any change to address model malfunctions.(4) Methodology and policy – methodology changes to the calculations including those driven by regulatory policy change, such as new regulation (e.g. CRD IV).(5) Acquisitions and Disposals – significant acquisition or disposal of distinct portfolios.
Corporate RWAs have reduced by 48% during 2015, predominantly as a result of the decrease in book size (55% reduction in Standardised, 35% in SpecialisedLending and 21% in other Foundation IRB portfolios), driven by the deleveraging activity within the Non-core portfolio. The key reductions in RWAs have beenobserved in Project Finance Initiatives (PFI) (£402m), Energy (£390m) and Commercial Real Estate (£318m) sectors.
The reduction in Retail Unsecured RWAs has largely been driven by a decrease in book size, with Loan exposure reducing by £150m in the period, resulting in£180m reduction in RWA. A reduction in Credit Card and Overdraft exposure also reduces RWA by £51m and £3m respectively.
Retail Secured RWAs reduced due to securitisation of Warwick Finance One & Two. An increase in RWA is observed in the remaining secured portfolios, drivenby Platform new business (Net EAD increase of £1.8bn resulting in £309m increase in RWA), offset largely by amortisation/maturity of other portfolios (Net EADdecrease of £2.2bn resulting in £206m reduction in RWA).
The reduction in Treasury RWA's is primarily due to a decrease in exposures as the size of the Treasury book has reduced throughout the year. The acquisitionsrelate to the Warwick Finance One & Two securitisations, with the Bank retaining 65% and 80% of Class A notes respectively in each transaction.
Table 9 Reconciliation of statutory balance sheet to gross drawn credit risk exposure The table below reconciles the statutory balance sheet included within the Annual Report and Accounts to gross drawn credit risk exposure.
Balance Sheet ItemsAssets under the Deducted Gross Drawn
Regulatory Scope of from Own Securitisations Other Credit RiskConsolidation Funds Provisions Adjustment Adjustments Exposure
£m £m £m £m £m £m
Cash and balances with central banks 2,678.5 – – – (81.0) 2,597.5
Loans and advances to banks 871.0 – – – (19.2) 851.8
Loans and advances to customers 19,784.4 – 245.2 (107.2) (127.2) 19,795.2
AFS financial assets 4,296.8 – – – – 4,296.8
Treasury bills/other eligible bills 597.4 – – – – 597.4
Derivatives and SFTs (e.g. reverse repos) 370.1 – – – – 370.1
Equity shares 55.6 – – – – 55.6
Investments in group undertakings (e.g. insurance subs) 4.9 – – – – 4.9
Intangible assets 142.8 (142.8) – – – –
Deferred tax assets 7.6 – – – (1.9) 5.7
Other assets 219.2 – – – 236.9 456.1
Total balance sheet 29,028.3 (142.8) 245.2 (107.2) 7.6 29,031.1
Securitisations Adjustment represents the difference in regulatory treatment allowable under CRR rules on the Calico securitisation as a result of the SignificantRisk Transfer (SRT) that has been established on the related mortgages.
The Co-operative Bank plc Pillar 3 Disclosures for the year ended 31 December 2015 15
3. Capital adequacy continued

3.7 Pillar 1 capital requirements and Risk Weighted Assets continuedTable 10 Reconciliation of gross drawn credit risk exposure to Exposures at Default
Off-balance sheet Gross Credit Net OtherGross drawn items under exposure conversion Credit risk exposure regulatory Exposure at
exposure regulatory scope pre-CRM factor mitigation post-CRM adjustments default£m £m £m £m £m £m £m £m
IRB approachCentral government and central bank – – – – – – – –
Institutions 1,047.5 220.5 1,268.0 0% (432.0) 836.0 – 836.0
Corporates 2,538.5 195.5 2,734.0 75% (28.1) 2,656.7 (8.3) 2,648.4
Retail secured by immovable property 14,727.3 514.1 15,241.4 91% – 15,192.9 370.7 15,563.6
Qualifying revolving retail exposures 464.6 1,814.4 2,279.0 85% – 2,010.3 21.6 2,031.9
Retail other non-SME 288.7 – 288.7 – – 288.7 – 288.7
Securitisation positions 3,038.0 – 3,038.0 – – 3,038.0 – 3,038.0
Total 22,104.6 2,744.5 24,849.1 – (460.1) 24,022.6 384.0 24,406.6
Standardised approachCentral government or central banks 5,393.9 – 5,393.9 – 71.5 5,465.4 – 5,465.4
Regional governments or local authorities 2.9 11.3 14.2 19% – 5.0 – 5.0
Public sector entities 19.2 3.3 22.5 23% – 20.0 – 20.0
Multilateral development banks 500.9 – 500.9 – – 500.9 – 500.9
Institutions 53.6 537.0 590.6 0% (517.8) 72.8 – 72.8
Corporates 308.5 44.8 353.3 30% (2.5) 320.1 – 320.1
Retail exposures 77.4 – 77.4 – – 77.4 – 77.4
Secured by mortgages on immoveable property 0.2 – 0.2 – – 0.2 – 0.2
Exposures in default 47.6 9.2 56.8 49% – 52.1 (11.1) 41.0
Equity exposures 60.5 – 60.5 – – 60.5 – 60.5
Other items 461.8 – 461.8 – – 461.8 – 461.8
Total 6,926.5 605.6 7,532.1 – (448.8) 7,036.2 (11.1) 7,025.1
Overall total 29,031.1 3,350.1 32,381.2 – (908.9) 31,058.8 372.9 31,431.7
The Off-balance sheet items include future commitments to lend subject to conversion factors and Repurchase Agreements (Repos) that are required underregulatory scope. Credit Conversion Factors (CCF) applicable under the Standardised approach per CRR Article 111 are 0%, 20%, 50% or 100% dependentupon the credit facility available. Where values differ in the table above this is a result of a mixed basis of credit facility within the given exposure class. CCF forIRB exposure classes relate specifically to Off-Balance sheet exposures calculated by the EAD model.
Credit Risk Mitigation (CRM) has been calculated in line with CRR regulation Part 3, Title II, Chapter 4. For IRB institutions, £153m of the CRM relates to pledgedcollateral against Repos, £75m relates to derivate collateral with the remaining £204m relating to drawn exposures. For Standardised Institutions the applicableCRM relates to pledged collateral against Repos.
Net exposure post-CRM is the sum of gross drawn exposures and Off-balance sheet items following the application of CCF and CRM. EAD is the final exposurevalue used in the calculation of capital following the application of Other regulatory adjustments.
Other regulatory adjustments in the IRB section relate specifically to the amount applied to drawn exposures calculated by the EAD model.
Other regulatory adjustments in the Standardised section relate specifically to the allocation of Provisions and relate to Corporate exposures within theExposures in default asset class.
Refer to Table 15 for explanations of EAD movement within the period.
16 The Co-operative Bank plc Pillar 3 Disclosures for the year ended 31 December 2015
3. Capital adequacy continued

3.8 Leverage ratioTable 11 Leverage ratio
Restated(1)
2015 2014£m £m
Derivative exposures 344.5 509.1
Securities financing transactions 86.1 190.5
Other assets 28,980.3 37,557.3
Off-balance sheet items 938.6 957.0
Regulatory deductions and other adjustments (212.2) (354.6)
Total fully loaded leverage exposure 30,137.3 38,859.3
Fully-loaded CRD IV Tier 1 capital 1,151.1 1,638.3
Fully loaded leverage ratio 3.8% 4.2%(1) The leverage ratio has been calculated using the exposure basis within the European Commission delegated act.
Note: The Bank received a waiver from the PRA in July 2014 to compute the leverage ratio on a point-in-time basis at the end of each quarter (i.e. 31 December2015) as opposed the arithmetic mean of the 3 months within each quarterly period.
The leverage ratio (calculated as Tier 1 capital divided by adjusted balance sheet exposures) has decreased by 0.4% to 3.8% as at 31 December 2015 (2014:4.2% restated). The result reflects a decrease in exposure of £8.7bn to £30.1bn impacted by the overall deleveraging strategy, partially offset by a £487.2mdecrease in the Bank’s Tier 1 position primarily as a result of the £623.3m regulatory losses for the year. The leverage ratio has been calculated in accordancewith the European Commission delegated act.
Along with the CET1 ratio the leverage ratio is expected to initially worsen during the plan period. It is expected to be sustainably above 3% towards the end ofthe plan period.
Table 12 On Balance sheet exposure reconciliationThe table shows the reconciliation of EAD in Table 10 to the leverage measure of exposure.
2015£m
Total EAD Per Table 10 31,431.7
Derivative exposures (344.5)
Securities financing transactions (86.1)
Off-balance sheet items EAD(1) (2,178.1)
IRB Provisions for On balance sheet items (188.9)
Derivative collateral 203.4
Intangibles 142.8
Total Leverage ‘Other Assets’ 28,980.3(1) Reflects Gross Off-balance sheet post application of CCF and CRM.
Table 13 Off-balance sheet exposure reconciliationThe table shows the reconciliation of Off-balance sheet exposures in Table 10 to the leverage measure of exposure.
Off-balance sheet items Undrawn
under commitmentsregulatory post leverage
scope CCF
Undrawn credit facilities unconditionally cancellable @10% 1,837.9 183.8
Medium/low risk trade related off-balance sheet items @20% – –
Medium risk trade related off-balance sheet items @50% – –
Other off-balance sheet items @100% 754.8 754.8
Securities financing transactions 731.4 N/A
Derivatives: Futures 26.0 N/A
Total Off-balance sheet items 3,350.1 938.6
The Co-operative Bank plc Pillar 3 Disclosures for the year ended 31 December 2015 17
3. Capital adequacy continued

18 The Co-operative Bank plc Pillar 3 Disclosures for the year ended 31 December 2015
4. Risk Management governance
4.1 Overview Responsibility for risk management resides at all levels of the Bank from the Board and the Executive Committee supported by senior management committeesthroughout the organisation to each business area subject to appropriate oversight.
The Enterprise Risk Oversight Committee (EROC) achieves some of its objectives through delegating responsibility to sub-committees, Model Risk, Conduct &Regulatory Risk, Operational Risk and Credit Risk Oversight Committees. The sub-committees will approve, discuss or note papers and escalate to the EROCwhere relevant or where required by governance. EROC will escalate where appropriate to the Board via the Risk Committee.
4.2 Risk governance structureThe diagram below illustrates the Bank’s Risk Management Committee structure as at the end of 2015. The Bank continues to review and refine this structure.
The Co-operative Bank plc Board
Remuneration Committee
Audit Committee
Risk Committee
Nomination Committee
Value & Ethics Committee
CEO
Transformation Committee
(TC)
Executive People
Committee (EPC)
ExecutiveCommittee
(ExCo)
Asset & Liability
Committee (ALCO)
Enterprise Risk Oversight
Committee (EROC)
TechnologySteering
Committee
Investment Planning
Committee (IPC)
Project Oversight Committee
(POC)
Strategic Transactions Committee
(STC)
Credit Risk Oversight
Committee (CROC)
Model Risk
Oversight Committee
(MROC)
Operational Risk
Oversight Committee
(OROC)
Conduct & Regulatory
Risk Oversight Committee (CRROC)
Boar
dC
omm
ittee
Exec
utiv
e C
omm
ittee
Exec
utiv
e Su
b C
omm
ittee
eettim
clpknaBevitarepo-oCehT
draoBc
m
moC
draoB
eettimmoCnoitarenumeR
C
tiduAeettimmoC eettimmoC
ksiR
eettimmoCnoitanimoN
eettimmoCcs ihtE&eulaV
eetti
mmo
CbuS
evitucexE
)CPI(eettimmoC
gninnalPtnemtsevnI
)CO(PeettimmoCthgisrevO
tcejoPr
)CT(SeettimmoCsnoitcasnarT
cigetartS
CORC(timmoCisrevORtiderC
)CeettthgksiR
)CORM(eettimmoCthgisrevO
ksiRledoM
)CORO(eettimmoCthgisrevO
ksiRlanoitarepO
C(oC
O
eRoC
)CORRCeettimmothgisrev
ksiRyrryotaluge& tcudno

The Co-operative Bank plc Pillar 3 Disclosures for the year ended 31 December 2015 19
4. Risk Management governance continued
4.3 Board and sub-committeesThe Bank’s risk governance structure provides risk evaluation and management whilst ensuring the Bank manages the regulatory environment as efficiently aspossible. The risk focus of these Committees is described below:
The Initial Public Offering (IPO) Committee is a special purpose Committee not considered part of the overall governance structure described above.
Committee Risk focus
The Board The Board has collective responsibility for the long term success of the Bank. Its role is to provide leadership of the Bank within aframework of prudent and effective controls which enable risk to be assessed and managed. It sets the Bank’s values andstandards and ensures that its obligations to its shareholders, customers and other stakeholders are understood and met.The Board sets the Bank’s strategy and approves plans presented by management for the achievement of the strategicobjectives it has set. It determines the nature and extent of the significant risks it is willing to take in achieving its strategicobjectives and is responsible for ensuring maintenance of sound risk management and internal control systems.
RemunerationCommittee
The Remuneration Committee determines the remuneration for the Executive Directors and the Executive Committee of the Bankand it sets and recommends to the Board for approval, the overarching principles and parameters of the remuneration policyacross the Bank to ensure an overall coherent approach to remuneration for all employees.
Audit Committee (AC) The Audit Committee monitors, reviews and reports to the Board on the formal arrangements established by the Board in respectof the financial and narrative reporting of the Bank, the internal controls and the Risk Management Framework, and theinternal/external audit process.
Risk Committee (RC) The Risk Committee is responsible for the review and report of its conclusions to the Board in respect of the Bank’s risk appetiteand Risk Management Framework, taking a forward looking perspective and anticipating changes in business conditions.
NominationCommittee (NC)
The Nomination Committee reviews and makes recommendations on Board composition, succession planning for ExecutiveDirectors, Non-Executive Directors and certain Senior Executives, identifying and nominating candidates for Board vacancies andevaluation of candidates for the Board.
Values and EthicsCommittee (V&E)
The Values and Ethics Committee recommends to the Board for its approval and adoption of the Co-operative Values and EthicalPolicies of the Bank and to advise the Board of the Bank’s conformity with such values and ethics in its operations and activities.

20 The Co-operative Bank plc Pillar 3 Disclosures for the year ended 31 December 2015
4. Risk Management governance continued
4.4 Executive and management committeesThe Board has established Board Committees and senior management committees as well as appropriate forums to oversee the RMF, including identifying thekey risks facing the Bank and assessing the effectiveness of planned management actions.
Committee Risk focus
Executive Committee(ExCo)
The Executive Committee manages the business in line with the risk appetite statement, and in doing so ensures theimplementation of the risk strategy set by the Bank’s Board so as to deliver an effective risk management environment.
TransformationCommittee (TC)
The Transformation Committee is responsible for ensuring the successful implementation, prioritisation and funding of projectsacross the Bank in line with the Board’s strategic plan. As such the committee assists the Chief Administrative Officer inprioritising projects within available resources and agreed investment budgets, overseeing the Bank’s transformation programmefunding position, policies, processes and standards to effectively manage the Bank’s transformation programme risk profile.
Executive PeopleCommittee (EPC)
The Executive People Committee is responsible for the review of key people data within the Bank such as headcount, retention,overseeing the hiring of senior roles and all remuneration policies below the Executive level.
Asset and LiabilityCommittee (ALCO)
The Asset and Liability Committee is primarily responsible for overseeing the management of capital, market, liquidity andfunding risks. Its responsibilities include identifying, managing and controlling the Bank’s balance sheet risks in executing itschosen business strategy, ensuring that the capital and liquidity position of the Bank is managed in line with policy and thatadequate capital is maintained at all times, overseeing and monitoring relevant risk control frameworks and recommendingrelevant principal risk policies, detailed risk appetite limits for approval and approval of all product pricing proposals.
Enterprise RiskOversight Committee(EROC)
The Enterprise Risk Oversight Committee’s purpose is to provide a mechanism to ensure all the Bank’s risks are reviewed,challenged and approved in line with decisions made at EXCO (with escalation to the RC where required). EROC achieves some ofits objectives through delegating responsibility to sub-committees: Model risk, Conduct & Regulatory risk, Operational risk andCredit Risk Oversight Committees. The sub-committees will approve, discuss or note papers and escalate to the EROC whererelevant or where required by governance. EROC will escalate where appropriate to the Board via the Risk Committee.
Technology SteeringCommittee (TSC)
The Technology Steering Committee acts to support the Chief Information Officer in developing and executing the Bank’s ITstrategy. The TSC provides a forum for Executive input to strategic IT decisions, policy, planning and prioritisation, maintainingalignment between IT strategy and Business strategy. The TSC assesses potential risks and benefits from future technologychanges.
Investment PlanningCommittee (IPC)
The Investment Planning Committee is responsible for overseeing and challenging the execution of all significant investments,divestments and major capital expenditure proposals. As such it ensures that all investments are being made in accordance withthe Board’s strategic plan and that the investment portfolio remains balanced when considering investment demands againstavailable resources.
Project OversightCommittee (POC)
The Project Oversight Committee is responsible for overseeing and challenging the delivery of the Bank’s Change Portfolioensuring there is clarity of delivery outcomes, that benefits are delivered within agreed time, cost and quality thresholds, thatsponsors have the necessary executive support to deliver successfully and that key risks and issues threatening delivery arebeing effectively managed.
StrategicTransactionsCommittee (STC)
The Strategic Transactions Committee reviews, challenges and approves (where permitted within the authority delegated to it)strategic transactions designed to achieve a deleveraging of the balance sheet in line with the strategy outlined by the Board forNon-core assets held within the Corporate CoAM business.In making its decisions it ensures that sanctioned deals are approved in line with delegated financial authorities and riskassessments are carried out by the Chief Risk Officer (CRO) or other directors in the Risk division.
Credit Risk OversightCommittee (CROC)
The Credit Risk Oversight Committee’s purpose is to monitor significant credit risks and issues with the entire credit life cycle, thecontrols and management actions being taken to mitigate them and to hold to account the executives responsible for actions.This includes but not limited to proposing, monitoring and reviewing the credit risk appetite (current and emerging) of the Bankensuring that key risk exposures are managed within risk appetite and reported to EROC, that appropriate mitigating actions aretaken and that adherence to the RMF through a process of ongoing continuous improvement and review of the credit riskstrategy is achieved while making recommendations to EROC as appropriate.
Model Risk OversightCommittee (MROC)
The Model Risk Oversight Committee is a sub-committee of EROC and the core objective is to provide oversight and challengeincluding independent validation of model governance.
Operational RiskOversight Committee(OROC)
The Operational Risk Oversight Committee oversees the design and maintenance of the Bank’s Operational Risk Framework andthe risk control frameworks. In addition to this the OROC recommends to the Chief Executive Officer (CEO), CRO and the EROCrelevant underlying policies and detailed risk appetite limits for approval.
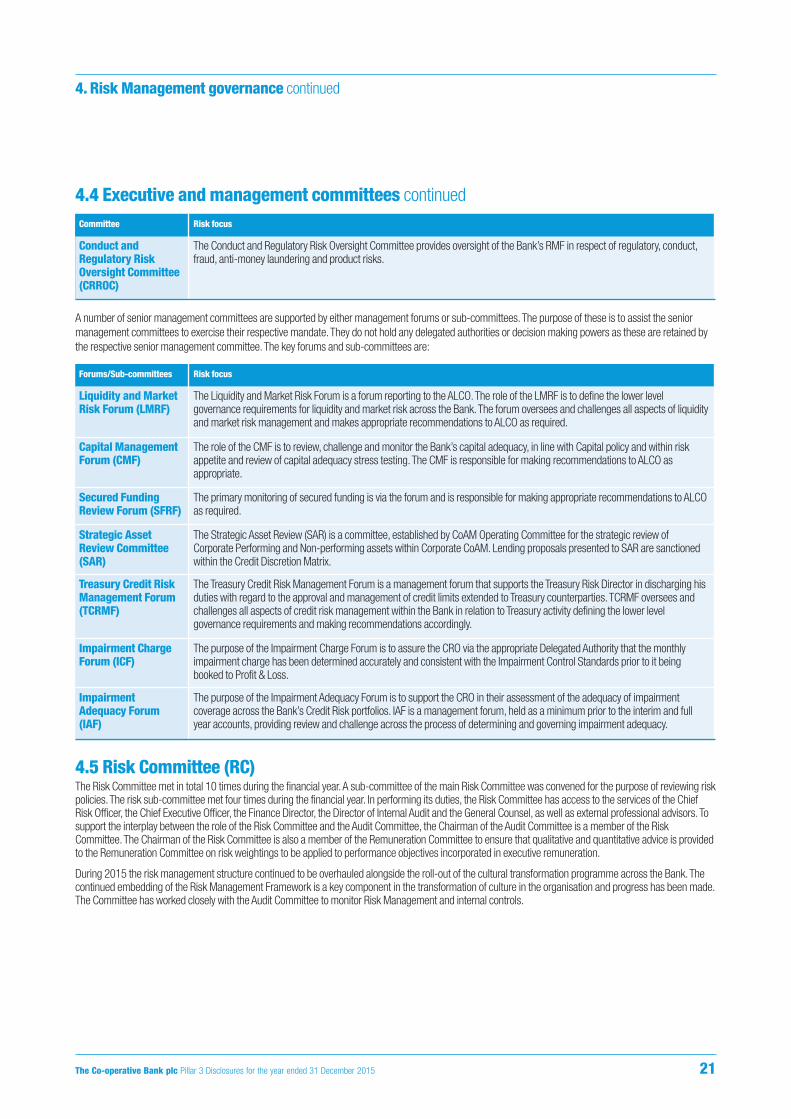
4.4 Executive and management committees continued
A number of senior management committees are supported by either management forums or sub-committees. The purpose of these is to assist the seniormanagement committees to exercise their respective mandate. They do not hold any delegated authorities or decision making powers as these are retained bythe respective senior management committee. The key forums and sub-committees are:
4.5 Risk Committee (RC)The Risk Committee met in total 10 times during the financial year. A sub-committee of the main Risk Committee was convened for the purpose of reviewing riskpolicies. The risk sub-committee met four times during the financial year. In performing its duties, the Risk Committee has access to the services of the ChiefRisk Officer, the Chief Executive Officer, the Finance Director, the Director of Internal Audit and the General Counsel, as well as external professional advisors. Tosupport the interplay between the role of the Risk Committee and the Audit Committee, the Chairman of the Audit Committee is a member of the RiskCommittee. The Chairman of the Risk Committee is also a member of the Remuneration Committee to ensure that qualitative and quantitative advice is providedto the Remuneration Committee on risk weightings to be applied to performance objectives incorporated in executive remuneration.
During 2015 the risk management structure continued to be overhauled alongside the roll-out of the cultural transformation programme across the Bank. Thecontinued embedding of the Risk Management Framework is a key component in the transformation of culture in the organisation and progress has been made.The Committee has worked closely with the Audit Committee to monitor Risk Management and internal controls.
Committee Risk focus
Conduct andRegulatory RiskOversight Committee(CRROC)
The Conduct and Regulatory Risk Oversight Committee provides oversight of the Bank’s RMF in respect of regulatory, conduct,fraud, anti-money laundering and product risks.
Forums/Sub-committees Risk focus
Liquidity and MarketRisk Forum (LMRF)
The Liquidity and Market Risk Forum is a forum reporting to the ALCO. The role of the LMRF is to define the lower levelgovernance requirements for liquidity and market risk across the Bank. The forum oversees and challenges all aspects of liquidityand market risk management and makes appropriate recommendations to ALCO as required.
Capital ManagementForum (CMF)
The role of the CMF is to review, challenge and monitor the Bank’s capital adequacy, in line with Capital policy and within riskappetite and review of capital adequacy stress testing. The CMF is responsible for making recommendations to ALCO asappropriate.
Secured FundingReview Forum (SFRF)
The primary monitoring of secured funding is via the forum and is responsible for making appropriate recommendations to ALCOas required.
Strategic AssetReview Committee(SAR)
The Strategic Asset Review (SAR) is a committee, established by CoAM Operating Committee for the strategic review ofCorporate Performing and Non-performing assets within Corporate CoAM. Lending proposals presented to SAR are sanctionedwithin the Credit Discretion Matrix.
Treasury Credit RiskManagement Forum(TCRMF)
The Treasury Credit Risk Management Forum is a management forum that supports the Treasury Risk Director in discharging hisduties with regard to the approval and management of credit limits extended to Treasury counterparties. TCRMF oversees andchallenges all aspects of credit risk management within the Bank in relation to Treasury activity defining the lower levelgovernance requirements and making recommendations accordingly.
Impairment ChargeForum (ICF)
The purpose of the Impairment Charge Forum is to assure the CRO via the appropriate Delegated Authority that the monthlyimpairment charge has been determined accurately and consistent with the Impairment Control Standards prior to it beingbooked to Profit & Loss.
ImpairmentAdequacy Forum(IAF)
The purpose of the Impairment Adequacy Forum is to support the CRO in their assessment of the adequacy of impairmentcoverage across the Bank’s Credit Risk portfolios. IAF is a management forum, held as a minimum prior to the interim and fullyear accounts, providing review and challenge across the process of determining and governing impairment adequacy.
The Co-operative Bank plc Pillar 3 Disclosures for the year ended 31 December 2015 21
4. Risk Management governance continued
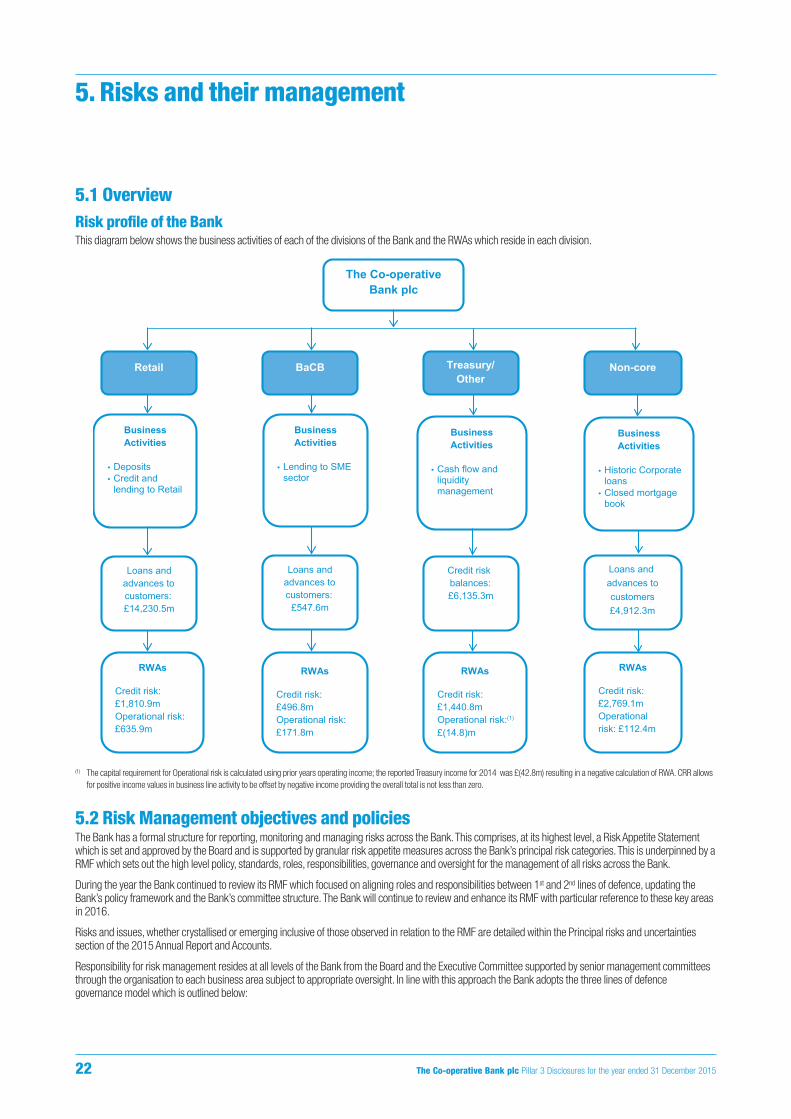
5.1 OverviewRisk profile of the BankThis diagram below shows the business activities of each of the divisions of the Bank and the RWAs which reside in each division.
(1) The capital requirement for Operational risk is calculated using prior years operating income; the reported Treasury income for 2014 was £(42.8m) resulting in a negative calculation of RWA. CRR allowsfor positive income values in business line activity to be offset by negative income providing the overall total is not less than zero.
5.2 Risk Management objectives and policiesThe Bank has a formal structure for reporting, monitoring and managing risks across the Bank. This comprises, at its highest level, a Risk Appetite Statementwhich is set and approved by the Board and is supported by granular risk appetite measures across the Bank’s principal risk categories. This is underpinned by aRMF which sets out the high level policy, standards, roles, responsibilities, governance and oversight for the management of all risks across the Bank.
During the year the Bank continued to review its RMF which focused on aligning roles and responsibilities between 1st and 2nd lines of defence, updating theBank’s policy framework and the Bank’s committee structure. The Bank will continue to review and enhance its RMF with particular reference to these key areasin 2016.
Risks and issues, whether crystallised or emerging inclusive of those observed in relation to the RMF are detailed within the Principal risks and uncertaintiessection of the 2015 Annual Report and Accounts.
Responsibility for risk management resides at all levels of the Bank from the Board and the Executive Committee supported by senior management committeesthrough the organisation to each business area subject to appropriate oversight. In line with this approach the Bank adopts the three lines of defencegovernance model which is outlined below:
Business Activities
Cash flow and liquidity management
The Co-operative Bank plc
Retail BaCB Treasury/ Other
Non-core
Business Activities
• Deposits• Credit and
lending to Retail
•
Business Activities
• Lending to SME sector
•
Business Activities
• Historic Corporate loans
• Closed mortgage book
Loans and advances to customers:£14,230.5m
Loans and advances to customers:
£547.6m
Credit risk balances:£6,135.3m
Loans and advances tocustomers£4,912.3m
RWAs
Credit risk: £1,810.9m Operational risk: £635.9m
RWAs
Credit risk: £496.8mOperational risk: £171.8m
RWAs
Credit risk: £1,440.8m Operational risk:(1)
£(14.8)m 35.9
RWAs
Credit risk: £2,769.1mOperational risk: £112.4m
22 The Co-operative Bank plc Pillar 3 Disclosures for the year ended 31 December 2015
5. Risks and their management
5.2 Risk Management objectives and policies continued• The Bank’s business teams act as first line of defence and are responsible for identifying where a business area is exposed to risks, including from the
development of new products, processes or other business change. They also manage the risks that reside within their business area on a day to day basis,implementing monitoring and control processes to ensure that the Bank’s business profile is understood and maintained within Board defined risk appetite.
• The Bank’s Risk Framework Owners act as the second line of defence. They oversee and challenge the implementation and monitoring of the RMF andconsider current and emerging risks across the Bank. They also oversee the appropriate escalation of breaches of appetite, mitigating actions and reportthese to the mandated senior management committee.
• The Bank’s Internal Audit function acts as the third line of defence. They are responsible for independently verifying that the RMF has been implemented asintended across the Bank, and independently challenge the overall management of the framework to provide assurance to the Audit Committee and seniormanagement on the adequacy of both first and second lines.
5.3 Risk Management Strategy and AppetiteThe Board has primary responsibility for identifying the key business risks facing the Bank, approving the Bank’s Risk Management Strategy which includessetting the risk appetite which defines the type and amount of risk that the Bank is prepared to accept both qualitatively and quantitatively in pursuit of itsstrategic objectives. In addition the Board approves key regulatory documents including the Internal Liquidity Adequacy Assessment Process (ILAAP) and theInternal Capital Adequacy Assessment Process (ICAAP) which also includes appropriate stress testing, scenario analysis and contingency planning allowing it tounderstand the impact of potentially severe risks to ensure that it remains resilient to them.
The Bank’s risk appetite is translated into specific risk measures that are tracked and monitored and reported to the appropriate Risk Committees and theBoard. The Bank’s Risk Appetite Framework has been designed to create clear links to the Bank’s strategic plan, capital planning, stress testing and the RMFwhereby appropriate metrics and limits for each risk category are clearly established and recalibrated in line with the planning process.
5.4 Principal Risks categoriesThe Bank’s principal risks are categorised into Capital, Liquidity and Funding, Reputational and Operational risks with further sub categories of risk underpinningCapital including Credit, Model, Pension, Market, Strategic and Business. The Bank also assesses Operational risks at a more granular level which areconsidered within this principal risk type.
Subsets of the principal risks are currently categorised as most material to the Bank and these are denoted as such*.
Principal risks Risk definitions
Capital risk The risk that the Bank’s regulatory capital resources are inadequate to cover its regulatory capital requirements.
Credit risk* The risk to Bank’s earnings and capital arising from a customer’s failure to meet their legal and contractual obligations.The Bank currently has one principal Credit risk policy that is executed via the RMF through separate 2nd line accountability forRetail, Corporate and Treasury Credit Risk.
Model risk* The risk of model failure or the inappropriate use of models resulting in potential loss, poor decision making and/or reputationaldamage.
Pension risk* The risk to Bank Capital and company funds from exposure to defined benefit scheme liabilities (to the extent that liabilities arenot matched by scheme assets) and risks inherent in the valuation of scheme liabilities and assets.
Market risk* The risk of loss as a result of the value of financial assets or liabilities (including off-balance sheet instruments) being adverselyaffected by the movement in market prices, interest rates or exchange rates. This loss can be reflected in the near term earningsby changing net interest income, or in the longer term as a result of changes in the economic value of future cash flows.
Strategic andBusiness risk*
Any risk to a firm arising from changes in its business, including the acute risk to earnings posed by falling or volatile income andthe broader risk of a firm’s business model or strategy proving inappropriate due to macroeconomic, geographical, industry,regulatory or other factors.
Liquidity and Fundingrisk
The risk that the Bank is unable to meet its obligations as they fall due or can only do so at excessive cost.
Reputational risk The risk of damage to how the Bank’s reputation, brand or image are perceived by its internal or external stakeholders as a resultof its conduct, performance, or the impact of operational failures or other external issues.
Operational risk The risk of loss resulting from inadequate or failed internal processes, people and systems or external events.
Conduct risk* The risk that the Bank’s behaviours, offerings or interactions will result in unfair outcomes for customers.
Regulatory risk* The risk that the Bank and its subsidiaries breach the letter and spirit of relevant laws, regulations, and codes of practice or standardsof good market practice. Changes in the regulatory environment may adversely effect the Bank’s ability to deliver its Updated Plan.
People risk* The risk associated with inappropriate employee behaviour, inadequate resource (people, capability and frameworks), resulting incustomer or financial detriment, and legal or regulatory censure.
The Co-operative Bank plc Pillar 3 Disclosures for the year ended 31 December 2015 23
5. Risks and their management continued

5.4 Principal Risks categories continuedPrincipal risks Risk definitions
Anti-MoneyLaundering risk*
The risk that the Bank may be used to facilitate the laundering of the proceeds of crime, the financing of terrorist activity orbreach financial sanction legislation.
Fraud risk* The risk that the Bank is exposed to uncontrolled levels of financial crime resulting in unplanned fraud losses, reduced customersconfidence and reputational damage.
Product risk* The risk that the Bank’s products result in unfair outcomes to customers, significant compliance breaches, financial loss, orreputational damage.
Financial Reportingrisk*
The risk of reputational damage resulting in loss of investor confidence, prejudicing the relationships with the regulatoryauthorities and/or financial loss caused by incorrect Financial Reporting arising from: the adoption of inappropriate accountingpolicies; ineffective controls over financial, regulatory, taxation and management reporting; failure to manage the associated risksof changes in financial, regulatory and taxation requirements; and failure to disclose accurate information about the Bank on atimely basis.
Information and Datarisk*
The risk associated with theft, loss, or misuse of information or the processing of inaccurate information, resulting in customer orfinancial detriment, and legal or regulatory censure.
Payment risk* The risk of failure to correctly make or receive customer payments, respond to customer payment instructions when requested orrectify payment errors for customers, as outlined in terms and conditions, regulatory requirements and payment scheme rulesresulting in poor customer outcomes, financial loss to the Bank or customer and/or potential regulatory or scheme fines.
Legal risk* Legal risk is defined as the risk that the Bank is not compliant with the applicable laws and that contractual arrangements withcustomers, suppliers or other third parties are not enforceable as intended, are enforced against the Bank in an unexpected wayor do not operate as expected. Legal risk may occur when the Bank’s assets are not legally protected (e.g. intellectual property,real estate property) or when litigation by or against the Bank is not appropriately managed to protect the Bank’s reputation andachieve the best outcome or the Bank mismanages relationships with competition, authorities and breeches competition laws. Ineach of the legal risks cases identified above, the result being that the Bank is exposed to legal and/or regulatory censure,financial loss, and/or reputational damage.
Technology risk* The risk of financial and non-financial impacts resulting from the lack of effective IT systems operability.
Change risk* The risk of change not being delivered successfully (Delivery risks) and/or that the change deliverables adversely impact theBanks risk profile (Associated Risks of Change). This definition covers all change activities including Transformation, Projects andbusiness funded change activities.
Third Party Supplierrisk*
The risk of reputational, financial and non-financial loss associated with all third parties relied upon to provide services and orproducts which support the operations and performance of the Bank.
Physical Assets risk* The risk associated with internal and external threats, either deliberate or accidental, against physical assets, colleagues, andcustomers that could cause financial and/or non-financial losses, damage to or non-availability of the Bank’s assets.
Insurance risk* The risk that financial exposures caused by an insured event, will not be payable by our insurance, or events occur where selfinsurance or external insurance was not available, could cause losses of an unforeseen magnitude.
Business Continuityrisk*
Business Continuity risk is defined as the risk associated with the inability of the Bank to continue delivery of products or servicesat acceptable predefined levels following a disruptive incident.
24 The Co-operative Bank plc Pillar 3 Disclosures for the year ended 31 December 2015
5. Risks and their management continued
5.5 Credit riskCredit risk is the risk that borrowers will fail to repay what they have borrowed. The risk to the Bank includes the amounts lent not being repaid, loan interest notbeing received, cash flows being received later than expected and increased collection costs. This results in the need to set aside provisions and capital toprovide for future losses.
5.5.1 Management of Credit riskCredit risk is one of the principal risks set out in the RMF and is an integral part of the Bank’s business activities. It is inherent in both traditional banking products(loans, commitments to lend and contingent liabilities such as letters of credit) and in 'traded products' (derivative contracts such as forwards, swaps andoptions, repurchase agreements, securities borrowing and lending transactions).
All authority to take credit risk derives from the Board. This authority is delegated to the CEO and CRO who may then sub-delegate to defined role holders, to useat an individual level or in their capacity as Chair at the appropriate committee. The level of credit risk authority delegated depends on seniority and experience.
The Bank’s overarching credit risk policy is approved annually by the Risk Committee and this is underpinned by supporting control standards and principles forthe effective management of credit risk throughout the Bank’s divisions.
Credit risk management is an essential element of the Bank’s operations. As with all principal risks, the Board requires that the credit business is managed inline with the risk strategy and risk appetite set by the Board. Risk measurement is based on a set of metrics, which are aligned with the Board agreed riskappetite and support the limits framework. These metrics undergo periodic review to assure that they are fit for purpose (i.e. are able to recognise both emergingand current risks). Credit risk models are subject to annual review by the Model Risk Oversight Committee (MROC).
Corporate lending discretion was undertaken in 2015 via key individual lending discretions, which were approved in December 2014.
The Credit Risk Oversight Committee (CROC) (formerly known as Retail and Corporate Credit Risk Management Forums) considers key managementinformation to support the oversight and challenge of the credit risk embedded in each division and across the credit risk life cycle. This includes appropriatebenchmarking information from similar portfolios in the market and is key to calibrating risk appetite.
The CROC is supported by an additional four forums that exist to support the CRO in discharging the second line mandate:
• Credit Impairment & Default Group, which reviews and approves provisions, write offs and provision releases and reviews the impairment charge againstforecast;
• Impairment Charge Forum, which was designed to ensure that the credit risk impairment standard is being implemented effectively and that there issufficient evidence to support the credit risk impairment stock;
• Impairment Adequacy Forum, which acts as a mechanism for approving and reviewing the refresh of impairment parameters and post model adjustments;
• Treasury Credit Risk Management Forum, which provides day-to-day oversight of the credit risk exposure in the Treasury division.
The Retail division of the Core Bank uses both application and behavioural scoring techniques to rank a customer’s risk of default with this, in common withother retail banks, being embedded in the business. The Non-core division, which includes corporate lending, includes a number of specialist models to reflectthe embedded credit risk of sectors such as Private Finance Initiatives (PFI) and commercial property. The performance of all rating systems is governed by theModel Working Group with oversight from the MROC.
5.5.2 Credit risk controlThe CROC review credit risk management information (MI) in depth, for example by risk pool, campaign or key risk splits. In addition, the credit risk second linereceives and reviews credit risk MI on a regular basis split by campaign or key sector characteristic. The CROC MI is produced on a monthly basis with differentMI produced for each asset class. The regular MI covers a broader scope than that provided to the EROC. Reports include:
• performance against agreed risk appetite limits and tolerances;
• sector and obligor concentrations and risk segmentation;
• monitoring of exposures at risk and in arrears and impairment levels;
• monitoring of loans under forbearance.
Early warning indicators are provided where appropriate, and any exceptions highlighted and escalated as necessary.
The Co-operative Bank plc Pillar 3 Disclosures for the year ended 31 December 2015 25
5. Risks and their management continued

5.5 Credit risk continued
Retail credit policyCredit approval and individual limit setting The Bank’s policy on retail secured and unsecured credit is to establish credit criteria that determine the balance between volume growth (generating higherincome) and higher arrears and losses, so as to ensure the return is commensurate with the Bank’s risk appetite, strategic objectives and enables sustainablegrowth. Retail credit risk related decisions are based on a combination of defined lending policy, made up of The Principal Credit Risk Policy, supporting ControlStandards and Lending Criteria, along with the use of bespoke scorecards derived from historical data. Monthly reporting on the performance of portfolios isprovided to senior management and presented to the Bank’s CROC.
Unsecured lending Application and behavioural scorecards are used to support new lending decisions and ongoing portfolio management. These scores are used, in combinationwith information from the Credit Reference Agencies, policy criteria and an assessment of affordability, to determine whether we will lend to an individualborrower and to set individual limits on the amount we will lend. Application scorecards are used to determine lending decisions to those customers with no orlimited existing relationship with the Bank. The characteristics of existing customers are assessed on a monthly basis using behavioural scorecards and theresulting scores are used to make lending decisions for existing customers, including credit limit increases/decreases, authorisation decisions and card reissue.Decisions are generally fully automated with manual intervention only required in the event of referrals being triggered or customer appeal. The application andbehavioural scorecards used for lending decisions and customer management actions form the main components of the IRB models.
Mortgage lending (credit approval) Scorecards are also used to assess new mortgage applications. The application models are integral in the assigning of IRB risk weights. The models have allbeen developed based on the profile of mortgage applicants received by the specific asset class. Each model uses a combination of external credit referencedata and information collected as part of the application process. The calculation of the application scores is fully automated within the application processingsystem. The score is used in association with lending policy and affordability checks to make a decision on whether an application will be approved. Morecomplex higher risk applications or those outside of standard lending policy are reviewed by more senior underwriters to ensure compliance with policy and toallow expert judgment within agreed levels of authority.
Individual and portfolio limit settingPortfolio limits are in place for specific lending sectors based on an overall assessment of our appetite for exposure to that sector. This includes an assessmentof risk based on the capital requirement of each sector based on the IRB models.
Retail pricing and profitabilityThe IRB models, or the underlying credit risk models upon which the IRB models are based, are used as inputs to pricing/profitability models across the Retailsecured portfolios.
Corporate credit policyThe Bank’s policy on new Corporate lending is to consider relatively low risk and senior (not subordinated) exposures from UK customers provided they meet thecriteria contained in the corresponding sector strategy, while avoiding excess single name or sector concentrations. During 2015 very little new Corporatelending was undertaken. Individual cases which show signs of unsatisfactory performance are managed through the Strategic Asset Review (SAR). The CROCand EROC (and by exception the RC) receive regular reports on the performance of the portfolio.
Corporate lending and credit approval Corporate exposures are managed through two distinct divisions. The Business and Commercial Banking (BaCB) division represents activity consistent with thestrategy and risk appetite of the Bank. The Non-core Corporate CoAM division is managed for value and targeted for run down or exit.
First line relationship managers submit recommendations for any new money to be lent which are risk assessed by the second line corporate credit riskunderwriting team (CCRU) which is independent from income generation. BaCB lending discretions for new money are made by named role holderspredominately within CCRU. Facilities that exceed CCRU role holder delegated lending authority are referred to a higher sanctioning authority in accordance withthe approved delegated lending discretions matrix. The Corporate CoAM strategy is executed through higher risk (default and watch list) and performingStrategic Asset Review (SAR) groups comprising of first and second line business including CCRU representatives where the majority of decisions are taken toset run-off or exit strategies but occasionally the customers may require additional lending to protect value in the work out of a particular asset. Where the levelsof exposure and/or new money exceeds the delegated lending authority of the most senior CCRU representative in attendance, the SAR groups makerecommendations to a higher sanctioning authority in accordance with the approved delegated lending discretions matrix to confirm the decision.
The credit underwriting team uses appropriate rating systems and other tools to analyse the underlying business and the counterparty's management to assessthe risk of each lending proposition and its ability to repay the borrowing. Other factors considered include the potential impact of economic changes, availabilityof supporting collateral, the financial stability of the counterparty and its ability to withstand such change.
26 The Co-operative Bank plc Pillar 3 Disclosures for the year ended 31 December 2015
5. Risks and their management continued
5.5 Credit risk continued5.5.3 Models used 5.5.3.1 Retail models residential mortgages
Probability of Default (PD) models Underlying scorecards are calibrated to a definition of default to provide a PD for each loan. The definition of default for secured exposures is taken as six monthsin arrears, but also includes the relevant unlikeliness to pay elements such as bankruptcy and litigation. The application credit score is used for new lending todetermine PD up until sufficient internal account performance data is available, at which time the behaviour score will be used to determine PD. The ratingsphilosophy of the PD models is deemed to be hybrid with the point-in-time score mapped to a long run average PD grade. The long run grades have beendetermined using historical data and an assessment of PD performance over an economic cycle.
Loss Given Default (LGD) modelsThe key components of the LGD models are the Probability of Possession given Default (PPD) and expected shortfall, calibrated to reflect a downturnenvironment. Any post sale recoveries are excluded from the loss estimate. The expected shortfall calculation uses an estimate of house price at sale, a forcedsale discount, projected balances (EAD) and costs, along with time to possession and sale parameters and standard discounting principles.
5.5.3.2 Qualifying revolving and other retail exposures
Probability of Default (PD) modelsUnderlying business scorecards are calibrated to a definition of default to provide a PD for each loan. The definition of default for unsecured exposures is takenas 90 days past due and includes some relevant unlikeliness to pay elements such as bankruptcy. The application credit score is used for new lending todetermine PD up until sufficient internal account performance data is available, at which time the behaviour score will be used to determine PD. The ratingsphilosophy of the PD models is deemed to be predominantly a point-in-time and therefore changes in the quality of the portfolio will be reflected via a movementin ratings.
Loss Given Default (LGD) models These models estimate the average loss percentage of snapshot balances over a 36 month recovery period for the three population segments: default, non-default and charge off. The 36 month LGD is then discounted (using standard discounting principles) and adjusted for recoveries between 36-48 months, cost ofcollections and downturn stress.
This LGD measure is then used to set the downturn LGD value based on the worst (highest) LGD observed during the development window, which in turn is usedto determine capital requirements.
Exposure at Default (EAD) For credit cards and current accounts, EAD is based on current drawn exposure plus an adjustment for future drawn exposure and fees. Accounts aresegmented into risk pools which are used to determine the level of adjustment (increase in EAD) applied. For loan accounts, the EAD is set at 100%, in line withthe guidance set out by the regulatory requirements.
5.5.3.3 Corporate models A single definition of default is applied across the whole Corporate portfolio (foundation IRB, specialised lending and standardised). This definition is taken asbeing one or more of the following:
• where the Bank considers that the borrower is unlikely to repay its credit obligations without recourse by the Bank to actions such as realising security (ifheld);
• the borrower is past due more than 90 days on any material credit obligation; and/or
• the borrower has committed an act of default (i.e. bankruptcy, filing for administration, liquidation etc). An additional Watchlist marker, which is broken downinto three stages, is applied to help identify where a situation has not reached the point of default but is one that the SAR groups have decided merits closermanagement.
Probability of Default (PD) modelsThere are four PD models in use for grading and monitoring exposures to corporates. Two of them (CreditEdge and RiskCalc) are external vendor models whichare used industry-wide to rate general corporates. The other two are internally developed and are used to rate Registered Social Landlords (i.e. HousingAssociations) and Business Banking customers. The ratings philosophy of these PD models is defined as 'near point-in-time models'. The output of all PDmodels is mapped to the 13 grades of the internally calibrated Master Grading Scale (with a 14th grade indicating default).
Loss Given Default (LGD) modelsCapital for customers rated with a PD model is calculated under the foundation IRB approach and therefore regulatory prescribed LGD rates apply (from 35% forsenior exposures fully secured by real estate collateral to 45% for senior unsecured exposures).
The Co-operative Bank plc Pillar 3 Disclosures for the year ended 31 December 2015 27
5. Risks and their management continued

5.5 Credit risk continuedSupervisory slotting approach Supervisory slotting criteria are used to analyse and monitor the specialised lending exposures to PFIs and commercial real estate. The PFI and propertyinvestment and development ‘slotting models’ are based on regulatory approaches and their output is mapped to four supervisory categories from strong toweak (slotting categories 1–4 respectively) or default with prescribed risk and expected loss weights.
Overrides The PD and slotting grades can be overridden by exception in line with policy to ensure that the grades fully reflect all available information.
Standardised approach Capital for customers not rated with a PD or slotting model is calculated under the standardised approach using regulatory prescribed risk weights.
Exposure at Default (EAD) EAD across the whole Corporate portfolio is calculated by applying regulatory prescribed Credit Conversion Factors (CCFs).
5.5.3.4 Wholesale model Under Foundation IRB we use modelled PD for Treasury counterparties and regulatory defined LGD. The quantitative assessment is based upon bond defaultstatistics. Credit ratings are derived from a variety of information sources including External Credit Assessment Institutions’s (ECAI) (Moody’s and Fitch) based onfundamental credit analysis to assign an appropriate Internal Rating Grade (IRG) 1–9. More conservative, qualitative overlays to counterparties IRG (downwardoverrides) may be applied with the supporting credit rationale clearly stated in the appropriate credit review.
Treasury counterparty limit matrixExternal Credit Rating
Long term Short term————————————————— —————————————————
Internal Rating Grade PD Band % Fitch Moody’s Fitch Moody’s
IRG 1 0.03% AAA/AA+ Aaa Aa1F1+
IRG 2 0.03% AA Aa2
IRG 3 0.05% AA- Aa3F1
P-1
IRG 4 0.08% A+ A1
IRG 5 0.12% A A2 F1
IRG 6 0.28% A-/BBB+ A3/Baa1F2 P-2/P-3
IRG 7 0.66% BBB/BBB- Baa2/Baa3
IRG 8 2.04% BB+/BB/BB- Ba1/Ba2/Ba3 B NP
IRG 9 7.43% B+/B/B-/CCC B1/B2/B3/Caa C NP
5.5.3.5 Model performance and back testing This section provides analysis of the performance of IRB models over 2014 and 2015.
The table outlines the estimated and actual performance for PD, EAD and LGD by exposure class. All figures reported are taken from the regulatory capitalmodels.
For PD and EAD the calculation shown assesses the non-defaulted portfolio at the start of the period and measures the default emergence over the followingyear. These are measured on an account weighted basis. For LGD, the calculation shown assesses the losses of the defaulted population, with actuals measuredat the end of the period. The estimates are taken from 4 years previous for unsecured (to allow time for recoveries) and 2 years previous for secured (to allowtime for the default to progress to sale).
To ensure fair comparisons can be made over the period in regards to Retail secured by immovable property, exposures now securitised through WarwickFinance One & Two transactions are removed from all estimated and actual performance.
28 The Co-operative Bank plc Pillar 3 Disclosures for the year ended 31 December 2015
5. Risks and their management continued

5.5 Credit risk continuedTable 14 Model performance
PD EAD————————————————————————————————— —————————————————
Long run Long runEstimate at Actual Estimate at Actual Estimate to Actual Estimate to Actual
2015 2015 2014 2014 Ratio 2015 Ratio 2014Exposure Class % % % % % %
Retail
– Retail secured by immovable property 1.4% 0.5% 1.4% 0.7% 101.5% 101.6%
– Qualifying revolving retail exposures 0.9% 0.5% 1.0% 0.5% 128.6% 132.5%
– Retail other non-SME 4.5% 2.2% 4.8% 3.2% 116.0% 113.3%
Corporate 1.1% 1.1% 1.1% 1.3% – –
Note: The Corporate portfolio operates under the Foundation IRB Approach under which EADs and LGDs are not modelled.
LGD—————————————————————————————————
Downturn DownturnEstimate at Actual Estimate at Actual
2015 2015 2014 2014Exposure Class % % % %
Retail
– Retail secured by immovable property 16.8% 3.2% 17.3% 4.7%
– Qualifying revolving retail exposures 81.6% 76.1% 76.0% 73.3%
– Retail other non-SME 81.4% 71.7% 78.0% 69.7%
– Unsecured charged-off 91.1% 92.4% 88.7% 87.0%
Retail unsecured (Qualifying revolving retail exposures and Retail other non-SME)Note that a small proportion of the Retail unsecured portfolio is excluded from these comparisons. This covers immaterial products from a capital perspectivesuch as basic bank accounts (approximately 0.36% of Retail unsecured non-default RWA is excluded as at 31 December 2015).
There are a number of factors that influence the metrics shown, including:
• the conservatism within the estimates in line with regulatory calculations, for example the Retail unsecured PD models are hybrid models but arepredominantly ‘point-in-time’ requiring a conservative add-on to the estimates. Hence the actual default rates are significantly lower than estimates;
• retail unsecured EAD models are similar to the above with substantial layers of conservatism included, especially for Qualifying revolving retail exposures;
• movements in portfolio risk over time. General improvements in risk are seen across the Retail business;
• regular realignments of the Retail unsecured PD models to reflect the above; and
• The LGD models are generally performing better than expected. This is predominantly due to changes in the underlying performance of the portfolio due to amix of portfolio and strategy changes and debt sale activity, that haven't yet been reflected in the model. The only exception is the 'unsecured charged-off'model, where the actual for 2015 is exceeding the estimate. However, this under-estimation is within tolerance and reflects a breach of the point-in-timeestimate, not the downturn estimate (94.1%) used to determine capital.
Retail secured by immovable propertyAs with Retail unsecured, the actual outcomes for the secured portfolio are lower than the estimates for all metrics:
• the Retail secured PDs used within the regulatory capital models are based on long-run averages. Hence the actual default rates are significantly lower thanestimates due to the continued low interest rate environment and reducing unemployment;
• actual and modelled EADs tend to be very stable, which is demonstrated in the above table;
• the actual LGDs are significantly lower than estimates. They are currently measured 24 months after default, and so actual losses will continue to materialiseafterwards. However extending the measurement to 36 months only increases the 2014 actual from 4.7% to 4.9%. Please note, 36 months performance isnot available for 2015 actual as this represents performance of defaults in 2013. The LGD model predicts losses in a downturn environment and thereforeassumes a fall in property values. However, over the last 2 years, house prices have increased by 18% nationally, thus leading to reduced losses; and
• the above table shows the secured LGD estimates from the current LGD model. Due to proposed methodology changes when estimating downturnpossession rates, there is an additional overlay applied to the final capital figures. This overlay is not reflected in the above metrics.
The Co-operative Bank plc Pillar 3 Disclosures for the year ended 31 December 2015 29
5. Risks and their management continued

5.5 Credit risk continuedCorporateThe Income Producing Real Estate (IPRE) and PFI models use the Foreign Investment Review Board (FIRB) Specialised Lending (slotting) methodology whichassigns prescribed risk weights and EL weights and as such are not shown. The table also excludes those sectors where the standardised approach is adopted,typically due to low volumes or a low default history of a particular sector.
Overall, corporate year on year actual defaults have reduced. Actual default rates for 2015 exceed estimated PDs. This is predominantly driven by the lowexposure, high volume Business Banking portfolio, which although they represent the highest proportion of actual defaults, in terms of volumes, represents only3.5% of exposures within the portfolios covered by FIRB PD models.The Bank has recalibrated the Business Banking PD model during 2015 to address theunderestimation.
5.5.4 Approach to validationModel governance standards apply to ratings models to ensure that principal risks faced by the Bank are appropriately managed under the RMF. All modeldevelopments and material adjustments are subject to assessment against this framework, which incorporates relevant requirements from CRR. Modelgovernance standards are set in the Model Risk Control Standards and governed by the Model Risk Oversight Committee. The coordination of all model riskresides with the MROC reporting directly to EROC.
The Model Risk Control Standards require that:
• the materiality of any given model is measured based on the potential impact of the risk being modelled;
• expected performance standards should be set for the new model against which its actual performance can be benchmarked;
• results and methods should be fully documented;
• data used must comply with the overarching Bank Data Standards;
• an independent review is required prior to approval;
• models must undergo a post-implementation review;
• models must be approved through the appropriate approval governance process, both at inception and throughout their life cycle;
• a monitoring frequency is agreed; and
• models must be logged on the Bank’s Model Inventory.
Model development, re-calibration and monitoring requirements in line with these control standards are governed through the Model Working Group reportingup to the MROC.
A review by the PRA took place in 2015 for compliance with IRB related CRR articles and identified areas of non-compliance and inadequate procedures relatingto use of the IRB approach and a remediation plan commenced in accordance with supervisory guidance.This review and remediation plan was a key focus in2015 and areas of improvement identified are being addressed in 2016. Model Risk Policy and Model Risk Control Standards and a Model Inventory have beenredesigned. Work continues in 2016 to strengthen the control environment: model risk monitoring, enhancement of KPIs, Policy/Control Standards and ModelInventory. Resource continues to be reassessed to meet ongoing priorities.
30 The Co-operative Bank plc Pillar 3 Disclosures for the year ended 31 December 2015
5. Risks and their management continued

5.5 Credit risk continued5.5.5 Credit risk exposures The following table represents the Bank’s EAD analysed by approach, exposure class and contractual maturity.
Table 15 Analysis of EAD by residual contractual maturity2015
Repayable ondemand/undated Up to 1 year 1-5 years 5-10 years 10-20 years >20 years Total
Exposure class £m £m £m £m £m £m £m
IRBInstitutions – 678.4 115.9 40.3 1.4 – 836.0
Corporates – 61.6 224.6 270.4 276.8 318.8 1,152.2
Retail secured by immovable property – 173.7 709.0 1,842.9 6,917.5 5,920.5 15,563.6
Qualifying revolving retail exposures 2,031.9 – – – – – 2,031.9
Retail other non-SME 51.1 21.0 203.5 13.1 – – 288.7
Securitisation positions – – – 1,423.2 – 1,614.8 3,038.0
Total IRB 2,083.0 934.7 1,253.0 3,589.9 7,195.7 7,854.1 22,910.4
Specialised lending – 213.2 320.6 178.5 374.5 409.4 1,496.2
StandardisedCentral government or central banks – 2,947.0 1,387.3 1,060.8 70.3 – 5,465.4
Regional governments or local authorities – 0.1 2.5 – – 2.4 5.0
Public sector entities – 0.1 2.9 2.4 13.1 1.5 20.0
Multilateral development banks – 69.2 344.5 87.2 – – 500.9
Institutions – 56.2 16.6 – – – 72.8
Corporates – 17.3 99.8 79.7 94.5 28.8 320.1
Retail exposures 0.5 3.0 58.8 15.1 – – 77.4
Secured by mortgages on immoveable property – – 0.2 – – – 0.2
Exposures in default – 19.1 21.4 0.2 0.2 0.1 41.0
Covered bonds – – – – – – –
Equity exposures 60.5 – – – – – 60.5
Other items 165.2 25.4 147.7 69.8 51.7 2.0 461.8
Total standardised 226.2 3,137.4 2,081.7 1,315.2 229.8 34.8 7,025.1
Total credit risk exposures 2,309.2 4,285.3 3,655.3 5,083.6 7,800.0 8,298.3 31,431.7
Deleverage of Non-core assets results in IRB portfolios, Corporates and Specialised Lending reducing by 19% and 51% respectively. Retail secured byimmovable property reduced by 19% driven by securitisation of Warwick Finance One & Two.
The Co-operative Bank plc Pillar 3 Disclosures for the year ended 31 December 2015 31
5. Risks and their management continued

5.5 Credit risk continued2014
Repayable ondemand/undated Up to 1 year 1-5 years 5-10 years 10-20 years >20 years Total
Exposure class £m £m £m £m £m £m £m
IRBCentral government and central bank – 2.8 – – – – 2.8
Institutions – 1,269.6 249.0 48.4 0.1 – 1,567.1
Corporates – 264.8 168.3 206.1 288.4 496.4 1,424.0
Retail secured by immovable property – 167.6 984.4 2,334.6 10,104.5 5,537.7 19,128.8
Qualifying revolving retail exposures 2,162.9 – – – – – 2,162.9
Retail other non-SME 32.4 42.6 326.2 33.2 0.1 – 434.5
Securitisation positions – 1.5 6.0 1,568.9 47.4 – 1,623.8
Total IRB 2,195.3 1,748.9 1,733.9 4,191.2 10,440.5 6,034.1 26,343.9
Specialised lending – 408.1 994.1 320.8 671.4 673.0 3,067.4
StandardisedCentral government or central banks – 4,507.7 2,333.5 1,171.2 72.0 – 8,084.4
Regional governments or local authorities – 19.5 1.0 – 2.9 2.4 25.8
Public sector entities – 15.9 5.4 14.4 34.7 1.5 71.9
Multilateral development banks – 68.5 461.3 52.7 5.7 – 588.2
Institutions – 69.9 74.9 – – – 144.8
Corporates – 202.0 137.1 251.6 324.9 28.8 944.4
Retail exposures 3.2 6.9 84.6 32.5 3.3 0.2 130.7
Secured by mortgages on immoveable property 8.0 1.6 3.5 13.9 1.8 3.8 32.6
Exposures in default 0.2 10.8 30.8 1.6 9.4 – 52.8
Covered bonds 74.5 – – – – – 74.5
Equity exposures 8.1 – – – – – 8.1
Other items 316.2 170.3 236.7 154.1 79.5 3.1 959.9
Total standardised 410.2 5,073.1 3,368.8 1,692.0 534.2 39.8 11,118.1
Total credit risk exposures 2,605.5 7,230.1 6,096.8 6,204.0 11,646.1 6,746.9 40,529.4
Movement in EAD by Maturity Profile 2014 to 2015:
• Foundation IRB Corporates: Reduction in EAD is due to deleverage of the Corporate Non-core CoAM portfolio.
• Retail secured by immovable property: Reduction in EAD due to Warwick Finance One & Two securitisation. The Core mortgage book exposure has remainedcirca £13bn over the year where new advances, largely acquired on Platform, have been offset by maturities/amortisations.
• Qualifying revolving retail exposures:A 6% reduction in EAD, all repayable on demand. This is driven by a reduction in credit card exposure, due to acombination of customer management limit strategies and balance attrition.
• Retail other non-SME: Reduction largely driven by a reduction in loan assets due to amortisation and low volumes of new business during 2015. EAD over theperiod reduced by 34% from £435m to £289m.
• Specialised lending: Reduction in EAD was driven largely by deleverage of IPRE and PFI assets.
• Standardised Corporates: EAD reduction primarily due to the sale of Renewable Energy assets (circa £300m) along with deleverage of other individual assets.
32 The Co-operative Bank plc Pillar 3 Disclosures for the year ended 31 December 2015
5. Risks and their management continued

5.5 Credit risk continued5.5.6 Impaired and past due exposuresThe following table represents the Bank’s EAD, impaired and past due exposures and impairment analysed by approach and exposure class.
Table 16 Analysis of impaired and past due exposures
2015Charges forspecific and
Specific general creditOf which: Of which: Past and general risk adjustments
Exposure at Impaired due exposures credit risk during thedefault exposures not impaired adjustments reporting period
Exposure class £m £m £m £m £m
IRBInstitutions 836.0 – – – –
Corporates 1,152.2 49.6 – 17.9 (3.7)
Retail secured by immovable property 15,563.6 369.2 – 17.0 (45.6)
Qualifying revolving retail exposures 2,031.9 44.3 – 30.8 9.0
Retail other non-SME 288.7 84.6 – 69.7 (3.2)
Securitisation positions 3,038.0 – – – –
Total IRB 22,910.4 547.7 – 135.4 (43.5)
Specialised lending 1,496.2 275.5 – 97.5 17.3
Standardised approachCentral government or central banks 5,465.4 – – – –
Regional governments or local authorities 5.0 – – – –
Public sector entities 20.0 0.5 – – –
Multilateral development banks 500.9 – – – –
Institutions 72.8 – – – –
Corporates 320.1 21.3 – 1.1 (5.3)
Retail exposures 77.4 0.7 – – –
Secured by mortgages on immoveable property 0.2 – – – –
Exposures in default 41.0 41.0 – 11.2 (6.2)
Covered bonds – – – – –
Equity exposures 60.5 – – – –
Other items 461.8 – – – –
Total standardised 7,025.1 63.5 – 12.3 (11.5)
Total credit risk exposures 31,431.7 886.7 – 245.2 (37.7)
The period to 31 December 2015 has seen an overall reduction in exposures at default, notably for Retail secured by immovable property, driven by thesecuritisation of Warwick Finance One & Two as well as for Corporate and Specialised lending asset classes, in line with of the Bank’s strategy to deleverageNon-core assets. All specific and general credit risk adjustments are disclosed on a statutory basis.
The Co-operative Bank plc Pillar 3 Disclosures for the year ended 31 December 2015 33
5. Risks and their management continued
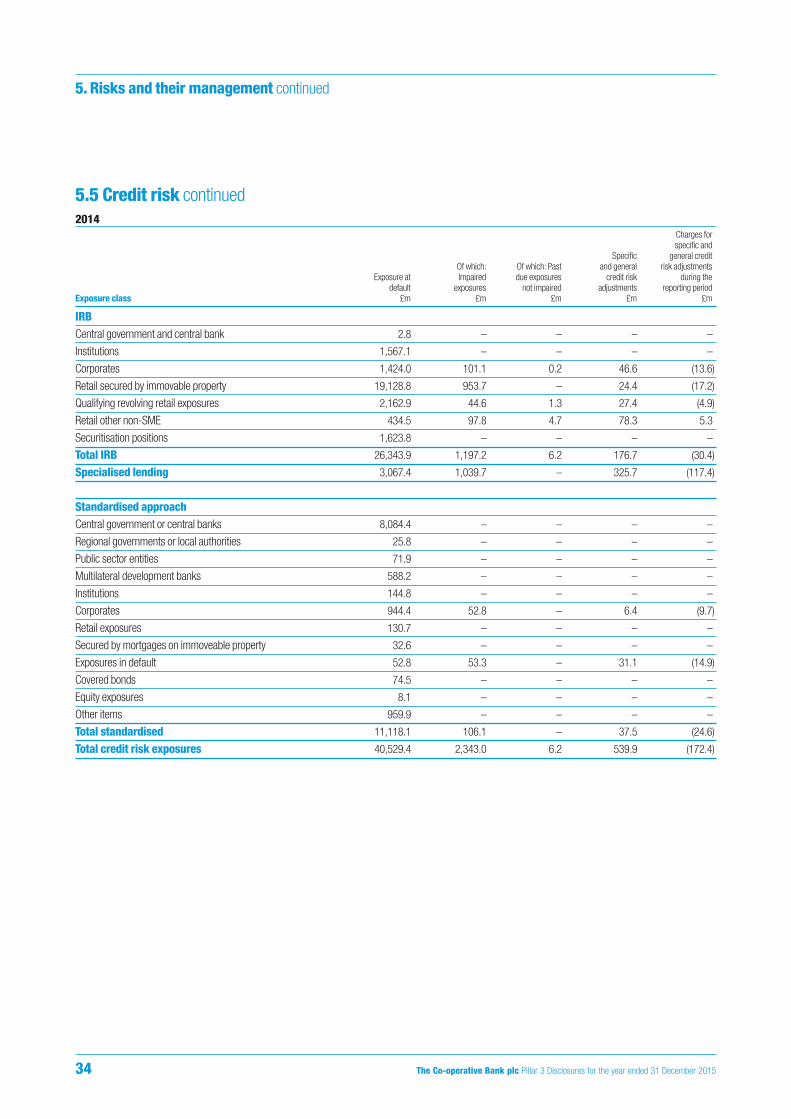
5.5 Credit risk continued2014
Charges forspecific and
Specific general creditOf which: Of which: Past and general risk adjustments
Exposure at Impaired due exposures credit risk during thedefault exposures not impaired adjustments reporting period
Exposure class £m £m £m £m £m
IRBCentral government and central bank 2.8 – – – –
Institutions 1,567.1 – – – –
Corporates 1,424.0 101.1 0.2 46.6 (13.6)
Retail secured by immovable property 19,128.8 953.7 – 24.4 (17.2)
Qualifying revolving retail exposures 2,162.9 44.6 1.3 27.4 (4.9)
Retail other non-SME 434.5 97.8 4.7 78.3 5.3
Securitisation positions 1,623.8 – – – –
Total IRB 26,343.9 1,197.2 6.2 176.7 (30.4)
Specialised lending 3,067.4 1,039.7 – 325.7 (117.4)
Standardised approachCentral government or central banks 8,084.4 – – – –
Regional governments or local authorities 25.8 – – – –
Public sector entities 71.9 – – – –
Multilateral development banks 588.2 – – – –
Institutions 144.8 – – – –
Corporates 944.4 52.8 – 6.4 (9.7)
Retail exposures 130.7 – – – –
Secured by mortgages on immoveable property 32.6 – – – –
Exposures in default 52.8 53.3 – 31.1 (14.9)
Covered bonds 74.5 – – – –
Equity exposures 8.1 – – – –
Other items 959.9 – – – –
Total standardised 11,118.1 106.1 – 37.5 (24.6)
Total credit risk exposures 40,529.4 2,343.0 6.2 539.9 (172.4)
34 The Co-operative Bank plc Pillar 3 Disclosures for the year ended 31 December 2015
5. Risks and their management continued
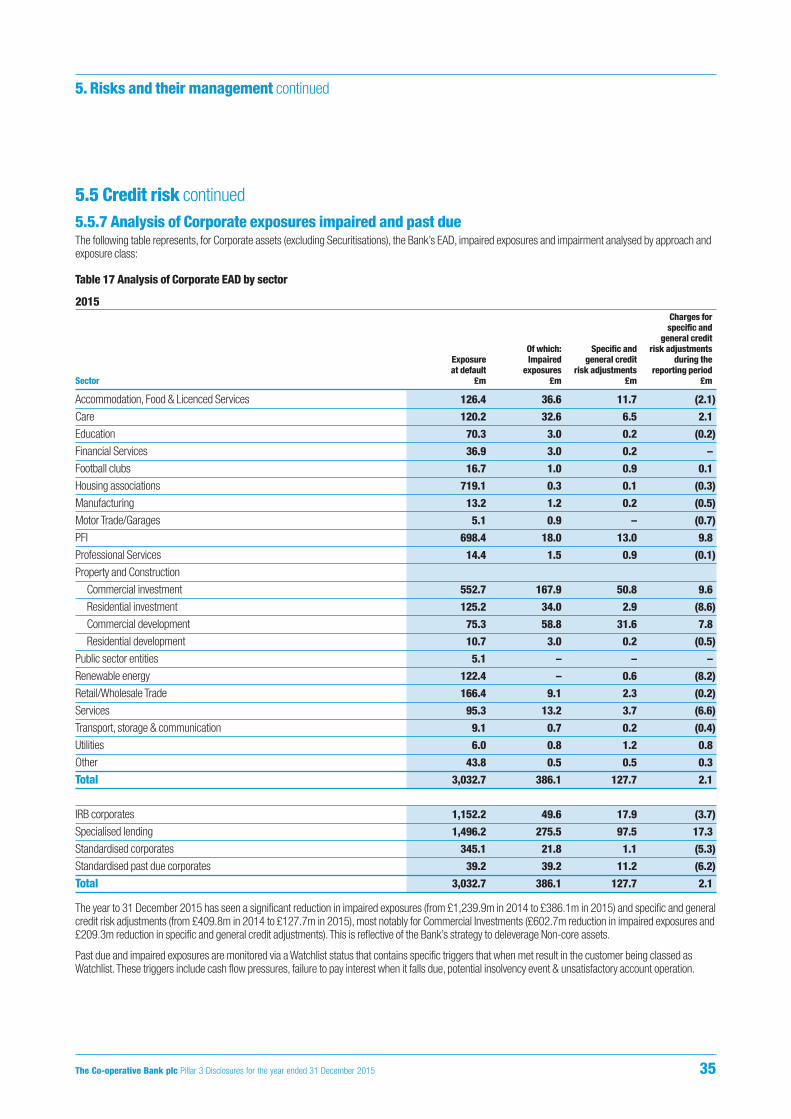
5.5 Credit risk continued5.5.7 Analysis of Corporate exposures impaired and past due The following table represents, for Corporate assets (excluding Securitisations), the Bank’s EAD, impaired exposures and impairment analysed by approach andexposure class:
Table 17 Analysis of Corporate EAD by sector
2015Charges forspecific and
general creditOf which: Specific and risk adjustments
Exposure Impaired general credit during theat default exposures risk adjustments reporting period
Sector £m £m £m £m
Accommodation, Food & Licenced Services 126.4 36.6 11.7 (2.1)
Care 120.2 32.6 6.5 2.1
Education 70.3 3.0 0.2 (0.2)
Financial Services 36.9 3.0 0.2 –
Football clubs 16.7 1.0 0.9 0.1
Housing associations 719.1 0.3 0.1 (0.3)
Manufacturing 13.2 1.2 0.2 (0.5)
Motor Trade/Garages 5.1 0.9 – (0.7)
PFI 698.4 18.0 13.0 9.8
Professional Services 14.4 1.5 0.9 (0.1)
Property and Construction
Commercial investment 552.7 167.9 50.8 9.6
Residential investment 125.2 34.0 2.9 (8.6)
Commercial development 75.3 58.8 31.6 7.8
Residential development 10.7 3.0 0.2 (0.5)
Public sector entities 5.1 – – –
Renewable energy 122.4 – 0.6 (8.2)
Retail/Wholesale Trade 166.4 9.1 2.3 (0.2)
Services 95.3 13.2 3.7 (6.6)
Transport, storage & communication 9.1 0.7 0.2 (0.4)
Utilities 6.0 0.8 1.2 0.8
Other 43.8 0.5 0.5 0.3
Total 3,032.7 386.1 127.7 2.1
IRB corporates 1,152.2 49.6 17.9 (3.7)
Specialised lending 1,496.2 275.5 97.5 17.3
Standardised corporates 345.1 21.8 1.1 (5.3)
Standardised past due corporates 39.2 39.2 11.2 (6.2)
Total 3,032.7 386.1 127.7 2.1
The year to 31 December 2015 has seen a significant reduction in impaired exposures (from £1,239.9m in 2014 to £386.1m in 2015) and specific and generalcredit risk adjustments (from £409.8m in 2014 to £127.7m in 2015), most notably for Commercial Investments (£602.7m reduction in impaired exposures and£209.3m reduction in specific and general credit adjustments). This is reflective of the Bank’s strategy to deleverage Non-core assets.
Past due and impaired exposures are monitored via a Watchlist status that contains specific triggers that when met result in the customer being classed asWatchlist. These triggers include cash flow pressures, failure to pay interest when it falls due, potential insolvency event & unsatisfactory account operation.
The Co-operative Bank plc Pillar 3 Disclosures for the year ended 31 December 2015 35
5. Risks and their management continued
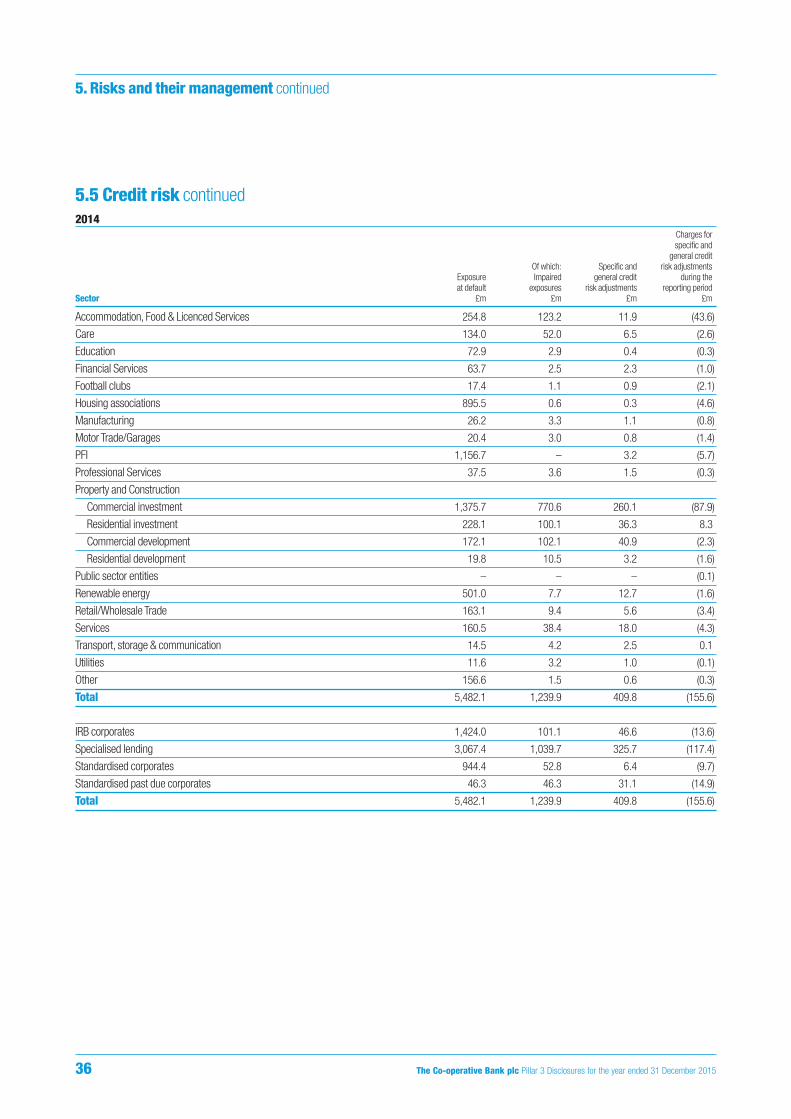
5.5 Credit risk continued2014
Charges forspecific and
general creditOf which: Specific and risk adjustments
Exposure Impaired general credit during theat default exposures risk adjustments reporting period
Sector £m £m £m £m
Accommodation, Food & Licenced Services 254.8 123.2 11.9 (43.6)
Care 134.0 52.0 6.5 (2.6)
Education 72.9 2.9 0.4 (0.3)
Financial Services 63.7 2.5 2.3 (1.0)
Football clubs 17.4 1.1 0.9 (2.1)
Housing associations 895.5 0.6 0.3 (4.6)
Manufacturing 26.2 3.3 1.1 (0.8)
Motor Trade/Garages 20.4 3.0 0.8 (1.4)
PFI 1,156.7 – 3.2 (5.7)
Professional Services 37.5 3.6 1.5 (0.3)
Property and Construction
Commercial investment 1,375.7 770.6 260.1 (87.9)
Residential investment 228.1 100.1 36.3 8.3
Commercial development 172.1 102.1 40.9 (2.3)
Residential development 19.8 10.5 3.2 (1.6)
Public sector entities – – – (0.1)
Renewable energy 501.0 7.7 12.7 (1.6)
Retail/Wholesale Trade 163.1 9.4 5.6 (3.4)
Services 160.5 38.4 18.0 (4.3)
Transport, storage & communication 14.5 4.2 2.5 0.1
Utilities 11.6 3.2 1.0 (0.1)
Other 156.6 1.5 0.6 (0.3)
Total 5,482.1 1,239.9 409.8 (155.6)
IRB corporates 1,424.0 101.1 46.6 (13.6)
Specialised lending 3,067.4 1,039.7 325.7 (117.4)
Standardised corporates 944.4 52.8 6.4 (9.7)
Standardised past due corporates 46.3 46.3 31.1 (14.9)
Total 5,482.1 1,239.9 409.8 (155.6)
36 The Co-operative Bank plc Pillar 3 Disclosures for the year ended 31 December 2015
5. Risks and their management continued
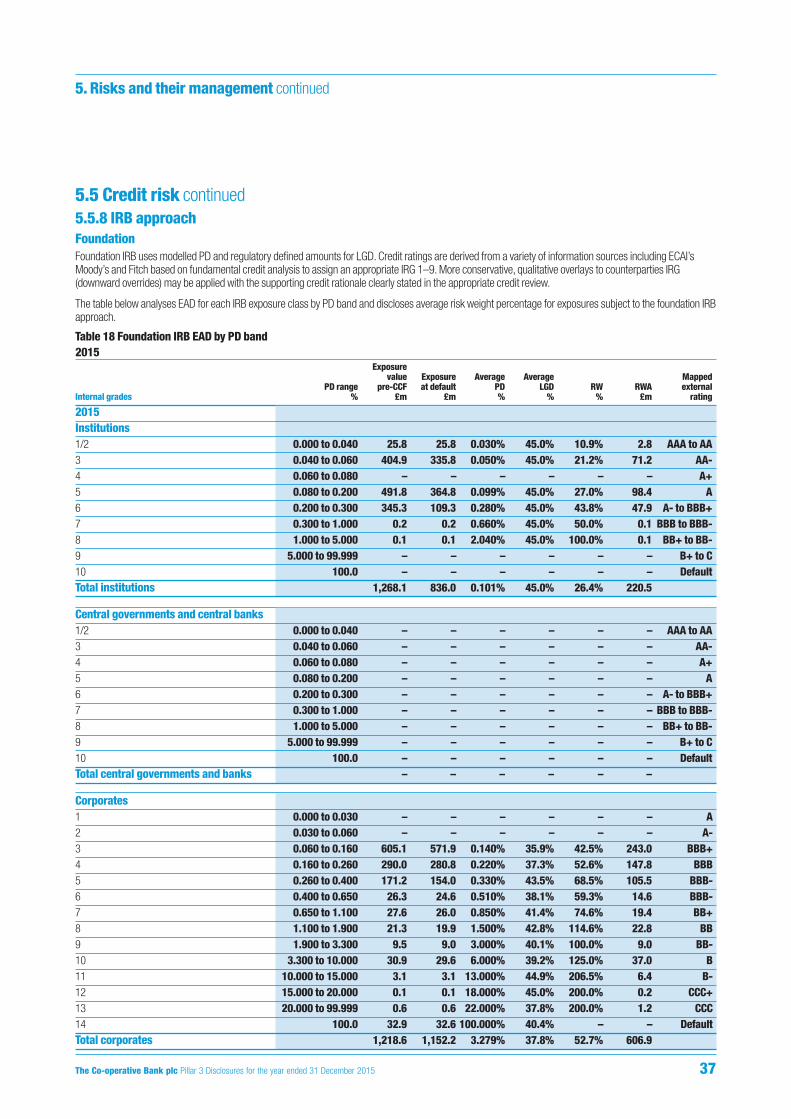
5.5 Credit risk continued5.5.8 IRB approach FoundationFoundation IRB uses modelled PD and regulatory defined amounts for LGD. Credit ratings are derived from a variety of information sources including ECAI’sMoody’s and Fitch based on fundamental credit analysis to assign an appropriate IRG 1–9. More conservative, qualitative overlays to counterparties IRG(downward overrides) may be applied with the supporting credit rationale clearly stated in the appropriate credit review.
The table below analyses EAD for each IRB exposure class by PD band and discloses average risk weight percentage for exposures subject to the foundation IRBapproach.
Table 18 Foundation IRB EAD by PD band2015
Exposurevalue Exposure Average Average Mapped
PD range pre-CCF at default PD LGD RW RWA externalInternal grades % £m £m % % % £m rating
2015Institutions1/2 0.000 to 0.040 25.8 25.8 0.030% 45.0% 10.9% 2.8 AAA to AA3 0.040 to 0.060 404.9 335.8 0.050% 45.0% 21.2% 71.2 AA-4 0.060 to 0.080 – – – – – – A+5 0.080 to 0.200 491.8 364.8 0.099% 45.0% 27.0% 98.4 A6 0.200 to 0.300 345.3 109.3 0.280% 45.0% 43.8% 47.9 A- to BBB+7 0.300 to 1.000 0.2 0.2 0.660% 45.0% 50.0% 0.1 BBB to BBB-8 1.000 to 5.000 0.1 0.1 2.040% 45.0% 100.0% 0.1 BB+ to BB-9 5.000 to 99.999 – – – – – – B+ to C10 100.0 – – – – – – DefaultTotal institutions 1,268.1 836.0 0.101% 45.0% 26.4% 220.5
Central governments and central banks1/2 0.000 to 0.040 – – – – – – AAA to AA3 0.040 to 0.060 – – – – – – AA-4 0.060 to 0.080 – – – – – – A+5 0.080 to 0.200 – – – – – – A6 0.200 to 0.300 – – – – – – A- to BBB+7 0.300 to 1.000 – – – – – – BBB to BBB-8 1.000 to 5.000 – – – – – – BB+ to BB-9 5.000 to 99.999 – – – – – – B+ to C10 100.0 – – – – – – DefaultTotal central governments and banks – – – – – –
Corporates1 0.000 to 0.030 – – – – – – A 2 0.030 to 0.060 – – – – – – A- 3 0.060 to 0.160 605.1 571.9 0.140% 35.9% 42.5% 243.0 BBB+ 4 0.160 to 0.260 290.0 280.8 0.220% 37.3% 52.6% 147.8 BBB 5 0.260 to 0.400 171.2 154.0 0.330% 43.5% 68.5% 105.5 BBB- 6 0.400 to 0.650 26.3 24.6 0.510% 38.1% 59.3% 14.6 BBB- 7 0.650 to 1.100 27.6 26.0 0.850% 41.4% 74.6% 19.4 BB+ 8 1.100 to 1.900 21.3 19.9 1.500% 42.8% 114.6% 22.8 BB 9 1.900 to 3.300 9.5 9.0 3.000% 40.1% 100.0% 9.0 BB- 10 3.300 to 10.000 30.9 29.6 6.000% 39.2% 125.0% 37.0 B 11 10.000 to 15.000 3.1 3.1 13.000% 44.9% 206.5% 6.4 B- 12 15.000 to 20.000 0.1 0.1 18.000% 45.0% 200.0% 0.2 CCC+ 13 20.000 to 99.999 0.6 0.6 22.000% 37.8% 200.0% 1.2 CCC 14 100.0 32.9 32.6 100.000% 40.4% – – Default Total corporates 1,218.6 1,152.2 3.279% 37.8% 52.7% 606.9
The Co-operative Bank plc Pillar 3 Disclosures for the year ended 31 December 2015 37
5. Risks and their management continued
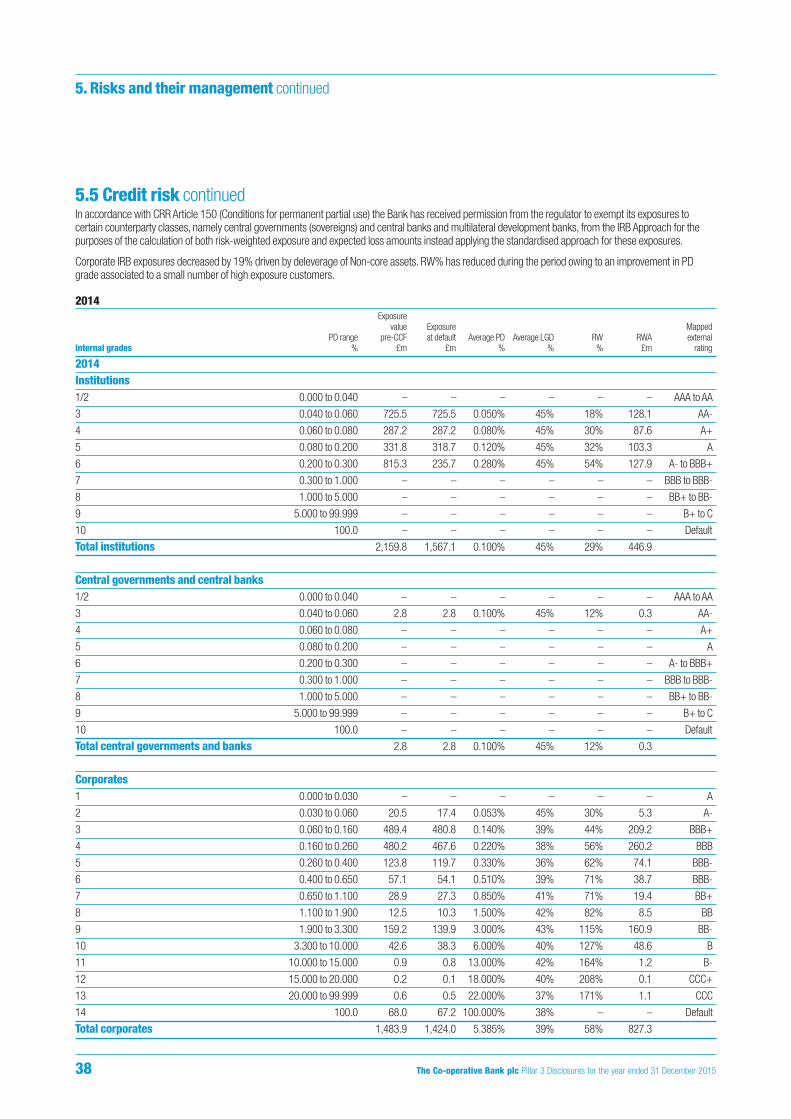
5.5 Credit risk continuedIn accordance with CRR Article 150 (Conditions for permanent partial use) the Bank has received permission from the regulator to exempt its exposures tocertain counterparty classes, namely central governments (sovereigns) and central banks and multilateral development banks, from the IRB Approach for thepurposes of the calculation of both risk-weighted exposure and expected loss amounts instead applying the standardised approach for these exposures.
Corporate IRB exposures decreased by 19% driven by deleverage of Non-core assets. RW% has reduced during the period owing to an improvement in PDgrade associated to a small number of high exposure customers.
2014Exposure
value Exposure MappedPD range pre-CCF at default Average PD Average LGD RW RWA external
Internal grades % £m £m % % % £m rating
2014Institutions1/2 0.000 to 0.040 – – – – – – AAA to AA
3 0.040 to 0.060 725.5 725.5 0.050% 45% 18% 128.1 AA-
4 0.060 to 0.080 287.2 287.2 0.080% 45% 30% 87.6 A+
5 0.080 to 0.200 331.8 318.7 0.120% 45% 32% 103.3 A
6 0.200 to 0.300 815.3 235.7 0.280% 45% 54% 127.9 A- to BBB+
7 0.300 to 1.000 – – – – – – BBB to BBB-
8 1.000 to 5.000 – – – – – – BB+ to BB-
9 5.000 to 99.999 – – – – – – B+ to C
10 100.0 – – – – – – Default
Total institutions 2,159.8 1,567.1 0.100% 45% 29% 446.9
Central governments and central banks1/2 0.000 to 0.040 – – – – – – AAA to AA
3 0.040 to 0.060 2.8 2.8 0.100% 45% 12% 0.3 AA-
4 0.060 to 0.080 – – – – – – A+
5 0.080 to 0.200 – – – – – – A
6 0.200 to 0.300 – – – – – – A- to BBB+
7 0.300 to 1.000 – – – – – – BBB to BBB-
8 1.000 to 5.000 – – – – – – BB+ to BB-
9 5.000 to 99.999 – – – – – – B+ to C
10 100.0 – – – – – – Default
Total central governments and banks 2.8 2.8 0.100% 45% 12% 0.3
Corporates1 0.000 to 0.030 – – – – – – A
2 0.030 to 0.060 20.5 17.4 0.053% 45% 30% 5.3 A-
3 0.060 to 0.160 489.4 480.8 0.140% 39% 44% 209.2 BBB+
4 0.160 to 0.260 480.2 467.6 0.220% 38% 56% 260.2 BBB
5 0.260 to 0.400 123.8 119.7 0.330% 36% 62% 74.1 BBB-
6 0.400 to 0.650 57.1 54.1 0.510% 39% 71% 38.7 BBB-
7 0.650 to 1.100 28.9 27.3 0.850% 41% 71% 19.4 BB+
8 1.100 to 1.900 12.5 10.3 1.500% 42% 82% 8.5 BB
9 1.900 to 3.300 159.2 139.9 3.000% 43% 115% 160.9 BB-
10 3.300 to 10.000 42.6 38.3 6.000% 40% 127% 48.6 B
11 10.000 to 15.000 0.9 0.8 13.000% 42% 164% 1.2 B-
12 15.000 to 20.000 0.2 0.1 18.000% 40% 208% 0.1 CCC+
13 20.000 to 99.999 0.6 0.5 22.000% 37% 171% 1.1 CCC
14 100.0 68.0 67.2 100.000% 38% – – Default
Total corporates 1,483.9 1,424.0 5.385% 39% 58% 827.3
38 The Co-operative Bank plc Pillar 3 Disclosures for the year ended 31 December 2015
5. Risks and their management continued
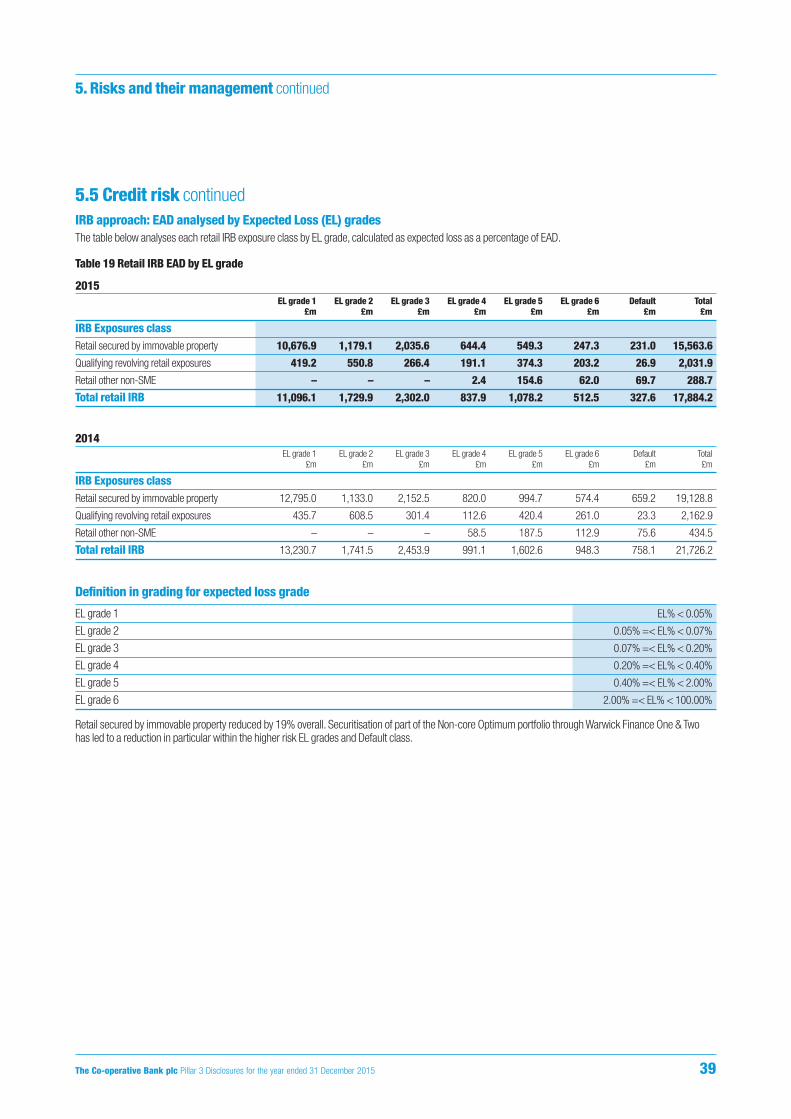
5.5 Credit risk continuedIRB approach: EAD analysed by Expected Loss (EL) gradesThe table below analyses each retail IRB exposure class by EL grade, calculated as expected loss as a percentage of EAD.
Table 19 Retail IRB EAD by EL grade
2015EL grade 1 EL grade 2 EL grade 3 EL grade 4 EL grade 5 EL grade 6 Default Total
£m £m £m £m £m £m £m £m
IRB Exposures classRetail secured by immovable property 10,676.9 1,179.1 2,035.6 644.4 549.3 247.3 231.0 15,563.6
Qualifying revolving retail exposures 419.2 550.8 266.4 191.1 374.3 203.2 26.9 2,031.9
Retail other non-SME – – – 2.4 154.6 62.0 69.7 288.7
Total retail IRB 11,096.1 1,729.9 2,302.0 837.9 1,078.2 512.5 327.6 17,884.2
2014EL grade 1 EL grade 2 EL grade 3 EL grade 4 EL grade 5 EL grade 6 Default Total
£m £m £m £m £m £m £m £m
IRB Exposures classRetail secured by immovable property 12,795.0 1,133.0 2,152.5 820.0 994.7 574.4 659.2 19,128.8
Qualifying revolving retail exposures 435.7 608.5 301.4 112.6 420.4 261.0 23.3 2,162.9
Retail other non-SME – – – 58.5 187.5 112.9 75.6 434.5
Total retail IRB 13,230.7 1,741.5 2,453.9 991.1 1,602.6 948.3 758.1 21,726.2
Definition in grading for expected loss grade
EL grade 1 EL% < 0.05%
EL grade 2 0.05% =< EL% < 0.07%
EL grade 3 0.07% =< EL% < 0.20%
EL grade 4 0.20% =< EL% < 0.40%
EL grade 5 0.40% =< EL% < 2.00%
EL grade 6 2.00% =< EL% < 100.00%
Retail secured by immovable property reduced by 19% overall. Securitisation of part of the Non-core Optimum portfolio through Warwick Finance One & Twohas led to a reduction in particular within the higher risk EL grades and Default class.
The Co-operative Bank plc Pillar 3 Disclosures for the year ended 31 December 2015 39
5. Risks and their management continued
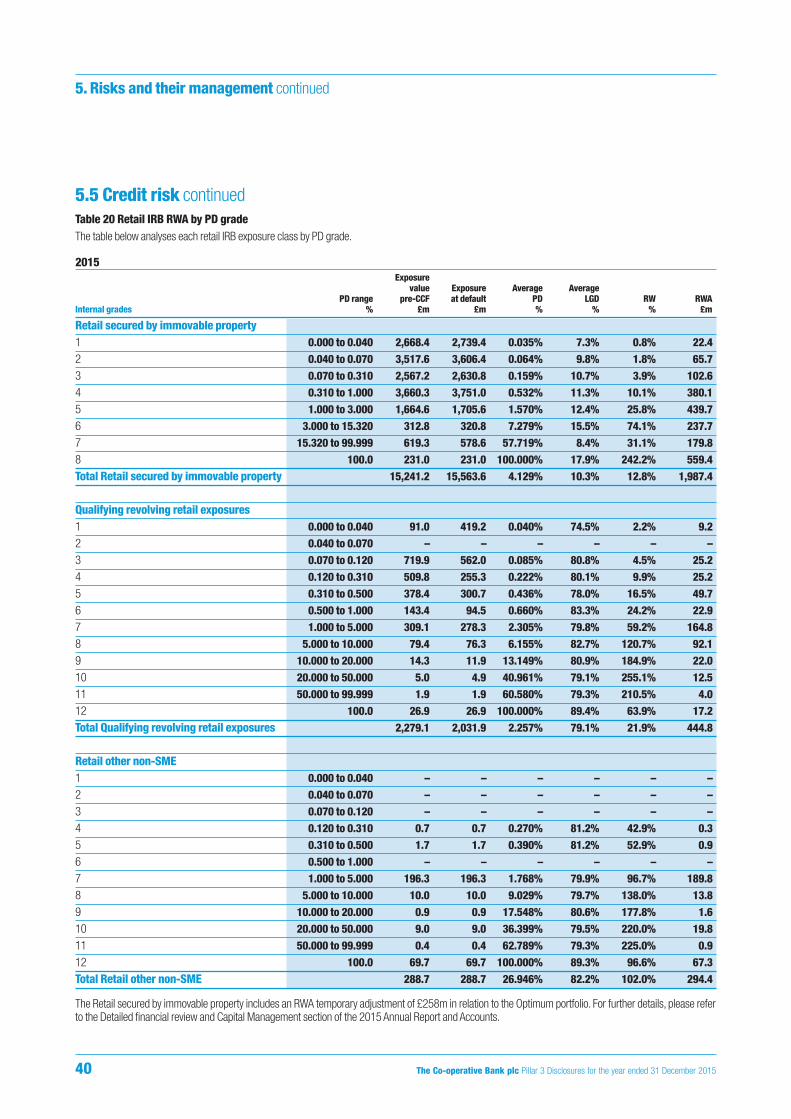
5.5 Credit risk continuedTable 20 Retail IRB RWA by PD grade The table below analyses each retail IRB exposure class by PD grade.
2015Exposure
value Exposure Average AveragePD range pre-CCF at default PD LGD RW RWA
Internal grades % £m £m % % % £m
Retail secured by immovable property1 0.000 to 0.040 2,668.4 2,739.4 0.035% 7.3% 0.8% 22.4 2 0.040 to 0.070 3,517.6 3,606.4 0.064% 9.8% 1.8% 65.7 3 0.070 to 0.310 2,567.2 2,630.8 0.159% 10.7% 3.9% 102.6 4 0.310 to 1.000 3,660.3 3,751.0 0.532% 11.3% 10.1% 380.1 5 1.000 to 3.000 1,664.6 1,705.6 1.570% 12.4% 25.8% 439.7 6 3.000 to 15.320 312.8 320.8 7.279% 15.5% 74.1% 237.7 7 15.320 to 99.999 619.3 578.6 57.719% 8.4% 31.1% 179.8 8 100.0 231.0 231.0 100.000% 17.9% 242.2% 559.4 Total Retail secured by immovable property 15,241.2 15,563.6 4.129% 10.3% 12.8% 1,987.4
Qualifying revolving retail exposures1 0.000 to 0.040 91.0 419.2 0.040% 74.5% 2.2% 9.2 2 0.040 to 0.070 – – – – – – 3 0.070 to 0.120 719.9 562.0 0.085% 80.8% 4.5% 25.2 4 0.120 to 0.310 509.8 255.3 0.222% 80.1% 9.9% 25.2 5 0.310 to 0.500 378.4 300.7 0.436% 78.0% 16.5% 49.7 6 0.500 to 1.000 143.4 94.5 0.660% 83.3% 24.2% 22.9 7 1.000 to 5.000 309.1 278.3 2.305% 79.8% 59.2% 164.8 8 5.000 to 10.000 79.4 76.3 6.155% 82.7% 120.7% 92.1 9 10.000 to 20.000 14.3 11.9 13.149% 80.9% 184.9% 22.0 10 20.000 to 50.000 5.0 4.9 40.961% 79.1% 255.1% 12.5 11 50.000 to 99.999 1.9 1.9 60.580% 79.3% 210.5% 4.0 12 100.0 26.9 26.9 100.000% 89.4% 63.9% 17.2 Total Qualifying revolving retail exposures 2,279.1 2,031.9 2.257% 79.1% 21.9% 444.8
Retail other non-SME1 0.000 to 0.040 – – – – – – 2 0.040 to 0.070 – – – – – – 3 0.070 to 0.120 – – – – – – 4 0.120 to 0.310 0.7 0.7 0.270% 81.2% 42.9% 0.3 5 0.310 to 0.500 1.7 1.7 0.390% 81.2% 52.9% 0.9 6 0.500 to 1.000 – – – – – – 7 1.000 to 5.000 196.3 196.3 1.768% 79.9% 96.7% 189.8 8 5.000 to 10.000 10.0 10.0 9.029% 79.7% 138.0% 13.8 9 10.000 to 20.000 0.9 0.9 17.548% 80.6% 177.8% 1.6 10 20.000 to 50.000 9.0 9.0 36.399% 79.5% 220.0% 19.8 11 50.000 to 99.999 0.4 0.4 62.789% 79.3% 225.0% 0.9 12 100.0 69.7 69.7 100.000% 89.3% 96.6% 67.3 Total Retail other non-SME 288.7 288.7 26.946% 82.2% 102.0% 294.4
The Retail secured by immovable property includes an RWA temporary adjustment of £258m in relation to the Optimum portfolio. For further details, please referto the Detailed financial review and Capital Management section of the 2015 Annual Report and Accounts.
40 The Co-operative Bank plc Pillar 3 Disclosures for the year ended 31 December 2015
5. Risks and their management continued
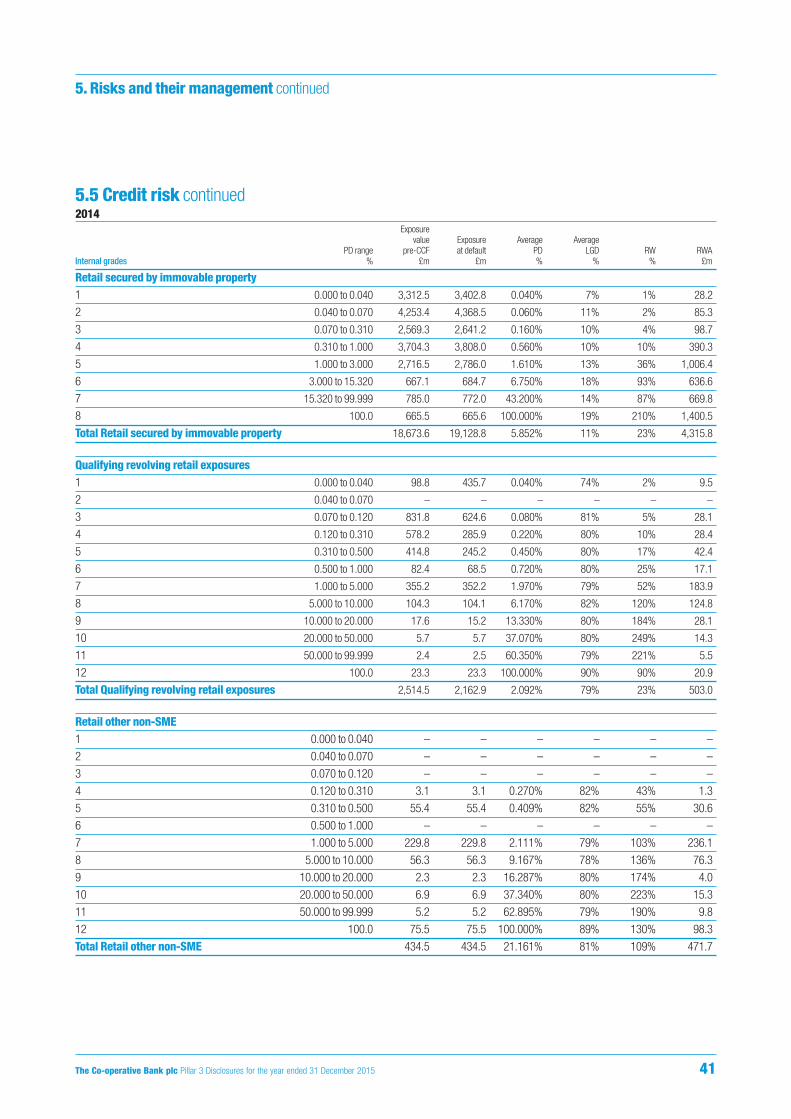
5.5 Credit risk continued2014
Exposurevalue Exposure Average Average
PD range pre-CCF at default PD LGD RW RWAInternal grades % £m £m % % % £m
Retail secured by immovable property1 0.000 to 0.040 3,312.5 3,402.8 0.040% 7% 1% 28.2
2 0.040 to 0.070 4,253.4 4,368.5 0.060% 11% 2% 85.3
3 0.070 to 0.310 2,569.3 2,641.2 0.160% 10% 4% 98.7
4 0.310 to 1.000 3,704.3 3,808.0 0.560% 10% 10% 390.3
5 1.000 to 3.000 2,716.5 2,786.0 1.610% 13% 36% 1,006.4
6 3.000 to 15.320 667.1 684.7 6.750% 18% 93% 636.6
7 15.320 to 99.999 785.0 772.0 43.200% 14% 87% 669.8
8 100.0 665.5 665.6 100.000% 19% 210% 1,400.5
Total Retail secured by immovable property 18,673.6 19,128.8 5.852% 11% 23% 4,315.8
Qualifying revolving retail exposures1 0.000 to 0.040 98.8 435.7 0.040% 74% 2% 9.5
2 0.040 to 0.070 – – – – – –
3 0.070 to 0.120 831.8 624.6 0.080% 81% 5% 28.1
4 0.120 to 0.310 578.2 285.9 0.220% 80% 10% 28.4
5 0.310 to 0.500 414.8 245.2 0.450% 80% 17% 42.4
6 0.500 to 1.000 82.4 68.5 0.720% 80% 25% 17.1
7 1.000 to 5.000 355.2 352.2 1.970% 79% 52% 183.9
8 5.000 to 10.000 104.3 104.1 6.170% 82% 120% 124.8
9 10.000 to 20.000 17.6 15.2 13.330% 80% 184% 28.1
10 20.000 to 50.000 5.7 5.7 37.070% 80% 249% 14.3
11 50.000 to 99.999 2.4 2.5 60.350% 79% 221% 5.5
12 100.0 23.3 23.3 100.000% 90% 90% 20.9
Total Qualifying revolving retail exposures 2,514.5 2,162.9 2.092% 79% 23% 503.0
Retail other non-SME1 0.000 to 0.040 – – – – – –
2 0.040 to 0.070 – – – – – –
3 0.070 to 0.120 – – – – – –
4 0.120 to 0.310 3.1 3.1 0.270% 82% 43% 1.3
5 0.310 to 0.500 55.4 55.4 0.409% 82% 55% 30.6
6 0.500 to 1.000 – – – – – –
7 1.000 to 5.000 229.8 229.8 2.111% 79% 103% 236.1
8 5.000 to 10.000 56.3 56.3 9.167% 78% 136% 76.3
9 10.000 to 20.000 2.3 2.3 16.287% 80% 174% 4.0
10 20.000 to 50.000 6.9 6.9 37.340% 80% 223% 15.3
11 50.000 to 99.999 5.2 5.2 62.895% 79% 190% 9.8
12 100.0 75.5 75.5 100.000% 89% 130% 98.3
Total Retail other non-SME 434.5 434.5 21.161% 81% 109% 471.7
The Co-operative Bank plc Pillar 3 Disclosures for the year ended 31 December 2015 41
5. Risks and their management continued
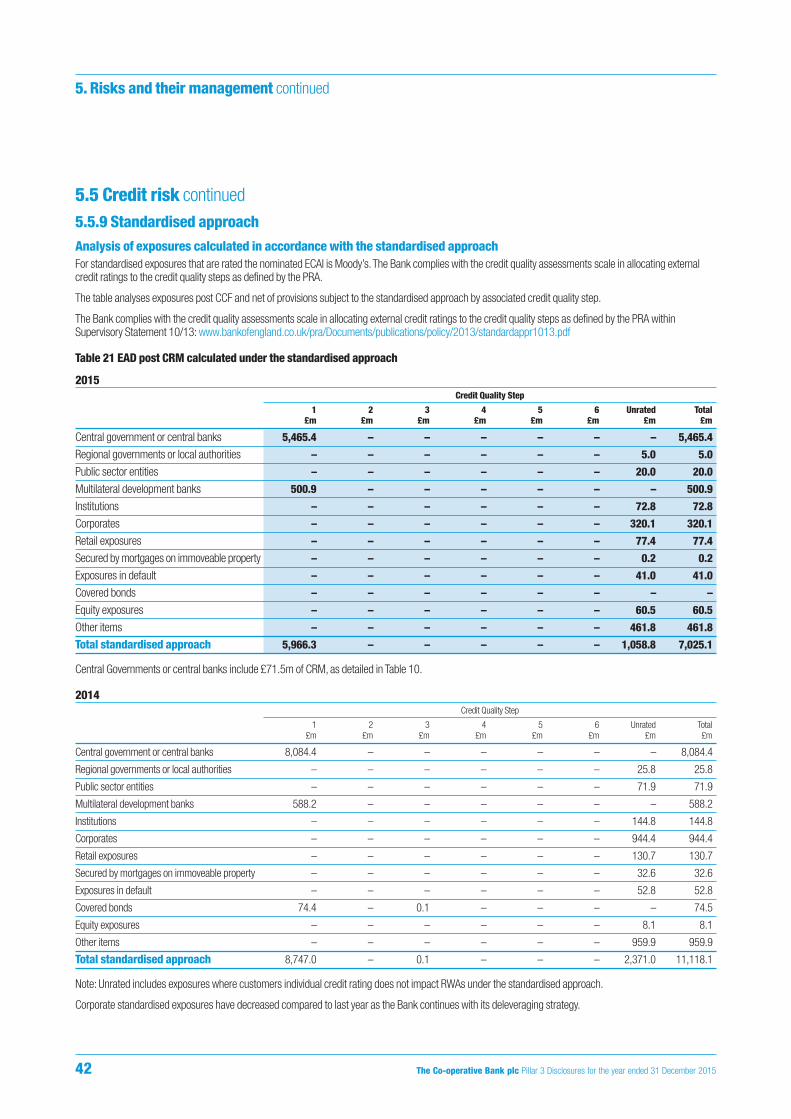
5.5 Credit risk continued5.5.9 Standardised approach Analysis of exposures calculated in accordance with the standardised approachFor standardised exposures that are rated the nominated ECAI is Moody’s. The Bank complies with the credit quality assessments scale in allocating externalcredit ratings to the credit quality steps as defined by the PRA.
The table analyses exposures post CCF and net of provisions subject to the standardised approach by associated credit quality step.
The Bank complies with the credit quality assessments scale in allocating external credit ratings to the credit quality steps as defined by the PRA withinSupervisory Statement 10/13: www.bankofengland.co.uk/pra/Documents/publications/policy/2013/standardappr1013.pdf
Table 21 EAD post CRM calculated under the standardised approach
2015Credit Quality Step
1 2 3 4 5 6 Unrated Total£m £m £m £m £m £m £m £m
Central government or central banks 5,465.4 – – – – – – 5,465.4
Regional governments or local authorities – – – – – – 5.0 5.0
Public sector entities – – – – – – 20.0 20.0
Multilateral development banks 500.9 – – – – – – 500.9
Institutions – – – – – – 72.8 72.8
Corporates – – – – – – 320.1 320.1
Retail exposures – – – – – – 77.4 77.4
Secured by mortgages on immoveable property – – – – – – 0.2 0.2
Exposures in default – – – – – – 41.0 41.0
Covered bonds – – – – – – – –
Equity exposures – – – – – – 60.5 60.5
Other items – – – – – – 461.8 461.8
Total standardised approach 5,966.3 – – – – – 1,058.8 7,025.1
Central Governments or central banks include £71.5m of CRM, as detailed in Table 10.
2014Credit Quality Step
1 2 3 4 5 6 Unrated Total£m £m £m £m £m £m £m £m
Central government or central banks 8,084.4 – – – – – – 8,084.4
Regional governments or local authorities – – – – – – 25.8 25.8
Public sector entities – – – – – – 71.9 71.9
Multilateral development banks 588.2 – – – – – – 588.2
Institutions – – – – – – 144.8 144.8
Corporates – – – – – – 944.4 944.4
Retail exposures – – – – – – 130.7 130.7
Secured by mortgages on immoveable property – – – – – – 32.6 32.6
Exposures in default – – – – – – 52.8 52.8
Covered bonds 74.4 – 0.1 – – – – 74.5
Equity exposures – – – – – – 8.1 8.1
Other items – – – – – – 959.9 959.9
Total standardised approach 8,747.0 – 0.1 – – – 2,371.0 11,118.1
Note: Unrated includes exposures where customers individual credit rating does not impact RWAs under the standardised approach.
Corporate standardised exposures have decreased compared to last year as the Bank continues with its deleveraging strategy.
42 The Co-operative Bank plc Pillar 3 Disclosures for the year ended 31 December 2015
5. Risks and their management continued

5.5 Credit risk continued5.5.10 Supervisory slotting approachThe Corporate sector includes a specialised lending portfolio, consisting of lending to PFIs and property investment and development. For the specialised lendingportfolio, the supervisory slotting approach is used. The table analyses EAD (including undrawn commitments post CCF) by slotting category.
Table 22 Specialised lending by slotting category 2015 2014
£m £m
Slotting categoryStrong 72.4 104.0
Good 1,063.8 1,844.8
Satisfactory 80.1 106.1
Weak 93.0 140.4
Default 186.9 872.1
Total 1,496.2 3,067.4
Slotting models are used to analyse and monitor specialised lending exposures to property which are assigned to PRA supervisory categories with predefinedrisk weights. The exposures have reduced since last year, reflective of the Bank’s Non-Core deleveraging strategy.
5.5.11 Credit risk mitigation5.5.11.1 Retail and Corporate
CollateralThe Bank uses various forms of collateral to mitigate credit risk. Collateral is regularly reviewed to ensure continued effectiveness as part of the credit reviewprocess. Property collateral for corporate lending is categorised as security for property development or investment customers (i.e. ‘property’ lending) or owneroccupied premises to secure mainstream loan and overdraft facilities. For general lending, in addition to taking charges over property assets owned by thecustomer, other security is taken in modest proportion to the total portfolio. This includes debentures, floating charges and guarantees (often supported bytangible security, where appropriate, including property, life policies and stocks & shares) and cash cover.
Where exposures are agreed on a secured basis, security cover is recognised only where:
• the security is legally enforceable and is of a tangible nature and type;
• an appropriate and reliable valuation is held; and
• a prudent margin is applied to the valuation, for the type of security involved.
Valuations are performed under Bank instruction by an approved panel of external valuers. When cases are placed into the Recoveries team and an LPA (Law ofProperty Act) Receiver is appointed then the valuation used will be an Expected Outcome Statement (EOS).
Property valuations are obtained when the facility is first approved and lending procedures typically require collateral to be revalued every two years or morefrequently in higher risk situations (typically annually or when a material change has occurred that is likely to affect the value and/or recoverability of the debt).For sectors such as Housing Associations, which have exhibited zero defaults historically, revaluations would be required every three years. In certaincircumstances, such as syndicates, the multi bank facility letter may preclude revaluations at the customer’s expense of all the assets as frequently as this and adecision is required by all banks involved to decide if they require the updates more frequently.
In addition, the values held in the Bank’s systems are indexed for risk assessment and capital calculation using appropriate regional and asset type indiceswhere available, otherwise the national average index is applied.
Single name concentration riskSingle name concentration risk is the concentration in exposures to single counterparties.
During 2015, the Bank has reduced its single name concentration risk:
• as at 31 December 2014, 14 customers existed on book with individual exposure greater than £50m. This totalled £1,005m (18% of total Corporateportfolio), of which £371m was categorised as default.
• as at 31 December 2015, only six customers were on book with individual exposure exceeding £50m, totalling £455m (15% of total Corporate portfolio). Allcustomers performing with five of the six assets categorised in the low risk Housing Association sector.
The Co-operative Bank plc Pillar 3 Disclosures for the year ended 31 December 2015 43
5. Risks and their management continued
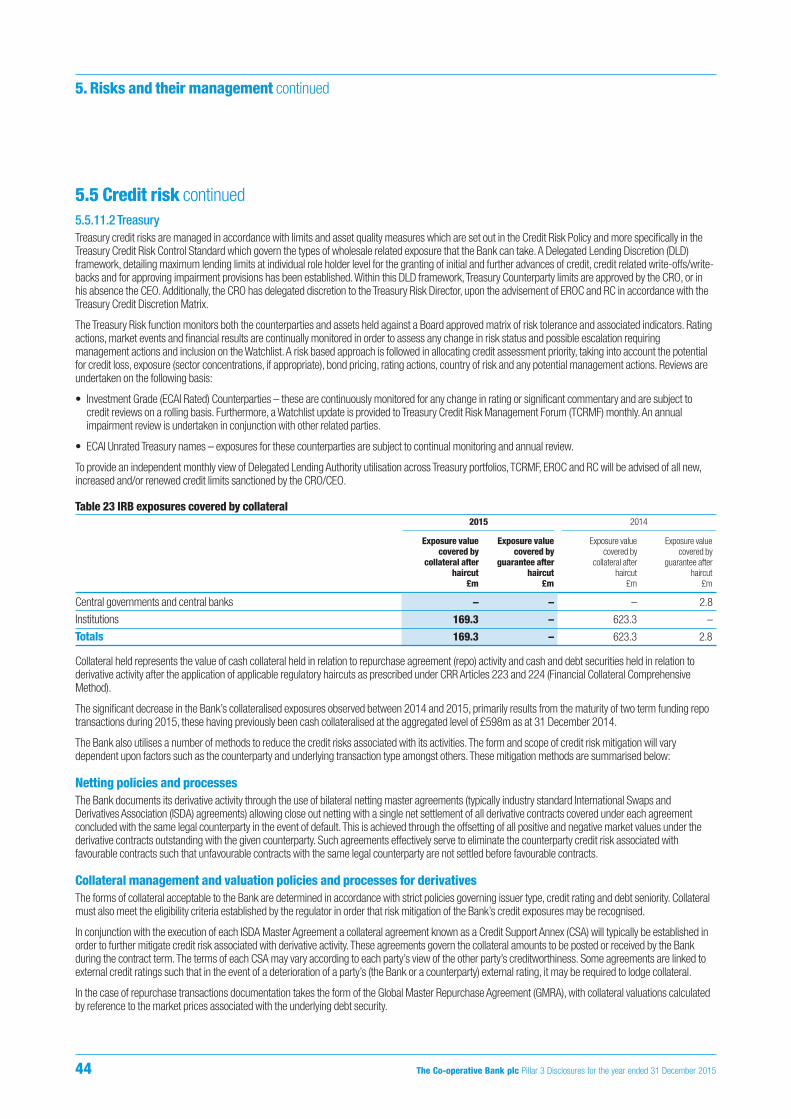
5.5 Credit risk continued5.5.11.2 TreasuryTreasury credit risks are managed in accordance with limits and asset quality measures which are set out in the Credit Risk Policy and more specifically in theTreasury Credit Risk Control Standard which govern the types of wholesale related exposure that the Bank can take. A Delegated Lending Discretion (DLD)framework, detailing maximum lending limits at individual role holder level for the granting of initial and further advances of credit, credit related write-offs/write-backs and for approving impairment provisions has been established. Within this DLD framework, Treasury Counterparty limits are approved by the CRO, or inhis absence the CEO. Additionally, the CRO has delegated discretion to the Treasury Risk Director, upon the advisement of EROC and RC in accordance with theTreasury Credit Discretion Matrix.
The Treasury Risk function monitors both the counterparties and assets held against a Board approved matrix of risk tolerance and associated indicators. Ratingactions, market events and financial results are continually monitored in order to assess any change in risk status and possible escalation requiringmanagement actions and inclusion on the Watchlist. A risk based approach is followed in allocating credit assessment priority, taking into account the potentialfor credit loss, exposure (sector concentrations, if appropriate), bond pricing, rating actions, country of risk and any potential management actions. Reviews areundertaken on the following basis:
• Investment Grade (ECAI Rated) Counterparties – these are continuously monitored for any change in rating or significant commentary and are subject tocredit reviews on a rolling basis. Furthermore, a Watchlist update is provided to Treasury Credit Risk Management Forum (TCRMF) monthly. An annualimpairment review is undertaken in conjunction with other related parties.
• ECAI Unrated Treasury names – exposures for these counterparties are subject to continual monitoring and annual review.
To provide an independent monthly view of Delegated Lending Authority utilisation across Treasury portfolios, TCRMF, EROC and RC will be advised of all new,increased and/or renewed credit limits sanctioned by the CRO/CEO.
Table 23 IRB exposures covered by collateral 2015 2014
————————————————— —————————————————Exposure value Exposure value Exposure value Exposure value
covered by covered by covered by covered by collateral after guarantee after collateral after guarantee after
haircut haircut haircut haircut£m £m £m £m
Central governments and central banks – – – 2.8
Institutions 169.3 – 623.3 –
Totals 169.3 – 623.3 2.8
Collateral held represents the value of cash collateral held in relation to repurchase agreement (repo) activity and cash and debt securities held in relation toderivative activity after the application of applicable regulatory haircuts as prescribed under CRR Articles 223 and 224 (Financial Collateral ComprehensiveMethod).
The significant decrease in the Bank’s collateralised exposures observed between 2014 and 2015, primarily results from the maturity of two term funding repotransactions during 2015, these having previously been cash collateralised at the aggregated level of £598m as at 31 December 2014.
The Bank also utilises a number of methods to reduce the credit risks associated with its activities. The form and scope of credit risk mitigation will varydependent upon factors such as the counterparty and underlying transaction type amongst others. These mitigation methods are summarised below:
Netting policies and processesThe Bank documents its derivative activity through the use of bilateral netting master agreements (typically industry standard International Swaps andDerivatives Association (ISDA) agreements) allowing close out netting with a single net settlement of all derivative contracts covered under each agreementconcluded with the same legal counterparty in the event of default. This is achieved through the offsetting of all positive and negative market values under thederivative contracts outstanding with the given counterparty. Such agreements effectively serve to eliminate the counterparty credit risk associated withfavourable contracts such that unfavourable contracts with the same legal counterparty are not settled before favourable contracts.
Collateral management and valuation policies and processes for derivativesThe forms of collateral acceptable to the Bank are determined in accordance with strict policies governing issuer type, credit rating and debt seniority. Collateralmust also meet the eligibility criteria established by the regulator in order that risk mitigation of the Bank’s credit exposures may be recognised.
In conjunction with the execution of each ISDA Master Agreement a collateral agreement known as a Credit Support Annex (CSA) will typically be established inorder to further mitigate credit risk associated with derivative activity. These agreements govern the collateral amounts to be posted or received by the Bankduring the contract term. The terms of each CSA may vary according to each party’s view of the other party’s creditworthiness. Some agreements are linked toexternal credit ratings such that in the event of a deterioration of a party’s (the Bank or a counterparty) external rating, it may be required to lodge collateral.
In the case of repurchase transactions documentation takes the form of the Global Master Repurchase Agreement (GMRA), with collateral valuations calculatedby reference to the market prices associated with the underlying debt security.
44 The Co-operative Bank plc Pillar 3 Disclosures for the year ended 31 December 2015
5. Risks and their management continued
5.5 Credit risk continuedTransactions subject to collateral agreements are marked-to-market periodically (usually daily) and the parameters defined in the collateral agreement areapplied in order to derive the rebalancing amount of collateral (usually cash) to be called from, or returned to, the transactional counterparty such that variationtolerances set out within the collateral agreement are adhered to.
The Bank only accepts cash and government bonds as collateral. To mitigate any market risk impact from holding fixed rate government bonds a daily mark-to-market is undertaken and additional collateral requested as appropriate.
The Bank’s collateralised exposures as at 31 December 2015 was £752.4m (31 December 2014: £847.5m). Collateral lodged with the Bank comprised ofcash held in connection with repurchase agreement activity of £671.3m (31 December 2014: £755.2m), cash held in connection with derivative activity of£9.6m (31 December 2014: £13.3m) and government debt securities held in connection with derivative activity of £71.5m (31 December 2014: £79.0m). Thecredit risk mitigation effect of all collateral held will reflect any reduction in value resulting from the application of prescribed regulatory haircuts.
GuaranteesGuarantees issued by national or regional governments have historically been available in relation to certain assets within Bank’s investment security portfolio,primarily debt securities issued by European special purpose banks operating in the public sector. These guarantees may serve to enhance the credit profile ofthe exposure and provide security in the event of issuer default. Such exposures will consequently qualify for the application of a lower risk weighting for thepurposes of calculating the associated regulatory capital requirement. As at 31 December 2015, total exposure benefiting from guarantees is nil (£32.8m as at31 December 2014).
Wrong Way riskThis type of risk occurs when exposure to counterparty is adversely correlated with the credit quality of that counterparty. The Bank ensures that the issuer ofcollateral is neither the same nor connected to the counterparty to a transaction.
5.5.12 Derivative credit exposure The Bank enters into a variety of derivative contracts primarily for the purposes of hedging its market risk exposures such as interest rate and foreign exchangerisks.
Counterparty Credit riskCounterparty credit risk in derivative transactions arises from the risk of counterparty default prior to the settlement date of derivative contracts with thecounterparty unable to fulfil present and future contractual payment obligations. The amount at risk may change over time as a function of the underlying marketparameters up to the positive value of the contract in favour of the Bank.
A key difference between derivatives and other asset types is that whereas the credit risk of other financial assets is generally represented by the principalamount net of any applicable allowance for credit losses, the counterparty credit risk associated with derivative instruments will ordinarily represent an amountsignificantly lower than the notional amount of the derivative instrument.
Except where such are settled via central counterparties, the counterparty credit risk associated with over-the-counter derivative instruments will usually begreater than with those traded through recognised exchanges given the more formal regulation and centralised management of the latter contracts.
Gross credit risk exposure is comprised of the estimated replacement cost, or positive fair value for all contracts plus an add-on for potential future exposure(PFE). The add-on amount is based upon the formula prescribed within Article 274 (Mark-to-Market Method) of the CRR.
The following tables summarise the gross credit exposure associated with the Bank’s derivative financial instruments and underlying Mark-to-Market (MtM) andPFE values.
The table below provides an overview of the aggregate notional amounts under the Bank’s outstanding derivative contracts by underlying product. The notionalamounts shown represent the reference amount to which a rate or price is applied in order to determine the cash flows to be exchanged during the life of theunderlying transactions and are not in themselves a measure of potential credit or market risk, rather they provide an illustration of transactional volumesoutstanding.
The Co-operative Bank plc Pillar 3 Disclosures for the year ended 31 December 2015 45
5. Risks and their management continued
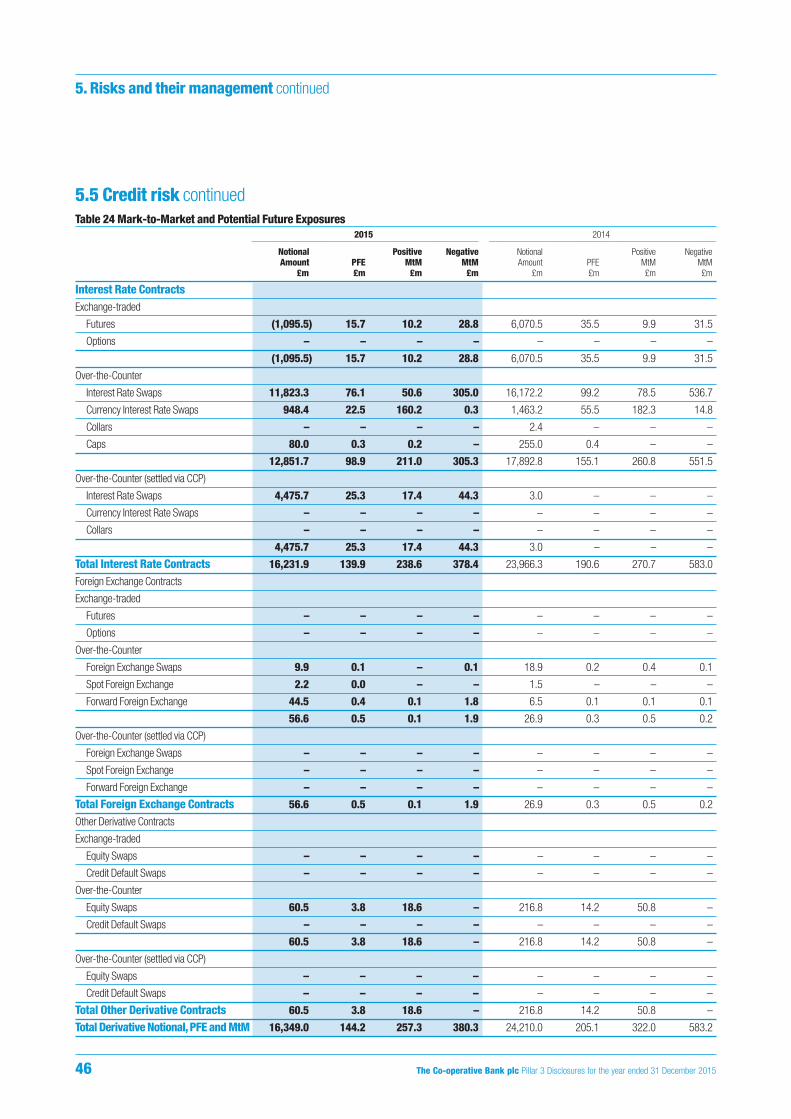
5.5 Credit risk continuedTable 24 Mark-to-Market and Potential Future Exposures
2015 2014————————————————————————— —————————————————————————
Notional Positive Negative Notional Positive NegativeAmount PFE MtM MtM Amount PFE MtM MtM
£m £m £m £m £m £m £m £m
Interest Rate ContractsExchange-traded
Futures (1,095.5) 15.7 10.2 28.8 6,070.5 35.5 9.9 31.5
Options – – – – – – – –
(1,095.5) 15.7 10.2 28.8 6,070.5 35.5 9.9 31.5
Over-the-Counter
Interest Rate Swaps 11,823.3 76.1 50.6 305.0 16,172.2 99.2 78.5 536.7
Currency Interest Rate Swaps 948.4 22.5 160.2 0.3 1,463.2 55.5 182.3 14.8
Collars – – – – 2.4 – – –
Caps 80.0 0.3 0.2 – 255.0 0.4 – –
12,851.7 98.9 211.0 305.3 17,892.8 155.1 260.8 551.5
Over-the-Counter (settled via CCP)
Interest Rate Swaps 4,475.7 25.3 17.4 44.3 3.0 – – –
Currency Interest Rate Swaps – – – – – – – –
Collars – – – – – – – –
4,475.7 25.3 17.4 44.3 3.0 – – –
Total Interest Rate Contracts 16,231.9 139.9 238.6 378.4 23,966.3 190.6 270.7 583.0
Foreign Exchange Contracts
Exchange-traded
Futures – – – – – – – –
Options – – – – – – – –
Over-the-Counter
Foreign Exchange Swaps 9.9 0.1 – 0.1 18.9 0.2 0.4 0.1
Spot Foreign Exchange 2.2 0.0 – – 1.5 – – –
Forward Foreign Exchange 44.5 0.4 0.1 1.8 6.5 0.1 0.1 0.1
56.6 0.5 0.1 1.9 26.9 0.3 0.5 0.2
Over-the-Counter (settled via CCP)
Foreign Exchange Swaps – – – – – – – –
Spot Foreign Exchange – – – – – – – –
Forward Foreign Exchange – – – – – – – –
Total Foreign Exchange Contracts 56.6 0.5 0.1 1.9 26.9 0.3 0.5 0.2
Other Derivative Contracts
Exchange-traded
Equity Swaps – – – – – – – –
Credit Default Swaps – – – – – – – –
Over-the-Counter
Equity Swaps 60.5 3.8 18.6 – 216.8 14.2 50.8 –
Credit Default Swaps – – – – – – – –
60.5 3.8 18.6 – 216.8 14.2 50.8 –
Over-the-Counter (settled via CCP)
Equity Swaps – – – – – – – –
Credit Default Swaps – – – – – – – –
Total Other Derivative Contracts 60.5 3.8 18.6 – 216.8 14.2 50.8 –
Total Derivative Notional, PFE and MtM 16,349.0 144.2 257.3 380.3 24,210.0 205.1 322.0 583.2
46 The Co-operative Bank plc Pillar 3 Disclosures for the year ended 31 December 2015
5. Risks and their management continued

5.5 Credit risk continuedThe notional amount on the exchange traded interest rate futures in the above table is negative as the overall position is short futures contracts. Reduction inOver-the-Counter (OTC) interest rate swaps and increase in OTC (settled via Central Clearing Counterparty (CCP)) interest rate futures reflects the maturing ofexisting derivative non CCP trades and the vast majority of new derivative trades through a CCP. Reduction in OTC equity swaps over 2015 reflects maturingequity swaps within the year and no new trades within the year.
Table 25 Derivative contracts Credit risk exposures2015 2014
————————————————— —————————————————Gross Credit Gross Credit
Notional Amount risk exposure(1) Notional Amount risk exposure(1)
£m £m £m £m
Interest Rate ContractsExchange-traded
Futures (1,095.5) 26.0 6,070.5 45.5
Options – – – –
(1,095.5) 26.0 6,070.5 45.5
Over-the-Counter
Interest Rate Swaps 11,823.3 126.7 16,172.2 177.6
Currency Interest Rate Swaps 948.4 117.2 1,463.2 237.9
Collars – – 2.4 –
Caps 80.0 0.5 255.0 0.4
12,851.7 244.4 17,892.8 415.9
Over-the-Counter (settled via CCP)
Interest Rate Swaps 4,475.7 42.7 3.0 –
Currency Interest Rate Swaps – – – –
Collars – – – –
4,475.7 42.7 3.0 –
Total Interest Rate Contracts 16,231.9 313.1 23,966.3 461.4
Foreign Exchange Contracts
Exchange-traded
Futures – – – –
Options – – – –
– – – –
Over-the-Counter
Foreign Exchange Swaps 9.9 0.1 18.9 0.6
Spot Foreign Exchange 2.2 – 1.5 –
Forward Foreign Exchange 44.5 0.6 6.5 0.1
56.6 0.7 26.9 0.7
Over-the-Counter (settled via CCP)
Foreign Exchange Swaps – –
Spot Foreign Exchange – – – –
Forward Foreign Exchange – – – –
Total Foreign Exchange Contracts 56.6 0.7 26.9 0.7
Other Derivative Contracts
Exchange-traded
Equity Swaps – – – –
Credit Default Swaps – – – –
– – – –
The Co-operative Bank plc Pillar 3 Disclosures for the year ended 31 December 2015 47
5. Risks and their management continued

5.5 Credit risk continued2015 2014
————————————————— —————————————————Gross Credit Gross Credit
Notional Amount risk exposure(1) Notional Amount risk exposure(1)
£m £m £m £m
Over-the-Counter
Equity Swaps 60.5 22.4 216.8 65.0
Credit Default Swaps – – – –
60.5 22.4 216.8 65.0
Over-the-Counter (settled via CCP)
Equity Swaps – – – –
Credit Default Swaps – – – –
– – – –
Total Other Derivative Contracts 60.5 22.4 216.8 65.0
Total Notional and Gross Credit Risk 16,349.0 336.2 24,210.0 527.1
Netting Benefit(2) (121.7) (148.4)
Credit Risk post Netting 214.5 378.7
Collateral Held(3) (9.6) (92.2)
Net Credit Risk Exposure 204.9 286.5
(1) Credit risk prior to the application of netting benefit and credit risk mitigation via collateral held.
(2) Netting benefit includes both Mark-to-Market and Potential Future Credit Exposure impacts.
(3) Collateral Held comprises cash and debt securities as valued post the application of regulatory haircuts.
The net credit risk exposure figure at the foot of the above table represents the Bank’s credit exposure through derivative transactions after recognition of legallyenforceable netting agreements and the application of eligible financial collateral held.
Table 26 Derivative Credit risk exposure maturityThe table below analyses OTC derivatives by maturity.
2015≥ 1 year to ≥ 5 years to ≥ 10 years to
< 1 year < 5 years < 10 years < 20 years ≥20 years Total£m £m £m £m £m £m
Interest Rate ContractsInterest Rate Swaps 3,801.5 8,606.5 3,194.9 389.5 306.6 16,299.0
Currency Interest Rate Swaps 622.6 325.8 – – – 948.4
Collars – – – – – –
Caps 50.8 13.5 5.1 10.6 – 80.0
Total Interest Rate Contracts 4,474.9 8,945.8 3,200.0 400.1 306.6 17,327.4
Foreign Exchange ContractsForeign Exchange Swaps 9.9 – – – – 9.9
Spot Foreign Exchange 2.2 – – – – 2.2
Forward Foreign Exchange 44.5 – – – – 44.5
Total Foreign Exchange Contracts 56.6 – – – – 56.6
Other Derivative ContractsEquity Swaps 51.1 9.4 – – – 60.5
Credit Default Swaps – – – – – 0.0
Total Other Derivative Contracts 51.1 9.4 – – – 60.5
Total Derivative Notional Amounts 4,582.6 8,955.2 3,200.0 400.1 306.6 17,444.5
48 The Co-operative Bank plc Pillar 3 Disclosures for the year ended 31 December 2015
5. Risks and their management continued

5.5 Credit risk continued2014
≥ 1 year to ≥ 5 years to ≥ 10 years to< 1 year < 5 years < 10 years < 20 years ≥20 years Total
£m £m £m £m £m £m
Interest Rate ContractsInterest Rate Swaps 4,455.9 7,664.6 3,106.9 560.4 387.4 16,175.2
Currency Interest Rate Swaps 440.3 1,022.9 – – – 1,463.2
Collars – 2.4 – – – 2.4
Caps 183.5 69.1 1.2 1.2 – 255.0
Total Interest Rate Contracts 5,079.7 8,759.0 3,108.1 561.6 387.4 17,895.8
Foreign Exchange ContractsForeign Exchange Swaps 18.9 – – – – 18.9
Spot Foreign Exchange 1.5 – – – – 1.5
Forward Foreign Exchange 6.5 – – – – 6.5
Total Foreign Exchange Contracts 26.9 – – – – 26.9
Other Derivative ContractsEquity Swaps 156.3 60.5 – – – 216.8
Credit Default Swaps – – – – – –
Total Other Derivative Contracts 156.3 60.5 – – – 216.8
Total Derivative Notional Amounts 5,262.9 8,819.5 3,108.1 561.6 387.4 18,139.5
Table 27 Counterparty Credit risk by sector2015 2014
————————————————— —————————————————Credit risk post % of Credit risk post % of
application of CRM portfolio application of CRM portfolio£m £m
SectorCredit Institutions 178.5 94.6 240.5 99.8
Other Financial Corporations – – 0.4 0.2
Sovereigns – – – –
Corporates – – – –
Central Counterparties 10.1 5.4 – –
Total 188.6 100.0 240.9 100.0
The counterparty credit risk to Central counterparties is exposure to the London Clearing House.
Table 28 Counterparty Credit risk by rating2015 2014
————————————————— —————————————————Credit risk post Credit risk post
application of CRM % of application of CRM % of£m portfolio £m portfolio
Credit RatingAAA – – – –
AA+ – – – –
AA – – – –
AA- 158.5 84.0 36.8 15.3
A+ 4.1 2.2 163.7 68.0
A 12.8 6.8 29.1 12.1
A- 0.2 0.1 0.6 0.2
BBB+ 2.9 1.5 10.7 4.4
Unrated 10.1 5.4 – –
Total 188.6 100.0 240.9 100.0
The Co-operative Bank plc Pillar 3 Disclosures for the year ended 31 December 2015 49
5. Risks and their management continued

5.5 Credit risk continuedAs at 31 December 2015, 86.2% of counterparty credit risk exposure post application of credit risk mitigation is to counterparties rated AA- and above.
The unrated exposure in the table above relates to the exposure to Central Counterparties as per Table 27.
Table 29 Counterparty Credit risk by country2015 2014
————————————————— —————————————————Credit risk post % of Credit risk post % of
application of CRM portfolio application of CRM portfolio£m £m
Country of IncorporationAustralia 0.5 0.3 0.8 0.3
Canada 0.4 0.2 0.4 0.2
Denmark 0.1 0.1 0.1 0.0
France 4.9 2.6 6.0 2.5
Germany 0.2 0.1 0.2 0.1
Switzerland – – 2.0 0.9
United Kingdom 56.7 30.1 69.9 29.0
USA 125.8 66.6 161.5 67.0
Total 188.6 100.0 240.9 100.0
Net counterparty credit risk exposure associated with OTC derivative transactions are concentrated primarily with counterparties incorporated in the USA and UKat 67% and 30% of total exposure respectively.
Table 30 Encumbered and non-encumbered assets by balance sheet category
2015Carrying amount Fair value of Carrying amount Fair value of
of encumbered encumbered of unencumbered unencumberedassets assets assets assets
£m £m £m £m
Equity instruments – – 55.6 55.6
Debt securities 1,791.5 1,791.5 3,102.7 3,102.7
Other assets 5,334.0 18,744.5
Assets of the reporting institution 7,125.5 21,902.8
Assets, collateral receivedand own debt securities
Matching liabilities, contingent issued other than coveredliabilities or securities lent bonds and ABSs encumbered
Carrying amount of selected financial liabilities 3,299.7 7,125.5
2014Carrying amount Fair value of Carrying amount Fair value of
of encumbered encumbered of unencumbered unencumberedassets assets assets assets
£m £m £m £m
Equity instruments – – 2.8 2.8
Debt securities 1,644.5 1,644.5 2,778.0 2,778.0
Other assets 8,118.7 25,038.9
Assets of the reporting institution 9,763.2 27,819.7
Assets, collateral receivedand own debt securities
Matching liabilities, contingent issued other than coveredliabilities or securities lent bonds and ABSs encumbered
Carrying amount of selected financial liabilities 3,931.7 9,763.2
50 The Co-operative Bank plc Pillar 3 Disclosures for the year ended 31 December 2015
5. Risks and their management continued
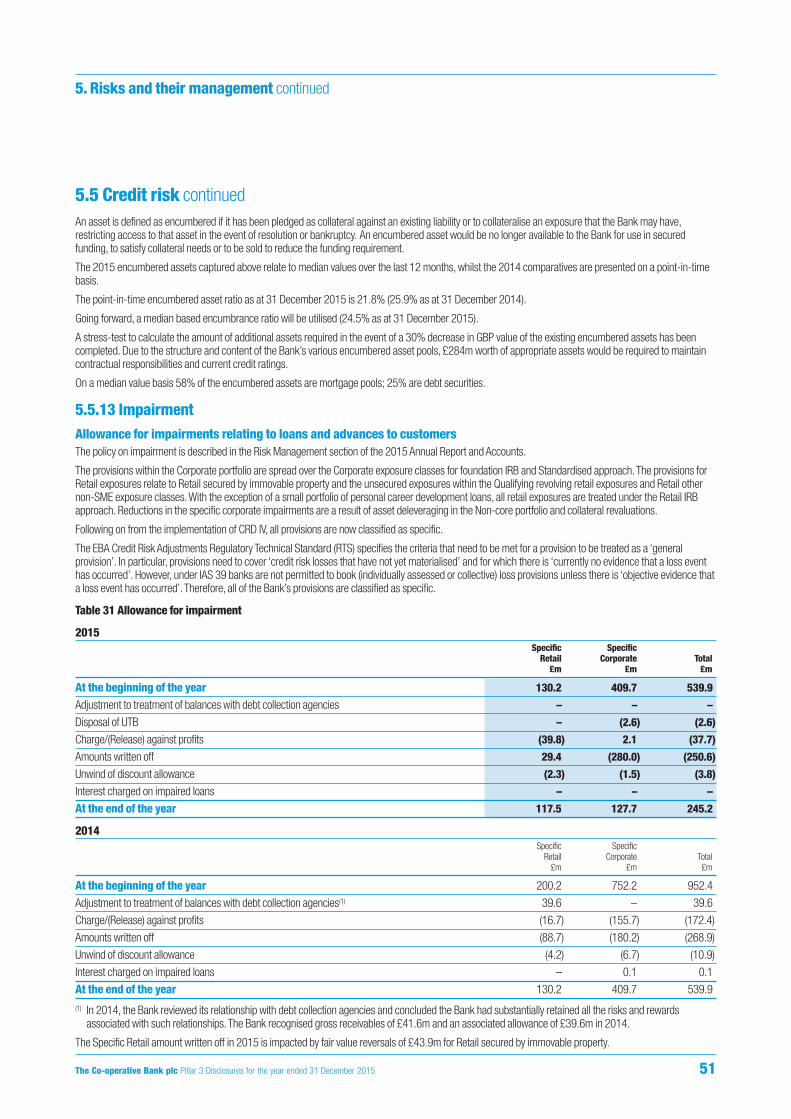
5.5 Credit risk continuedAn asset is defined as encumbered if it has been pledged as collateral against an existing liability or to collateralise an exposure that the Bank may have,restricting access to that asset in the event of resolution or bankruptcy. An encumbered asset would be no longer available to the Bank for use in securedfunding, to satisfy collateral needs or to be sold to reduce the funding requirement.
The 2015 encumbered assets captured above relate to median values over the last 12 months, whilst the 2014 comparatives are presented on a point-in-timebasis.
The point-in-time encumbered asset ratio as at 31 December 2015 is 21.8% (25.9% as at 31 December 2014).
Going forward, a median based encumbrance ratio will be utilised (24.5% as at 31 December 2015).
A stress-test to calculate the amount of additional assets required in the event of a 30% decrease in GBP value of the existing encumbered assets has beencompleted. Due to the structure and content of the Bank’s various encumbered asset pools, £284m worth of appropriate assets would be required to maintaincontractual responsibilities and current credit ratings.
On a median value basis 58% of the encumbered assets are mortgage pools; 25% are debt securities.
5.5.13 Impairment Allowance for impairments relating to loans and advances to customers The policy on impairment is described in the Risk Management section of the 2015 Annual Report and Accounts.
The provisions within the Corporate portfolio are spread over the Corporate exposure classes for foundation IRB and Standardised approach. The provisions forRetail exposures relate to Retail secured by immovable property and the unsecured exposures within the Qualifying revolving retail exposures and Retail othernon-SME exposure classes. With the exception of a small portfolio of personal career development loans, all retail exposures are treated under the Retail IRBapproach. Reductions in the specific corporate impairments are a result of asset deleveraging in the Non-core portfolio and collateral revaluations.
Following on from the implementation of CRD IV, all provisions are now classified as specific.
The EBA Credit Risk Adjustments Regulatory Technical Standard (RTS) specifies the criteria that need to be met for a provision to be treated as a ‘generalprovision’. In particular, provisions need to cover ‘credit risk losses that have not yet materialised’ and for which there is ‘currently no evidence that a loss eventhas occurred’. However, under IAS 39 banks are not permitted to book (individually assessed or collective) loss provisions unless there is ‘objective evidence thata loss event has occurred’. Therefore, all of the Bank’s provisions are classified as specific.
Table 31 Allowance for impairment
2015Specific Specific
Retail Corporate Total£m £m £m
At the beginning of the year 130.2 409.7 539.9
Adjustment to treatment of balances with debt collection agencies – – –
Disposal of UTB – (2.6) (2.6)
Charge/(Release) against profits (39.8) 2.1 (37.7)
Amounts written off 29.4 (280.0) (250.6)
Unwind of discount allowance (2.3) (1.5) (3.8)
Interest charged on impaired loans – – –
At the end of the year 117.5 127.7 245.2
2014Specific Specific
Retail Corporate Total£m £m £m
At the beginning of the year 200.2 752.2 952.4
Adjustment to treatment of balances with debt collection agencies(1) 39.6 – 39.6
Charge/(Release) against profits (16.7) (155.7) (172.4)
Amounts written off (88.7) (180.2) (268.9)
Unwind of discount allowance (4.2) (6.7) (10.9)
Interest charged on impaired loans – 0.1 0.1
At the end of the year 130.2 409.7 539.9
(1) In 2014, the Bank reviewed its relationship with debt collection agencies and concluded the Bank had substantially retained all the risks and rewardsassociated with such relationships. The Bank recognised gross receivables of £41.6m and an associated allowance of £39.6m in 2014.
The Specific Retail amount written off in 2015 is impacted by fair value reversals of £43.9m for Retail secured by immovable property.
The Co-operative Bank plc Pillar 3 Disclosures for the year ended 31 December 2015 51
5. Risks and their management continued
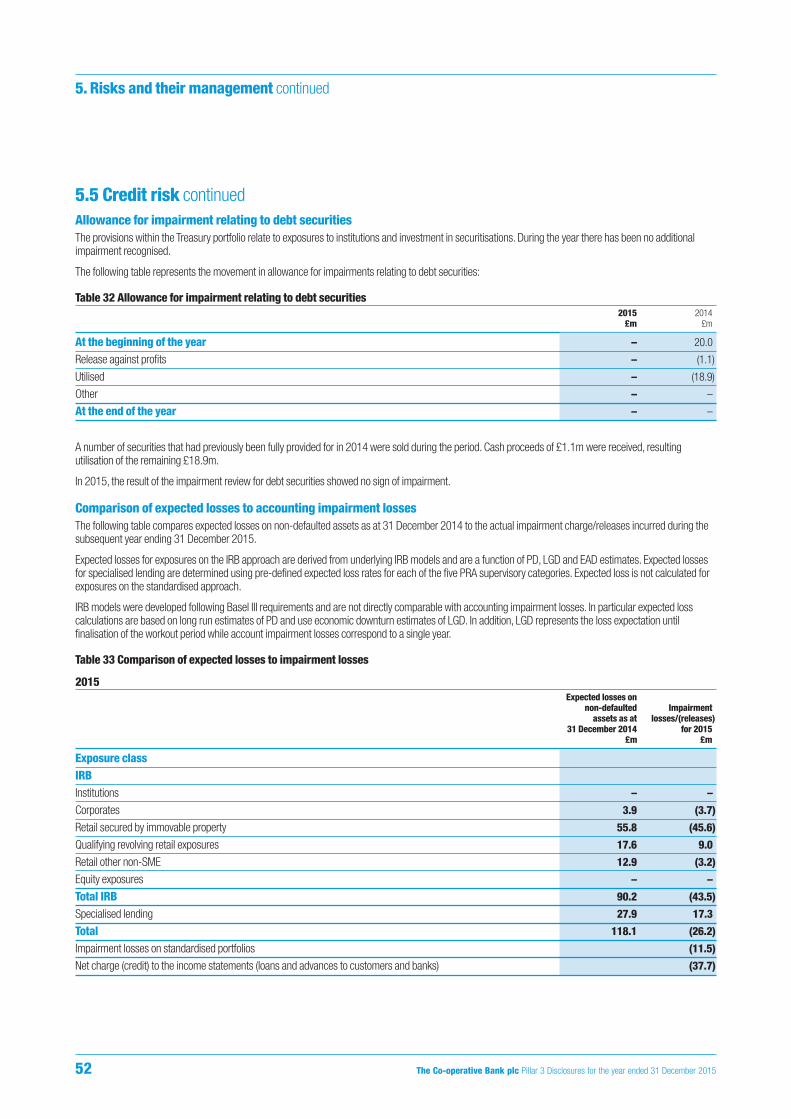
5.5 Credit risk continuedAllowance for impairment relating to debt securities The provisions within the Treasury portfolio relate to exposures to institutions and investment in securitisations. During the year there has been no additionalimpairment recognised.
The following table represents the movement in allowance for impairments relating to debt securities:
Table 32 Allowance for impairment relating to debt securities 2015 2014
£m £m
At the beginning of the year – 20.0
Release against profits – (1.1)
Utilised – (18.9)
Other – –
At the end of the year – –
A number of securities that had previously been fully provided for in 2014 were sold during the period. Cash proceeds of £1.1m were received, resultingutilisation of the remaining £18.9m.
In 2015, the result of the impairment review for debt securities showed no sign of impairment.
Comparison of expected losses to accounting impairment losses The following table compares expected losses on non-defaulted assets as at 31 December 2014 to the actual impairment charge/releases incurred during thesubsequent year ending 31 December 2015.
Expected losses for exposures on the IRB approach are derived from underlying IRB models and are a function of PD, LGD and EAD estimates. Expected lossesfor specialised lending are determined using pre-defined expected loss rates for each of the five PRA supervisory categories. Expected loss is not calculated forexposures on the standardised approach.
IRB models were developed following Basel III requirements and are not directly comparable with accounting impairment losses. In particular expected losscalculations are based on long run estimates of PD and use economic downturn estimates of LGD. In addition, LGD represents the loss expectation untilfinalisation of the workout period while account impairment losses correspond to a single year.
Table 33 Comparison of expected losses to impairment losses
2015Expected losses on
non-defaulted Impairmentassets as at losses/(releases)
31 December 2014 for 2015£m £m
Exposure classIRBInstitutions – –
Corporates 3.9 (3.7)
Retail secured by immovable property 55.8 (45.6)
Qualifying revolving retail exposures 17.6 9.0
Retail other non-SME 12.9 (3.2)
Equity exposures – –
Total IRB 90.2 (43.5)
Specialised lending 27.9 17.3
Total 118.1 (26.2)
Impairment losses on standardised portfolios (11.5)
Net charge (credit) to the income statements (loans and advances to customers and banks) (37.7)
52 The Co-operative Bank plc Pillar 3 Disclosures for the year ended 31 December 2015
5. Risks and their management continued

5.5 Credit risk continued2014
Expected losses onnon-defaulted Impairment
assets as at losses/(releases)31 December 2013 for 2014
£m £m
Exposure classIRBInstitutions 1.1 –
Corporates 10.1 (13.6)
Retail secured by immovable property 91.6 (17.2)
Qualifying revolving retail exposures 22.7 (4.9)
Retail other non-SME 18.8 5.3
Equity exposures – –
Total IRB 144.3 (30.4)
Specialised lending 66.2 (117.4)
Total 210.5 (147.8)
Impairment losses on standardised portfolios (24.6)
Net charge (credit) to the income statements (loans and advances to customers and banks) (172.4)
An impairment charge of £17.3m is reported for Specialised lending compared to a release of £117.4m in 2014, which was driven largely by the workoutapproach relating to a number of large Commercial Real Estate customers.
The impairment release of £45.6m reported in 2015 for Retail secured by immovable property was largely driven by the securitisation of Warwick Finance One& Two.
Qualifying revolving retail exposures charge of £9.0m in 2015 was primarily driven by credit card write-offs (£4.3m) and provision movements relating to bothcredit cards and overdrafts (£3.3m). A release of £4.9m was reported in 2014 due to debt sale.
A release of £3.2m is reported for Retail other non-SME exposures. This is largely driven by the significant reduction in loan balance resulting in a provisionrelease of £8.2m, offset by £4.0m of write offs.
5.5.14 SecuritisationsSecuritisations can take the form of traditional or synthetic. Traditional Securitisation is the process by which a group of assets, usually mortgage loans, areaggregated into a pool and the beneficial ownership is sold to bankruptcy remote Special Purpose Entities (SPEs). The pool of mortgage loans is used to back theissuance of new securities, allowing the credit rating of the securities to be separated from the credit rating of the sponsor company. In a Synthetic securitisationthe Bank retains beneficial ownership of the underlying assets and transfers some or all of the credit risk to a SPE through a credit derivative. The underlyingreferenced asset portfolio will be divided into different credit tranches and the Bank may only transfer the credit risk of some tranches and may retain the creditrisk of others.
The Bank acts as an investor, originator, sponsor, cash manager, servicer/administrator, subordinated loan provider and the liquidity facility provider inSecuritisation Transactions.
Investments in securitisations All of the Bank’s Securitisation exposures are to UK residential mortgages and primarily reflects the retained elements of securitisations of mortgages eitheroriginated or acquired by the Bank. Out of the current total exposure of £3.0bn (£1.5bn in 2014), £1.4bn reflects the synthetic securitisation exposure from theCalico Finance Number One Limited (Calico) transaction referred to below. The increase from 2014 relates to retained holdings of Residential Mortgage BackedSecurities (RMBS) issued by the Warwick Finance One & Two SPEs detailed below.
The Bank does not run an active trading book in RMBS. However these assets may be sold or used as collateral for short term borrowing (repos) in response toneeds for liquidity or changes in interest rates. Given that the Bank does not seek to actively transact in this type of asset each purchase is individually agreed byALCO and a maximum notional limit set.
RMBS positions held by the Bank may give rise to Credit risk and Market risk. Credit risk is the risk that the SPE’s will fail to meet interest and principal paymentobligations as and when they fall due. SPEs will service the securities using the cash flows generated by underlying mortgages. Given the majority of the Bank’ssecuritisation investments are in senior, highly rated securitisation positions, this risk is largely mitigated. Market risk is the risk of losses the Bank may suffer dueto fluctuations in credit spreads, interest rates, foreign currency rates and any other market implied volatility.
The Co-operative Bank plc Pillar 3 Disclosures for the year ended 31 December 2015 53
5. Risks and their management continued

5.5 Credit risk continuedThe Treasury Risk function acts as a second line of defence in monitoring changes in the credit and market risk profile of the Bank’s RMBS exposure, withexternal market analysis being supplemented by discussions with the portfolio manager (Treasury – first line of defence). Monthly updates are provided to seniormanagement detailing both changes in the valuations of the bonds and the performance of the underlying assets including delinquency rates, cumulativelosses, Constant Prepayment Rates (CPR) and Loan To Value (LTVs). RMBSs are assessed using the ratings based approach, under foundation IRB, where riskweight percentages are applied to each deal depending on the external rating, seniority and granularity of the instrument. Notwithstanding the risk bandingallocation, all transactions where no value adjustment is held continue to meet their payment obligations. There were no securitised revolving exposures heldduring the reporting period.
Capital requirements for all of the Bank’s exposures to securitisations are calculated using the external ratings based method. The following table shows theexposure at default and capital requirement broken down by external ratings grade. Capital requirement is shown gross of any provision offsets.
The Bank does not have any exposures to re-securitisations and does not hedge any securitisation position.
Table 34 Securitisation exposure by rating grade
2015Senior and granular Non senior and granular Non senior and non granular
——————————————— ——————————————— ———————————————Credit Capital Capital Capital
quality Exposure Requirement Exposure Requirement Exposure Requirementstep £m £m £m £m £m £m
AAA or A1/P1 1 2,587.2 15.4 17.9 0.2 – –
AA 2 7.0 – 156.5 2.0 – –
A+ 3 – – – – – –
A or A2/P2 4 – – 142.2 2.4 – –
A- 5 – – – – – –
BBB+ 6 – – – – – –
BBB 7 – – 71.6 4.6 – –
BBB- 8 – – 22.4 1.9 – –
BB+ 9 – – – – – –
BB 10 – – – – – –
BB- 11 – – – – – –
Rated below BB- or A3/P3 12 – – 33.2 26.2 – –
Total 2,594.2 15.4 443.8 37.3 – –
2014Senior and granular Non senior and granular Non senior and non granular
——————————————— ——————————————— ———————————————Credit Capital Capital Capitalquality Exposure Requirement Exposure Requirement Exposure Requirement
step £m £m £m £m £m £m
AAA or A1/P1 1 1,094.9 6.5 17.9 0.2 – –
AA 2 7.0 – 156.6 2.0 – –
A+ 3 – – – – – –
A or A2/P2 4 – – 143.5 2.4 – –
A- 5 – – – – – –
BBB+ 6 – – – – – –
BBB 7 – – 71.6 4.6 – –
BBB- 8 – – 22.4 1.9 24.1 1.1
BB+ 9 – – – – – –
BB 10 – – – – 24.2 8.7
BB- 11 – – – – – –
Rated below BB- or A3/P3 12 – – 34.3 25.2 27.3 21.7
Total 1,101.9 6.5 446.3 36.3 75.6 31.5
Ratings are based upon the lower of Fitch and Moody’s assigned counterparty credit ratings and mapped on an equivalency basis.
54 The Co-operative Bank plc Pillar 3 Disclosures for the year ended 31 December 2015
5. Risks and their management continued

5.5 Credit risk continuedThe Bank risk weights securitisation positions within credit quality step 12 at 1,250% rather than deducting from capital. CRD IV allows either treatment.
Currently the Bank has no outstanding assets awaiting securitisation.
The increase in AAA exposure in 2015 compared to 2014 in senior and granular exposure is due to Warwick Finance One & Two retained holdings of anaggregate £1.5bn (as at 31 December 2015).
The decrease in Non senior and non granular exposure relates to the disposal of Non-core positions during the year.
There were no impaired/past due/losses on securitisation positions during 2015.
Originated securitisationsThe Bank has established traditional securitisation structures as part of its funding and Optimum (Non-core residential mortgages) deleveraging activities, usingresidential mortgage loans as the underlying asset pools.
Securitisation funding transactions (Leek Finance and Silk Road RMBS programmes) provide funding diversity for the Bank. However, the majority of the risksand rewards in respect of the underlying mortgage loan pools are retained by the Bank in its funding securitisation structures. For such structures where risksand rewards of the underlying mortgages are retained by the Bank, the corresponding SPEs are included as subsidiaries in the consolidated financialstatements, with the Bank continuing to recognise securitised assets as loans and advances to customers on the balance sheet, and income from thesecuritised assets being recognised as income.
The Bank has only acted as mortgage originator, sponsor, servicing and administration agent, cash manager, subordinated loan provider and liquidity facilityprovider in respect of its own traditional, funding securitisations. The Bank does not provide bridging loans nor does it act as underwriter or dealer in itssecuritisations. All transactions are approved at Board level and benefit from relevant accounting and legal advice to ensure compliance with regulatory andstatutory requirements.
Furthermore, the Bank does not provide implicit support for its securitisations, including Calico.
The table overleaf shows the initial funded amount and value, at the balance sheet date, of the first loss pieces and liquidity facilities in respect of fundingsecuritisations sold to third party investors, subject to the qualifications documented in the following paragraphs.
This table discloses ‘first loss pieces’ (general reserve fund) which represent subordinated loans advanced by the Bank (in respect of Leek Finance NumberSeventeen, Leek Finance Number Eighteen and Leek Finance Number Nineteen), or variable funding notes subscribed to by the Bank (in respect of Silk RoadFinance Number Three):
Table 35 Originated on balance sheet securitisation exposures Retained notes Initial funded 2015 2014
initial amount Value Valuepercentage £m £m £m
First Loss PieceLeek Finance Number Seventeen plc – 23.0 27.6 27.6
Leek Finance Number Eighteen plc – 23.0 26.9 26.9
Leek Finance Number Nineteen plc – 18.0 17.9 17.9
Silk Road Finance Number One plc 45% 116.0 – 116.0
Silk Road Finance Number Three plc – 19.0 19.0 19.0
Liquidity FacilitiesLeek Finance Number Eighteen plc – – 13.5 14.4
Leek Finance Number Nineteen plc – – 13.1 14.0
Total 199.0 118.0 235.8
The table below shows the value of securitised notes sold to third party investors issued and outstanding:
The Co-operative Bank plc Pillar 3 Disclosures for the year ended 31 December 2015 55
5. Risks and their management continued
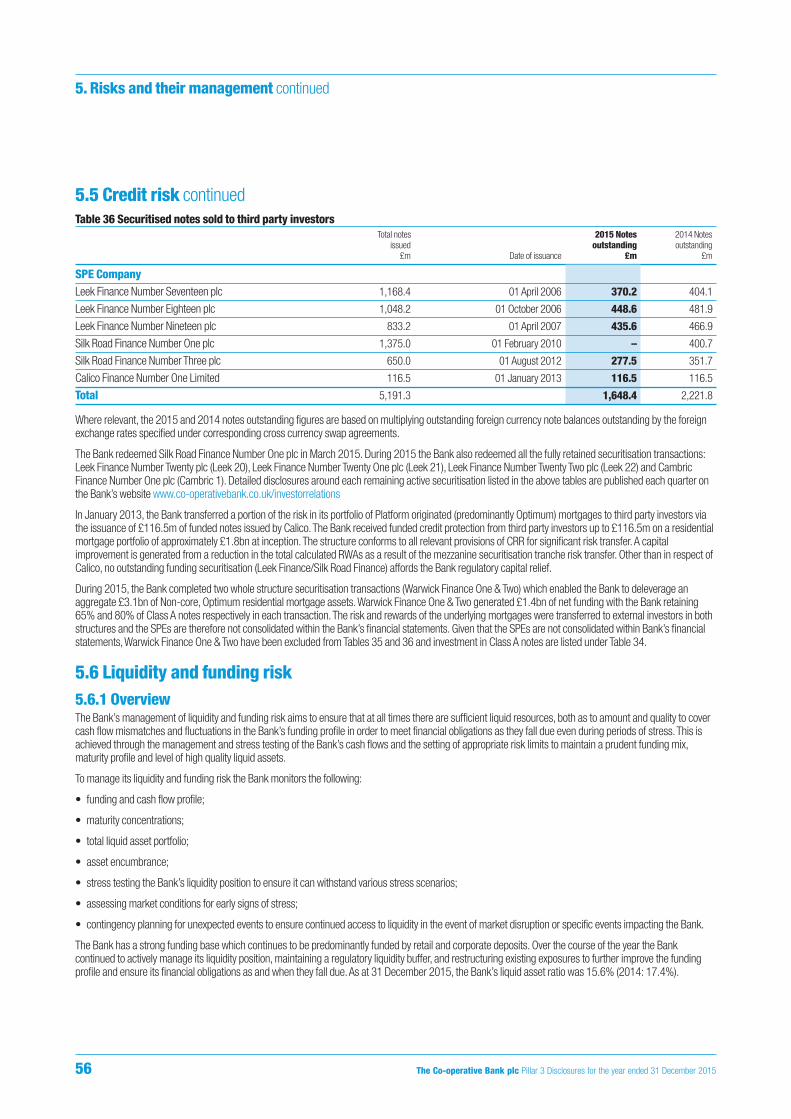
5.5 Credit risk continuedTable 36 Securitised notes sold to third party investors
Total notes 2015 Notes 2014 Notesissued outstanding outstanding
£m Date of issuance £m £m
SPE CompanyLeek Finance Number Seventeen plc 1,168.4 01 April 2006 370.2 404.1
Leek Finance Number Eighteen plc 1,048.2 01 October 2006 448.6 481.9
Leek Finance Number Nineteen plc 833.2 01 April 2007 435.6 466.9
Silk Road Finance Number One plc 1,375.0 01 February 2010 – 400.7
Silk Road Finance Number Three plc 650.0 01 August 2012 277.5 351.7
Calico Finance Number One Limited 116.5 01 January 2013 116.5 116.5
Total 5,191.3 1,648.4 2,221.8
Where relevant, the 2015 and 2014 notes outstanding figures are based on multiplying outstanding foreign currency note balances outstanding by the foreignexchange rates specified under corresponding cross currency swap agreements.
The Bank redeemed Silk Road Finance Number One plc in March 2015. During 2015 the Bank also redeemed all the fully retained securitisation transactions:Leek Finance Number Twenty plc (Leek 20), Leek Finance Number Twenty One plc (Leek 21), Leek Finance Number Twenty Two plc (Leek 22) and CambricFinance Number One plc (Cambric 1). Detailed disclosures around each remaining active securitisation listed in the above tables are published each quarter onthe Bank’s website www.co-operativebank.co.uk/investorrelations
In January 2013, the Bank transferred a portion of the risk in its portfolio of Platform originated (predominantly Optimum) mortgages to third party investors viathe issuance of £116.5m of funded notes issued by Calico. The Bank received funded credit protection from third party investors up to £116.5m on a residentialmortgage portfolio of approximately £1.8bn at inception. The structure conforms to all relevant provisions of CRR for significant risk transfer. A capitalimprovement is generated from a reduction in the total calculated RWAs as a result of the mezzanine securitisation tranche risk transfer. Other than in respect ofCalico, no outstanding funding securitisation (Leek Finance/Silk Road Finance) affords the Bank regulatory capital relief.
During 2015, the Bank completed two whole structure securitisation transactions (Warwick Finance One & Two) which enabled the Bank to deleverage anaggregate £3.1bn of Non-core, Optimum residential mortgage assets. Warwick Finance One & Two generated £1.4bn of net funding with the Bank retaining65% and 80% of Class A notes respectively in each transaction. The risk and rewards of the underlying mortgages were transferred to external investors in bothstructures and the SPEs are therefore not consolidated within the Bank’s financial statements. Given that the SPEs are not consolidated within Bank’s financialstatements, Warwick Finance One & Two have been excluded from Tables 35 and 36 and investment in Class A notes are listed under Table 34.
5.6 Liquidity and funding risk5.6.1 OverviewThe Bank’s management of liquidity and funding risk aims to ensure that at all times there are sufficient liquid resources, both as to amount and quality to covercash flow mismatches and fluctuations in the Bank’s funding profile in order to meet financial obligations as they fall due even during periods of stress. This isachieved through the management and stress testing of the Bank’s cash flows and the setting of appropriate risk limits to maintain a prudent funding mix,maturity profile and level of high quality liquid assets.
To manage its liquidity and funding risk the Bank monitors the following:
• funding and cash flow profile;
• maturity concentrations;
• total liquid asset portfolio;
• asset encumbrance;
• stress testing the Bank’s liquidity position to ensure it can withstand various stress scenarios;
• assessing market conditions for early signs of stress;
• contingency planning for unexpected events to ensure continued access to liquidity in the event of market disruption or specific events impacting the Bank.
The Bank has a strong funding base which continues to be predominantly funded by retail and corporate deposits. Over the course of the year the Bankcontinued to actively manage its liquidity position, maintaining a regulatory liquidity buffer, and restructuring existing exposures to further improve the fundingprofile and ensure its financial obligations as and when they fall due. As at 31 December 2015, the Bank’s liquid asset ratio was 15.6% (2014: 17.4%).
56 The Co-operative Bank plc Pillar 3 Disclosures for the year ended 31 December 2015
5. Risks and their management continued

5.6 Liquidity and funding risk continued5.6.2 Liquidity risk management framework The Board determines and approves the Liquidity Risk Appetite (LRA) of the Bank. It also reviews and approves the Bank’s Liquidity and Funding RiskManagement Policy (LFRMP) framework and delegates to ALCO the responsibility for complying with the framework which in turn delegates to the Liquidity andMarket Risk Forum (LMRF) which oversees the management of liquidity and funding risks. Treasury are responsible for ensuring that all liquidity and funding riskmeasures are managed within policy and risk appetite. The Treasury Risk team provides review and challenge of policies and procedures relating to liquidity andfunding risk.
The Bank sets formal limits within the LFRMP to maintain liquid assets within the LRA set by the Board. The LRA requires the Bank to maintain sufficient liquidassets to survive a defined stress scenario selected from a range of scenarios over a 90 day period, the severity of which is set in relation to both the externalenvironment it operates in and the Bank’s business activities. On 1 October 2015 the Liquidity Coverage Ratio (LCR) became the PRA’s primary regulatorystandard for liquidity, replacing the previous BIPRU 12 regime. The LCR measures the amount of high quality liquid assets relative to estimated net stressed cashoutflows within a 30 day period. The PRA has set a minimum requirement of 80% from October 2015, rising thereafter to 100% from 1 January 2018. As at31 December 2015 the Bank’s LCR was in excess of 100%.
The Basel Committee on Banking Supervision published its final recommendations for the implementation of the Net Stable Funding Ratio (NSFR) in October2014, proposing an implementation date of 1 January 2018, by which time banks are expected to meet an NSFR ratio of 100% from this point onwards. As at31 December 2015 the Bank’s NSFR exceeds 100%.
Liquidity management information is provided on a regular basis to the LMRF, ALCO and the Board, which details the Bank’s compliance with its core liquidityrisk metrics, which include:
• customer loan/deposit ratio, 98.5% (2014: 96.6%) – the ratio of customer loans to customer deposits;
• encumbrance ratio, 21.8% (2014: 25.9%) – Per the EBA definition, Asset Encumbrance ratio = (Carrying amount of encumbered assets and collateral)/(Totalassets and collateral) where an asset is considered as encumbered if it has been pledged or if it is subject to any form of arrangement to secure, collateraliseor credit enhance any transaction from which it cannot be freely withdrawn.
To allow comparison with 2014 the encumbrance ratio above is calculated on a point-in-time basis. The median based encumbrance ratio is 24.5% and thismeasure will be utilised going forward; and
• internal liquidity stress tests – the survival period of the Bank under an applicable stress scenario.
LMRF oversees the operational liquidity management and convenes at least once a month. A range of indicators, details of cash flows and media coverage aremonitored to attempt to detect early signs of liquidity stress either in the market or events that are specific to the Bank. The LMRF, ALCO and the Board discussthe actual liquidity position and projected position incorporating business plans. More frequent meetings are held if necessary, i.e. when the markets have aheightened period of stress or liquidity shortage.
The Bank maintains a Contingency Funding Plan (CFP) approved by ALCO and the Board, which details the procedures and a range of available actions that theBank could deploy in the event of a liquidity or funding stress, thereby allowing adequate liquidity resources to be maintained. The CFP is reviewed every sixmonths and tested at least annually. In the event that the CFP is deployed following endorsement from ALCO then the CEO will convene the Crisis ManagementTeam (CMT) which will become the main management committee that assumes responsibility for delivering the CFP, engaging other business areas of the Bankand third parties. The Bank also has a recovery plan which describes potential actions that could be used in a more stressful scenario.
5.6.3 Liquidity risk policies Liquidity risk policies are developed by the LMRF, ALCO and the Board. The Bank’s liquidity management policies are reviewed and approved annually by theBoard and compliance is reviewed by LMRF, ALCO and the Board. The Bank’s policy is to have sufficient funds available at all times to meet demands fromdepositors, to fund agreed advances, to meet other commitments as and when they fall due, and to ensure the Board’s risk appetite is met.
The Bank also monitors the adequacy of its controls to provide assurance that liquidity risk is being appropriately managed, and regularly assesses its fundingposition. The Bank’s Liquidity Management Framework is designed in line with FCA, PRA and EBA regulations and industry guidelines. This will continue to beupdated to reflect evolving regulatory change.
Liquid asset portfoliosTotal liquidity resources as at 31 December 2015 were £11,402.8m (2014: £12,120.4m). The table below analyses the Bank’s liquidity portfolio by product andunencumbered liquidity value. The Bank categorises its liquidity portfolio into primary and other liquid assets. Primary liquid assets includes cash and balancesat central banks, gilts and other high quality government bonds and all other liquid assets including self issued retained securitisations (contingent liquidityportfolio).
The Co-operative Bank plc Pillar 3 Disclosures for the year ended 31 December 2015 57
5. Risks and their management continued

5.6 Liquidity and funding risk continuedTable 37 Bank’s Liquidity portfolio
31 December 31 December2015 2014
£m £m
Operational balances with central banks 2,329.3 4,487.4
Gilts 1,450.2 1,246.7
Central government and multilateral development bank bonds 760.2 819.5
Total primary liquid assets 4,539.7 6,553.6
Other liquid assets 1,386.6 14.3
Contingent liquidity 5,476.5 5,552.5
Total liquidity 11,402.8 12,120.4
Average balance 11,203.9 12,015.8
The Bank uses any combination of these asset pools to manage liquidity, with primary liquidity used predominantly for short term cash flow movements, whileother liquidity is used for creating longer term liquidity. Regular realisation through repo transactions and outright sales provide assurance that these asset poolsremain sufficiently liquid. The overall quantum of liquid assets fell slightly in 2015 following an increase in 2014 due to an injection of cash through the capitalraising in May 2014. The secondary liquidity portfolio reflects own assets eligible for discounting at central banks, which has increased in 2015.
Funding and liquidity strategy focuses on maintaining a high percentage of liquid assets that are eligible to be included in the Liquid asset buffer (LAB).
The table below shows in addition to the liquid assets listed above, other non-liquid assets. In 2015 the remaining two bonds have matured to leave the balanceat nil.
Table 38 Non-buffer assets 31 December 31 December
2015 2014£m £m
Short term deposits – –
Other public sector securities – 2.5
Floating rate notes – 31.0
Fixed rate notes – –
Other securities and commodities – –
Total non-buffer assets – 33.5
Wholesale funding is used to supplement retail and commercial deposits by raising longer term funds (over one year in duration) and to diversify the source offunds to support the business plan of the Bank. The Bank has a variety of long term wholesale funding sources outstanding, including securitisations, coveredbond and Euro medium-term notes, as shown in the table below.
Table 39 Long term wholesale funding sources 31 December 31 December
2015 2014£m £m
Preference shares and subordinated debt 457.0 196.4
Secured funding 2,091.0 2,521.8
Repos 671.3 500.6
Market borrowing 10.9 46.0
MTNs 404.9 832.9
Total wholesale funding 3,635.1 4,097.7
The reduction of the wholesale funding reflects the repayment of a number of secured funding liabilities in 2015, alongside Medium Term Notes (MTNs). This isoffset by a £250m Tier 2 subordinated debt issuance during the year. The Bank has £511.0m of Gilt repos within the Repos line.
58 The Co-operative Bank plc Pillar 3 Disclosures for the year ended 31 December 2015
5. Risks and their management continued
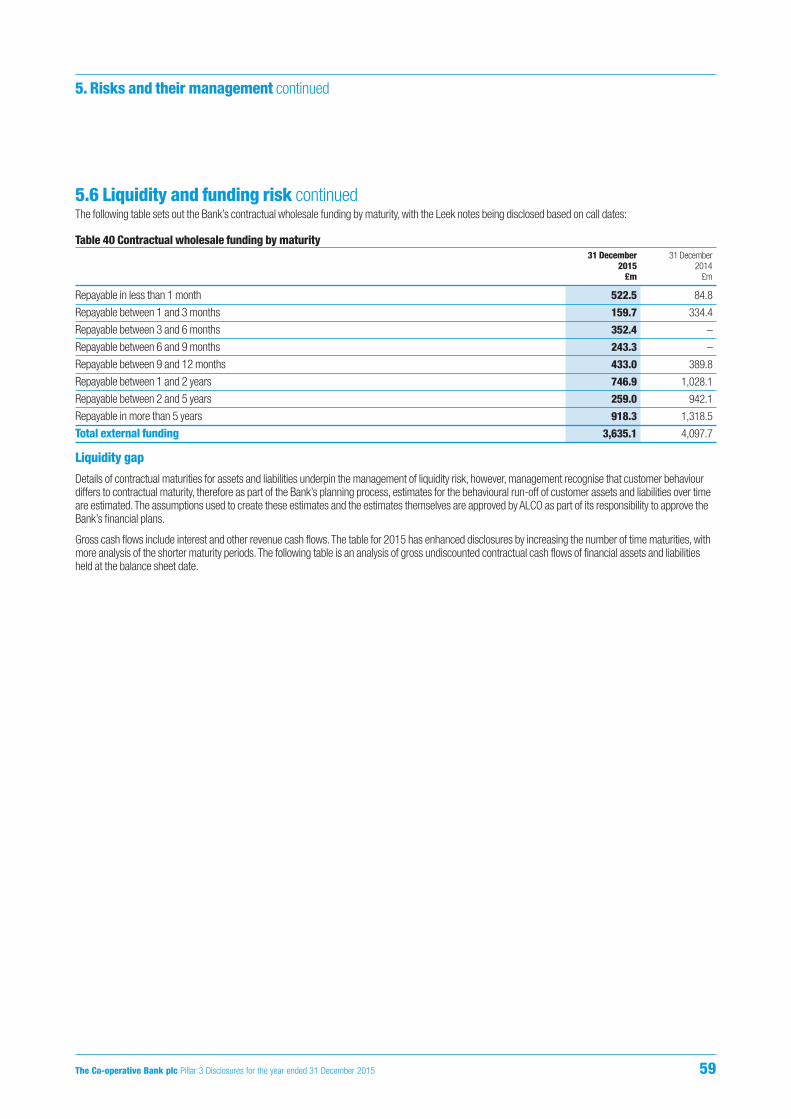
5.6 Liquidity and funding risk continuedThe following table sets out the Bank’s contractual wholesale funding by maturity, with the Leek notes being disclosed based on call dates:
Table 40 Contractual wholesale funding by maturity 31 December 31 December
2015 2014£m £m
Repayable in less than 1 month 522.5 84.8
Repayable between 1 and 3 months 159.7 334.4
Repayable between 3 and 6 months 352.4 –
Repayable between 6 and 9 months 243.3 –
Repayable between 9 and 12 months 433.0 389.8
Repayable between 1 and 2 years 746.9 1,028.1
Repayable between 2 and 5 years 259.0 942.1
Repayable in more than 5 years 918.3 1,318.5
Total external funding 3,635.1 4,097.7
Liquidity gap
Details of contractual maturities for assets and liabilities underpin the management of liquidity risk, however, management recognise that customer behaviourdiffers to contractual maturity, therefore as part of the Bank’s planning process, estimates for the behavioural run-off of customer assets and liabilities over timeare estimated. The assumptions used to create these estimates and the estimates themselves are approved by ALCO as part of its responsibility to approve theBank’s financial plans.
Gross cash flows include interest and other revenue cash flows. The table for 2015 has enhanced disclosures by increasing the number of time maturities, withmore analysis of the shorter maturity periods. The following table is an analysis of gross undiscounted contractual cash flows of financial assets and liabilitiesheld at the balance sheet date.
The Co-operative Bank plc Pillar 3 Disclosures for the year ended 31 December 2015 59
5. Risks and their management continued
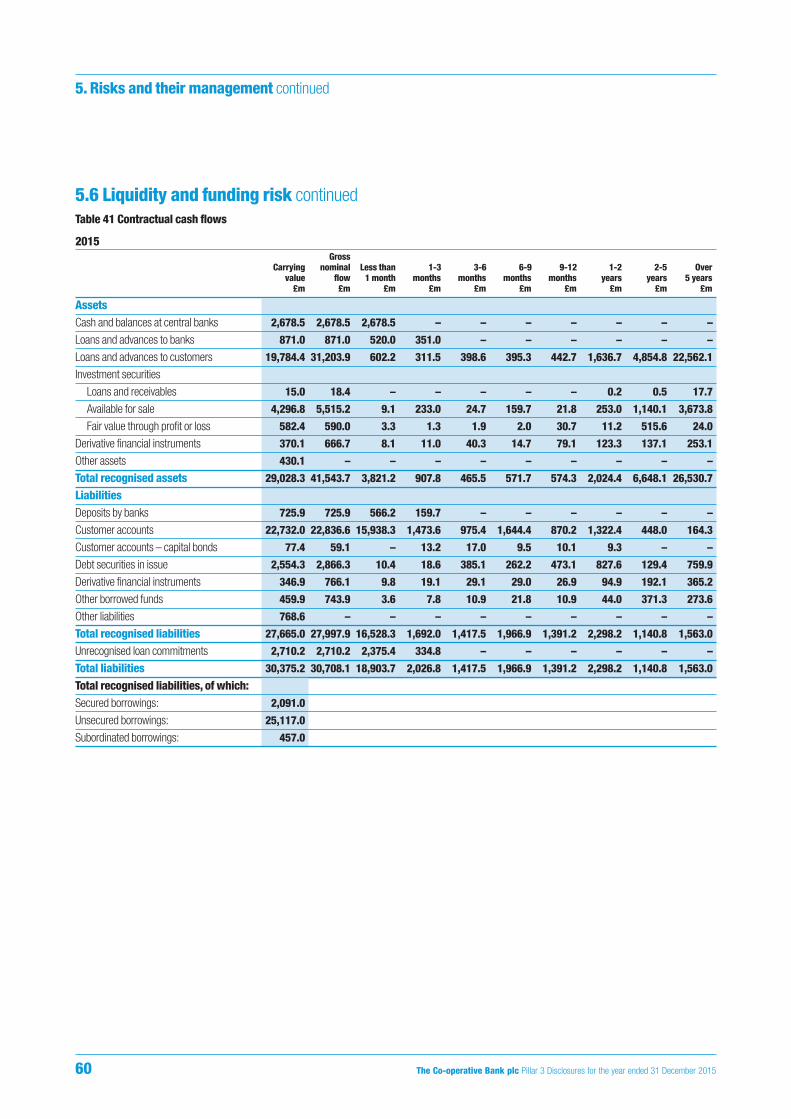
5.6 Liquidity and funding risk continuedTable 41 Contractual cash flows
2015Gross
Carrying nominal Less than 1-3 3-6 6-9 9-12 1-2 2-5 Overvalue flow 1 month months months months months years years 5 years
£m £m £m £m £m £m £m £m £m £m
AssetsCash and balances at central banks 2,678.5 2,678.5 2,678.5 – – – – – – –
Loans and advances to banks 871.0 871.0 520.0 351.0 – – – – – –
Loans and advances to customers 19,784.4 31,203.9 602.2 311.5 398.6 395.3 442.7 1,636.7 4,854.8 22,562.1
Investment securities
Loans and receivables 15.0 18.4 – – – – – 0.2 0.5 17.7
Available for sale 4,296.8 5,515.2 9.1 233.0 24.7 159.7 21.8 253.0 1,140.1 3,673.8
Fair value through profit or loss 582.4 590.0 3.3 1.3 1.9 2.0 30.7 11.2 515.6 24.0
Derivative financial instruments 370.1 666.7 8.1 11.0 40.3 14.7 79.1 123.3 137.1 253.1
Other assets 430.1 – – – – – – – – –
Total recognised assets 29,028.3 41,543.7 3,821.2 907.8 465.5 571.7 574.3 2,024.4 6,648.1 26,530.7
LiabilitiesDeposits by banks 725.9 725.9 566.2 159.7 – – – – – –
Customer accounts 22,732.0 22,836.6 15,938.3 1,473.6 975.4 1,644.4 870.2 1,322.4 448.0 164.3
Customer accounts – capital bonds 77.4 59.1 – 13.2 17.0 9.5 10.1 9.3 – –
Debt securities in issue 2,554.3 2,866.3 10.4 18.6 385.1 262.2 473.1 827.6 129.4 759.9
Derivative financial instruments 346.9 766.1 9.8 19.1 29.1 29.0 26.9 94.9 192.1 365.2
Other borrowed funds 459.9 743.9 3.6 7.8 10.9 21.8 10.9 44.0 371.3 273.6
Other liabilities 768.6 – – – – – – – – –
Total recognised liabilities 27,665.0 27,997.9 16,528.3 1,692.0 1,417.5 1,966.9 1,391.2 2,298.2 1,140.8 1,563.0
Unrecognised loan commitments 2,710.2 2,710.2 2,375.4 334.8 – – – – – –
Total liabilities 30,375.2 30,708.1 18,903.7 2,026.8 1,417.5 1,966.9 1,391.2 2,298.2 1,140.8 1,563.0
Total recognised liabilities, of which:Secured borrowings: 2,091.0
Unsecured borrowings: 25,117.0
Subordinated borrowings: 457.0
60 The Co-operative Bank plc Pillar 3 Disclosures for the year ended 31 December 2015
5. Risks and their management continued

5.6 Liquidity and funding risk continued2014
GrossCarrying nominal Less than Over
value flow 1 month 1-3 months 3-12 months 1-5 years 5 years£m £m £m £m £m £m £m
AssetsCash and balances at central banks 4,765.3 4,765.3 4,765.3 – – – –
Loans and advances to banks 1,608.4 1,608.4 1,238.4 370.0 – – –
Loans and advances to customers 25,849.3 33,816.8 947.2 308.6 1,520.9 8,193.7 22,846.4
Investment securities
Loans and receivables 18.1 21.8 – – 0.1 0.6 21.1
Available for sale 3,167.5 3,366.2 89.1 166.9 117.4 1,703.8 1,289.0
Fair value through profit or loss 1,236.9 1,268.6 1.5 9.0 66.8 1,166.1 25.2
Derivative financial instruments 470.7 766.3 10.9 13.1 48.2 370.8 323.3
Other assets 466.7 – – – – – –
Total recognised assets 37,582.9 45,613.4 7,052.4 867.6 1,753.4 11,435.0 24,505.0
LiabilitiesDeposits by banks 615.4 619.9 103.9 336.8 2.9 176.3 –
Customer accounts 29,614.0 29,974.1 19,117.1 933.6 7,130.5 2,606.2 186.7
Customer accounts – capital bonds 263.8 213.7 8.4 59.2 86.4 59.7 –
Debt securities in issue 3,443.6 4,379.3 94.2 745.3 478.5 2,400.8 660.5
Derivative financial instruments 551.7 1,088.4 14.1 26.4 123.5 390.4 534.0
Other borrowed funds 196.4 410.1 1.9 4.5 17.1 90.8 295.8
Other liabilities 883.5 – – – – – –
Total recognised liabilities 35,568.4 36,685.5 19,339.6 2,105.8 7,838.9 5,724.2 1,677.0
Unrecognised loan commitments 3,017.5 3,017.5 2,872.6 85.3 – 59.6 –
Total liabilities 38,585.9 39,703.0 22,212.2 2,191.1 7,838.9 5,783.8 1,677.0
5.7 Market risk Market risk is the risk of loss as a result of the value of financial assets or liabilities (including off-balance sheet instruments) being adversely affected bymovements in market rates or prices. This loss can be reflected in the near term earnings by changing net interest income, or in the longer term because ofchanges in the economic value of future cash flows.
The main source of market risk within the Bank is driven by mismatches between the repricing profiles of asset and liability customer products and certaincharacteristics embedded within these products and basis risk. The Bank does not have a trading book although the Treasury function does create both marketrisk and currency risk through its various portfolio management activities and employs risk management strategies designed to ensure stability of earnings.
The Bank’s only Pillar 1 market risk requirement is in relation to net currency positions, however it is below a threshold such that the Bank is not required tocalculate Pillar 1 RWAs in respect of this. The Bank is however subject to market risk requirements under the PRA’s Pillar 2 framework, which is captured as partof its ICG requirement.
5.7.1 Market risk management frameworkThe Treasurer is the Risk Owner for market risk and is accountable for the management of market risk in line with the Bank’s policy, control standard and riskappetite. Day-to-day responsibility is delegated to the Head of Treasury Dealing who manages the Bank’s liquidity portfolio and carries out hedging activities tominimise interest rate risk across the whole balance sheet. All market risk is transferred to the Treasury Dealing function to ensure risk is contained andmanaged effectively. Hedging strategies primarily involve the use of interest rate swaps although assets and liabilities are netted where risk can be effectivelymanaged.
The Treasury Risk Director is the Risk Framework Owner for market risk and as such is responsible for setting the framework and policy by which the Treasurermanages the risk. A second line oversight function supports the Treasury Risk Director by monitoring the management of market risk to ensure compliance withthe Bank’s policy, control standard and risk appetite. A second line reporting function provides independent reporting and analysis of the Bank’s exposures.
Responsibility for monitoring key market risk metrics and ensuring that the market risk profile is aligned to the Board risk appetite rests with the Bank’s ALCOwhich meets on a monthly basis. The Committee also approves all behavioural assumptions used in the management of market risk. The LMRF supports theALCO by reviewing current and potential future market risk position, identifying emerging market risks and required management actions. It also oversees thetechnical approaches to managing the Bank’s market risks including any changes to methodologies, models and systems/infrastructure.
The Co-operative Bank plc Pillar 3 Disclosures for the year ended 31 December 2015 61
5. Risks and their management continued

5.7 Market risk continued5.7.2 Market risk appetiteThe Bank’s primary objective is to minimise the sensitivity at product, balance or business level of net interest income and the economic value of its equity baseto changes in interest rates. This is translated into a maximum amount of capital that the Bank deems necessary to hold to support the level of market riskexposure and the risk that those exposures may pose to the Bank’s future financial performance.
The Bank assesses each of the market risk drivers and establishes a set of limits. In order to quantify the amount of capital the Bank requires against eachsource of market risk an internal assessment of a rate stress based on historical interest rate data is applied to the limit position. In this context the market riskappetite is expressed as an overarching amount of capital at risk, which is underpinned by a number of primary and secondary risk metrics. Primary risk metricsare set against each of the key drivers of market risk and adherence to these limits is central to maintaining market risk within overall appetite. Secondary riskmetrics are also used which provide operational early warning indicators that may impact exposure which is assessed via primary risk metrics.
5.7.3 Primary risk metrics and sources of market riskThe key drivers of market risk that the Bank faces and the metrics used to manage those risks are:
5.7.3.1 Interest rate risk The primary risk metric employed by the Bank to manage directional interest rate risk and yield curve risk is the sensitivity of the Bank’s net interest rateexposure to a one basis point parallel shift in interest rates (PV01). Limits are set at an overall level for directional interest rate risk and against individual timebuckets for yield curve risk.
To supplement the gapped and overall PV01 limits noted above, stress testing of exposures against historical yield curve shifts is undertaken on a monthly basis.This assesses the sensitivity to the most extreme curve steepening and curve flattening movements to a 99% confidence, seen over a 1 month period during theprevious five years.
A key aspect in the management and measurement of interest rate risk is the behaviouralisation of certain elements of the Bank’s balance sheet. Behaviouralassumptions are limited to the treatment of non-interest bearing balances and expectations with regard to customer prepayments within the Bank’s residentialmortgage and unsecured loan portfolios. The Bank periodically analyses its current account portfolio in order to identify a stable, non-interest bearing ‘core’element compared to the more volatile, rate sensitive and transitory balances. A behavioural duration is applied to the former while the latter are assumed toreprice within one month. Other non-maturity deposits are not subject to a behavioural adjustment and are assumed to reprice within one month. Similarassumptions are made for other non-interest bearing balance sheet items such as non-dated capital all of which are reviewed and approved by the ALCO on asemi-annual basis.
Risk exposures are formally calculated at least monthly. Interest rate risk and effectiveness of hedging is monitored at a minimum weekly using gap positions,incorporating new business requirements. Draw down risk, in particular for fixed rate mortgages, is managed through weekly tranche meetings. The Treasuryteam undertakes hedges for interest rate risk using derivative instruments and investment securities to external wholesale markets.
5.7.3.2 Basis risk The definition of basis risk is the risk of loss as a result of the balance sheet being adversely affected by the movement between different index rates.
Basis risk is managed using earnings at risk based metric, focusing in detail on the sensitivity of changes in interest rates on net interest income over a one yearperiod. The assumed potential loss of earnings reflects the downside risk comparing the prevailing relevant spreads against their historical extremes. Theestimated earnings at risk is then expressed as a percentage of the forecasted net interest income over the next twelve months.
Basis risk is monitored by LMRF and ALCO monthly with action taken as required.
5.7.3.3 Sovereign Swap spread risk Swap spread risk is defined as the risk between the fixed rate element of the swap agreement and the benchmarked treasury instrument that the organisation isexposed to.
The Bank manages swap spread risk by calculating on a daily basis the sensitivity of its hedged fixed rate bond portfolio to a one basis point divergence in yieldsbetween the fixed rate bond and its hedge (PV01).
5.7.3.4 Foreign exchange riskThe Bank’s exposure to foreign exchange risk is primarily limited to customer hedging transactions and positions entered via natural customer flow only.Therefore, to manage this risk an overall maximum notional net sterling position limit is set for both intra-day and overnight exposures. This is supported byapplying sub-limits to currencies by tier to reflect their liquidity.
Where the Bank has originated non-sterling debt securities or short term borrowings both currency and interest rate risk is mitigated using off setting assets orderivative instruments such as cross currency swaps.
62 The Co-operative Bank plc Pillar 3 Disclosures for the year ended 31 December 2015
5. Risks and their management continued

5.7 Market risk continuedTable 42 Balance sheet by currency
31 December 2015 31 December 2014————————————————————————— —————————————————————————
£ $ € Other Total £ $ € Other Total£m £m £m £m £m £m £m £m £m £m
AssetsCash and balances at central bank 2,678.5 – – – 2,678.5 4,765.3 – – – 4,765.3
Loans and advances to banks 805.8 34.4 29.6 1.2 871.0 1,550.2 31.2 26.0 1.0 1,608.4
Loans and advances to customers 19,643.7 27.1 19.5 0.1 19,690.4 25,631.6 22.3 36.2 10.7 25,700.8
Fair Value adjustments for hedged risk 94.0 – – – 94.0 148.5 – – – 148.5
Investment securities
Loans and receivables 15.0 – – – 15.0 18.1 – – – 18.1
Available for sale 4,296.8 – – – 4,296.8 3,166.7 0.8 – – 3,167.5
Fair value through profit or loss 582.4 – – – 582.4 1,236.9 – – – 1,236.9
Derivative financial instruments 370.1 – – – 370.1 470.7 – – – 470.7
Other assets 430.1 – – – 430.1 466.4 – 0.3 – 466.7
Total assets 28,916.4 61.5 49.1 1.3 29,028.3 37,454.4 54.3 62.5 11.7 37,582.9
LiabilitiesDeposits by banks 715.4 – 10.5 – 725.9 601.0 – 14.4 – 615.4
Customer accounts 22,684.0 17.6 28.8 1.6 22,732.0 29,571.2 16.8 25.0 1.0 29,614.0
Customer accounts – capital bonds 77.4 – – – 77.4 263.8 – – – 263.8
Debt securities in issue 1,466.4 549.6 538.3 – 2,554.3 1,809.5 603.2 1,030.9 – 3,443.6
Derivative financial instruments 346.9 – – – 346.9 550.5 – 1.2 – 551.7
Other borrowed funds 459.9 – – – 459.9 196.4 – – – 196.4
Other liabilties 770.3 0.4 (2.1) – 768.6 883.5 – – – 883.5
Total liabilities 26,520.3 567.6 575.5 1.6 27,665.0 33,875.9 620.0 1,071.5 1.0 35,568.4
Net Assets 2,396.1 (506.1) (526.4) (0.3) 1,363.3 3,578.5 (565.7) (1,009.0) 10.7 2,014.5
In 2014 the loan and advances to customers included assets held for sale of £323.4m (see Note 17 of 2015 Annual Report and Accounts for further details).The debt securities are shown gross of the Fair Value Adjustment for the Dollar and Euro values.As at 31 December 2015, the Bank’s open currency position was £(0.7)m (2014: £(0.6)m) (see Table 43). The Bank manages its currency positions against bothan overall limit and individual currency limits.
5.7.3.5 Credit spread riskCredit spread risk is defined as the risk of loss from changes in the credit spread on wholesale assets.The Bank’s non-sovereign term exposures are primarily to holdings of mortgage backed securities issued by Warwick Finance One & Two which reflect theretained elements from the deleveraging of the Bank’s Non-core assets. Given that the Bank does not seek to actively transact in this type of asset, eachpurchase is individually agreed by ALCO and a maximum notional limit set. The potential risk from these holdings is assessed against historical spreadmovements of similar securitisation transactions.
5.7.3.6 Other sources of market riskOther sources of market risk include:• Directional risk – The sensitivity to the overall direction of interest rate movements;• Yield curve risk – The sensitivity to the relative movement of interest rates at different maturities on the yield curve;• Prepayment risk – The risk that an asset or liability repays more quickly or slowly than anticipated, resulting in a mismatch between the asset, liability and
associated hedge;• Pipeline risk – The risk that the sales profile for new fixed rate products do not match hedging assumptions, resulting in a mismatch between amount of
product sold and that hedged, which can result in a hedge rebalancing cost;• Explicit option risk – The sensitivity to overall direction of interest rates, speed of change of interest rates and market prices for positions which contain explicit
options (e.g. caps, floors, swaptions);• Repricing and implicit optionality in products – The risk that options embedded or implied within retail or commercial products have an impact on market
value or earnings with changing interest rates;• Illiquidity risk – The Bank’s risk appetite for market risk considers any illiquidity risk which is reflected in the assumed holding period it uses to assess its
capital requirements for market risk.
The Co-operative Bank plc Pillar 3 Disclosures for the year ended 31 December 2015 63
5. Risks and their management continued

5.7 Market risk continuedTable 43 PV01, Basis risk, Swap spreads and FX risk metrics on the Bank’s balances
31 December 31 December2015 2014
Total PV01 (£k) 76.0 (141.4)
Average PV01 for the year (£k) (94.2) 17.6
Largest Positive PV01 for the period (£k) 128.0 167.8
Largest Negative PV01 for the period (£k) (348.2) (141.4)
Average Basis Risk (% of annual NII) 3.4% 4.4%
Swap Spread PV01 (£k) (1,043.0) (1,235.4)
Average of Swap Spread PV01 (£k) (1,014.1) (1,256.3)
MBS Holding (£m) 1,614.0 16.2
Average MBS Holding (£m) 857.2 16.2
FX Notional (£m) (0.7) (0.6)
Average FX Notional (£m) (0.7) (0.1)
The table illustrates the PV01, Basis risk, Swap spread and FX risk metrics on the Bank’s balances. The PV01 is primarily driven by the non-sensitive balancesoffset by corresponding asset or derivative positions. During 2015 the largest PV01 of £(348)k reflected a timing mismatch between agreement and completionof the disposal of £323m of corporate assets and associated hedges. Given that a price had been fixed for the sale of the derivatives the Bank unwound theopposing derivatives to protect its economic position. Excluding this transaction the Bank’s PV01 ranged from £133k to £(149)k.
The Bank’s basis risk exposure in terms of potential earnings at risk has remained relatively unchanged year on year. However, during 2015 the deleveraging ofthe Bank’s non-conforming mortgage portfolio and subsequent purchase of LIBOR linked Mortgage Backed Securities (MBS) has seen a net base rateasset/LIBOR liability position transition into a net LIBOR asset/base rate liability. Swap spread risk has reduced through 2015 due to lower absolute holdings.MBS holdings have increased markedly due to the purchase of Warwick Finance One & Two securities noted above.
5.8 Operational risk Operational risk is the risk of loss resulting from inadequate and failed processes, people or systems within the Bank or from external events.
Operational risk processes have been embedded within the Bank, however Operational risk levels remain elevated due to the manual processes, legacy systemsand processes for which remediation continues. Further information can be found in the Risk Management and Principal risks and uncertainties sections of the2015 Annual Report and Accounts.
Operational Risk Framework The management of Operational risk is designed to assist the Bank in understanding its operations in the context of a Board approved risk appetite, particularlywith regard to reducing capital requirements, meeting regulatory expectations and reducing operational losses. The approved Operational Risk Framework hasremained stable since early 2013 and continues to be embedded in line with good practice and regulatory guidance. This framework is designed to provideassurance over the system of risk management and internal control. Methods and approaches continue to be embedded within the business and there issignificant focus on this activity. This is supported by the implementation of a revised Operational Risk Management System which is currently beingimplemented and will be finalised by mid 2016.
Operational risks are identified, managed and mitigated through ongoing risk management practices including material Bank level risk assessments, risk eventreporting, operational loss data analysis, a detailed risk and control self assessment process, a consistently applied risk acceptance process, monitoring of keymetrics, scenario analysis and continuous training. Material Operational risks are reported through an appropriate governance structure with regular meetings tomonitor the development and effectiveness of the Operational risk processes and material risks within the Bank.
64 The Co-operative Bank plc Pillar 3 Disclosures for the year ended 31 December 2015
5. Risks and their management continued

5.8 Operational risk continuedOperational Net Losses
The above analysis presents the Bank’s operational risk events by Basel Level 1 risk event category as this aligns with industry best practice.
In 2015, Execution, Delivery and Process Management, the largest loss category, accounts for 46.7% of total net losses and 33.9% of the number of individualevents. Events within this category include Redress Payments of £1.7m, incorrectly processed payments and Payment Service Regulations (PSR) andRegulatory breaches.
External Fraud accounts for 39.7% of the total net losses and 63.9% of the number of individual events. These events are driven by financial crime and includecredit and debit card fraud, malware attacks, phishing, cheque frauds and mortgage frauds.
< 1%
16.2% 19.4%
< 1% < 1% < 1% < 1% < 1% < 1%
64.3%
< 1%
39.7%
46.7%
13.5%
80%
70%
60%
50%
40%
30%
20%
10%
0%
Risk Events: Net Losses (as a % of total)
2014 2015
Execution,Delivery and
ProcessManagement
33.9%
Execution,Delivery and
ProcessManagement
37.7%
ExternalFraud63.9%
ExternalFraud59.2%Business
Disruptionand System
Failures2.1%
BusinessDisruption
and SystemFailures2.9%
EmploymentPractices
andWorkplace
Safety< 1%
EmploymentPractices
andWorkplace
Safety< 1%
Clients,Products and
BusinessPractices
< 1%
Clients,Products and
BusinessPractices
< 1%
Damage toPhysical
Assets andInjury< 1%
Damage toPhysical
Assets andInjury< 1%
Internal Fraud< 1%
Internal Fraud< 1%
Number of Risk Events 2015 (as a % of total) Number of Risk Events 2014 (as a % of total)
BusinessDisruption andSystem Failures
Execution,Delivery and
ProcessManagement
Damage to Physical Assets
and Injury
Clients, Products and Business
Practices
Employment Practices and
Workplace Safety
Internal FraudExternal Fraud
The Co-operative Bank plc Pillar 3 Disclosures for the year ended 31 December 2015 65
5. Risks and their management continued
5.8 Operational risk continuedThe increase in percentage over 2014 for the two items above do not indicate an increase in actual loss amounts which are lower than previous years but are aresult of a significant decrease in the percentage for Clients, Products and Business Practices.
In 2015, Clients, Products and Business Practices accounts for 13.5% of the total net losses but less than 1% of the number of individual events. The losscategory includes the Plevin PPI Provision (£1.3m).
In 2014, Clients, Products and Business Practices was the largest loss category accounting for 64.3% of the net losses, as a result of a number of materialprovisions including Packaged Accounts Current Accounts Provision (£24.2m) and breaches of PSR (£1.5m).
During 2015 net adjustments have been made to the previous provisions totalling in excess of £18.3m, and the 2014 Operational Loss data has been restatedto reflect these changes.
As part of the process a review and analysis of risk events is performed to ensure that any required improvements to processes and/or controls and anylearnings are implemented in order to help prevent reoccurrence. Other activities driven by risk events and losses include a strengthening of the 1st line processto carry out root cause analysis and continuous improvement to the control environment through management of the Risk Control Self Assessments andstrengthening of the three lines of defence.
5.9 Pension risk Pension risk occurs in defined benefit schemes when the market value of the scheme’s assets is considered to be insufficient to meet its liabilities, resulting in adeficit. The scheme’s liabilities are calculated using a discount rate referenced to bond yields and are an estimate of its long term obligations. Uncertainty in theestimated size of the liabilities and volatility in future investment returns from the assets may cause volatility in the pension fund deficit. The key risk factors thatcan have a positive or negative impact on the deficit are:
• Long term interest rates – A decrease in long term interest rates will cause the value of the scheme’s liabilities to increase.
• Inflation – Where a scheme’s benefits have an inflation link, an increase in inflation will cause the scheme’s liabilities to increase. This may be offset where thescheme’s assets are also linked to inflation (e.g. index-linked gilts and inflation swaps).
• Longevity risk (life expectancy) – The valuation of pension scheme liabilities is reliant on scheme member longevity and liabilities may substantially increaseshould longevity increase more than expected.
• Asset volatility – Changes in the value of the scheme’s assets compared with that of its liabilities can create significant volatility in the estimated deficit. This isparticularly prevalent in schemes with significant equity holdings where equity returns underperform the bond yields used to discount scheme liabilities.
In 2015, the Bank closed its defined benefit scheme and removed the link to final pensionable salary for both Pace and Britannia Pension Scheme members.Colleagues have been provided with defined contribution pension options for all future service. This action will assist in containing the Bank’s exposure topension risk going forward. During 2016, consideration will be given to strategies for separation of the Bank’s element of the Pace scheme from that of TheCo-operative Group.
Controls are applied to mitigate these risks and a monthly pension risk report is made to Bank’s ALCO and EROC to monitor pension risk and decide if furtheraction is necessary. These reports take account of the risk reporting delivered to pension scheme Trustees. The Bank is able to engage directly with the Trusteesof the Britannia Pension Scheme and can influence the Trustees of Pace through its relationship with the sponsor,The Co-operative Group.
The HR Director chairs a pension steering group and pension risk is discussed at a number of Executive and Board Committees on a regular basis.
For further information see Note 34 of the accounts.
5.10 Regulatory risk 5.10.1 Regulatory environmentThe Bank’s operations, including its subsidiaries and associates, are subject to a significant body of rules and regulations that are a condition for authorisation toconduct banking and financial services business. These apply to business operations and affect financial returns and include reserve and reporting requirementsand prudential and conduct of business regulations. The requirements often reflect global standards developed by, among others, the Basel Committee onBanking Supervision and the International Organisation of Securities Commissions. Requirements are increasingly derived from, or applied directly by, EUlegislation in addition to the requirements mandated by the principle regulatory authorities that supervise the Bank in the jurisdictions in which it operates.
Changes to regulationsAs the Bank must comply with wide-ranging legal and regulatory (including liquidity and capital) requirements and supervision, changes to the legal andregulatory environment may result in additional compliance costs (including the raising of further capital and/or liquidity) and diversion of management time andresources. These changes may negatively affect the Bank’s business. In addition, failure to comply with these requirements may result in investigations,disciplinary action, fines, reputational damage and the revocation of the Bank’s licences, permissions or authorisations, which could have a material negativeeffect on the Bank’s business. The regulatory risk team is responsible for identifying and communicating changes to regulation. Adoption of these changes isowned and managed by the first line.
66 The Co-operative Bank plc Pillar 3 Disclosures for the year ended 31 December 2015
5. Risks and their management continued
5.10 Regulatory risk continued5.10.2 Regulatory risk managementThe regulatory risk function is responsible for monitoring and reporting on regulatory risk across the Bank and facilitates production of regulatory, conduct, anti-money laundering and financial crime risk reporting to CRROC, EROC and RC.
5.11 Conduct riskThe Bank manages conduct risk in a way that is consistent with its overall risk appetite and aligns with its strategy. Conduct risk encompasses the principle oftreating customers fairly and putting customers at the centre of what we do, it is outcome driven. Conduct risk may arise from any aspect of the way the Bank’sbusiness is conducted, a key criteria for the Bank being whether the outcome is fair for its customers for example, products and services not meeting the needsof its customers, sales processes resulting in poor advice or incorrect information, or failing to deal with a complaint appropriately. When assessing conduct riskthere will often be a closely linked regulatory requirement arising from the FCA rules and guidance that are concerned with the conduct of business regulation.
At the end of 2015, the Bank has conduct risk provisions of £355.7m, to cover the costs relating to PPI mis-selling, breaches of the technical requirements ofthe Consumer Credit Act, interest rate swap mis-selling, packaged accounts and other provisions, further detail of which is provided in Note 32 to the accounts.
5.12 People risk People risk is overseen by the HR Director, with responsibility held by the Executive teams and wider business. Key people policies and interventions aregoverned by the Executive People Committee.
A number of key initiatives have been undertaken in 2015 to tackle People risk issues. The Culture Programme seeks to improve colleague engagement,reinforcing the Co-operative Bank Values and Culture, and embedding these into people policies and processes. The current phase focuses on specific,executive sponsored work streams including customer, leadership and risk management. Employee engagement levels have improved significantly throughout2015.
Employee turnover levels remain elevated, reflecting the buoyancy of the external market. The Employee Value Proposition is under ongoing development, and2015 saw the launch of the new employer brand and employee recognition programme.
Building capability remains critical, with good progress made in strengthening the Bank’s talent profile and succession planning.
5.13 Strategic and business riskA failure to successfully implement or a delay in implementing the Bank’s turnaround strategy may adversely impact the Bank’s business, operating results,financial condition and prospects, its regulatory capital position and its ability to comply with its regulatory capital requirements.
There is a risk that this strategy may be unachievable due to the level of complex and overlapping changes required on multiple axes whilst seeking tostrengthen the Bank’s brand, reputation and customer satisfaction and its relationship with its employees. Recent action has been taken to restructure theproject portfolio to focus on those projects most critical to the success of the Bank’s strategy.
Strategic and business risk is managed through EROC, ExCo and the Board via consideration of risks to the strategy caused by changes in the externalenvironment and assessment of forecast plan progress on a continual basis. Any required actions to address strategic risk are agreed on a regular basis andmonitored through EROC.
5.14 Reputational riskReputational risk can arise as a result of any other principal risk crystallising; therefore, the significant initiatives covered in all other sections are relevant tomanaging reputational risk. In addition, responsibility for overseeing reputational risk has transferred to the Bank’s second line risk team and work is ongoing todefine an appropriate policy and key risk indicators. The Bank launched a revised Ethical Policy based on responses provided in the customer poll conducted in2014, and used the principles to guide the development of a new overdraft proposition launched during the year.
The Co-operative Bank plc Pillar 3 Disclosures for the year ended 31 December 2015 67
5. Risks and their management continued

Item Description
Advanced Internal Ratings Based approach stipulated within CRR allows a more sophisticated and risk sensitiveapproach to calculate credit risk. More advanced than Foundation IRB approach as PD, LGD and EAD parametersare derived by the Bank.
Application score The credit score calculated on the application data alone. Typically, data provided on an application form and/orcredit reference data.
Asset Backed Securities (ABS) Securities that represent an interest in an underlying pool of referenced assets. The referenced pool cancomprise any assets which attract a set of associated cash flows but are commonly pools of residential orcommercial mortgages but could also include leases, credit card receivables, motor vehicles, student loans.
Basel II A statement of best practice issued by the Basel Committee on Banking Supervision, that defines the methods bywhich firms should calculate their regulatory capital requirements to retain enough capital to protect the financialsystem against unexpected losses. Basel II became law in the EU Capital Requirements Directive, and wasimplemented in the UK via the FSA Handbook.
Basel 2.5 was an interim strengthening of requirements laid out in Basel II, with changes focussing on tradingbook and securitisations. Basel 2.5 was implemented within the UK in 2011 via the FSA’s policy statementPS11/12. References to Basel II within these disclosures in accordance with Basel 2.5.
Basel III A strengthening of the requirements laid out in Basel II, to be phased into the Bank from 2014 ahead of fullimplementation by 2022. Basel III is implemented within the UK through CRD IV.
Basis Points (bps) One hundredth of a per cent (0.01%), so 100 basis points is 1%. Used in quoting movements in interest rates oryields on securities.
Behaviour score (behavioural scorecard) A credit risk scoring system for retail customers assessing the performance of an existing customer’s account.Typically using data from previous performance of a customer’s account and/or credit reference data.
Business and Commercial Banking (BaCB) The Non-core segment of the Bank which specialises in lending to businesses.
Calico Calico Finance Number One Limited
Capital Requirements Capital required under Pillar 1. Capital requirements are 8% of Risk Weighted Assets.
Capital Requirements Directive (CRD) Capital Requirements Directive is a European regulation that applies directly to UK financial institutions, is part ofthe CRD IV package. Broadly, it contains a supervisory framework to ensure firms are able to meet their liabilitiesas they fall due, implementing the Basel III set of reform measure.
Capital Requirements Directive IV (CRD IV) This encompasses both the Capital Requirements Directive (CRD) and Capital Requirements Regulation (CRR) aswell as the PRA’s Policy Statement PS7/13: Strengthening capital standards. CRD IV implements Basel III withinthe European Union (including the UK) and is a strengthening of the requirements laid out in Basel II, with phasedimplementation from 2014, ahead of full implementation by 2022.
Capital Requirements Regulation (CRR) CRR is a European regulation that applies directly to UK financial institutions. Broadly, it implements the Pillar 3aspects of Basel III in relation to capital adequacy and new liquidity requirements. CRR is part of CRD IV.
Capital Resources Regulatory capital held that is eligible to meet capital requirements.
Chief Executive Officer (CEO) Chief Executive Officer
Chief Risk Officer (CRO) Chief Risk Officer
Common Equity Tier 1 Capital (CET1) A CRD IV regulatory measure of financial (capital) strength. Common Equity Tier 1 Capital is the highest quality ofcapital and comprises share capital and associated share premium, and general reserves from retained profits.The book values of goodwill and intangible assets as well as other regulatory adjustments, including the fullamount of expected loss over provisions, are deducted from Common Equity Tier 1 Capital for the purposes ofcapital adequacy.
Common Equity Tier 1 (CET1) ratio Common Equity Tier 1 Capital divided by Risk Weighted Assets.
Co-operative Asset Management (CoAM) The segment that comprises Non-core assets managed for run down or exit.
Counterparty Credit Risk The risk that the counterparty to a transaction could default before the final settlement of the transaction’s cashflows.
Credit Conversion Factor (CCF) The CCF is an estimate of the proportion of undrawn commitments expected to have been drawn down at thepoint of default, and is used within the calculation of EAD.
Credit quality assessment scale Published by the FSA in accordance with the Capital Requirements Regulations 2006 which maps the externalcredit rating provided by eligible ECAIs to credit quality steps.
Advanced Internal Ratings Based (IRB)Approach
68 The Co-operative Bank plc Pillar 3 Disclosures for the year ended 31 December 2015
Glossary
Credit Quality Steps (CQS) A credit quality step is a credit quality assessment scale as set out in the CRR.
Credit Risk The current or prospective risk to earnings and capital arising from a borrower’s failure to meet the terms of anycontract with the Bank or their failure to perform as agreed.
Credit Risk Mitigation (CRM) Reduction of credit risk by application of credit risk mitigants. The Bank utilises collateral and guarantees ascredit risk mitigation.
Default Circumstances in which Probability of Default is taken as 100% for the purposes of the calculation of regulatorycapital and compliance with Basel II. This is defined as where the customer reaches a predefined arrears statusor where the Bank may consider the borrower is unlikely to repay its credit obligation in full without recourse bythe Bank to actions such as realising security.
Encumbrance Encumbrance is an impediment to use of assets, for example a claim against a property by another party.Encumbrance usually impacts the transferability of the asset and can restrict its free use until the encumbranceis removed.
Enhanced Disclosure Task Force (EDTF) The Enhanced Disclosure Task Force (EDTF) is a private sector group established by the Financial Stability Board(FSB) and composed of members representing both the users and preparers of financial reports. It released areport in October 2012 that included thirty-two recommendations for improving bank risk disclosures in theareas of usability, risk governance and risk management, capital adequacy, liquidity and funding, market risk,credit risk and other risks.
European Banking Authority (EBA) European Banking Authority is a European organisation whose main task is to contribute, through the adoption ofbinding Technical Standards (BTS) and Guidelines, to the creation of the European Single Rulebook in banking. TheSingle Rulebook aims at providing a single set of harmonised prudential rules for financial institutions throughoutthe EU, helping create a level playing field and providing high protection to depositors, investors and consumers.
Expected Loss (EL) Expected Loss is the amount estimated under the IRB approach to be lost on current exposures due to potentialdefaults on existing and committed lending over a one year time horizon. Expected loss equals Exposure AtDefault multiplied by Probability of Default (PD) and Loss Given Default (LGD). Expected Loss (EL) percentageequals expected loss divided by Exposure At Default.
Exposure The maximum loss the Bank might suffer if a customer (or counterparty) or a group of connected clients default.
Exposure at Default (EAD) Exposure at Default represents the amount estimated to be outstanding at the time of default. EAD calculatedunder the standardised approach is always reported post credit conversion factors and provisions. Under the IRBapproach the EAD includes undrawn commitments after credit conversion factors.
External Credit Assessment Institution (ECAI) An External Credit Assessment Institution is a credit rating agency e.g. Moody’s, Standard and Poor’s, and Fitch.A credit rating agency (CRA) is a company that assigns credit ratings for issuers of certain types of debtobligations as well as the debt instruments themselves.
FD Finance Director
Financial Services Authority (FSA) An independent body that regulates the financial services industry in the UK. The FSA was replaced as the UK’sfinancial regulator on 1 April 2013 by the Prudential Regulation Authority (PRA) and the Financial ConductAuthority (FCA).
Forbearance The Bank, for reasons relating to the actual or apparent financial stress of a borrower, grants a concessionwhether temporarily or permanently to that borrower. A concession may involve restructuring the contractualterms of a debt (such as an extension of the maturity date or any weakening of the security structure oradjustment/non enforcement of covenants) or payment in some form other than cash, such as an equity interestin the borrower.
Foreign exchange (FX) Foreign exchange is the exchange of one currency for another, or the conversion of one currency into anothercurrency.
Foundation Internal Ratings Based (IRB) Foundation Internal Ratings Based approach uses standard LGD and EAD parameters but PD is estimated by theBank.
General credit risk adjustment According to EBA Credit Risk Adjustments Regulatory Technical Standard (RTS), a general credit risk adjustmentrepresents provisions that need to cover ‘credit risk losses that have not yet materialised’ and for which there is‘currently no evidence that a loss event has occurred’. The Bank does not have any general credit riskadjustments; all of the Bank’s provisions are classified as specific credit risk adjustments.
Impaired Loans Loans where the Bank does not expect to collect all the contractual cash flows or expects to collect them laterthan they are contractually due.
Impairment Allowance A loss allowance held on the balance sheet as a result of the raising of a charge against profit from the incurredloss inherent in the lending book. An impairment loss allowance may be either individual or collective.
The Co-operative Bank plc Pillar 3 Disclosures for the year ended 31 December 2015 69
Glossary continued
Individual Capital Guidance (ICG) The PRA’s statement as to the regulatory capital it expects the Bank to hold. ICG is Pillar 1 plus Pillar 2a.
Individually Impaired Impairment is measured individually for assets that are individually significant with risk.
Interest Rate Risk (IRR) The variability in value borne by an interest bearing asset, such as a loan or a bond, due to variability of interestrates. In general, as rates rise, the price of a fixed rate bond will fall, and vice versa.
The Bank’s own assessment, as part of Basel II requirements, of the levels of capital that it needs to hold inrespect of its regulatory capital requirements (for credit, market and operational risks) and for other risksincluding stress events.
Internal Rating Grade (IRG) For Corporate exposures the Bank has adopted an Internal Rating Based approach in accordance with Basel IIguidelines. Exposures are sanctioned based on an assessment of the risks and are allocated a Risk Grade orRating extracted from a suite of Basel compliant models. These models have been implemented with outputscalibrated to reflect the Corporate portfolio or PRA slotting standards as appropriate. For Treasury exposuresindividual counterparties may be allocated credit ratings obtained from External Credit Assessment Institutions.These ratings combined with expert judgment drive the formulation of internal rating grades ranging from 0 to 10and associated Probability of Default. These internal rating grades form the basis of the Treasury CounterpartyLimit Matrix.
Internal Ratings Based (IRB) Internal Ratings Based is the approach used for measuring exposure to credit risks. IRB approaches are moresophisticated and risk sensitive than the Standardised Approach and may be Foundation or Advanced. IRBapproaches may only be used with PRA permission.
Leverage Ratio A CRD IV measure, calculated as the ratio of Tier 1 Capital to total exposures. Total exposures include on balancesheet items, off-balance sheet items and derivatives. The leverage ratio is a supplementary measure to the risk-based capital requirements and is intended to constrain the build-up of excess leverage in the banking sector.
Liability Management Exercise (LME) Core part of the Bank’s recapitalisation plan in June 2013. The LME involved existing debt and preferenceshareholders exchanging their holding for a combination of equity shares and new lower Tier 2 debt instrumentsas well as issuing new shares for cash.
Liquidity Coverage Ratio (LCR) Liquidity Coverage Ratio introduced under CRD IV, is measuring highly liquid assets against stressed net cashoutflows over a 30 day period.
Loan To Value (LTV) A ratio which expresses the amount of a mortgage as a percentage of the value of the property. The Bankcalculates residential mortgage LTV on an indexed basis (the value of the property is updated on a quarterly basisto reflect changes in the house price index (HPI)).
London Interbank Offered Rate (LIBOR) The interest rate participating banks offer to other banks for loans on the London market.
A LRA PD is reflective of the long run average default rates expected over a full economic cycle. Also referred toas long run PD.
Loss Given Default (LGD) Loss Given Default is a Pillar 1 parameter and represents an estimate of the actual loss that would occur in theevent of default expressed as a percentage of the EAD.
Master Grading Scale Brings together the respective Expected Default Frequency (EDF) from Moody’s KMV RiskCalc and Moody’s KMVCreditEdge models to ensure compliance with Corporate Banking PD.
Minimum Capital Requirement The minimum amount of regulatory capital that the Bank must hold to meet the Pillar 1 capital requirements forcredit, market and operational risk.
Mortgage Backed Securities (MBS) Securities that represent interests in a group of mortgages. Investors in these securities have the right to cashreceived from future interest and/or principal mortgage payments.
Multilateral Development Banks Supranational institutions which provide financial support and professional advice for economic and socialdevelopment activities in developing countries. The term MDBs typically refers to the World Bank Group andRegional Development Banks.
Net Present Value (NPV) Net Present Value represents the present value of the expected future cash in and out flows on an asset orliability.
Net Stable Funding Ratio (NSFR) Net Stable Funding Ratio is a liquidity ratio introduced under CRD IV, measuring the proportion of long term assetswhich are funded by long term or stable funding.
Over-the-Counter (OTC) Derivatives Derivatives contracts that are traded (and privately negotiated) directly between two parties, without goingthrough an exchange or other intermediary. They offer flexibility because, unlike standardised exchange tradedproducts, they can be tailored to fit specific needs.
Past Due Items When a counterparty has failed to make a payment when contractually due.
Long Run Average Probability of Default (LRA PD)
Internal Capital AdequacyAssessment Process (ICAAP)
70 The Co-operative Bank plc Pillar 3 Disclosures for the year ended 31 December 2015
Glossary continued

Probability of Default (PD) Probability of Default, a Pillar 1 parameter under IRB approach, estimates the probability that a borrower willdefault in next 12 months.
Pillar 1 Pillar 1 capital is a prescribed measure of capital required by a bank representing the minimum capitalrequirements. The Pillar 1 capital ratio is calculated using regulatory capital and RWA. The total capital ratio mustbe no lower than 8%.
Pillar 2a Pillar 2a is additional capital that the Bank is required to hold above Pillar 1, for risks not captured within Pillar 1.The Bank’s internal capital adequacy assessment process is an input into this process, but the Bank’s Pillar 2arequirement is ultimately set by the PRA.
Pillar 2b Pillar 2b is the capital that must be held by the Bank in a severe but plausible stress in order to ensure that it cancontinue to meet its Pillar 1 plus Pillar 2a requirements. It is known as the Capital Planning Buffer (CPB) until31 December 2015, and became the PRA buffer from 1 January 2016.
Pillar 2 Pillar 2 is Pillar 2a plus Pillar 2b.
Pillar 3 Pillar 3 covers market discipline. Market discipline takes the form of standard disclosure requirements that areintended to provide information about a bank’s exposure to risks and risk assessment processes. The aim is toprovide a means of disclosure comparable between banks.
Point in time (PiT) Point in time refers to modelling approach which assesses the risk of an account at a single point in time.
Potential Future Exposure (PFE) An add-on to derivative exposure for potential future exposure.
Private Finance Initiatives (PFI’s) Private Finance Initiatives.
Provisions The level of provision that has been raised against its exposures to provide for unrecoverable losses from discretecategories or individual customers.
Probability of Possession Given Default (PPD) Probability of Possession Given Default is the probability that a proportion of mortgages (secured accounts) willgo to repossession.
Prudential Regulation Authority (PRA) The FSA was replaced as the UK’s financial regulator on 1 April 2013 by two new regulatory bodies: the PRA andthe FCA. The PRA, a subsidiary of the Bank of England, is responsible for promoting the stable and prudentoperation of the financial system through regulation of deposit-taking institutions.
Prudent Valuation A deduction under CRD IV from Common Equity Tier 1 capital where the prudent value financial assets measuredat fair value is materially lower than the fair value recognised in the Annual Report.
PV01 Daily calculation of the effect on the Net Present Value (NPV) of Treasury portfolios to both parallel and specificpoint of yield curve stress testing (i.e. non-linear yield curve shifts). Analysis includes daily parallel shifts in yieldcurve rates of +/ – 100 bps with the resultant change in NPVs representing the potential change in portfoliovalues.
Qualifying Revolving Retail Exposures (QRRE) Qualifying Revolving Retail Exposures represents exposures with fluctuating debit or credit balances(i.e. overdrafts or credit cards).
Ratings Based Method The calculation method used by the Bank for exposures to securitisations as defined under the IRB approach. Theapproach uses risk weightings based on ECAI ratings, the granularity of the underlying pool and the seniority ofthe position.
Rating systems System for implementing scorecards and ranking customers/accounts by risk. May also include decisionsystems which use the ratings as a key input.
Regulatory Capital The capital that the Bank holds in accordance with the PRA handbook.
A repurchase agreement that allows a borrower to use a financial security as collateral for a cash loan at a fixedrate of interest. In a repo, the borrower agrees to sell a security to the lender subject to a commitment torepurchase the asset at a specified price on a given date. For the party selling the security (and agreeing torepurchase it in the future) it is a repo; for the party on the other end of the transaction (buying the security andagreeing to sell in the future) it is a reverse repurchase agreement or reverse repo.
Securities that represent an interest in an underlying pool of residential mortgages.
Residual Maturity The remaining period for an exposure from the reporting date to its maturity.
Retail The segment that comprises customer focused products and services for individuals, sole traders and smallpartnerships. This includes mortgages, credit cards, consumer loans, current accounts and savings products.
Risk grade Credit risk score or output from a rating system or model.
Repurchase Agreement (Repo)/ReverseRepurchase Agreement (Reverse Repo)
Residential Mortgage Backed Securities(RMBS)
The Co-operative Bank plc Pillar 3 Disclosures for the year ended 31 December 2015 71
Glossary continued
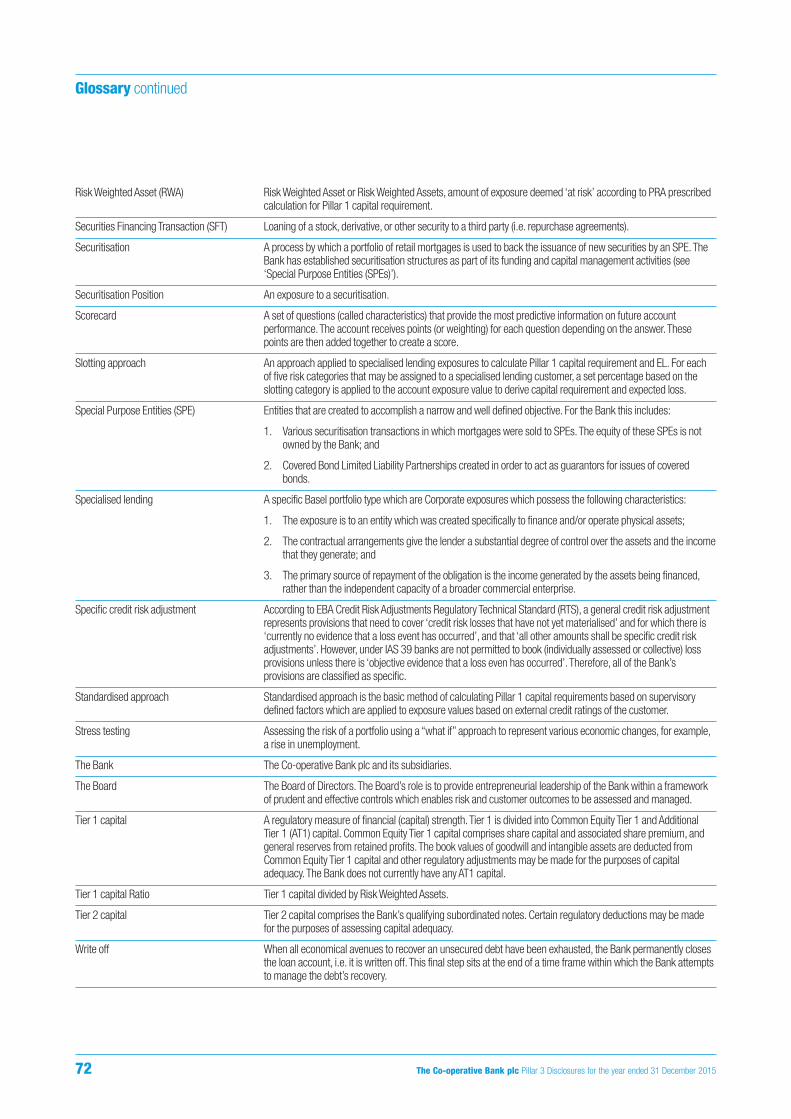
Risk Weighted Asset (RWA) Risk Weighted Asset or Risk Weighted Assets, amount of exposure deemed ‘at risk’ according to PRA prescribedcalculation for Pillar 1 capital requirement.
Securities Financing Transaction (SFT) Loaning of a stock, derivative, or other security to a third party (i.e. repurchase agreements).
Securitisation A process by which a portfolio of retail mortgages is used to back the issuance of new securities by an SPE. TheBank has established securitisation structures as part of its funding and capital management activities (see‘Special Purpose Entities (SPEs)’).
Securitisation Position An exposure to a securitisation.
Scorecard A set of questions (called characteristics) that provide the most predictive information on future accountperformance. The account receives points (or weighting) for each question depending on the answer. Thesepoints are then added together to create a score.
Slotting approach An approach applied to specialised lending exposures to calculate Pillar 1 capital requirement and EL. For eachof five risk categories that may be assigned to a specialised lending customer, a set percentage based on theslotting category is applied to the account exposure value to derive capital requirement and expected loss.
Special Purpose Entities (SPE) Entities that are created to accomplish a narrow and well defined objective. For the Bank this includes:
1. Various securitisation transactions in which mortgages were sold to SPEs. The equity of these SPEs is notowned by the Bank; and
2. Covered Bond Limited Liability Partnerships created in order to act as guarantors for issues of coveredbonds.
Specialised lending A specific Basel portfolio type which are Corporate exposures which possess the following characteristics:
1. The exposure is to an entity which was created specifically to finance and/or operate physical assets;
2. The contractual arrangements give the lender a substantial degree of control over the assets and the incomethat they generate; and
3. The primary source of repayment of the obligation is the income generated by the assets being financed,rather than the independent capacity of a broader commercial enterprise.
Specific credit risk adjustment According to EBA Credit Risk Adjustments Regulatory Technical Standard (RTS), a general credit risk adjustmentrepresents provisions that need to cover ‘credit risk losses that have not yet materialised’ and for which there is‘currently no evidence that a loss event has occurred’, and that ‘all other amounts shall be specific credit riskadjustments’. However, under IAS 39 banks are not permitted to book (individually assessed or collective) lossprovisions unless there is ‘objective evidence that a loss even has occurred’. Therefore, all of the Bank’sprovisions are classified as specific.
Standardised approach Standardised approach is the basic method of calculating Pillar 1 capital requirements based on supervisorydefined factors which are applied to exposure values based on external credit ratings of the customer.
Stress testing Assessing the risk of a portfolio using a “what if” approach to represent various economic changes, for example,a rise in unemployment.
The Bank The Co-operative Bank plc and its subsidiaries.
The Board The Board of Directors.The Board’s role is to provide entrepreneurial leadership of the Bank within a frameworkof prudent and effective controls which enables risk and customer outcomes to be assessed and managed.
Tier 1 capital A regulatory measure of financial (capital) strength. Tier 1 is divided into Common Equity Tier 1 and AdditionalTier 1 (AT1) capital. Common Equity Tier 1 capital comprises share capital and associated share premium, andgeneral reserves from retained profits. The book values of goodwill and intangible assets are deducted fromCommon Equity Tier 1 capital and other regulatory adjustments may be made for the purposes of capitaladequacy. The Bank does not currently have any AT1 capital.
Tier 1 capital Ratio Tier 1 capital divided by Risk Weighted Assets.
Tier 2 capital Tier 2 capital comprises the Bank’s qualifying subordinated notes. Certain regulatory deductions may be madefor the purposes of assessing capital adequacy.
Write off When all economical avenues to recover an unsecured debt have been exhausted, the Bank permanently closesthe loan account, i.e. it is written off. This final step sits at the end of a time frame within which the Bank attemptsto manage the debt’s recovery.
72 The Co-operative Bank plc Pillar 3 Disclosures for the year ended 31 December 2015
Glossary continued
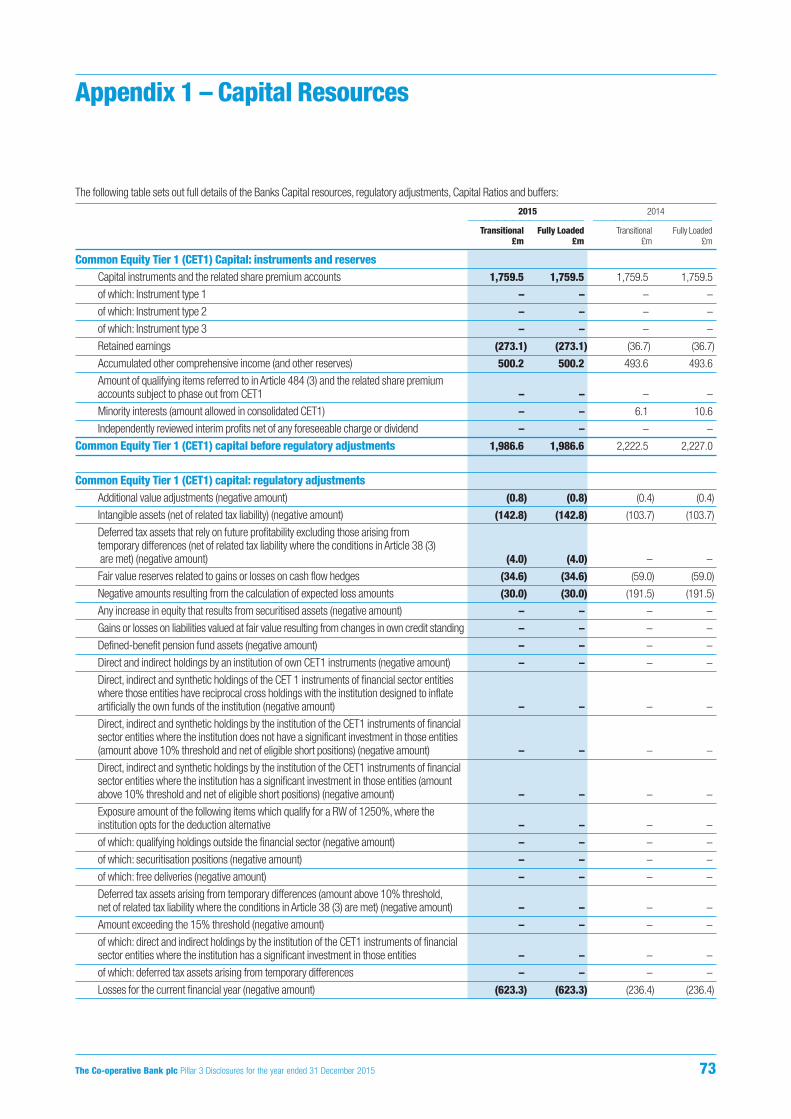
The following table sets out full details of the Banks Capital resources, regulatory adjustments, Capital Ratios and buffers:
2015 2014——–——————————— ——–———————————
Transitional Fully Loaded Transitional Fully Loaded£m £m £m £m
Common Equity Tier 1 (CET1) Capital: instruments and reservesCapital instruments and the related share premium accounts 1,759.5 1,759.5 1,759.5 1,759.5
of which: Instrument type 1 – – – –
of which: Instrument type 2 – – – –
of which: Instrument type 3 – – – –
Retained earnings (273.1) (273.1) (36.7) (36.7)
Accumulated other comprehensive income (and other reserves) 500.2 500.2 493.6 493.6
Amount of qualifying items referred to in Article 484 (3) and the related share premium accounts subject to phase out from CET1 – – – –
Minority interests (amount allowed in consolidated CET1) – – 6.1 10.6
Independently reviewed interim profits net of any foreseeable charge or dividend – – – –
Common Equity Tier 1 (CET1) capital before regulatory adjustments 1,986.6 1,986.6 2,222.5 2,227.0
Common Equity Tier 1 (CET1) capital: regulatory adjustmentsAdditional value adjustments (negative amount) (0.8) (0.8) (0.4) (0.4)
Intangible assets (net of related tax liability) (negative amount) (142.8) (142.8) (103.7) (103.7)
Deferred tax assets that rely on future profitability excluding those arising fromtemporary differences (net of related tax liability where the conditions in Article 38 (3)are met) (negative amount) (4.0) (4.0) – –
Fair value reserves related to gains or losses on cash flow hedges (34.6) (34.6) (59.0) (59.0)
Negative amounts resulting from the calculation of expected loss amounts (30.0) (30.0) (191.5) (191.5)
Any increase in equity that results from securitised assets (negative amount) – – – –
Gains or losses on liabilities valued at fair value resulting from changes in own credit standing – – – –
Defined-benefit pension fund assets (negative amount) – – – –
Direct and indirect holdings by an institution of own CET1 instruments (negative amount) – – – –
Direct, indirect and synthetic holdings of the CET 1 instruments of financial sector entities where those entities have reciprocal cross holdings with the institution designed to inflate artificially the own funds of the institution (negative amount) – – – –
Direct, indirect and synthetic holdings by the institution of the CET1 instruments of financial sector entities where the institution does not have a significant investment in those entities (amount above 10% threshold and net of eligible short positions) (negative amount) – – – –
Direct, indirect and synthetic holdings by the institution of the CET1 instruments of financial sector entities where the institution has a significant investment in those entities (amountabove 10% threshold and net of eligible short positions) (negative amount) – – – –
Exposure amount of the following items which qualify for a RW of 1250%, where the institution opts for the deduction alternative – – – –
of which: qualifying holdings outside the financial sector (negative amount) – – – –
of which: securitisation positions (negative amount) – – – –
of which: free deliveries (negative amount) – – – –
Deferred tax assets arising from temporary differences (amount above 10% threshold, net of related tax liability where the conditions in Article 38 (3) are met) (negative amount) – – – –
Amount exceeding the 15% threshold (negative amount) – – – –
of which: direct and indirect holdings by the institution of the CET1 instruments of financial sector entities where the institution has a significant investment in those entities – – – –
of which: deferred tax assets arising from temporary differences – – – –
Losses for the current financial year (negative amount) (623.3) (623.3) (236.4) (236.4)
The Co-operative Bank plc Pillar 3 Disclosures for the year ended 31 December 2015 73
Appendix 1 – Capital Resources

2015 2014——–——————————— ——–———————————
Transitional Fully Loaded Transitional Fully Loaded£m £m £m £m
Foreseeable tax charges relating to CET1 items (negative amount) – – – –
Regulatory adjustments applied to CET1 in respect of amounts subject to pre-CRR treatment – – – –
Regulatory adjustments relating to unrealised gains and losses pursuant to Articles 467 and 468 – – (24.6) –
of which: filter for unrealised loss 1 – – – –
of which: filter for unrealised loss 2 – – – –
of which: filter for unrealised gain 1 – – – –
of which: filter for unrealised gain 2 – – – –
Amount to be deducted from or added to Common Equity Tier 1 capital with regard to additional filters and deductions required pre CRR – – – –
Qualifying AT1 deductions that exceed the AT1 capital of the institution (negative amount) – – – –
Total regulatory adjustments to Common Equity Tier 1 (CET1) (835.5) (835.5) (615.6) (591.0)
Common Equity Tier 1 (CET1) capital 1,151.1 1,151.1 1,606.9 1,636.0
Additional Tier 1 (AT1) capital: instrumentsCapital instruments and the related share premium accounts – – – –
of which: classified as equity under applicable accounting standards – – – –
of which: classified as liabilities under applicable accounting standards – – – –
Amount of qualifying items referred to in Article 484 (4) and the related share premium accounts subject to phase out from AT1 – – – –
Qualifying Tier 1 capital included in consolidated AT1 capital (including minority interests not included in row 5) issued by subsidiaries and held by third parties – – 22.9 2.3
of which: instruments issued by subsidiaries subject to phase out – – – –
Additional Tier 1 (AT1) capital before regulatory adjustments – – 22.9 2.3
Additional Tier 1 (AT1) capital: regulatory adjustmentsDirect and indirect holdings by an institution of own AT1 instruments (negative amount) – – – –
Direct, indirect and synthetic holdings of the AT1 instruments of financial sector entities where those entities have reciprocal cross holdings with the institution designed to inflate artificially the own funds of the institution (negative amount) – – – –
Direct, indirect and synthetic holdings of the AT1 instruments of financial sector entities where the institution does not have a significant investment in those entities (amount above 10% threshold and net of eligible short positions) (negative amount) – – – –
Direct, indirect and synthetic holdings by the institution of the AT1 instruments of financial sector entities where the institution has a significant investment in those entities (net ofeligible short positions) (negative amount) – – – –
Regulatory adjustments applied to additional tier 1 in respect of amounts subject to pre-CRR treatment and transitional treatments subject to phase out as prescribed in Regulation (EU) No 575/2013 (i.e. CRR residual amounts) – – – –
Residual amounts deducted from AT1 with regard to deduction from CET1 capital during the transitional period pursuant to article 472 of Regulation (EU) No 575/2013 – – – –
of which: items to be detailed line by line e.g. material net interim losses, intangible, shortfall of provisions to expected losses etc – – – –
Residual amounts deducted from AT1 with regard to deduction from T2 capital during the transitional period pursuant to article 472 of Regulation (EU) No 575/2013 – – – –
of which: items to be detailed line by line e.g. reciprocal cross holdings in Tier 2 instruments, direct holdings of non-significant investments in the capital of other financial sector entities etc – – – –
74 The Co-operative Bank plc Pillar 3 Disclosures for the year ended 31 December 2015
Appendix 1 - Capital Resources continued
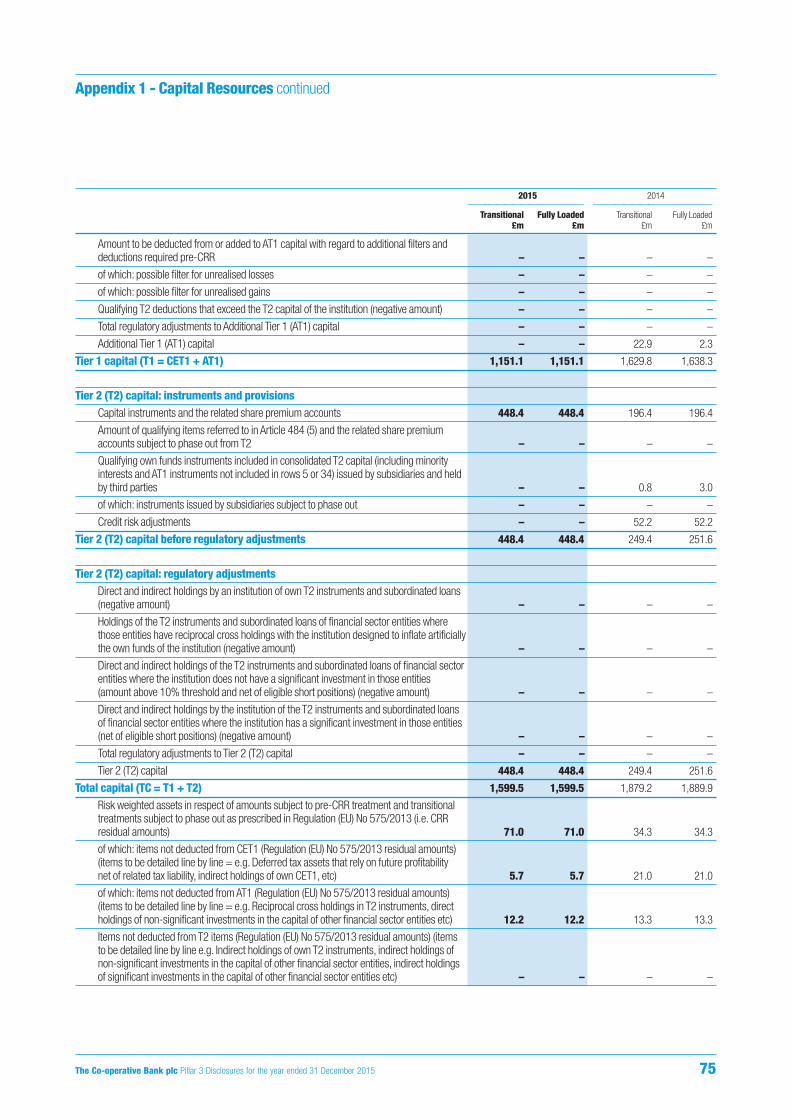
2015 2014——–——————————— ——–———————————
Transitional Fully Loaded Transitional Fully Loaded£m £m £m £m
Amount to be deducted from or added to AT1 capital with regard to additional filters and deductions required pre-CRR – – – –
of which: possible filter for unrealised losses – – – –
of which: possible filter for unrealised gains – – – –
Qualifying T2 deductions that exceed the T2 capital of the institution (negative amount) – – – –
Total regulatory adjustments to Additional Tier 1 (AT1) capital – – – –
Additional Tier 1 (AT1) capital – – 22.9 2.3
Tier 1 capital (T1 = CET1 + AT1) 1,151.1 1,151.1 1,629.8 1,638.3
Tier 2 (T2) capital: instruments and provisionsCapital instruments and the related share premium accounts 448.4 448.4 196.4 196.4
Amount of qualifying items referred to in Article 484 (5) and the related share premium accounts subject to phase out from T2 – – – –
Qualifying own funds instruments included in consolidated T2 capital (including minority interests and AT1 instruments not included in rows 5 or 34) issued by subsidiaries and held by third parties – – 0.8 3.0
of which: instruments issued by subsidiaries subject to phase out – – – –
Credit risk adjustments – – 52.2 52.2
Tier 2 (T2) capital before regulatory adjustments 448.4 448.4 249.4 251.6
Tier 2 (T2) capital: regulatory adjustmentsDirect and indirect holdings by an institution of own T2 instruments and subordinated loans (negative amount) – – – –
Holdings of the T2 instruments and subordinated loans of financial sector entities where those entities have reciprocal cross holdings with the institution designed to inflate artificially the own funds of the institution (negative amount) – – – –
Direct and indirect holdings of the T2 instruments and subordinated loans of financial sector entities where the institution does not have a significant investment in those entities (amount above 10% threshold and net of eligible short positions) (negative amount) – – – –
Direct and indirect holdings by the institution of the T2 instruments and subordinated loans of financial sector entities where the institution has a significant investment in those entities (net of eligible short positions) (negative amount) – – – –
Total regulatory adjustments to Tier 2 (T2) capital – – – –
Tier 2 (T2) capital 448.4 448.4 249.4 251.6
Total capital (TC = T1 + T2) 1,599.5 1,599.5 1,879.2 1,889.9
Risk weighted assets in respect of amounts subject to pre-CRR treatment and transitional treatments subject to phase out as prescribed in Regulation (EU) No 575/2013 (i.e. CRR residual amounts) 71.0 71.0 34.3 34.3
of which: items not deducted from CET1 (Regulation (EU) No 575/2013 residual amounts) (items to be detailed line by line = e.g. Deferred tax assets that rely on future profitability net of related tax liability, indirect holdings of own CET1, etc) 5.7 5.7 21.0 21.0
of which: items not deducted from AT1 (Regulation (EU) No 575/2013 residual amounts) (items to be detailed line by line = e.g. Reciprocal cross holdings in T2 instruments, direct holdings of non-significant investments in the capital of other financial sector entities etc) 12.2 12.2 13.3 13.3
Items not deducted from T2 items (Regulation (EU) No 575/2013 residual amounts) (items to be detailed line by line e.g. Indirect holdings of own T2 instruments, indirect holdings of non-significant investments in the capital of other financial sector entities, indirect holdings of significant investments in the capital of other financial sector entities etc) – – – –
The Co-operative Bank plc Pillar 3 Disclosures for the year ended 31 December 2015 75
Appendix 1 - Capital Resources continued

76 The Co-operative Bank plc Pillar 3 Disclosures for the year ended 31 December 2015
2015 2014——–——————————— ——–———————————
Transitional Fully Loaded Transitional Fully Loaded£m £m £m £m
Total risk weighted assets 7,422.9 7,422.9 12,632.2 12,632.2
Capital ratios and buffersCommon Equity Tier 1 (as a percentage of total risk exposure amount) 15.5% 15.5% 12.7% 13.0%
Tier 1 (as a percentage of total risk exposure amount) 15.5% 15.5% 12.9% 13.0%
Total capital (as a percentage of total risk exposure amount) 21.6% 21.6% 14.9% 15.0%
Institution specific buffer requirement (CET1 requirement in accordance with article 92 (1) (a) plus capital conservation and countercyclical buffer requirements, plus systemic risk buffer, plus systemically important institution buffer expressed as a percentage of risk exposure amount) 4.5% 7.0% 4.0% 7.0%
of which: capital conservation buffer requirement – 2.5% – 2.5%
of which: countercyclical buffer requirement – – – –
of which: systemic risk buffer requirement – – – –
of which: Global Systemically Important Institution (G-SII) or Other Systemically Important Institution (O-SII) buffer – – – –
Common Equity Tier 1 available to meet buffers (as a percentage of risk exposure amount) 9.2% 9.2% 7.0% 7.0%
Amounts below the thresholds for deduction (before risk weighting)Direct and indirect holdings of the capital of financial sector entities where the institution does not have a significant investment in those entities (amount below 10% threshold and net of eligible short positions) 53.0 53.0 – –
Direct and indirect holdings by the institution of the CET1 instruments of financial sector entities where the institution has a significant investment in those entities (amount below 10% threshold and net of eligible short positions) 4.9 4.9 5.3 5.3
Deferred tax assets arising from temporary differences (amount below 10% threshold, netof related tax liability where the conditions in Article 38 (3) are met) – – 21.0 21.0
Applicable caps on the inclusion of provisions in Tier 2Credit risk adjustments included in T2 in respect of exposures subject to standardised approach (prior to the application of the cap) – – – –
Cap on inclusion of credit risk adjustments in T2 under standardised approach 11.5 11.5 21.6 21.6
Credit risk adjustments included in T2 in respect of exposures subject to internal ratings-based approach (prior to the application of the cap) – – 123.0 123.0
Cap for inclusion of credit risk adjustments in T2 under internal ratings-based approach 29.1 29.1 52.2 52.2
– – – –
Capital instruments subject to phase-out arrangements (only applicable between 1 Jan 2014 and 1 Jan 2022)
Current cap on CET1 instruments subject to phase out arrangements – – – –
Amount excluded from CET1 due to cap (excess over cap after redemptions and maturities) – – – –
Current cap on AT1 instruments subject to phase out arrangements – – – –
Amount excluded from AT1 due to cap (excess over cap after redemptions and maturities) – – – –
Current cap on T2 instruments subject to phase out arrangements – – – –
Amount excluded from T2 due to cap (excess over cap after redemptions and maturities)
Appendix 1 - Capital Resources continued
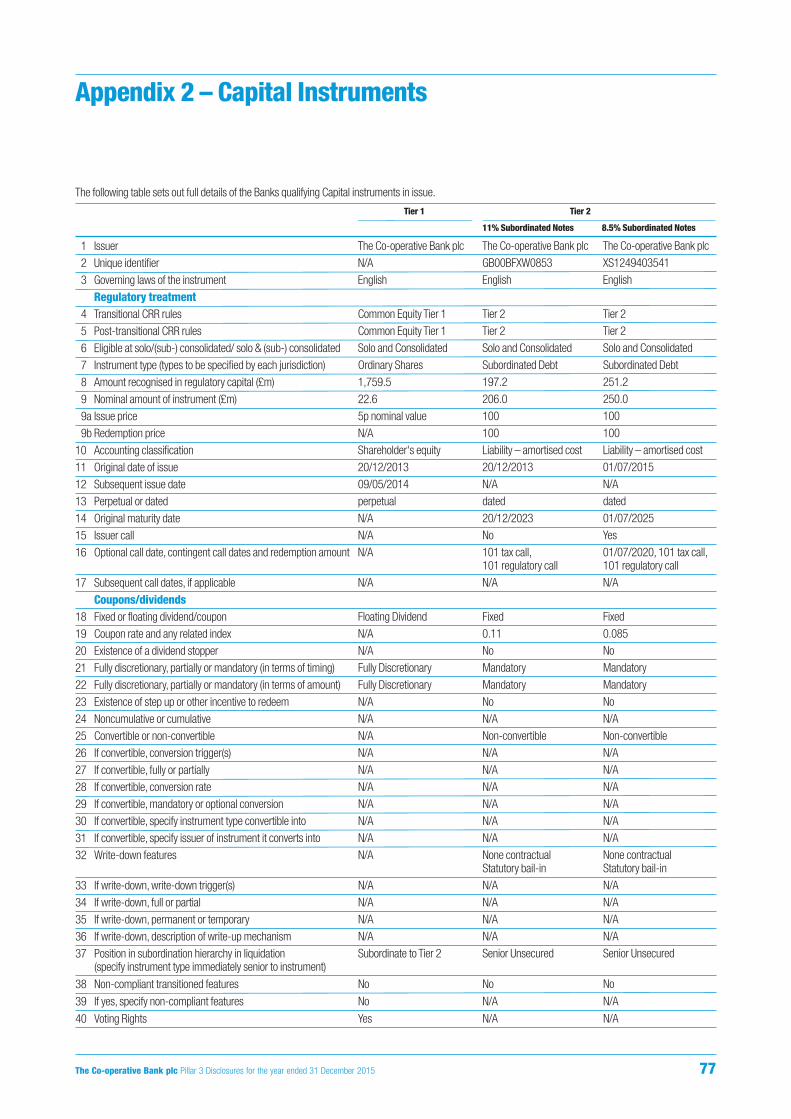
The Co-operative Bank plc Pillar 3 Disclosures for the year ended 31 December 2015 77
The following table sets out full details of the Banks qualifying Capital instruments in issue.
Tier 1 Tier 2—–——––———————— —––––––––––––––––––––––––––––––––––————————
11% Subordinated Notes 8.5% Subordinated Notes
1 Issuer The Co-operative Bank plc The Co-operative Bank plc The Co-operative Bank plc
2 Unique identifier N/A GB00BFXW0853 XS1249403541
3 Governing laws of the instrument English English English
Regulatory treatment4 Transitional CRR rules Common Equity Tier 1 Tier 2 Tier 2
5 Post-transitional CRR rules Common Equity Tier 1 Tier 2 Tier 2
6 Eligible at solo/(sub-) consolidated/ solo & (sub-) consolidated Solo and Consolidated Solo and Consolidated Solo and Consolidated
7 Instrument type (types to be specified by each jurisdiction) Ordinary Shares Subordinated Debt Subordinated Debt
8 Amount recognised in regulatory capital (£m) 1,759.5 197.2 251.2
9 Nominal amount of instrument (£m) 22.6 206.0 250.0
9a Issue price 5p nominal value 100 100
9b Redemption price N/A 100 100
10 Accounting classification Shareholder's equity Liability – amortised cost Liability – amortised cost
11 Original date of issue 20/12/2013 20/12/2013 01/07/2015
12 Subsequent issue date 09/05/2014 N/A N/A
13 Perpetual or dated perpetual dated dated
14 Original maturity date N/A 20/12/2023 01/07/2025
15 Issuer call N/A No Yes
16 Optional call date, contingent call dates and redemption amount N/A 101 tax call, 01/07/2020, 101 tax call,101 regulatory call 101 regulatory call
17 Subsequent call dates, if applicable N/A N/A N/A
Coupons/dividends18 Fixed or floating dividend/coupon Floating Dividend Fixed Fixed
19 Coupon rate and any related index N/A 0.11 0.085
20 Existence of a dividend stopper N/A No No
21 Fully discretionary, partially or mandatory (in terms of timing) Fully Discretionary Mandatory Mandatory
22 Fully discretionary, partially or mandatory (in terms of amount) Fully Discretionary Mandatory Mandatory
23 Existence of step up or other incentive to redeem N/A No No
24 Noncumulative or cumulative N/A N/A N/A
25 Convertible or non-convertible N/A Non-convertible Non-convertible
26 If convertible, conversion trigger(s) N/A N/A N/A
27 If convertible, fully or partially N/A N/A N/A
28 If convertible, conversion rate N/A N/A N/A
29 If convertible, mandatory or optional conversion N/A N/A N/A
30 If convertible, specify instrument type convertible into N/A N/A N/A
31 If convertible, specify issuer of instrument it converts into N/A N/A N/A
32 Write-down features N/A None contractual None contractualStatutory bail-in Statutory bail-in
33 If write-down, write-down trigger(s) N/A N/A N/A
34 If write-down, full or partial N/A N/A N/A
35 If write-down, permanent or temporary N/A N/A N/A
36 If write-down, description of write-up mechanism N/A N/A N/A
37 Position in subordination hierarchy in liquidation Subordinate to Tier 2 Senior Unsecured Senior Unsecured(specify instrument type immediately senior to instrument)
38 Non-compliant transitioned features No No No
39 If yes, specify non-compliant features No N/A N/A
40 Voting Rights Yes N/A N/A
Appendix 2 – Capital Instruments
1. OverviewTable 1 CRD IV key capital ratios
2. Changes to disclosuresTable 2 EDTF disclosure
3. Capital adequacyTable 3 Capital ratios
Table 4 Total capital resources
Table 5 Movement in transitional capital resources during the year
Table 6 Reconciliation of capital resources to statutory balance sheet
Table 7 Pillar 1 capital requirements
Table 8 Flow statement of Risk Weighted Assets
Table 9 Reconciliation of statutory balance sheet to gross drawn creditrisk exposure
Table 10 Reconciliation of gross drawn credit risk exposure to Exposuresat Default
Table 11 Leverage ratio
Table 12 On Balance sheet exposure reconciliation
Table 13 Off-balance sheet exposure reconciliation
4. Risk Management governance
5. Risks and their managementTable 14 Model performance
Table 15 Analysis of EAD by residual contractual maturity
Table 16 Analysis of impaired and past due exposures
Table 17 Analysis of Corporate EAD by sector
Table 18 Foundation IRB EAD by PD band
Table 19 Retail IRB EAD by EL grade
Table 20 Retail IRB RWA by PD grade
Table 21 EAD post CRM calculated under the standardised approach
Table 22 Specialised lending by slotting category
Table 23 IRB exposures covered by collateral
Table 24 Mark-to-Market and Potential Future Exposures
Table 25 Derivative contracts Credit risk exposures
Table 26 Derivative Credit risk exposure maturity
Table 27 Counterparty Credit risk by sector
Table 28 Counterparty Credit risk by rating
Table 29 Counterparty Credit risk by country
Table 30 Encumbered and non-encumbered assets by balance sheetcategory
Table 31 Allowance for impairment
Table 32 Allowance for impairment relating to debt securities
Table 33 Comparison of expected losses to impairment losses
Table 34 Securitisation exposure by rating grade
Table 35 Originated on balance sheet securitisation exposures
Table 36 Securitised notes sold to third party investors
Table 37 Bank’s Liquidity portfolio
Table 38 Non-buffer assets
Table 39 Long term wholesale funding sources
Table 40 Contractual wholesale funding by maturity
Table 41 Contractual cash flows
Table 42 Balance sheet by currency
Table 43 PV01, Basis risk, Swap spreads and FX risk metrics on the Bank’s balances
Appendix 1 Capital Resources
Appendix 2 Capital Instruments
78 The Co-operative Bank plc Pillar 3 Disclosures for the year ended 31 December 2015
Appendix 3 – Tables Index

