the coca-cola company cagny...
TRANSCRIPT
CAGNY 2016
The Coca-Cola CompanyCAGNY 2016
James Quincey, President and Chief Operating OfficerKathy Waller, EVP and Chief Financial Officer
CAGNY 2016
Reconciliation to U.S. GAAP Financial Information
Forward-Looking Statements
The following presentation may include certain "non-GAAP financial measures" as defined in Regulation G under the Securities Exchange Act of 1934. A schedule is posted on the Company's website at www.coca-colacompany.com (in the “Investors” section) which reconciles our results as reported under Generally Accepted Accounting Principles and the non-GAAP financial measures included in the following presentation.
This presentation may contain statements, estimates or projections that constitute “forward-looking statements” as defined under U.S. federal securities laws. Generally, the words “believe,” “expect,” “intend,” “estimate,” “anticipate,” “project,” “will” and similar expressions identify forward-looking statements, which generally are not historical in nature. Forward-looking statements are subject to certain risks and uncertainties that could cause actual results to differ materially from The Coca-Cola Company’s historical experience and our present expectations or projections. These risks include, but are not limited to, obesity concerns; water scarcity and poor quality; evolving consumer preferences; increased competition and capabilities in the marketplace; product safety and quality concerns; perceived negative health consequences of certain ingredients, such as non-nutritive sweeteners and biotechnology-derived substances, and of other substances present in our beverage products or packaging materials; increased demand for food products and decreased agricultural productivity; changes in the retail landscape or the loss of key retail or foodservice customers; an inability to expand operations in emerging and developing markets; fluctuations in foreign currency exchange rates; interest rate increases; an inability to maintain good relationships with our bottling partners; a deterioration in our bottling partners' financial condition; increases in income tax rates, changes in income tax laws or unfavorable resolution of tax matters; increased or new indirect taxes in the United States or in other major markets; increased cost, disruption of supply or shortage of energy or fuels; increased cost, disruption of supply or shortage of ingredients, other raw materials or packaging materials; changes in laws and regulations relating to beverage containers and packaging; significant additional labeling or warning requirements or limitations on the availability of our products; an inability to protect our information systems against service interruption, misappropriation of data or breaches of security; unfavorable general economic conditions in the United States; unfavorable economic and political conditions in international markets; litigation or legal proceedings; adverse weather conditions; climate change; damage to our brand image and corporate reputation from negative publicity, even if unwarranted, related to product safety or quality, human and workplace rights, obesity or other issues; changes in, or failure to comply with, the laws and regulations applicable to our products or our business operations; changes in accounting standards; an inability to achieve our overall long-term growth objectives; deterioration of global credit market conditions; default by or failure of one or more of our counterparty financial institutions; an inability to timely implement our previously announced actions to reinvigorate growth, or to realize the economic benefits we anticipate from these actions; failure to realize a significant portion of the anticipated benefits of our strategic relationships with Keurig Green Mountain, Inc. and Monster Beverage Corporation; an inability to renew collective bargaining agreements on satisfactory terms, or we or our bottling partners experience strikes, work stoppages or labor unrest; future impairment charges; multi-employer plan withdrawal liabilities in the future; an inability to successfully integrate and manage our Company-owned or -controlled bottling operations; an inability to successfully manage the possible negative consequences of our productivity initiatives; global or regional catastrophic events; and other risks discussed in our Company’s filings with the Securities and Exchange Commission (SEC), including our Annual Report on Form 10-K for the year ended December 31, 2014 and our subsequently filed Quarterly Reports on Form 10-Q, which filings are available from the SEC. You should not place undue reliance on forward-looking statements, which speak only as of the date they are made. The Coca-Cola Company undertakes no obligation to publicly update or revise any forward-looking statements.
2
Topics for Discussion
Setting the Stage
Accelerating Our Actions
Evolving Our Growth
Reviewing the Financials

CAGNY 2016
Setting the Stage
4
CAGNY 2016
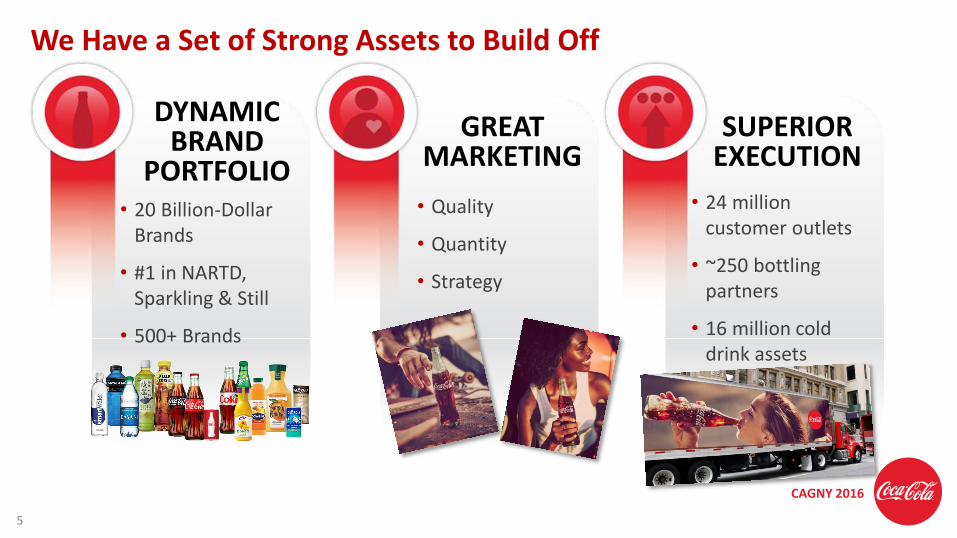
We Have a Set of Strong Assets to Build Off
5
GREATMARKETING
SUPERIOREXECUTION
DYNAMICBRAND
PORTFOLIO• 20 Billion-Dollar
Brands
• #1 in NARTD, Sparkling & Still
• 500+ Brands
• Quality
• Quantity
• Strategy
• 24 million customer outlets
• ~250 bottling partners
• 16 million cold drink assets
CAGNY 2016
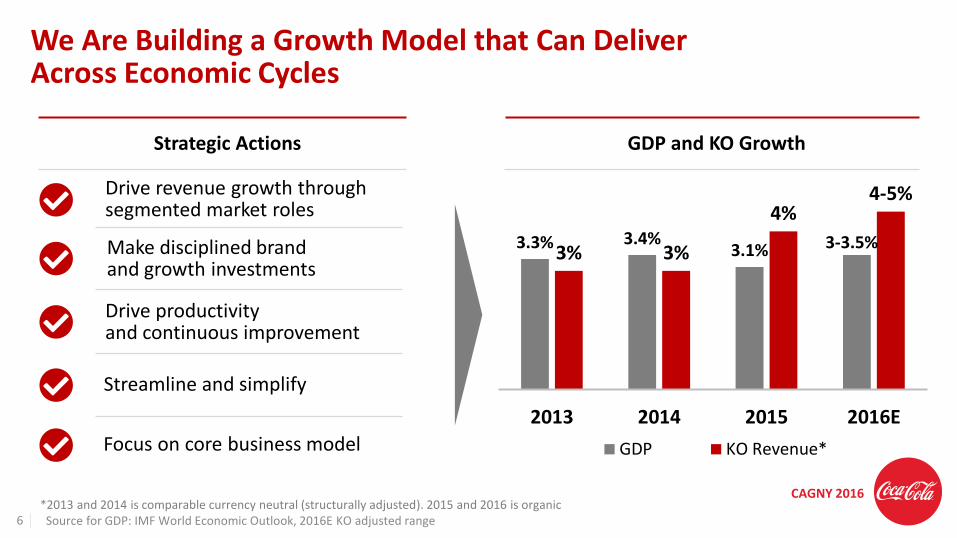
We Are Building a Growth Model that Can Deliver Across Economic Cycles
*2013 and 2014 is comparable currency neutral (structurally adjusted). 2015 and 2016 is organic Source for GDP: IMF World Economic Outlook, 2016E KO adjusted range
Strategic Actions GDP and KO Growth
3.3% 3.4%3.1% 3-3.5%
3% 3%
4%4-5%
2013 2014 2015 2016E
GDP KO Revenue*
6
Focus on core business model
Drive productivity and continuous improvement
Streamline and simplify
Make disciplined brand and growth investments
Drive revenue growth through segmented market roles
CAGNY 2016
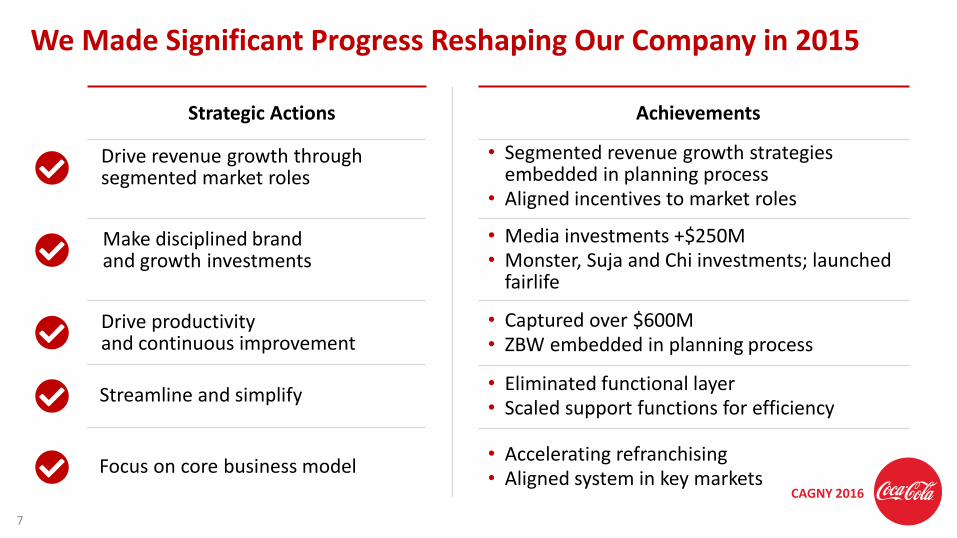
We Made Significant Progress Reshaping Our Company in 2015
Focus on core business model
Drive productivity and continuous improvement
Streamline and simplify
Make disciplined brand and growth investments
Drive revenue growth through segmented market roles
• Segmented revenue growth strategies embedded in planning process
• Aligned incentives to market roles
• Captured over $600M• ZBW embedded in planning process
• Media investments +$250M• Monster, Suja and Chi investments; launched
fairlife
• Eliminated functional layer• Scaled support functions for efficiency
• Accelerating refranchising• Aligned system in key markets
Strategic Actions Achievements
7
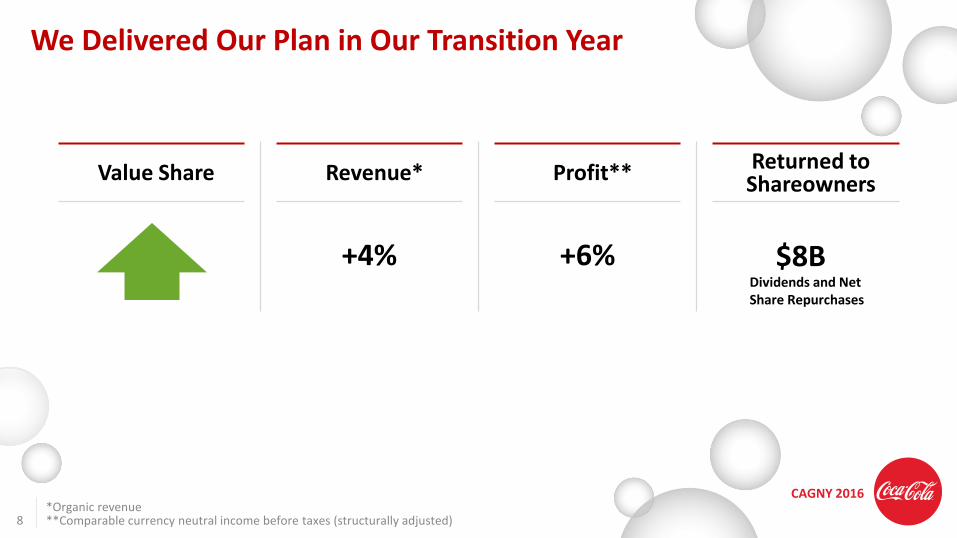
CAGNY 2016*Organic revenue**Comparable currency neutral income before taxes (structurally adjusted)
We Delivered Our Plan in Our Transition Year
Value Share Revenue* Profit** Returned to Shareowners
+4% +6% $8BDividends and Net Share Repurchases
8
CAGNY 2016
Accelerating Our Actions
9

CAGNY 2016
We Are Transforming the Company to Focus on Our Core Value Creation Model:
10
Lower Risk, Higher Return Businesswith Greater Confidence to
Achieve Our Long-Term Growth Targets
• Building Strong Brands
• Driving Customer Value
• Leading Our Franchise System
CAGNY 2016
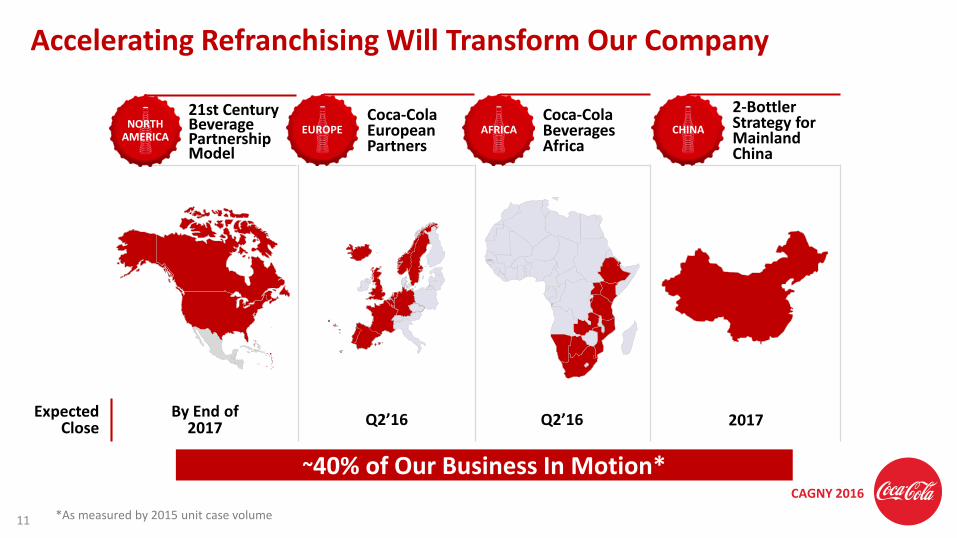
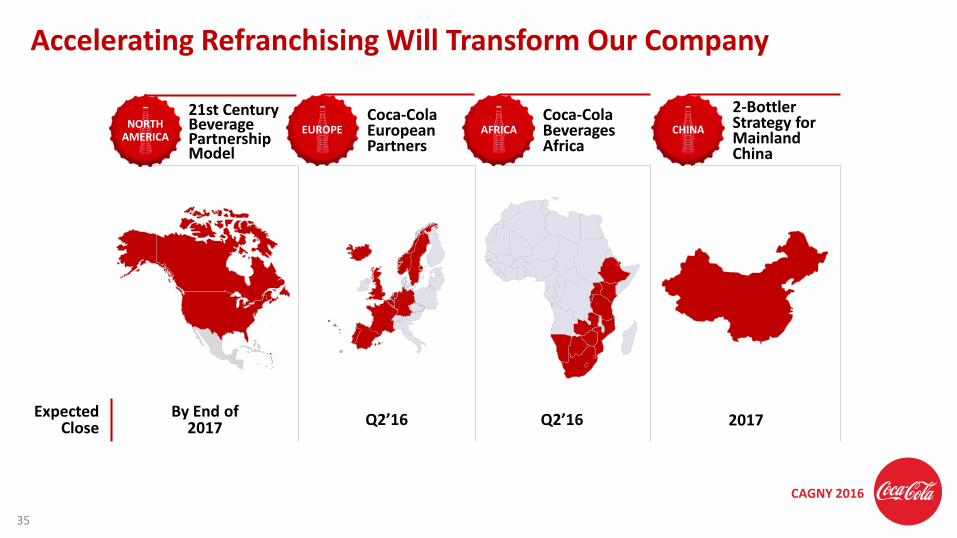
Expected Close
By End of 2017 Q2’16 Q2’16 2017
Accelerating Refranchising Will Transform Our Company
21st Century Beverage Partnership Model
NORTH AMERICA
EUROPECoca-Cola European Partners
AFRICACoca-Cola Beverages Africa
CHINACHINA
2-Bottler Strategy for Mainland China
11
~40% of Our Business In Motion*
*As measured by 2015 unit case volume
CAGNY 2016
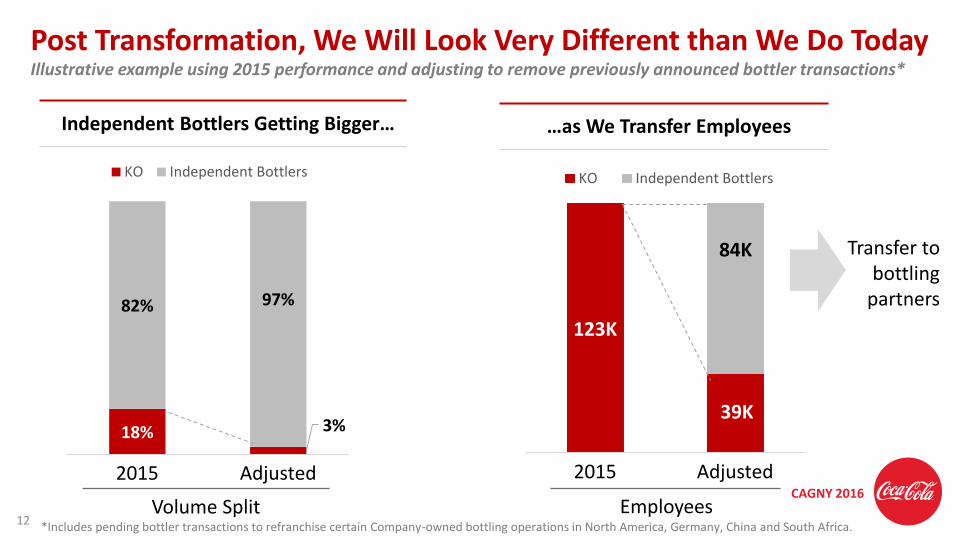
18% 3%
82% 97%
2015 Adjusted
KO Independent Bottlers
Post Transformation, We Will Look Very Different than We Do Today
12
123K
39K
2015 Adjusted
KO Independent Bottlers
84K
Illustrative example using 2015 performance and adjusting to remove previously announced bottler transactions*
Independent Bottlers Getting Bigger… …as We Transfer Employees
Volume Split
Transfer to bottling
partners
Employees*Includes pending bottler transactions to refranchise certain Company-owned bottling operations in North America, Germany, China and South Africa.
CAGNY 2016
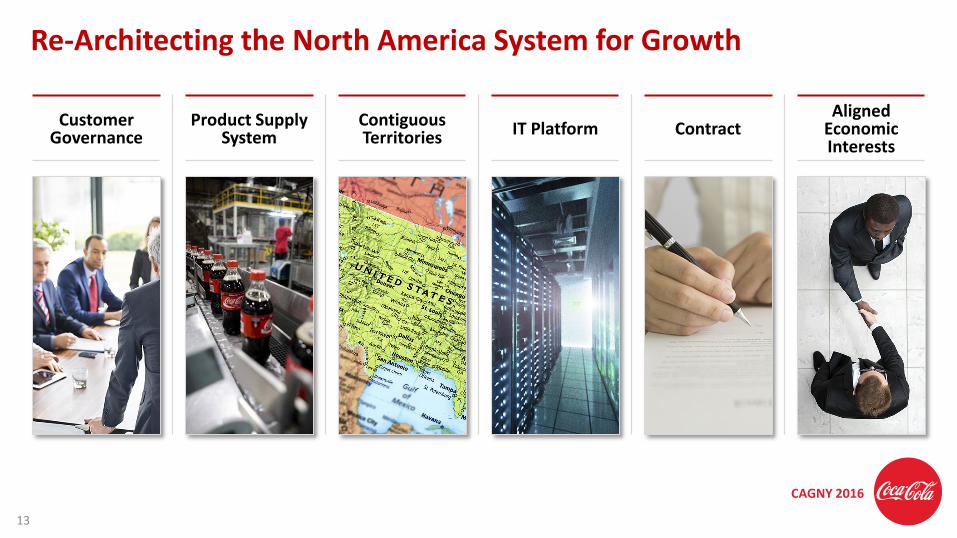
Re-Architecting the North America System for Growth
13
Customer Governance
Product Supply System IT Platform Contract
Aligned Economic Interests
Contiguous Territories
CAGNY 2016
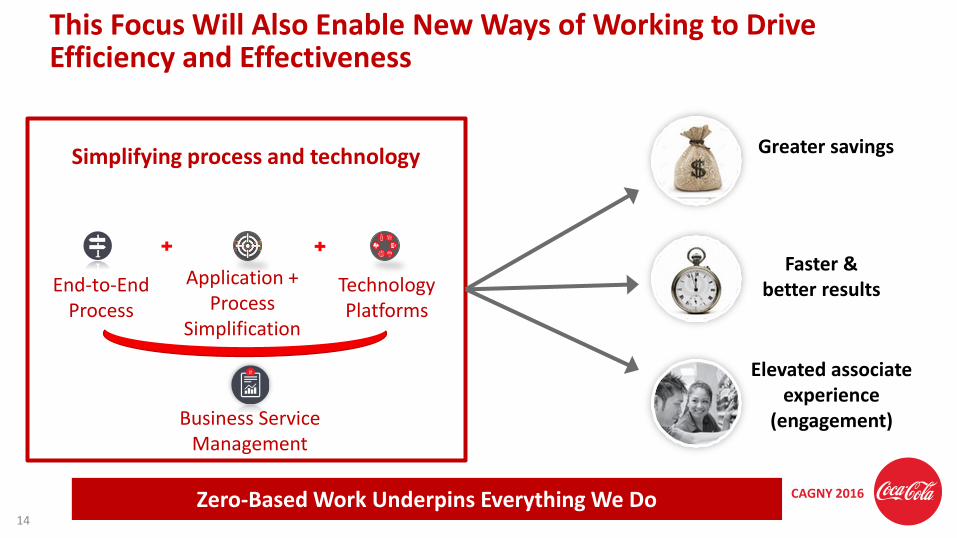
This Focus Will Also Enable New Ways of Working to Drive Efficiency and Effectiveness
14
Business ServiceManagement
Application + Process
Simplification
Technology Platforms
End-to-End Process
Simplifying process and technology
Faster & better results
Elevated associate experience
(engagement)
Greater savings
Zero-Based Work Underpins Everything We Do
CAGNY 2016
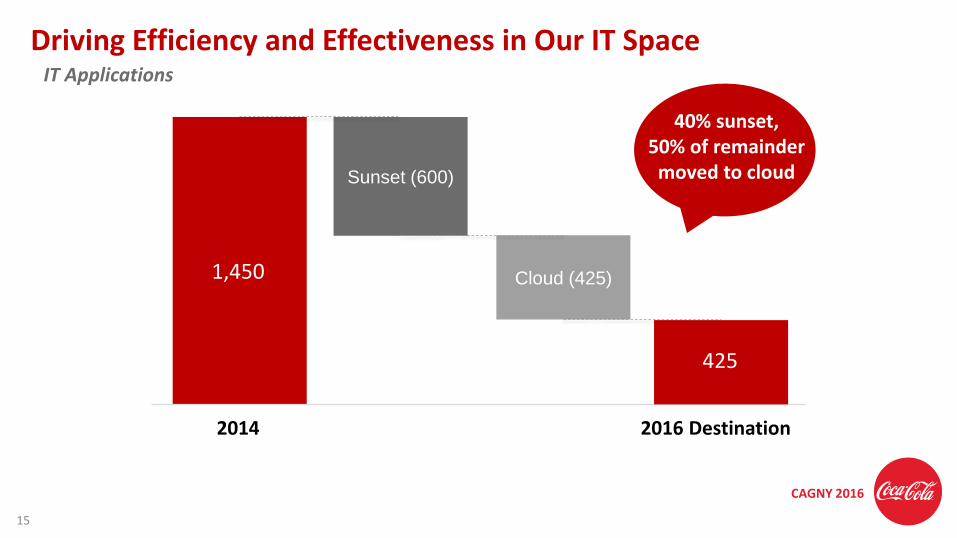
Driving Efficiency and Effectiveness in Our IT Space
15
2014
1,450
425
Sunset (600)
2016 Destination
Cloud (425)
40% sunset,50% of remainder
moved to cloud
IT Applications
CAGNY 2016
Evolving Our Growth
16
CAGNY 2016
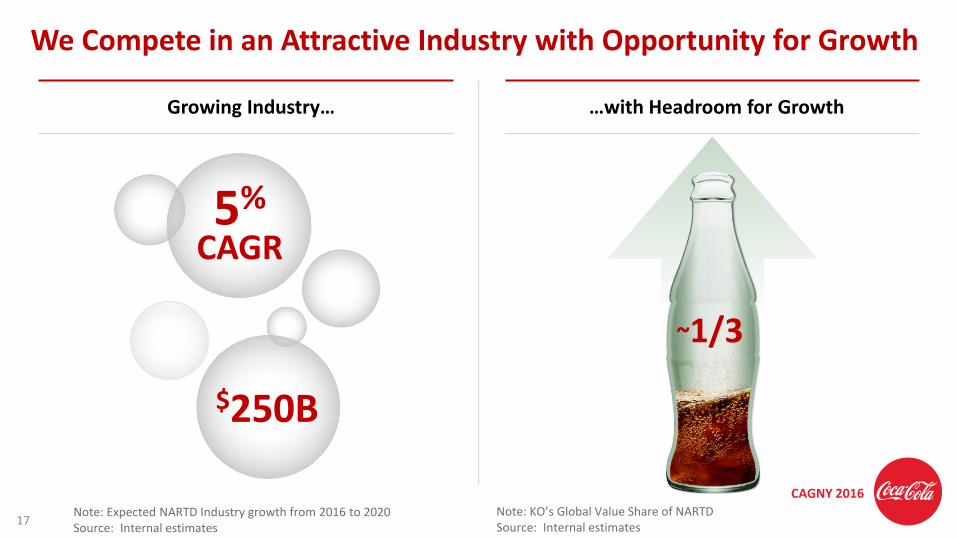
Growing Industry… …with Headroom for Growth
We Compete in an Attractive Industry with Opportunity for Growth
~1/3
5%
CAGR
$250B
Note: Expected NARTD Industry growth from 2016 to 2020Source: Internal estimates
Note: KO’s Global Value Share of NARTDSource: Internal estimates
17
CAGNY 2016
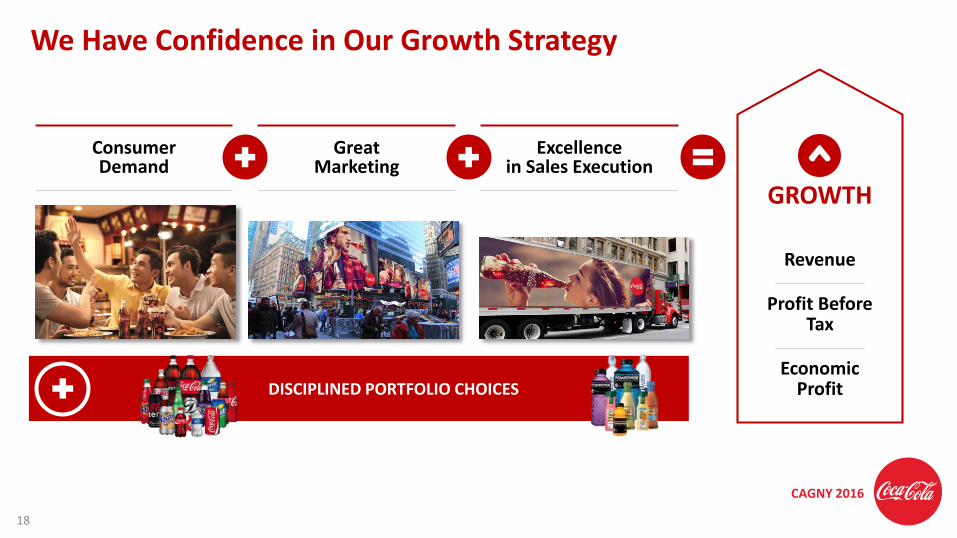
ConsumerDemand
GreatMarketing
Excellencein Sales Execution
DISCIPLINED PORTFOLIO CHOICES
GROWTH
We Have Confidence in Our Growth Strategy
18
Revenue
Profit Before Tax
Economic Profit
CAGNY 2016
Consistency in Marketing & Execution is the Objective
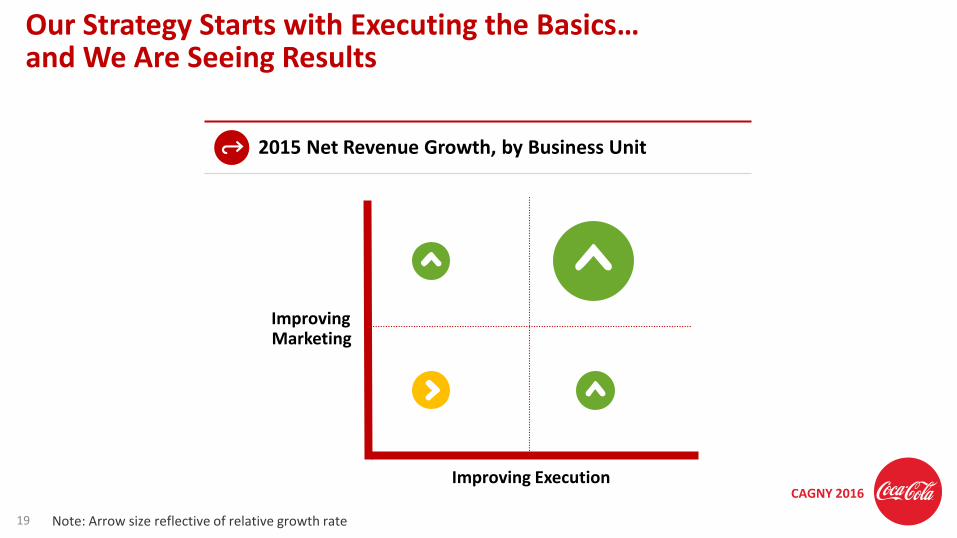
Our Strategy Starts with Executing the Basics…and We Are Seeing Results
19
Improving Execution
ImprovingMarketing
2015 Net Revenue Growth, by Business Unit
Improving Execution
ImprovingMarketing
Note: Arrow size reflective of relative growth rate
CAGNY 2016
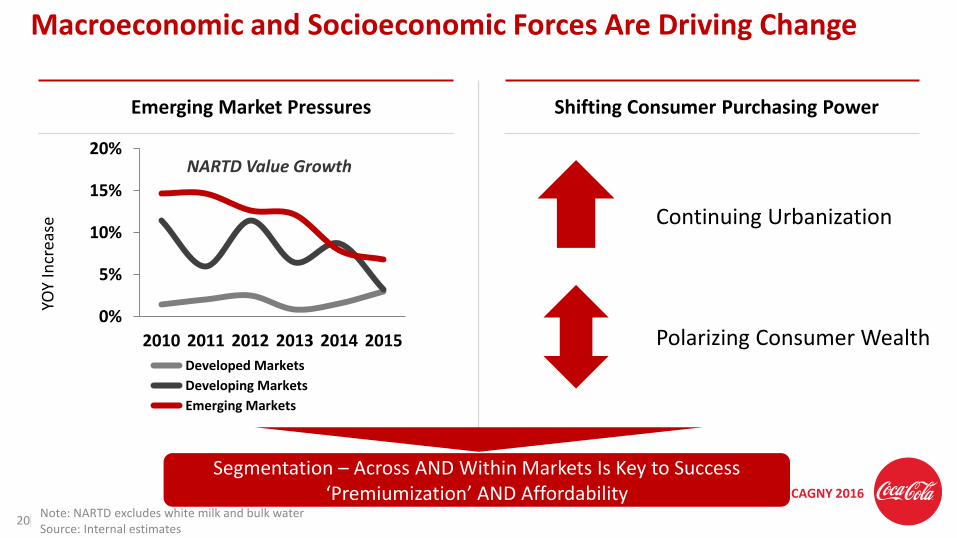
0%
5%
10%
15%
20%
2010 2011 2012 2013 2014 2015
Developed Markets
Developing Markets
Emerging Markets
Note: NARTD excludes white milk and bulk waterSource: Internal estimates
YOY
Incr
ease
Macroeconomic and Socioeconomic Forces Are Driving Change
Emerging Market Pressures Shifting Consumer Purchasing Power
20
Continuing Urbanization
Polarizing Consumer Wealth
Segmentation – Across AND Within Markets Is Key to Success‘Premiumization’ AND Affordability
NARTD Value Growth
CAGNY 2016
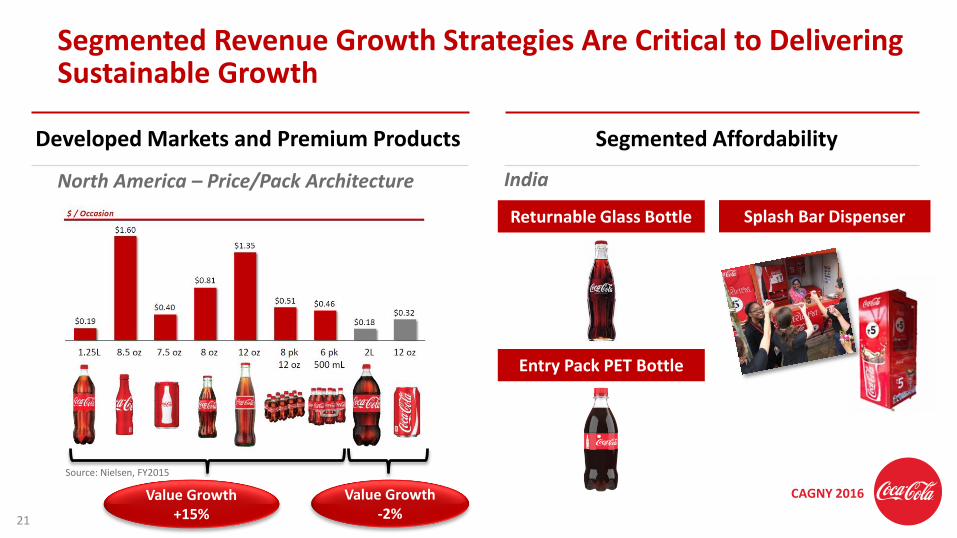
Segmented Revenue Growth Strategies Are Critical to Delivering Sustainable Growth
India
21
Developed Markets and Premium Products Segmented Affordability
Value Growth -2%
Value Growth +15%
North America – Price/Pack Architecture
Returnable Glass Bottle
Source: Nielsen, FY2015
Splash Bar Dispenser
Entry Pack PET Bottle
CAGNY 2016
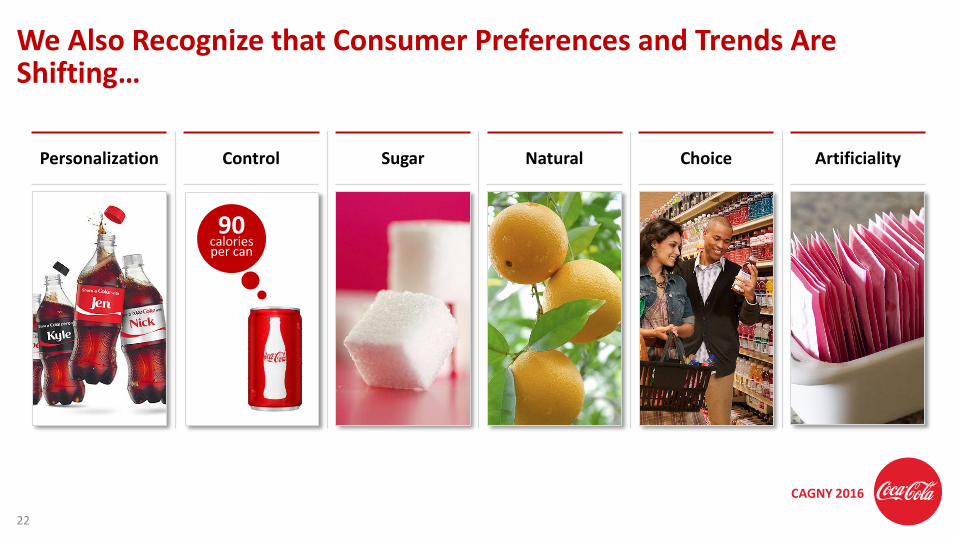
We Also Recognize that Consumer Preferences and Trends Are Shifting…
Personalization Control Sugar Natural Choice Artificiality
22
90caloriesper can
CAGNY 2016
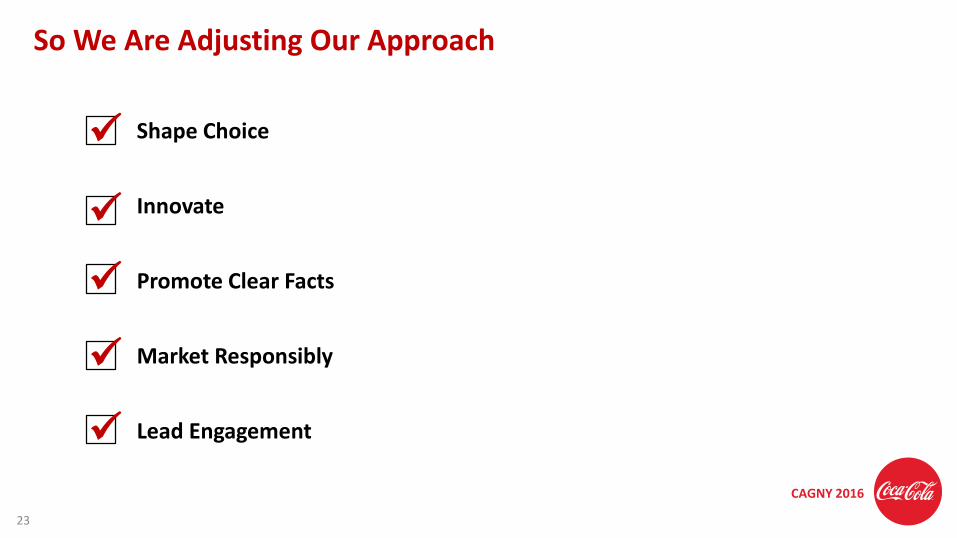
Shape Choice
Innovate
Promote Clear Facts
Market Responsibly
Lead Engagement
So We Are Adjusting Our Approach
23
CAGNY 2016
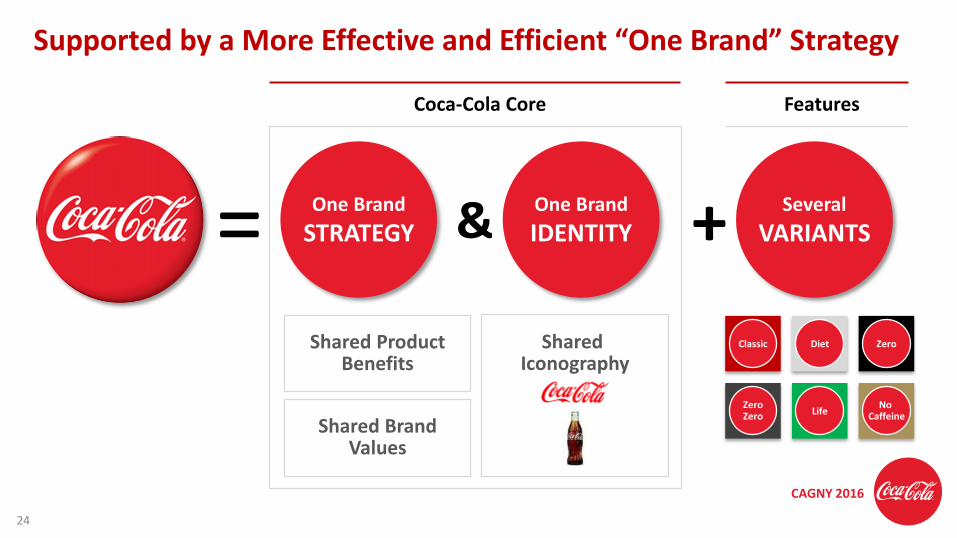
Supported by a More Effective and Efficient “One Brand” Strategy
= One Brand
STRATEGYOne Brand
IDENTITYSeveral
VARIANTS& +
Shared Product Benefits
Shared Brand Values
Shared Iconography
Classic Diet Zero
Zero Zero Life
No Caffeine
Coca-Cola Core Features
24
CAGNY 2016
Taste the Feeling – Integral Part of “One Brand” Strategy
25
CAGNY 2016
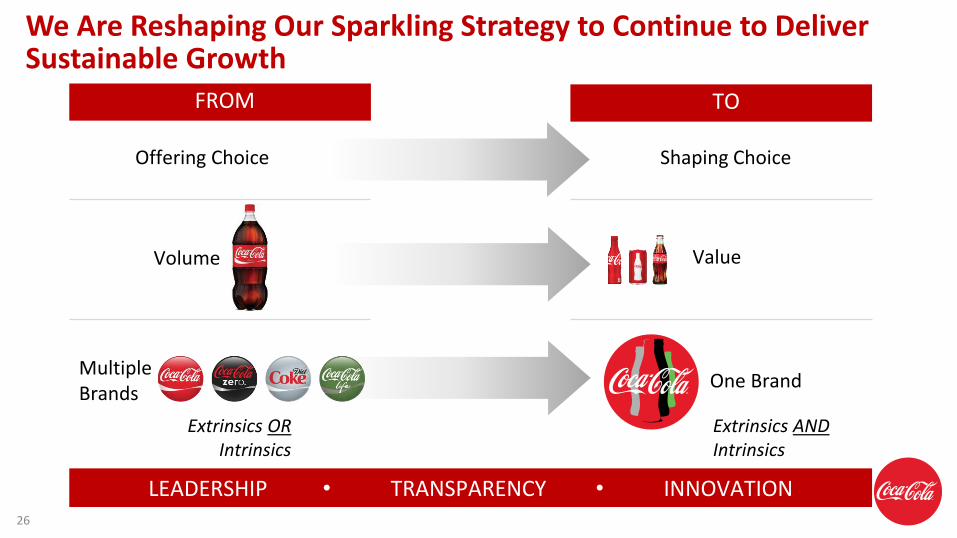
We Are Reshaping Our Sparkling Strategy to Continue to Deliver Sustainable Growth
LEADERSHIP • TRANSPARENCY • INNOVATION
FROM TO
Volume Value
Extrinsics ORIntrinsics
Extrinsics ANDIntrinsics
Offering Choice Shaping Choice
Multiple Brands
One Brand
26
CAGNY 2016
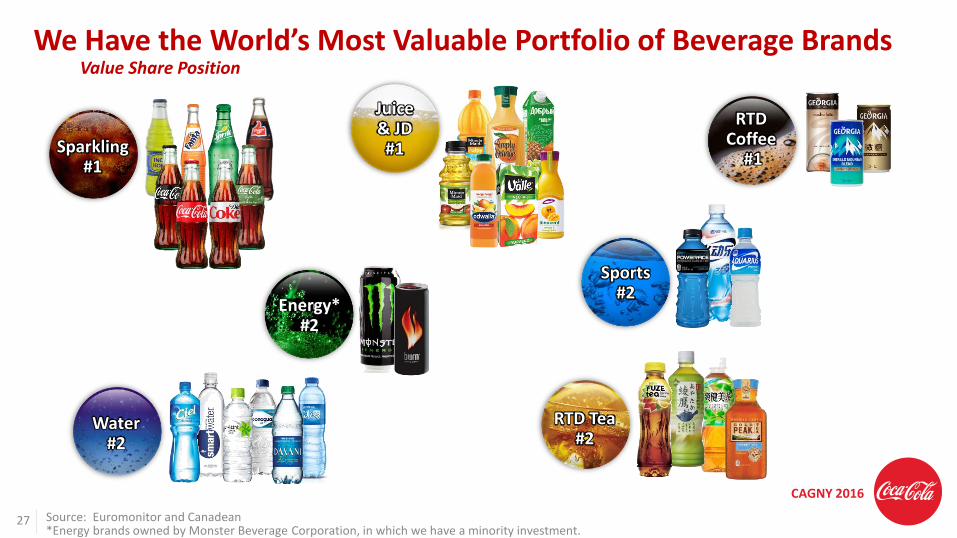
Value Share PositionWe Have the World’s Most Valuable Portfolio of Beverage Brands
Sparkling#1
Juice& JD#1
Water#2
RTD Tea#2
Sports#2
RTD Coffee
#1
Energy*#2
27 Source: Euromonitor and Canadean*Energy brands owned by Monster Beverage Corporation, in which we have a minority investment.
CAGNY 2016
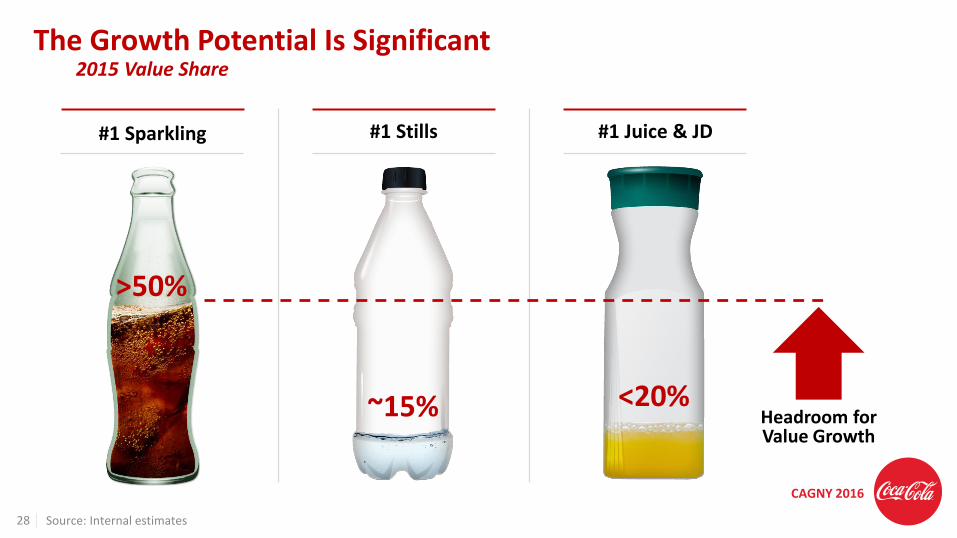
2015 Value ShareThe Growth Potential Is Significant
28
>50%
~15% <20%
#1 Juice & JD#1 Stills#1 Sparkling
Headroom for Value Growth
Source: Internal estimates
CAGNY 2016
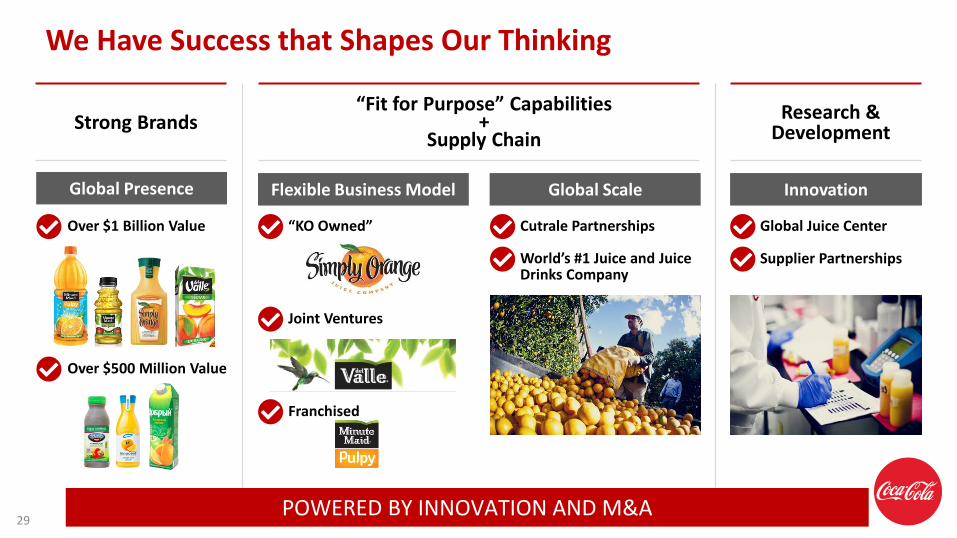
We Have Success that Shapes Our Thinking
Flexible Business Model Global Scale
“KO Owned”
Joint Ventures
Franchised
Cutrale Partnerships
World’s #1 Juice and Juice Drinks Company
Global Presence
Over $1 Billion Value
Over $500 Million Value
Strong Brands“Fit for Purpose” Capabilities
+ Supply Chain
Innovation
Global Juice Center
Supplier Partnerships
Research & Development
29POWERED BY INNOVATION AND M&A
CAGNY 2016
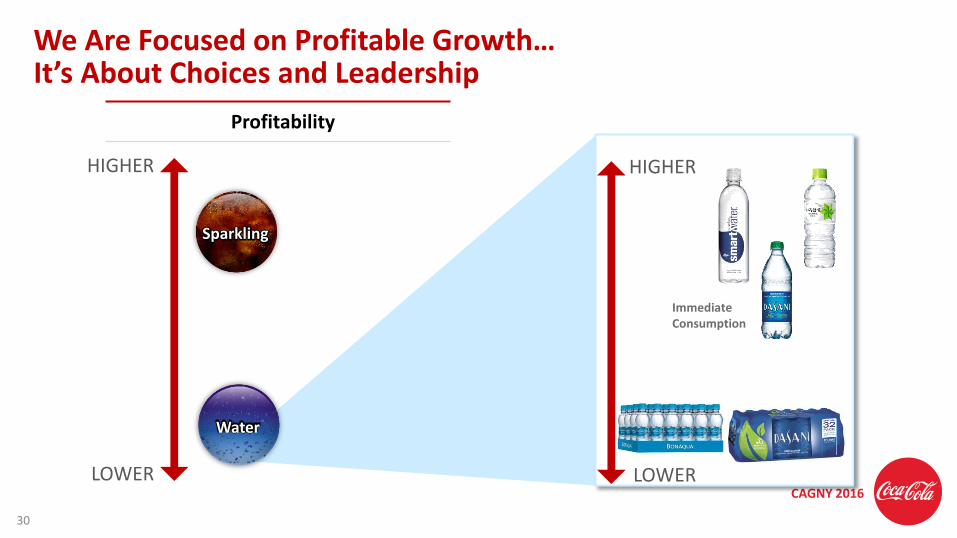
We Are Focused on Profitable Growth… It’s About Choices and Leadership
HIGHER
LOWER
Profitability
Water
HIGHER
LOWER
Immediate Consumption
30
Sparkling
CAGNY 2016
Scale Fast
We Are Building a Culture of Speed and Agility
Think Big
Start Small
31
CAGNY 2016
• Building brands
• Driving customer value
• Leading the system
We Are Clear on Our Role and Path Forward
• Long-term outlook is positive
• Right strategies to navigate near-term volatility
Focused Role
System Well Positioned for the Future
32
CAGNY 2016
REVIEWING THE FINANCIALS
33
CAGNY 2016
We Are Becoming a Lower Risk, Higher Return Business
with Greater Confidence to Achieve Our Long-Term Growth Targets
34
CAGNY 2016
Expected Close
By End of 2017 Q2’16 Q2’16 2017
Accelerating Refranchising Will Transform Our Company
21st Century Beverage Partnership Model
NORTH AMERICA
EUROPECoca-Cola European Partners
AFRICACoca-Cola Beverages Africa
CHINACHINA
2-Bottler Strategy for Mainland China
35
CAGNY 2016
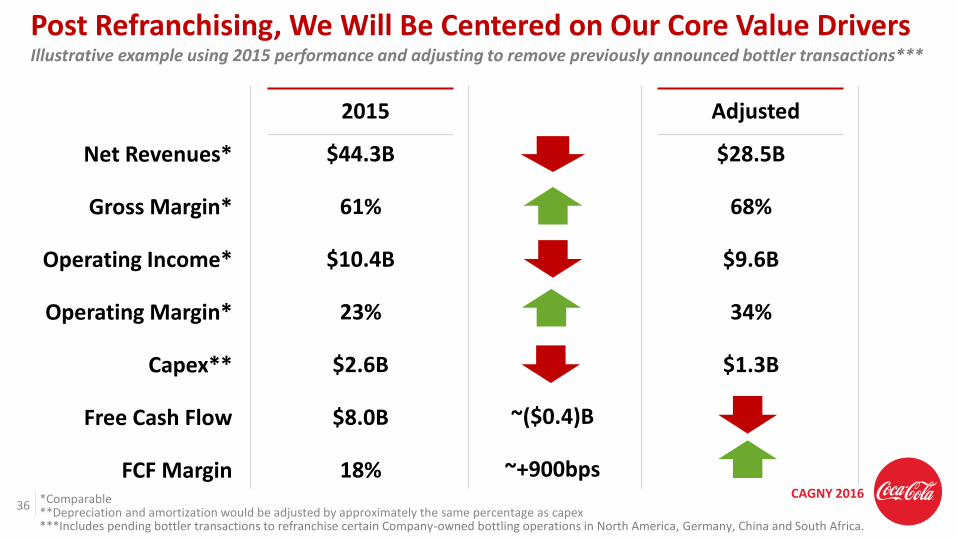
Net Revenues*
Gross Margin*
Operating Income*
Operating Margin*
Capex**
Free Cash Flow
FCF Margin
$44.3B
61%
$10.4B
23%
$2.6B
$8.0B
18%
$28.5B
68%
$9.6B
34%
$1.3B
*Comparable**Depreciation and amortization would be adjusted by approximately the same percentage as capex***Includes pending bottler transactions to refranchise certain Company-owned bottling operations in North America, Germany, China and South Africa.
Illustrative example using 2015 performance and adjusting to remove previously announced bottler transactions***
Post Refranchising, We Will Be Centered on Our Core Value Drivers
2015 Adjusted
36
~($0.4)B
~+900bps
CAGNY 2016
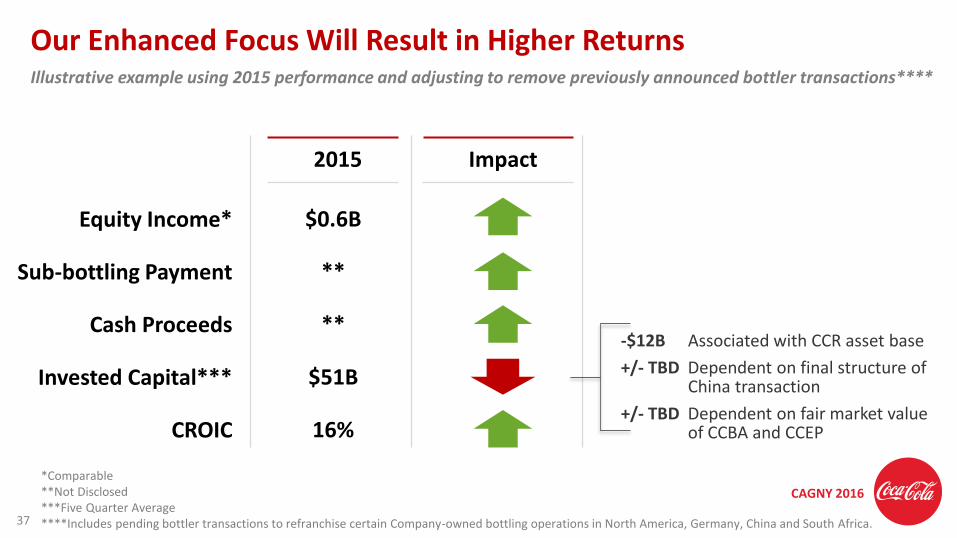
-$12B Associated with CCR asset base
+/- TBD Dependent on final structure of China transaction
+/- TBD Dependent on fair market value of CCBA and CCEP
Illustrative example using 2015 performance and adjusting to remove previously announced bottler transactions****
Our Enhanced Focus Will Result in Higher Returns
Equity Income*
Sub-bottling Payment
Cash Proceeds
Invested Capital***
CROIC
$0.6B
**
**
$51B
16%
2015 Impact
37
*Comparable**Not Disclosed***Five Quarter Average****Includes pending bottler transactions to refranchise certain Company-owned bottling operations in North America, Germany, China and South Africa.
CAGNY 2016
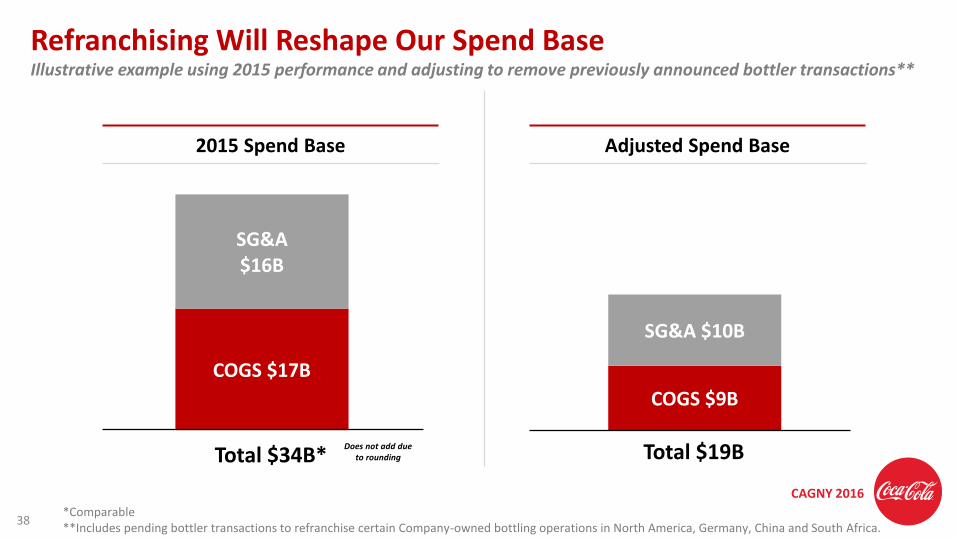
Refranchising Will Reshape Our Spend Base
38
Total $34B* Total $19B
2015 Spend Base Adjusted Spend Base
Illustrative example using 2015 performance and adjusting to remove previously announced bottler transactions**
COGS $17B
COGS $9B
SG&A$16B
SG&A $10B
*Comparable**Includes pending bottler transactions to refranchise certain Company-owned bottling operations in North America, Germany, China and South Africa.
Does not add due to rounding
CAGNY 2016
40%
60%
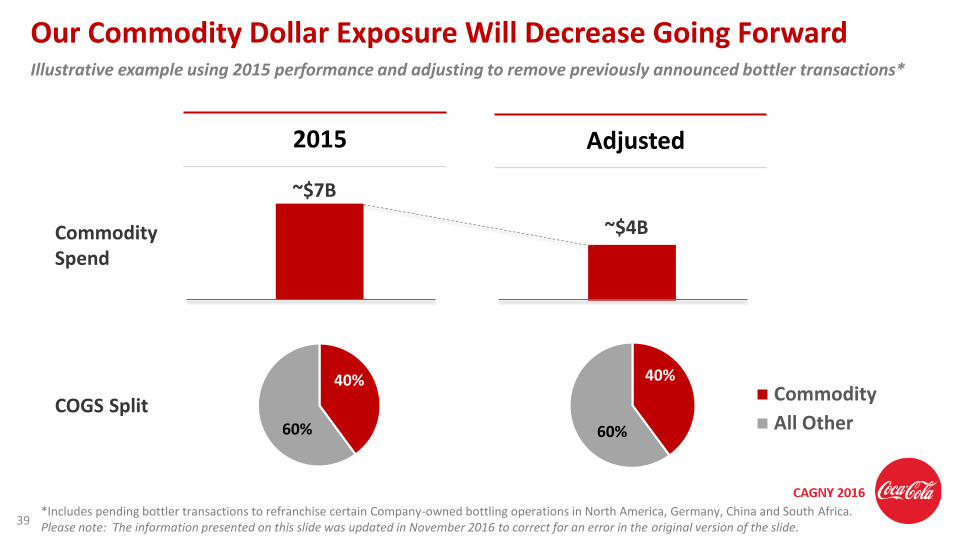
Our Commodity Dollar Exposure Will Decrease Going Forward
2015 Adjusted
40%
60%
Commodity
All OtherCOGS Split
39
Illustrative example using 2015 performance and adjusting to remove previously announced bottler transactions*
~$7B
~$4BCommodity Spend
*Includes pending bottler transactions to refranchise certain Company-owned bottling operations in North America, Germany, China and South Africa.Please note: The information presented on this slide was updated in November 2016 to correct for an error in the original version of the slide.
CAGNY 2016
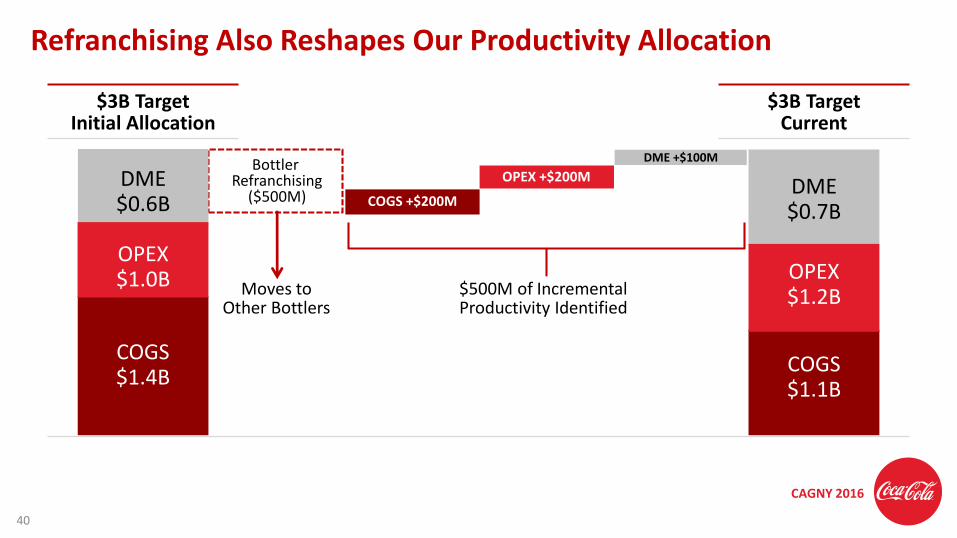
Bottler Refranchising
($500M)OPEX +$200M
COGS +$200M
DME +$100M
Moves to Other Bottlers
$500M of Incremental Productivity Identified
DME$0.7B
$3B TargetInitial Allocation
$3B TargetCurrent
Refranchising Also Reshapes Our Productivity Allocation
40
COGS$1.1B
OPEX$1.2B
COGS$1.4B
DME$0.6B
OPEX$1.0B
CAGNY 2016
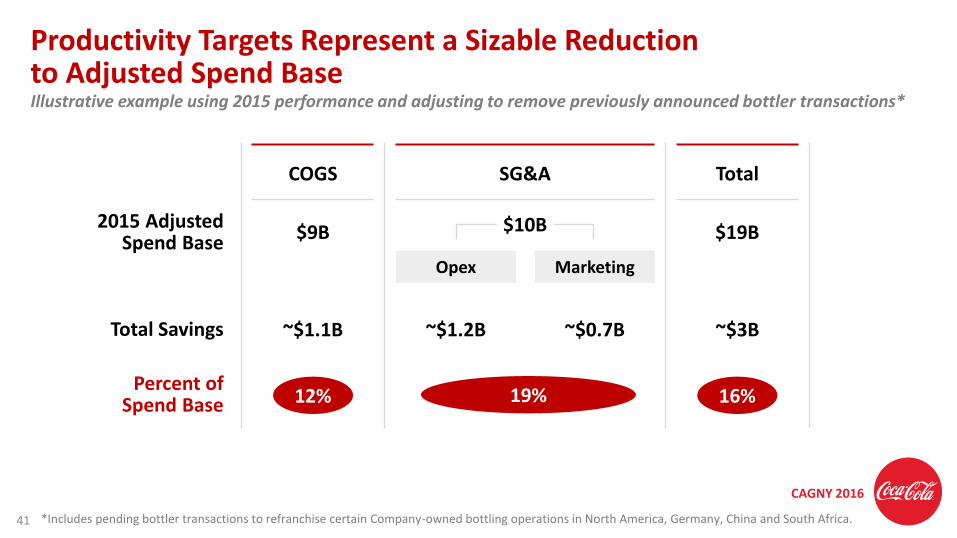
Productivity Targets Represent a Sizable Reduction to Adjusted Spend Base
Total
Percent of Spend Base
$9B2015 Adjusted
Spend Base $19B
~$0.7B~$1.2B~$1.1BTotal Savings ~$3B
$10B
12% 19% 16%
COGS SG&A
Opex Marketing
41
Illustrative example using 2015 performance and adjusting to remove previously announced bottler transactions*
*Includes pending bottler transactions to refranchise certain Company-owned bottling operations in North America, Germany, China and South Africa.
CAGNY 2016
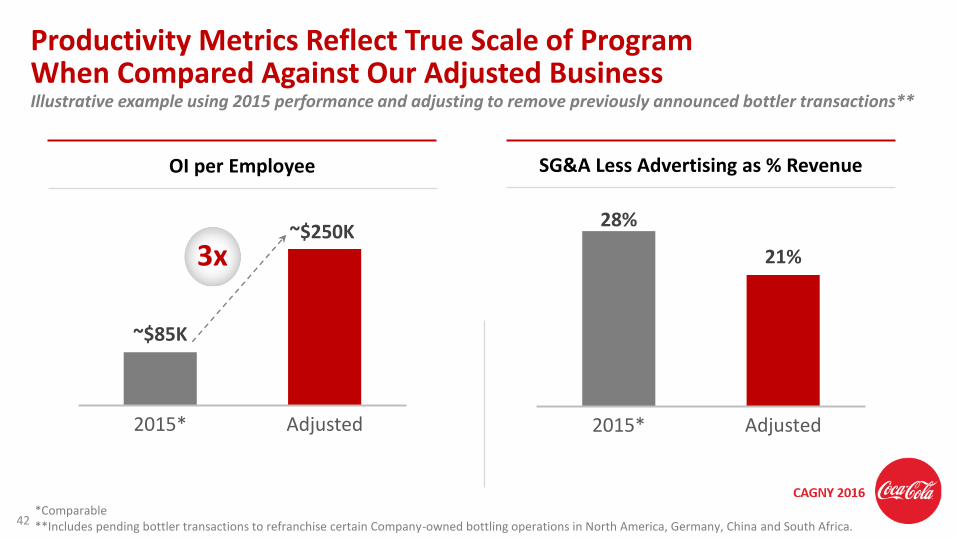
Productivity Metrics Reflect True Scale of Program When Compared Against Our Adjusted Business
~$85K
~$250K
2015* Adjusted
OI per Employee
3x
42
Illustrative example using 2015 performance and adjusting to remove previously announced bottler transactions**
28%
21%
2015* Adjusted
SG&A Less Advertising as % Revenue
*Comparable**Includes pending bottler transactions to refranchise certain Company-owned bottling operations in North America, Germany, China and South Africa.
CAGNY 2016
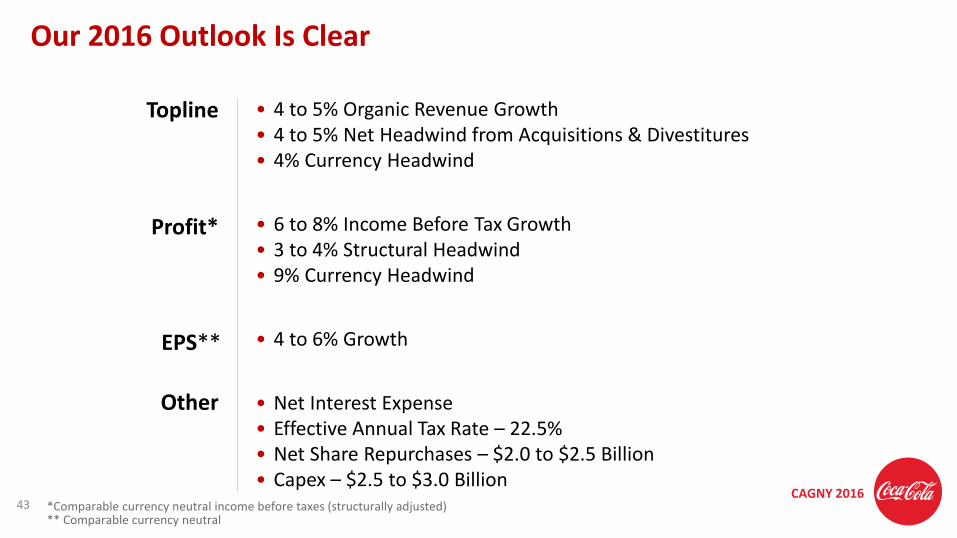
Our 2016 Outlook Is Clear
43
• 4 to 5% Organic Revenue Growth• 4 to 5% Net Headwind from Acquisitions & Divestitures• 4% Currency Headwind
• 6 to 8% Income Before Tax Growth• 3 to 4% Structural Headwind• 9% Currency Headwind
• 4 to 6% Growth
• Net Interest Expense• Effective Annual Tax Rate – 22.5%• Net Share Repurchases – $2.0 to $2.5 Billion• Capex – $2.5 to $3.0 Billion
Topline
EPS**
Profit*
Other
*Comparable currency neutral income before taxes (structurally adjusted) ** Comparable currency neutral
CAGNY 2016
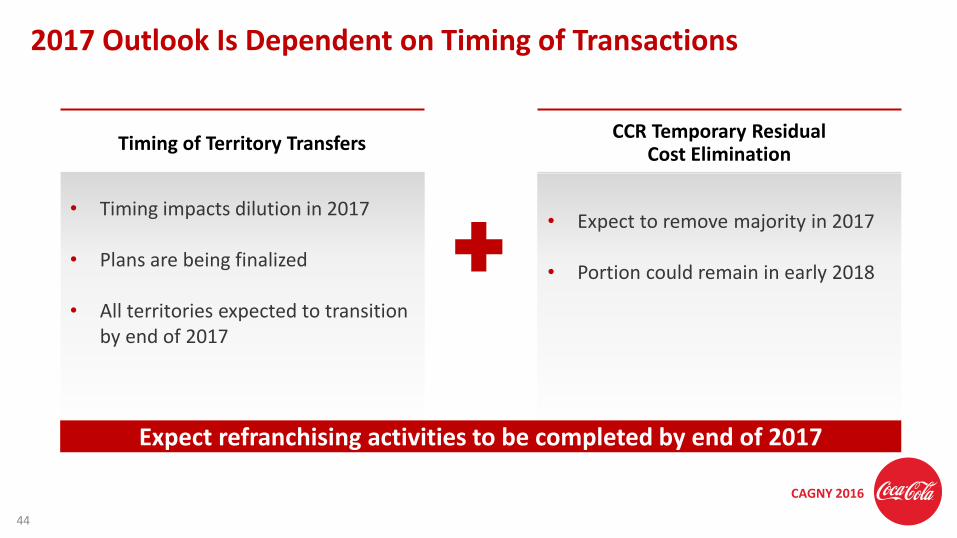
2017 Outlook Is Dependent on Timing of Transactions
44
• Timing impacts dilution in 2017
• Plans are being finalized
• All territories expected to transition by end of 2017
Expect refranchising activities to be completed by end of 2017
Timing of Territory TransfersCCR Temporary Residual
Cost Elimination
• Expect to remove majority in 2017
• Portion could remain in early 2018
CAGNY 2016
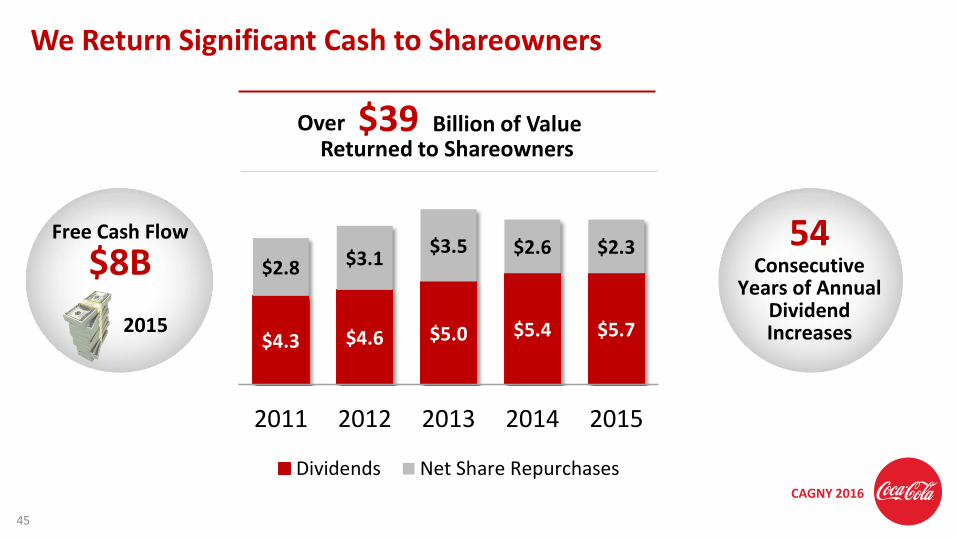
Free Cash Flow
$8B
We Return Significant Cash to Shareowners
54Consecutive
Years of Annual Dividend Increases$4.3 $4.6 $5.0 $5.4 $5.7
$2.8 $3.1$3.5 $2.6 $2.3
2011 2012 2013 2014 2015
Dividends Net Share Repurchases
Billion of ValueOverReturned to Shareowners
2015
45
CAGNY 2016
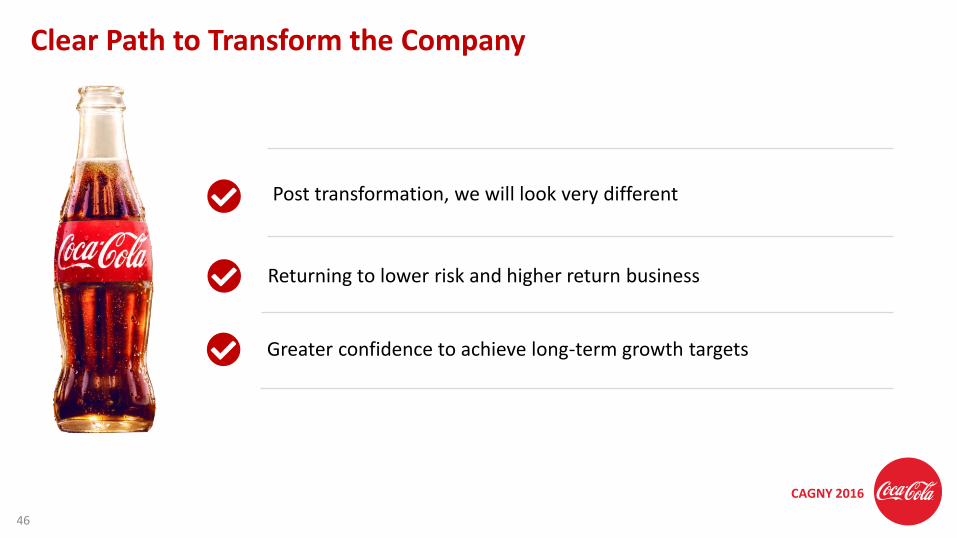
Post transformation, we will look very different
Returning to lower risk and higher return business
Clear Path to Transform the Company
Greater confidence to achieve long-term growth targets
46
CAGNY 2016

Q&A