the collection of waste portable batteries in europe in ... for epba on waste portable batteries...
TRANSCRIPT
EPBAeurope.net SagisEPR.com Perchards.com
Study on behalf of the European Portable Battery Association (EPBA)
The collection of waste portable batteries in Europe in view of the achievability of the collection targets set by Batteries Directive 2006/66/EC
August 2013
Update December 2016
- Summary of Changes -
STUDY FOR EPBA ON WASTE PORTABLE BATTERIES COLLECTION RATES
UPDATE DEC-15 - SUMMARY OF CHANGES
1
Introduction The collection of portable primary and rechargeable batteries in Europe is mandated by Directive 2006/66/EC which requires Member States to achieve a collection rate of 25% in 2012 and 45% in 2016.
The European portable power industry commissioned consultants Perchards/Sagis to carry out a study investigating and advising on the achievement of mandatory collection rates for portable primary and rechargeable batteries in EU Member States, plus Iceland Norway and Switzerland. In 2014, 2015 and 2016, EPBA commissioned an update of the study taking into account the previous year’s data. Industry intends to use the study as a basis for dialogue with the European Commission, Member State Governments, their agencies and other stakeholders to highlight the limitations of the current regulations and practices as a basis for suggested improvements.
Methodology The study’s findings rely on primary research of publications of collection organisations (notably annual reports) and national authorities, supported by questionnaires and interviews with representatives from these organisations between May-12 to Aug-13. The consultants have attempted to explain the stated collection rates quantitatively by collecting hundreds of data points for each country and trying to identify correlations between them. This has proven challenging for several reasons: A) The sheer magnitude of variables with multiple interdependencies; B) Incomplete and incomparable historical data. (Prior to Batteries Directive 2006/66/EC there were no requirements at EU level to report on portable batteries, and if data were collected they were based on varying definitions); C) Diverging national terminology for key parameters of the schemes and organisations, such as collection sources; and D) Ongoing changes in national legislation and rapid development of scheme implementation as a result of the short time since the transposition of the Directive.
Data sources and accuracy Accuracy of portable battery collection rates in this report: In the absence of the official collection rates that may be adjusted by statistically significant estimates1, the collection rates used in this report are calculated using unadjusted POM and collection volume data released by member states and / or organisations. Where current data are not available, earlier data or estimates based on earlier years or partial data from organisations are used. In September 2016, EUROSTAT released portable batteries data reported by member states to the European Commission. A new section in this report compares these data with those in previous versions of this report2.
Per capita volume data: To allow for meaningful cross-country comparisons, it is necessary to use battery collection and POM data on a per capita basis. For consistency, this report only uses EUROSTAT population data to arrive at per capita volumes. Battery organisations and national authorities often use other data sources or data from a single base year. Thus per capita data in this report may vary slightly from those released nationally. In the 2016 update, the underlying EUROSTAT population dataset of 2012 was replaced with the latest dataset: Over all countries covered, the new set shows a 1% lower population in 2012. However, for some countries the numbers deviate significantly3, which affects the per capita POM and collection data in this report.
Sources for WEEE data: Eurostat EEE and WEEE data are used for comparison purposes.
Acknowledgements The authors would like to thank the numerous individuals and organisations that have provided data and valuable input
to this study. Any errors or omissions remain the responsibility of the authors.
1 Batteries Directive 2006/66/EC requires member states to calculate the collection rate for the first time for the calendar year
2011 and report results of the four-year period 27 September 2008 to 26 September 2012 to the Commission by 26 June 2013. Commission Decision 2008/763/EC allows Member States to base their calculation of battery sales (POM, placed on the market) volumes on ‘collected data or statistically significant estimates based on collected data’. For many countries these estimates may have a significant impact on the official collection rates, especially in those that did not have POM reporting procedures for batteries in EEE in place throughout the period 2009-2012 and those with high uncertainty about the reported collection volumes.
2 EUROSTAT data had on portable batteries had not been available for previous versions of this report (only a dataset for waste from all batteries from 2004 to 2010 without breakdown into portable batteries).
3 CY +4%, HR -3%, LV -7%, LT -6% and RO -6%.
STUDY FOR EPBA ON WASTE PORTABLE BATTERIES COLLECTION RATES
UPDATE DEC-15 - SUMMARY OF CHANGES
2
Terminology ‘Scheme’ is used to refer to the overarching regime in view of the parties responsible for the management
(consumer awareness, collection and treatment) of waste portable batteries.
‘Scheme models’ can be distinguished by the parties held financially and/or organisationally responsible for waste battery management. For the purpose of this study, the following main scheme models are identified: ‘State fund model’, a ‘Single organisation model’ (also ‘Environmental agreement model’) and a ‘Competing organisations model’.
‘Organisation’ is used to refer to entities engaged in coordinating waste battery management and involved in assisting to fulfil producer responsibility obligations. Subject to the national context, ‘organisations’ may be referred to as ‘compliance systems’, ‘producer compliance schemes’, ‘producer compliance organisations’, ‘collective schemes’ or ‘approved waste managers’ which may be subject to licensing or approval requirements, restriction on their ownership, profit objective and business activities, etc.
‘POM’ (Placed On the Market) refers to sales volumes of portable batteries that producers are obligated to report.
‘Collection rate’ refers to the use of the calculation methodology of Directive 2006/66/EC which divides the collection volume in the current year by the average weight placed on market in current and two preceding years. If, due to unavailability of 3 years of POM data, only the current year POM is used, the text states ‘collection rate on current year basis’.
‘Batteries Directive’ refers to Batteries Directive 2006/66/EC.
Country short codes Austria AT
Belgium BE
Bulgaria BG
Croatia HR
Cyprus CY
Czech Republic CZ
Denmark DK
Estonia EE
Finland FI
France FR
Germany DE
Greece GR
Hungary HU
Iceland IC
Ireland IE
Italy IT
Latvia LV
Lithuania LT
Luxembourg LU
Malta MT
Netherlands NL
Norway NO
Poland PL
Portugal PT
Romania RO
Slovakia SK
Slovenia SI
Spain ES
Sweden SE
Switzerland CH
UK UK

STUDY FOR EPBA ON WASTE PORTABLE BATTERIES COLLECTION RATES
UPDATE DEC-15 - SUMMARY OF CHANGES
3
Table of content
COLLECTION RATE ACHIEVEMENT ...................................................................................................................4 Development of EEA wide reported POM and collection volumes ......................................................................... 4
Current collection rates in EEA countries .............................................................................................................. 6
About 18 EEA countries unlikely to achieve a 45% collection rate in 2016 ............................................................. 7
Differences between this report and EUROSTAT data ........................................................................................... 8
REVISED: Portable batteries POM in relation to household consumption, EEE POM ............................................. 9
COUNTRY ANALYSES ..................................................................................................................................... 12 AUSTRIA ............................................................................................................................................................ 12
BELGIUM ........................................................................................................................................................... 12
BULGARIA .......................................................................................................................................................... 13
CROATIA ............................................................................................................................................................ 14
CYPRUS .............................................................................................................................................................. 15
CZECH REPUBLIC ................................................................................................................................................ 15
DENMARK .......................................................................................................................................................... 16
ESTONIA ............................................................................................................................................................ 17
FINLAND ............................................................................................................................................................ 17
FRANCE.............................................................................................................................................................. 18
GERMANY .......................................................................................................................................................... 19
GREECE .............................................................................................................................................................. 19
HUNGARY .......................................................................................................................................................... 20
ICELAND ............................................................................................................................................................ 21
IRELAND ............................................................................................................................................................ 22
ITALY ................................................................................................................................................................. 22
LATVIA ............................................................................................................................................................... 23
LITHUANIA ......................................................................................................................................................... 24
LUXEMBOURG ................................................................................................................................................... 24
MALTA ............................................................................................................................................................... 25
NETHERLANDS ................................................................................................................................................... 26
NORWAY ........................................................................................................................................................... 26
POLAND ............................................................................................................................................................. 27
PORTUGAL ......................................................................................................................................................... 28
ROMANIA .......................................................................................................................................................... 29
SLOVAKIA........................................................................................................................................................... 30
SLOVENIA .......................................................................................................................................................... 30
SPAIN................................................................................................................................................................. 31
SWEDEN ............................................................................................................................................................ 32
SWITZERLAND .................................................................................................................................................... 32
UNITED KINGDOM ............................................................................................................................................. 33
STUDY FOR EPBA ON WASTE PORTABLE BATTERIES COLLECTION RATES
UPDATE DEC-15 - SUMMARY OF CHANGES
4
COLLECTION RATE ACHIEVEMENT
Development of EEA wide reported POM and collection volumes
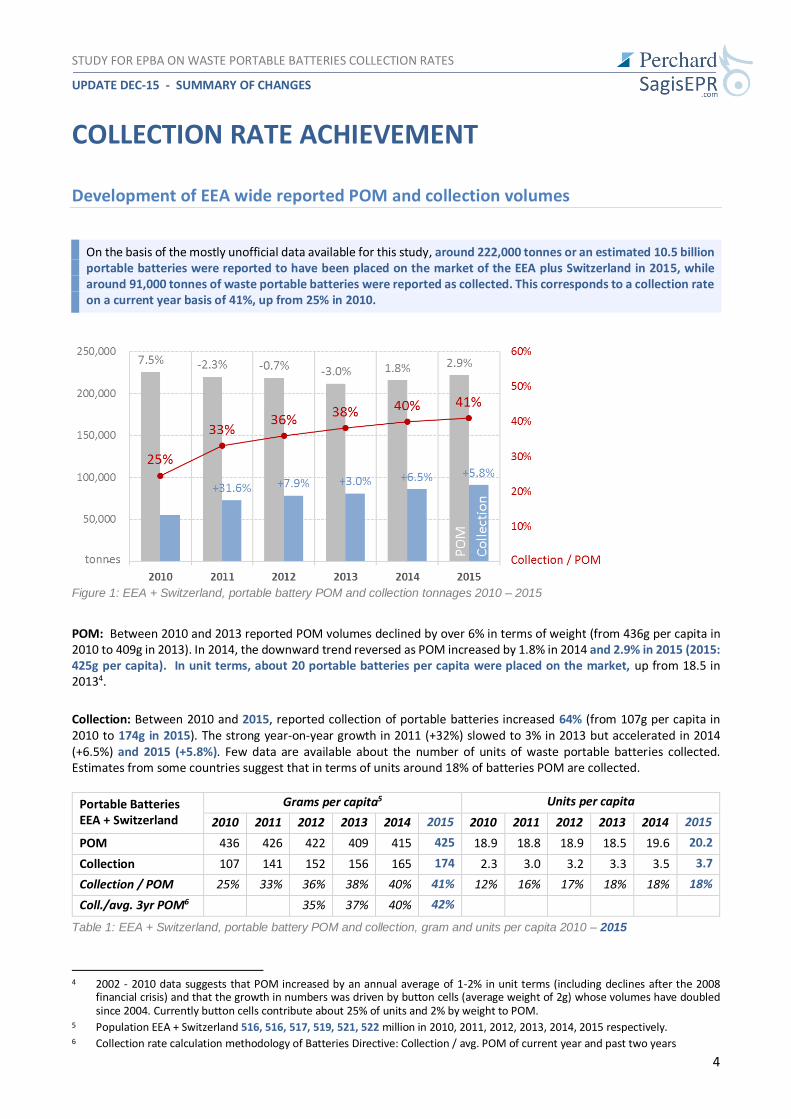
On the basis of the mostly unofficial data available for this study, around 222,000 tonnes or an estimated 10.5 billion portable batteries were reported to have been placed on the market of the EEA plus Switzerland in 2015, while around 91,000 tonnes of waste portable batteries were reported as collected. This corresponds to a collection rate on a current year basis of 41%, up from 25% in 2010.
Figure 1: EEA + Switzerland, portable battery POM and collection tonnages 2010 – 2015
POM: Between 2010 and 2013 reported POM volumes declined by over 6% in terms of weight (from 436g per capita in 2010 to 409g in 2013). In 2014, the downward trend reversed as POM increased by 1.8% in 2014 and 2.9% in 2015 (2015: 425g per capita). In unit terms, about 20 portable batteries per capita were placed on the market, up from 18.5 in 20134.
Collection: Between 2010 and 2015, reported collection of portable batteries increased 64% (from 107g per capita in 2010 to 174g in 2015). The strong year-on-year growth in 2011 (+32%) slowed to 3% in 2013 but accelerated in 2014 (+6.5%) and 2015 (+5.8%). Few data are available about the number of units of waste portable batteries collected. Estimates from some countries suggest that in terms of units around 18% of batteries POM are collected.
Portable Batteries EEA + Switzerland
Grams per capita5 Units per capita
2010 2011 2012 2013 2014 2015 2010 2011 2012 2013 2014 2015
POM 436 426 422 409 415 425 18.9 18.8 18.9 18.5 19.6 20.2
Collection 107 141 152 156 165 174 2.3 3.0 3.2 3.3 3.5 3.7
Collection / POM 25% 33% 36% 38% 40% 41% 12% 16% 17% 18% 18% 18%
Coll./avg. 3yr POM6 35% 37% 40% 42%
Table 1: EEA + Switzerland, portable battery POM and collection, gram and units per capita 2010 – 2015
4 2002 - 2010 data suggests that POM increased by an annual average of 1-2% in unit terms (including declines after the 2008
financial crisis) and that the growth in numbers was driven by button cells (average weight of 2g) whose volumes have doubled since 2004. Currently button cells contribute about 25% of units and 2% by weight to POM.
5 Population EEA + Switzerland 516, 516, 517, 519, 521, 522 million in 2010, 2011, 2012, 2013, 2014, 2015 respectively. 6 Collection rate calculation methodology of Batteries Directive: Collection / avg. POM of current year and past two years
STUDY FOR EPBA ON WASTE PORTABLE BATTERIES COLLECTION RATES
UPDATE DEC-15 - SUMMARY OF CHANGES
5
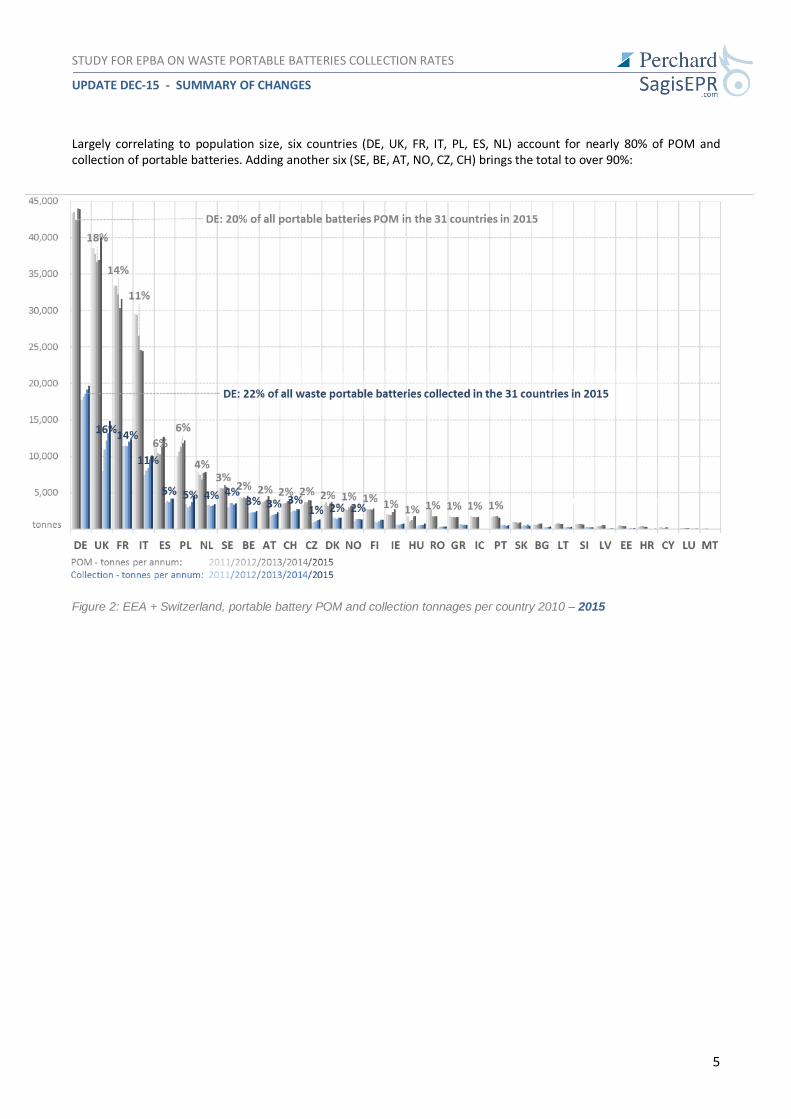
Largely correlating to population size, six countries (DE, UK, FR, IT, PL, ES, NL) account for nearly 80% of POM and collection of portable batteries. Adding another six (SE, BE, AT, NO, CZ, CH) brings the total to over 90%:
Figure 2: EEA + Switzerland, portable battery POM and collection tonnages per country 2010 – 2015

STUDY FOR EPBA ON WASTE PORTABLE BATTERIES COLLECTION RATES
UPDATE DEC-15 - SUMMARY OF CHANGES
6
Current collection rates in EEA countries
Collection rates consistently above the 25% (2012) target in all except 3 - 4 countries
On the basis of the mostly unofficial data available for this study, the 25% minimum collection rate mandated by Batteries Directive 2006/66/EC in 30 EEA member countries7 was achieved in all but 3 countries (CY, MT, RO) in 2012. In 2013, the rate was missed by CY and new member state Croatia (HR) but far exceeded by MT and RO8. In 2014, CY continued its upward trend but stayed below 25%, HR’s rate did not change significantly while MT and EE fell back below 25%. In 2015, CY just reached 25% while rates in MT and EE jumped to 40% which suggests that changes in annual POM and collection volumes resulting from cyclical product supply and/or collection campaigns can have a significant temporary impact on the collection rates in smaller countries e.g. MT, EE, HR, IC.
12 EEA countries appear to have reached rates above 45% in 2015
These twelve countries include five EEA countries that have consistently exceeded the 45% rate between 2011 and 2014 (AT, BE, SE, LU, SK), four which exceeded 45% for the first time in 2014 (FI, BG, HU8, NL), two which exceeded 45% in 2015 for the first time (DK, DE) and NO.
Figure 3: EEA + Switzerland, portable battery POM and collection per capita and collection rates 2012 – 2015
7 31 countries are signatories to the European Economic Area (EEA) agreement. However, EEA member Liechtenstein is part of the
Swiss customs territory and as such subject to a large part of Swiss legislation, including waste legislation, and the Swiss producer responsibility organisations operate on its territory. Switzerland is not a member of either the EU or the EEA and thus under no obligation to follow EU policy. Switzerland has nevertheless adopted broadly similar rules on batteries as the EU and is included in this study for the sake of completeness.
8 2013 data revised in 2015 update of this report. NO’s POM and collection of embedded batteries remains subject to uncertainties.
STUDY FOR EPBA ON WASTE PORTABLE BATTERIES COLLECTION RATES
UPDATE DEC-15 - SUMMARY OF CHANGES
7
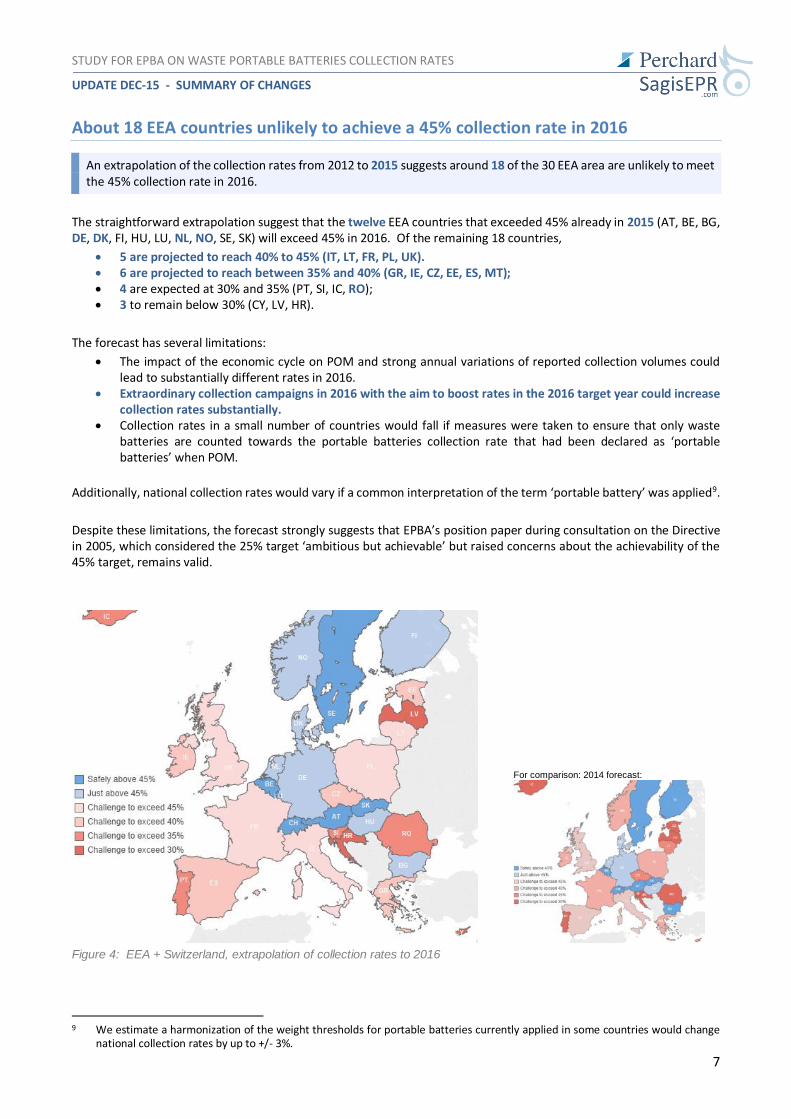
About 18 EEA countries unlikely to achieve a 45% collection rate in 2016
An extrapolation of the collection rates from 2012 to 2015 suggests around 18 of the 30 EEA area are unlikely to meet the 45% collection rate in 2016.
The straightforward extrapolation suggest that the twelve EEA countries that exceeded 45% already in 2015 (AT, BE, BG, DE, DK, FI, HU, LU, NL, NO, SE, SK) will exceed 45% in 2016. Of the remaining 18 countries,
5 are projected to reach 40% to 45% (IT, LT, FR, PL, UK). 6 are projected to reach between 35% and 40% (GR, IE, CZ, EE, ES, MT); 4 are expected at 30% and 35% (PT, SI, IC, RO); 3 to remain below 30% (CY, LV, HR).
The forecast has several limitations:
The impact of the economic cycle on POM and strong annual variations of reported collection volumes could lead to substantially different rates in 2016.
Extraordinary collection campaigns in 2016 with the aim to boost rates in the 2016 target year could increase collection rates substantially.
Collection rates in a small number of countries would fall if measures were taken to ensure that only waste batteries are counted towards the portable batteries collection rate that had been declared as ‘portable batteries’ when POM.
Additionally, national collection rates would vary if a common interpretation of the term ‘portable battery’ was applied9.
Despite these limitations, the forecast strongly suggests that EPBA’s position paper during consultation on the Directive in 2005, which considered the 25% target ‘ambitious but achievable’ but raised concerns about the achievability of the 45% target, remains valid.
For comparison: 2014 forecast:
Figure 4: EEA + Switzerland, extrapolation of collection rates to 2016
9 We estimate a harmonization of the weight thresholds for portable batteries currently applied in some countries would change
national collection rates by up to +/- 3%.

STUDY FOR EPBA ON WASTE PORTABLE BATTERIES COLLECTION RATES
UPDATE DEC-15 - SUMMARY OF CHANGES
8
Differences between this report and EUROSTAT data
In September 2016, EUROSTAT released data10 on portable battery volumes for the period 2009 to 2015 which presumably member states had reported to the European Commission. For the 3 years relevant for calculating the 2015 collection rate, EUROSTAT data are missing or incomplete with regard to 7 EEA countries (CY, IT, UK, ES, GR, IS, RO).
For the remaining countries, the EUROSTAT dataset differs to that in this report:
HU: EUROSTAT data result in a 10% higher collection rate in 2014 (46%). This is largely due our estimate of POM having been substantially higher in 2012 and 2013. For lack of substantial evidence supporting our data, we have integrated the EUROSTAT data in this update, though they show large annual variations of POM (e.g. 2013: 1,192 tonnes, 2014: 1726 tonnes).
NO: EUROSTAT data result in a 14% higher collection rate in 2014 (44%), due to lower POM volumes in the EUROSTAT data. The research for this report strongly indicates that EUROSTAT volumes do not include batteries POM in EEE. In this update, we maintain our POM volumes estimates. However, we have added another stream of waste batteries removed from WEEE which substantially increases our estimate of waste batteries removed from WEEE. This results in a collection rate similar to the one arrived at by EUROSTAT data though underlying POM and collection volumes are higher.
A small number of other pronounced differences concern earlier years not effecting the 2015 collection rate.
A number of less pronounced differences between the datasets can be explained by the national authorities post adjustments of data. These result in differences in the 2014 collection rate of +2 for CZ and +/-1 for DK, FR, IT, LV.
10 http://appsso.eurostat.ec.europa.eu/nui/show.do?dataset=env_waspb&lang=en

STUDY FOR EPBA ON WASTE PORTABLE BATTERIES COLLECTION RATES
UPDATE DEC-15 - SUMMARY OF CHANGES
9
REVISED section in chapter ‘Possible distortions of POM volumes’: Portable batteries POM in relation to household consumption, EEE POM
In this update of the report, the plausibility of portable batteries POM is investigated by comparing it to the household consumption component of GDP and EEE POM over three and five year periods. Key findings show a general correlation in most countries but also raise questions about the accuracy of POM as a variable in the collection rate calculation: For example, with regards to household consumption, batteries POM in MT, GR, ES, CY, PT is generally lower than household consumption suggests but this is not always true for EEE POM. EEE POM is substantially higher than batteries POM in MT, HR, BG, GR, BE, LU and PT but lower in EE, LV and IT. The correlation between annual household consumption and annual batteries POM from 2010 to 2015 is strongly or moderately positive in most countries but in a few countries consumption increased while batteries POM fell (EE, MT) or vice versa (AT).
Note: This section was entirely revised for the 2016 update. While previously GDP was used for comparisons with POM, the 2015 update uses the ‘household consumption’ subset of GDP11 to better reflect patterns related to batteries12.
Correlation between battery POM and GDP (household consumption) On a per capita basis, the reported weight of portable batteries placed on the market ranges from about 80 g to over 600 g, while total household consumption ranges from around EUR 4,000 to 28,000. The chart below orders countries from lowest household consumption to highest. It suggests a fairly high correlation between household consumption and battery POM. A few observations:
Among the countries with lower household consumption, battery POM in HR and SK is lower than household consumption suggests, while POM in PL, EE and CZ is substantially higher.
POM in Mediterranean countries MT, GR, ES, CY and also PT is generally lower than household consumption suggests.
Between countries with high household consumption, deviations between the two indicators are smaller.
REVISED Figure 5: Portable battery POM and household consumption – Annual average 2013 - 2015
11 EUROSTAT ‘Final consumption expenditure of households by consumption purpose (COICOP 3 digit). Data on the basis of 2010
euros, converted on a per capita basis. For HR and CH, these data are not available and the values used here are based on these countries’ deviation of entire GDP from the average GDP of the countries covered.
12 The analysis of four of the 121 items under households by consumption, which are closer related to the consumption of batteries (household appliances, tools and equipment for house and garden, other recreational items and equipment, gardens and pets, telephone and telefax equipment), yielded very similar results but was eventually not used due to gaps in the dataset.
STUDY FOR EPBA ON WASTE PORTABLE BATTERIES COLLECTION RATES
UPDATE DEC-15 - SUMMARY OF CHANGES
10
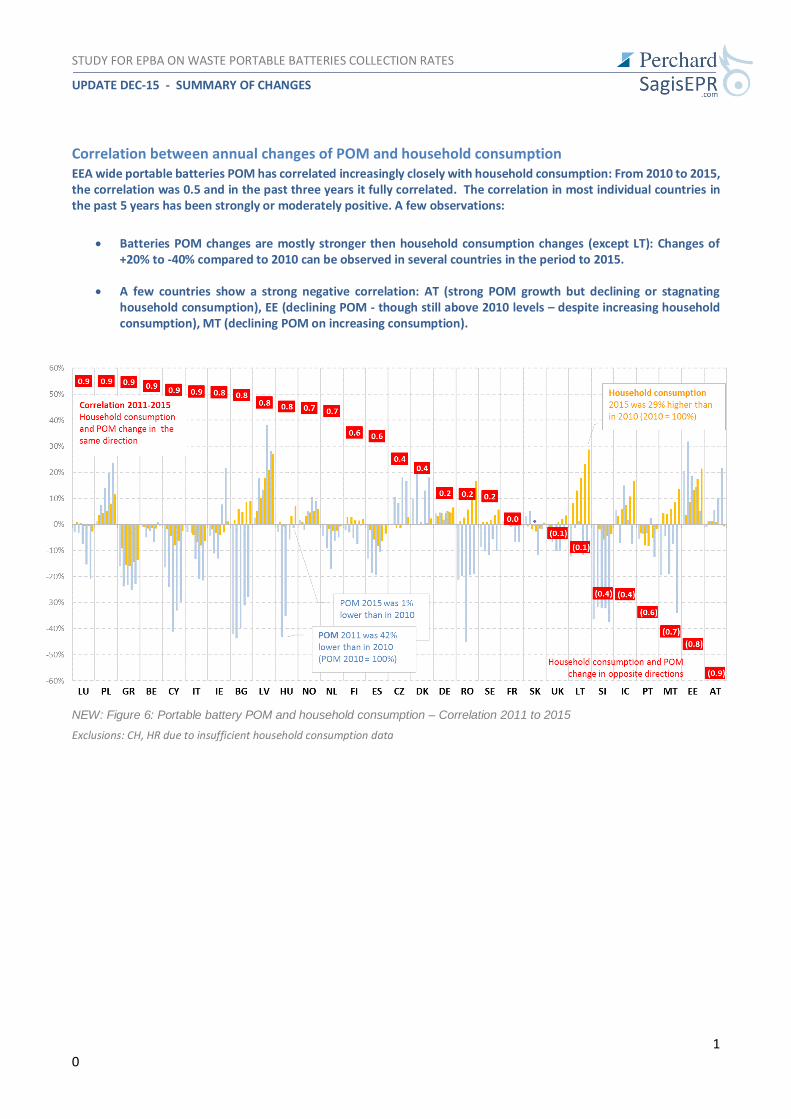
Correlation between annual changes of POM and household consumption EEA wide portable batteries POM has correlated increasingly closely with household consumption: From 2010 to 2015, the correlation was 0.5 and in the past three years it fully correlated. The correlation in most individual countries in the past 5 years has been strongly or moderately positive. A few observations:
Batteries POM changes are mostly stronger then household consumption changes (except LT): Changes of +20% to -40% compared to 2010 can be observed in several countries in the period to 2015.
A few countries show a strong negative correlation: AT (strong POM growth but declining or stagnating household consumption), EE (declining POM - though still above 2010 levels – despite increasing household consumption), MT (declining POM on increasing consumption).
NEW: Figure 6: Portable battery POM and household consumption – Correlation 2011 to 2015
Exclusions: CH, HR due to insufficient household consumption data
STUDY FOR EPBA ON WASTE PORTABLE BATTERIES COLLECTION RATES
UPDATE DEC-15 - SUMMARY OF CHANGES
11
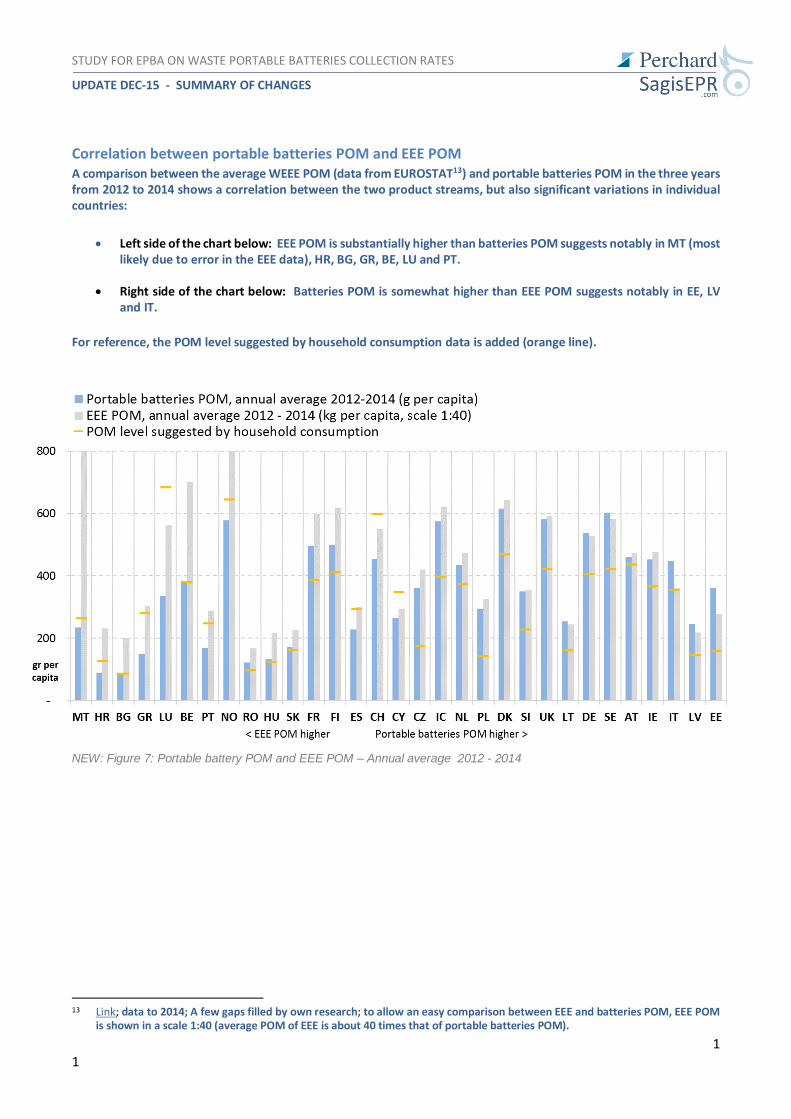
Correlation between portable batteries POM and EEE POM A comparison between the average WEEE POM (data from EUROSTAT13) and portable batteries POM in the three years from 2012 to 2014 shows a correlation between the two product streams, but also significant variations in individual countries:
Left side of the chart below: EEE POM is substantially higher than batteries POM suggests notably in MT (most likely due to error in the EEE data), HR, BG, GR, BE, LU and PT.
Right side of the chart below: Batteries POM is somewhat higher than EEE POM suggests notably in EE, LV and IT.
For reference, the POM level suggested by household consumption data is added (orange line).
NEW: Figure 7: Portable battery POM and EEE POM – Annual average 2012 - 2014
13 Link; data to 2014; A few gaps filled by own research; to allow an easy comparison between EEE and batteries POM, EEE POM
is shown in a scale 1:40 (average POM of EEE is about 40 times that of portable batteries POM).
STUDY FOR EPBA ON WASTE PORTABLE BATTERIES COLLECTION RATES
UPDATE DEC-15 - SUMMARY OF CHANGES
12
COUNTRY ANALYSES
AUSTRIA
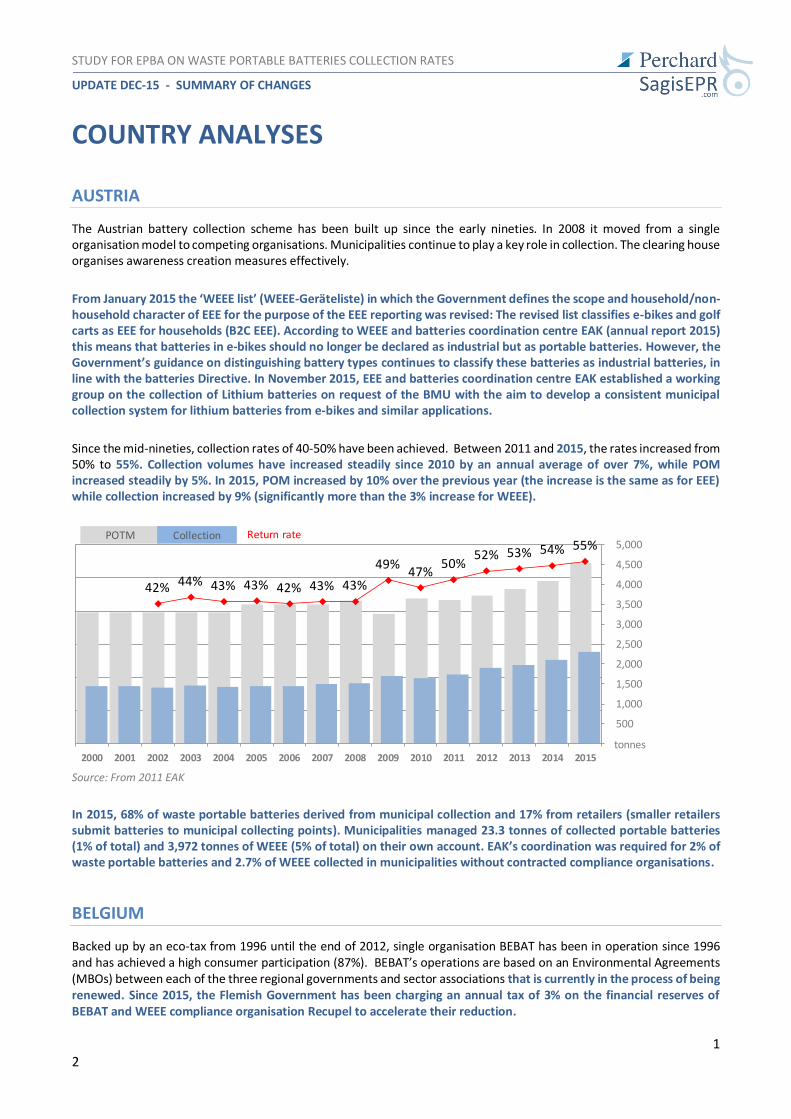
The Austrian battery collection scheme has been built up since the early nineties. In 2008 it moved from a single organisation model to competing organisations. Municipalities continue to play a key role in collection. The clearing house organises awareness creation measures effectively.
From January 2015 the ‘WEEE list’ (WEEE-Geräteliste) in which the Government defines the scope and household/non-household character of EEE for the purpose of the EEE reporting was revised: The revised list classifies e-bikes and golf carts as EEE for households (B2C EEE). According to WEEE and batteries coordination centre EAK (annual report 2015) this means that batteries in e-bikes should no longer be declared as industrial but as portable batteries. However, the Government’s guidance on distinguishing battery types continues to classify these batteries as industrial batteries, in line with the batteries Directive. In November 2015, EEE and batteries coordination centre EAK established a working group on the collection of Lithium batteries on request of the BMU with the aim to develop a consistent municipal collection system for lithium batteries from e-bikes and similar applications.
Since the mid-nineties, collection rates of 40-50% have been achieved. Between 2011 and 2015, the rates increased from 50% to 55%. Collection volumes have increased steadily since 2010 by an annual average of over 7%, while POM increased steadily by 5%. In 2015, POM increased by 10% over the previous year (the increase is the same as for EEE) while collection increased by 9% (significantly more than the 3% increase for WEEE).
Source: From 2011 EAK
In 2015, 68% of waste portable batteries derived from municipal collection and 17% from retailers (smaller retailers submit batteries to municipal collecting points). Municipalities managed 23.3 tonnes of collected portable batteries (1% of total) and 3,972 tonnes of WEEE (5% of total) on their own account. EAK’s coordination was required for 2% of waste portable batteries and 2.7% of WEEE collected in municipalities without contracted compliance organisations.
BELGIUM
Backed up by an eco-tax from 1996 until the end of 2012, single organisation BEBAT has been in operation since 1996 and has achieved a high consumer participation (87%). BEBAT’s operations are based on an Environmental Agreements (MBOs) between each of the three regional governments and sector associations that is currently in the process of being renewed. Since 2015, the Flemish Government has been charging an annual tax of 3% on the financial reserves of BEBAT and WEEE compliance organisation Recupel to accelerate their reduction.
42% 44% 43% 43% 42% 43% 43%
49%47%
50%52% 53% 54% 55%
-
500
1,000
1,500
2,000
2,500
3,000
3,500
4,000
4,500
5,000
0
0.1
0.2
0.3
0.4
0.5
0.6
2000 2001 2002 2003 2004 2005 2006 2007 2008 2009 2010 2011 2012 2013 2014 2015tonnes
POTM Collection Return rate
STUDY FOR EPBA ON WASTE PORTABLE BATTERIES COLLECTION RATES
UPDATE DEC-15 - SUMMARY OF CHANGES
13
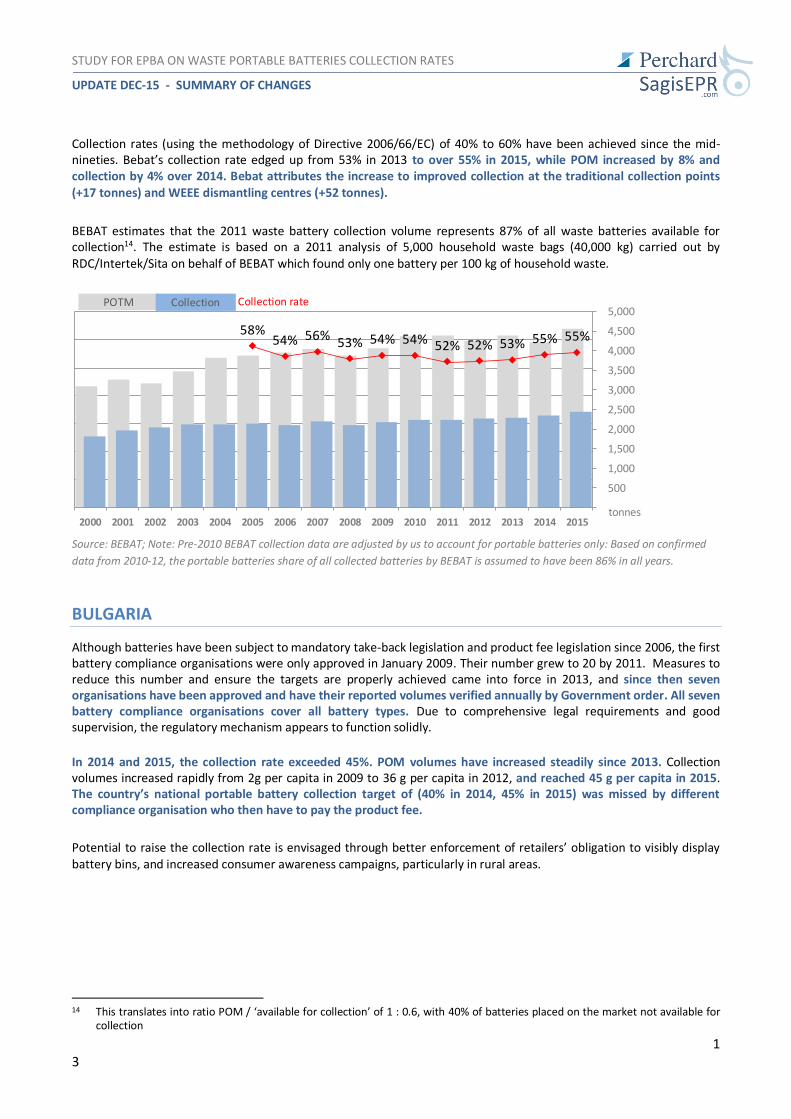
Collection rates (using the methodology of Directive 2006/66/EC) of 40% to 60% have been achieved since the mid-nineties. Bebat’s collection rate edged up from 53% in 2013 to over 55% in 2015, while POM increased by 8% and collection by 4% over 2014. Bebat attributes the increase to improved collection at the traditional collection points (+17 tonnes) and WEEE dismantling centres (+52 tonnes).
BEBAT estimates that the 2011 waste battery collection volume represents 87% of all waste batteries available for collection14. The estimate is based on a 2011 analysis of 5,000 household waste bags (40,000 kg) carried out by RDC/Intertek/Sita on behalf of BEBAT which found only one battery per 100 kg of household waste.
Source: BEBAT; Note: Pre-2010 BEBAT collection data are adjusted by us to account for portable batteries only: Based on confirmed
data from 2010-12, the portable batteries share of all collected batteries by BEBAT is assumed to have been 86% in all years.
BULGARIA
Although batteries have been subject to mandatory take-back legislation and product fee legislation since 2006, the first battery compliance organisations were only approved in January 2009. Their number grew to 20 by 2011. Measures to reduce this number and ensure the targets are properly achieved came into force in 2013, and since then seven organisations have been approved and have their reported volumes verified annually by Government order. All seven battery compliance organisations cover all battery types. Due to comprehensive legal requirements and good supervision, the regulatory mechanism appears to function solidly.
In 2014 and 2015, the collection rate exceeded 45%. POM volumes have increased steadily since 2013. Collection volumes increased rapidly from 2g per capita in 2009 to 36 g per capita in 2012, and reached 45 g per capita in 2015. The country’s national portable battery collection target of (40% in 2014, 45% in 2015) was missed by different compliance organisation who then have to pay the product fee.
Potential to raise the collection rate is envisaged through better enforcement of retailers’ obligation to visibly display battery bins, and increased consumer awareness campaigns, particularly in rural areas.
14 This translates into ratio POM / ‘available for collection’ of 1 : 0.6, with 40% of batteries placed on the market not available for
collection
58%54% 56%
53% 54% 54% 52% 52% 53% 55% 55%
-
500
1,000
1,500
2,000
2,500
3,000
3,500
4,000
4,500
5,000
0
0.1
0.2
0.3
0.4
0.5
0.6
0.7
2000 2001 2002 2003 2004 2005 2006 2007 2008 2009 2010 2011 2012 2013 2014 2015tonnes
POTM Collection Collection rate
STUDY FOR EPBA ON WASTE PORTABLE BATTERIES COLLECTION RATES
UPDATE DEC-15 - SUMMARY OF CHANGES
14
Source:Before 2013 EEA Register and Ministry of Environment; 2013/2014 EEA report; 2015 Eurostat (sum of Gov. order approved
collection volumes for each compliance organisation results in 2% higher collection rate 2015).
CROATIA
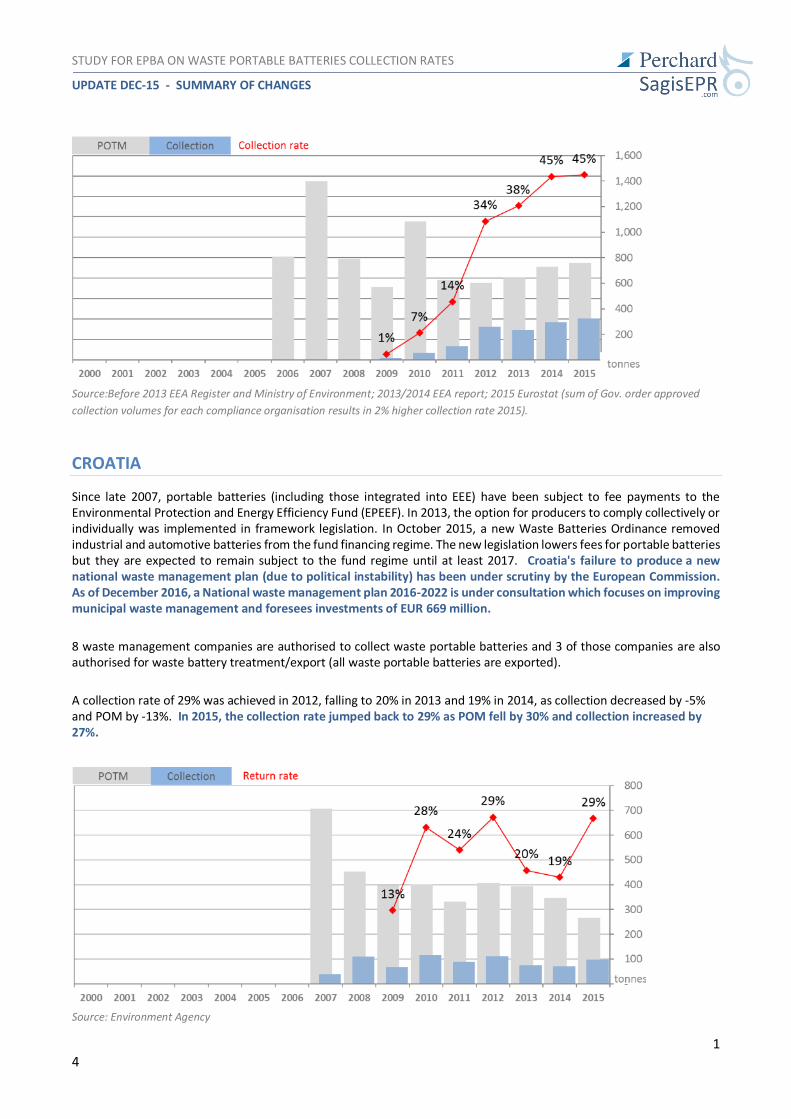
Since late 2007, portable batteries (including those integrated into EEE) have been subject to fee payments to the Environmental Protection and Energy Efficiency Fund (EPEEF). In 2013, the option for producers to comply collectively or individually was implemented in framework legislation. In October 2015, a new Waste Batteries Ordinance removed industrial and automotive batteries from the fund financing regime. The new legislation lowers fees for portable batteries but they are expected to remain subject to the fund regime until at least 2017. Croatia's failure to produce a new national waste management plan (due to political instability) has been under scrutiny by the European Commission. As of December 2016, a National waste management plan 2016-2022 is under consultation which focuses on improving municipal waste management and foresees investments of EUR 669 million.
8 waste management companies are authorised to collect waste portable batteries and 3 of those companies are also authorised for waste battery treatment/export (all waste portable batteries are exported).
A collection rate of 29% was achieved in 2012, falling to 20% in 2013 and 19% in 2014, as collection decreased by -5% and POM by -13%. In 2015, the collection rate jumped back to 29% as POM fell by 30% and collection increased by 27%.
Source: Environment Agency
STUDY FOR EPBA ON WASTE PORTABLE BATTERIES COLLECTION RATES
UPDATE DEC-15 - SUMMARY OF CHANGES
15
CYPRUS
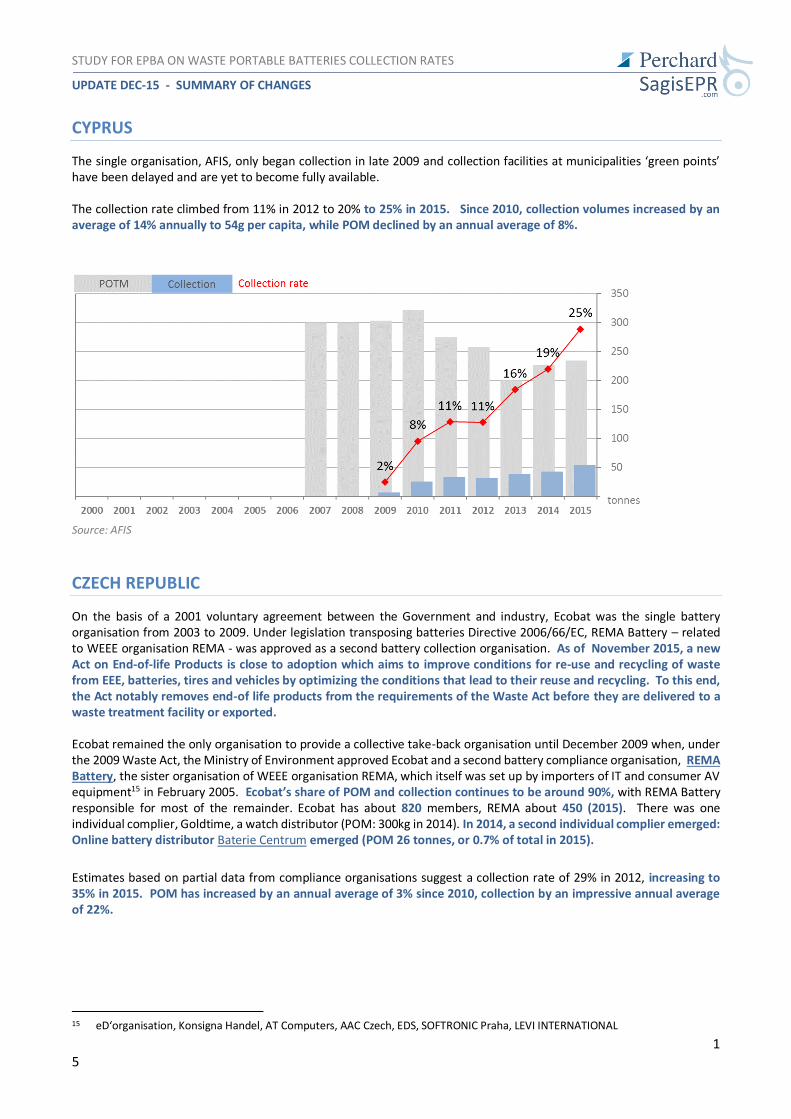
The single organisation, AFIS, only began collection in late 2009 and collection facilities at municipalities ‘green points’ have been delayed and are yet to become fully available. The collection rate climbed from 11% in 2012 to 20% to 25% in 2015. Since 2010, collection volumes increased by an average of 14% annually to 54g per capita, while POM declined by an annual average of 8%.
Source: AFIS
CZECH REPUBLIC
On the basis of a 2001 voluntary agreement between the Government and industry, Ecobat was the single battery organisation from 2003 to 2009. Under legislation transposing batteries Directive 2006/66/EC, REMA Battery – related to WEEE organisation REMA - was approved as a second battery collection organisation. As of November 2015, a new Act on End-of-life Products is close to adoption which aims to improve conditions for re-use and recycling of waste from EEE, batteries, tires and vehicles by optimizing the conditions that lead to their reuse and recycling. To this end, the Act notably removes end-of life products from the requirements of the Waste Act before they are delivered to a waste treatment facility or exported.
Ecobat remained the only organisation to provide a collective take-back organisation until December 2009 when, under the 2009 Waste Act, the Ministry of Environment approved Ecobat and a second battery compliance organisation, REMA Battery, the sister organisation of WEEE organisation REMA, which itself was set up by importers of IT and consumer AV equipment15 in February 2005. Ecobat’s share of POM and collection continues to be around 90%, with REMA Battery responsible for most of the remainder. Ecobat has about 820 members, REMA about 450 (2015). There was one individual complier, Goldtime, a watch distributor (POM: 300kg in 2014). In 2014, a second individual complier emerged: Online battery distributor Baterie Centrum emerged (POM 26 tonnes, or 0.7% of total in 2015).
Estimates based on partial data from compliance organisations suggest a collection rate of 29% in 2012, increasing to 35% in 2015. POM has increased by an annual average of 3% since 2010, collection by an impressive annual average of 22%.
15 eD‘organisation, Konsigna Handel, AT Computers, AAC Czech, EDS, SOFTRONIC Praha, LEVI INTERNATIONAL

STUDY FOR EPBA ON WASTE PORTABLE BATTERIES COLLECTION RATES
UPDATE DEC-15 - SUMMARY OF CHANGES
16
Source: 2012 to 2014: MoE data. 2015: Ecobat 2015 data, 2014 data for other organisations
A survey conducted by Ecobat in mid-2016 discovered that 69% of Czech’s were correctly separating their waste batteries from other household waste. 70% of those that said they did not separately dispose of waste batteries said they were too lazy to do so. The remainder commented that they believed their volumes to be insignificant and would not impact overall collection.
DENMARK
From the mid-nineties, a municipal collection system for NiCd batteries was financed by producers. Since September 2009, municipalities have been responsible for collection of all portable batteries (financed by a tax on producers of DKK 2,750 (EUR 370) per tonne put on the market) while two battery compliance organisations take back waste batteries from municipalities and from voluntarily-collecting retailers and other organisations. Organisations also finance and organise public awareness creation measures.
The collection rate for all portable batteries declined from a high of 47% in 2011 to 41% in 2013 and increased to and 46% in 2015. Annual fluctuations of around +/- 15% for POM and +/- 8% for collection volumes have been common. Over 90% of waste batteries derive from municipal collection points. Retailers are not obligated to take back waste batteries.
Source: Data after 2009: DPA organisation
Elretur in 2015 ran an unusual awareness campaign entitled ‘Do not throw your batteries in the trash!’ (website), with the slogan ‘Skal du f**** med mit grundvand!’ (You shall not f****with groundwater!, emphasised in a 45 sec youtube
STUDY FOR EPBA ON WASTE PORTABLE BATTERIES COLLECTION RATES
UPDATE DEC-15 - SUMMARY OF CHANGES
17
spot), arguing an important message must be communicated strongly. The campaign gained significant publicity but was met with mixed opinion.
ESTONIA
Separate collection for portable batteries has been in place since the end of the 1990s. Batteries could be returned free of charge to around 100 hazardous waste collection points managed by the municipalities. Since May 2004, producers have been legally responsible for waste portable batteries. However, there were no compliance organisations available until 2009, when two WEEE management organisations - EES-Ringlus and Elektroonikaromu - were approved as waste battery organisations.
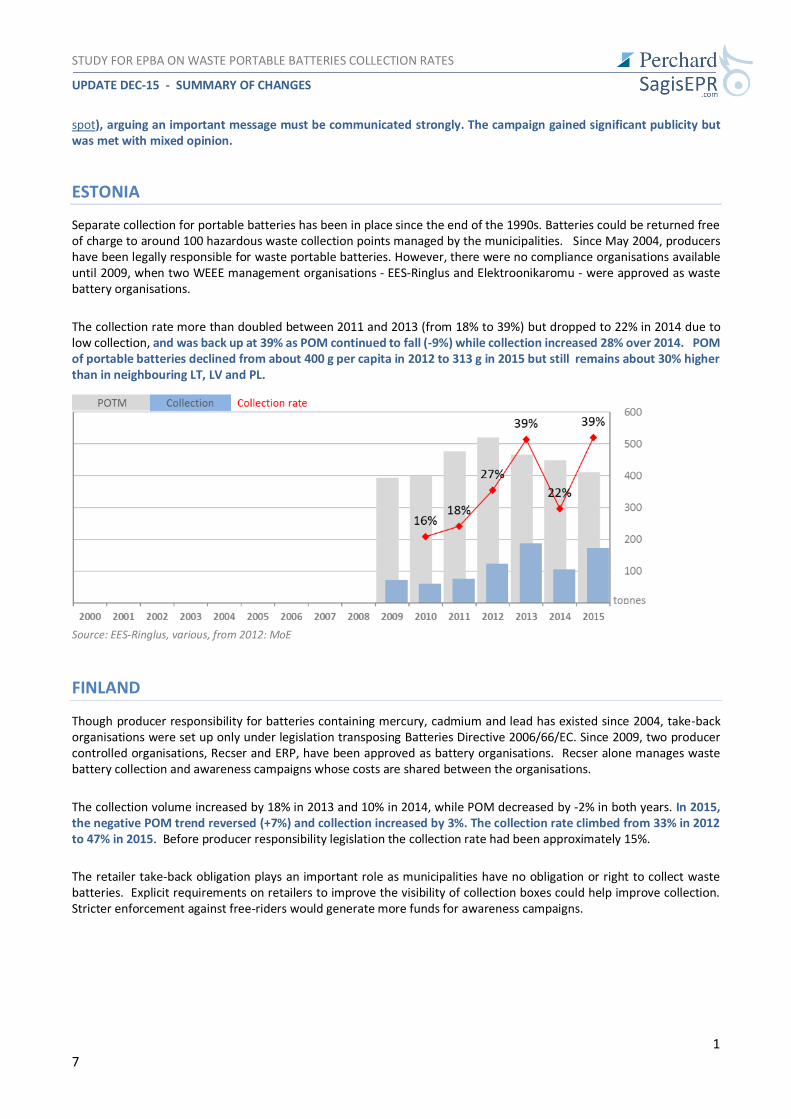
The collection rate more than doubled between 2011 and 2013 (from 18% to 39%) but dropped to 22% in 2014 due to low collection, and was back up at 39% as POM continued to fall (-9%) while collection increased 28% over 2014. POM of portable batteries declined from about 400 g per capita in 2012 to 313 g in 2015 but still remains about 30% higher than in neighbouring LT, LV and PL.
Source: EES-Ringlus, various, from 2012: MoE
FINLAND
Though producer responsibility for batteries containing mercury, cadmium and lead has existed since 2004, take-back organisations were set up only under legislation transposing Batteries Directive 2006/66/EC. Since 2009, two producer controlled organisations, Recser and ERP, have been approved as battery organisations. Recser alone manages waste battery collection and awareness campaigns whose costs are shared between the organisations.
The collection volume increased by 18% in 2013 and 10% in 2014, while POM decreased by -2% in both years. In 2015, the negative POM trend reversed (+7%) and collection increased by 3%. The collection rate climbed from 33% in 2012 to 47% in 2015. Before producer responsibility legislation the collection rate had been approximately 15%.
The retailer take-back obligation plays an important role as municipalities have no obligation or right to collect waste batteries. Explicit requirements on retailers to improve the visibility of collection boxes could help improve collection. Stricter enforcement against free-riders would generate more funds for awareness campaigns.
STUDY FOR EPBA ON WASTE PORTABLE BATTERIES COLLECTION RATES
UPDATE DEC-15 - SUMMARY OF CHANGES
18
Source: From 2010: Pirkanmaan ELY-keskus;
FRANCE
Since January 2001 producers have had to take back waste batteries collected by distributors, municipalities and other final holders. While large retailers initially ran individual organisations, by 2012, only two producer-controlled battery compliance organisations remained and one individually complying distributor remain.
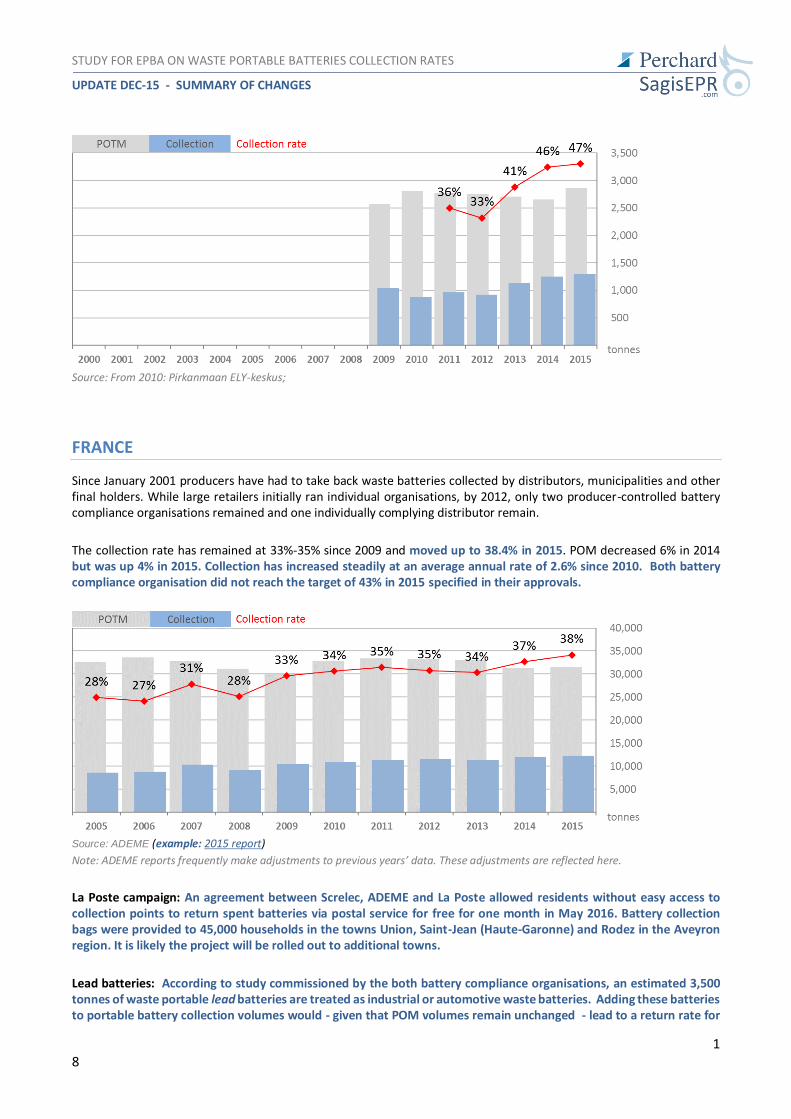
The collection rate has remained at 33%-35% since 2009 and moved up to 38.4% in 2015. POM decreased 6% in 2014 but was up 4% in 2015. Collection has increased steadily at an average annual rate of 2.6% since 2010. Both battery compliance organisation did not reach the target of 43% in 2015 specified in their approvals.
Source: ADEME (example: 2015 report)
Note: ADEME reports frequently make adjustments to previous years’ data. These adjustments are reflected here.
La Poste campaign: An agreement between Screlec, ADEME and La Poste allowed residents without easy access to collection points to return spent batteries via postal service for free for one month in May 2016. Battery collection bags were provided to 45,000 households in the towns Union, Saint-Jean (Haute-Garonne) and Rodez in the Aveyron region. It is likely the project will be rolled out to additional towns. Lead batteries: According to study commissioned by the both battery compliance organisations, an estimated 3,500 tonnes of waste portable lead batteries are treated as industrial or automotive waste batteries. Adding these batteries to portable battery collection volumes would - given that POM volumes remain unchanged - lead to a return rate for
STUDY FOR EPBA ON WASTE PORTABLE BATTERIES COLLECTION RATES
UPDATE DEC-15 - SUMMARY OF CHANGES
19
lead portable batteries of 800% and a collection rate for all portable batteries of around 50% [but would also lead to implausible return rates for portable lead batteries].
Up to 2011, ADEME report shows zero collection of portable lead batteries, despite lead acid batteries having contributing about 2% to portable batteries POM by weight. From 2012 to 2015, the lead share of collection has increased from 1.2% to about 5.6% in 2015, which corresponds to a return rate of 34% and 155% respectively.
GERMANY
From 1988 industry operated a voluntary organisation collecting only ‘environmentally hazardous’ batteries. In response to the 1998 Batteries Ordinance, producer organisation GRS was established, and its special role as the ‘joint’ organisation was confirmed under the 2009 Waste Batteries Act. In addition, three other portable battery organisations are operating. In late 2015, an amendment to the Batteries Act required municipalities to hand over free of charge waste batteries - which they collect voluntarily or which they remove from WEEE (which they are obligated to collect) – to the ‘joint battery organisation’ GRS. At the same time, the revised WEEE Act (ElektroG) required municipalities to remove batteries from WEEE that are ‘not enclosed’ by the WEEE. Municipalities collect about 90% of all household WEEE.
The legal option to require ‘individual’ organisations to participate in the financing of GRS information campaigns has been activated in 2015: Under the neutral branding ‘Die Ruecknahme Systeme’ (the take back systems) campaigns are carried out by GRS or jointly with municipalities.
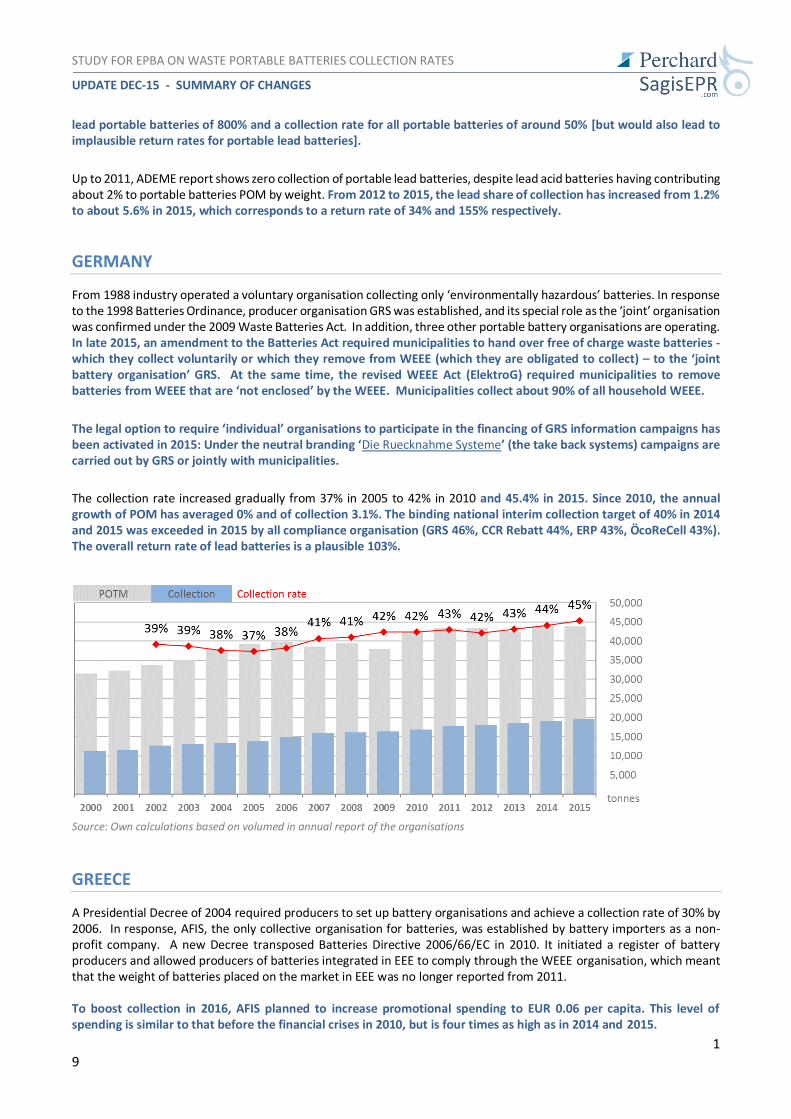
The collection rate increased gradually from 37% in 2005 to 42% in 2010 and 45.4% in 2015. Since 2010, the annual growth of POM has averaged 0% and of collection 3.1%. The binding national interim collection target of 40% in 2014 and 2015 was exceeded in 2015 by all compliance organisation (GRS 46%, CCR Rebatt 44%, ERP 43%, ÖcoReCell 43%). The overall return rate of lead batteries is a plausible 103%.
Source: Own calculations based on volumed in annual report of the organisations
GREECE
A Presidential Decree of 2004 required producers to set up battery organisations and achieve a collection rate of 30% by 2006. In response, AFIS, the only collective organisation for batteries, was established by battery importers as a non-profit company. A new Decree transposed Batteries Directive 2006/66/EC in 2010. It initiated a register of battery producers and allowed producers of batteries integrated in EEE to comply through the WEEE organisation, which meant that the weight of batteries placed on the market in EEE was no longer reported from 2011. To boost collection in 2016, AFIS planned to increase promotional spending to EUR 0.06 per capita. This level of spending is similar to that before the financial crises in 2010, but is four times as high as in 2014 and 2015.
STUDY FOR EPBA ON WASTE PORTABLE BATTERIES COLLECTION RATES
UPDATE DEC-15 - SUMMARY OF CHANGES
20
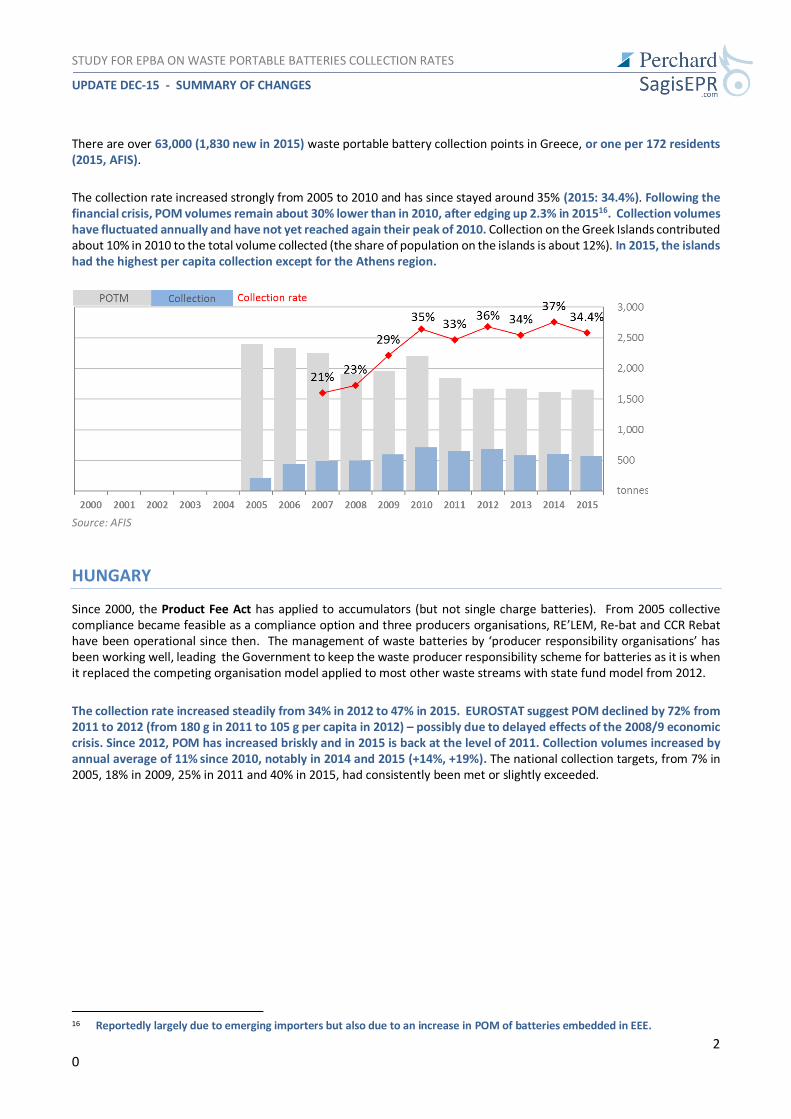
There are over 63,000 (1,830 new in 2015) waste portable battery collection points in Greece, or one per 172 residents (2015, AFIS).
The collection rate increased strongly from 2005 to 2010 and has since stayed around 35% (2015: 34.4%). Following the financial crisis, POM volumes remain about 30% lower than in 2010, after edging up 2.3% in 201516. Collection volumes have fluctuated annually and have not yet reached again their peak of 2010. Collection on the Greek Islands contributed about 10% in 2010 to the total volume collected (the share of population on the islands is about 12%). In 2015, the islands had the highest per capita collection except for the Athens region.
Source: AFIS
HUNGARY
Since 2000, the Product Fee Act has applied to accumulators (but not single charge batteries). From 2005 collective compliance became feasible as a compliance option and three producers organisations, RE’LEM, Re-bat and CCR Rebat have been operational since then. The management of waste batteries by ‘producer responsibility organisations’ has been working well, leading the Government to keep the waste producer responsibility scheme for batteries as it is when it replaced the competing organisation model applied to most other waste streams with state fund model from 2012.
The collection rate increased steadily from 34% in 2012 to 47% in 2015. EUROSTAT suggest POM declined by 72% from 2011 to 2012 (from 180 g in 2011 to 105 g per capita in 2012) – possibly due to delayed effects of the 2008/9 economic crisis. Since 2012, POM has increased briskly and in 2015 is back at the level of 2011. Collection volumes increased by annual average of 11% since 2010, notably in 2014 and 2015 (+14%, +19%). The national collection targets, from 7% in 2005, 18% in 2009, 25% in 2011 and 40% in 2015, had consistently been met or slightly exceeded.
16 Reportedly largely due to emerging importers but also due to an increase in POM of batteries embedded in EEE.
STUDY FOR EPBA ON WASTE PORTABLE BATTERIES COLLECTION RATES
UPDATE DEC-15 - SUMMARY OF CHANGES
21
Source: 2009-2015 Eurostat
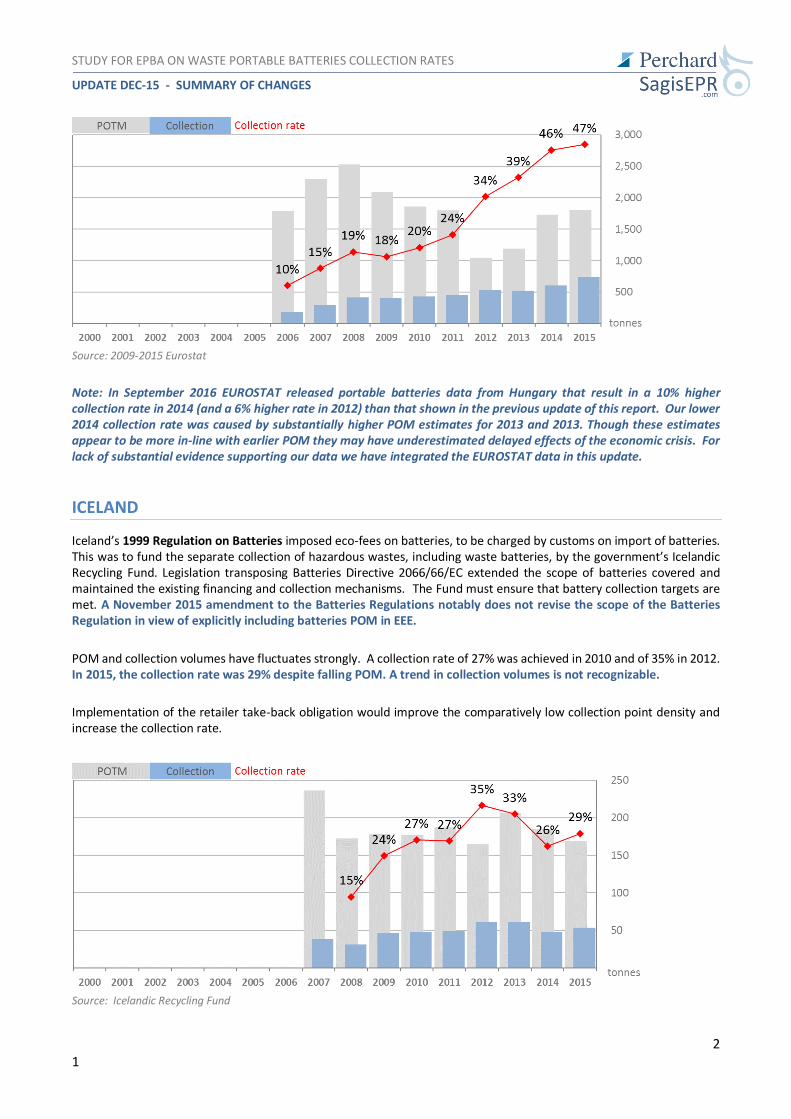
Note: In September 2016 EUROSTAT released portable batteries data from Hungary that result in a 10% higher collection rate in 2014 (and a 6% higher rate in 2012) than that shown in the previous update of this report. Our lower 2014 collection rate was caused by substantially higher POM estimates for 2013 and 2013. Though these estimates appear to be more in-line with earlier POM they may have underestimated delayed effects of the economic crisis. For lack of substantial evidence supporting our data we have integrated the EUROSTAT data in this update.
ICELAND
Iceland’s 1999 Regulation on Batteries imposed eco-fees on batteries, to be charged by customs on import of batteries. This was to fund the separate collection of hazardous wastes, including waste batteries, by the government’s Icelandic Recycling Fund. Legislation transposing Batteries Directive 2066/66/EC extended the scope of batteries covered and maintained the existing financing and collection mechanisms. The Fund must ensure that battery collection targets are met. A November 2015 amendment to the Batteries Regulations notably does not revise the scope of the Batteries Regulation in view of explicitly including batteries POM in EEE.
POM and collection volumes have fluctuates strongly. A collection rate of 27% was achieved in 2010 and of 35% in 2012. In 2015, the collection rate was 29% despite falling POM. A trend in collection volumes is not recognizable.
Implementation of the retailer take-back obligation would improve the comparatively low collection point density and increase the collection rate.
Source: Icelandic Recycling Fund

STUDY FOR EPBA ON WASTE PORTABLE BATTERIES COLLECTION RATES
UPDATE DEC-15 - SUMMARY OF CHANGES
22
IRELAND
Though producer responsibility for waste portable batteries has existed since 2004, no compliance organisation was set up until September 2008, when the two Irish WEEE organisations were also approved as the only two battery organisations (three years after their approval as WEEE organisations).
The collection rate increased quickly in the first 3 years after the legislation came into force (29%in 2011) and reached 33% in 2015. After 4 years of declines in the aftermath of the 2008 financial crash, POM increased by 23% in 2014 and by 12% in 2015. Collection has increased steadily since 2012.
Source: Environ.ie; 2015 EUROSTAT
A Producer Responsibility Initiative (PRI) Review of the WEEE & Batteries regimes, released by the Government in 2014, recommended that battery public awareness campaigns should be conducted under a single brand. However, the Department has not actioned this recommendation. The assessment also provided detailed recommendations for meeting the EU 45% collection target in 2016.
ITALY
Decree 188/2008 transposing Batteries Directive 2006/66/EC entered into force on 18 December 2008. About 2,500 battery producers currently comply through 13 organisations for portable batteries of which all except COBAT originate from WEEE organisations. The coordination centre CDCNPA, which acts as interface between all organisations and collectors including municipalities, became operational in late 2012, signed its first agreement with ANCI, the association of the regions and municipalities in November 2012. A revised agreement with ANCI was signed in July 2016. In December 2015 the Law ‘related to the environment’ stipulated that producers pay a (small) fee to cover the Government's costs of implementing waste batteries and WEEE legislation and formally enables an exemption for spent batteries from the environmental code (152/2006), as otherwise even retailers would have to register and report volumes from their battery collection boxes under the environmental code.
Coordination Centre data show that a collection rate of 25% was reached in 2011, the second year after the take-back obligation came into force, climbing to 40% in 2015. This was helped by POM having decreased consistently (-4.2% annual average since 2010) while collection increased steadily (+7.8% annual average since 2011). The Coordination Centre’s data do not fully reflect the entire market. National authorities’ data (available to 2014), show somewhat higher POM, leading to a 1% - 2% lower collection rate).
STUDY FOR EPBA ON WASTE PORTABLE BATTERIES COLLECTION RATES
UPDATE DEC-15 - SUMMARY OF CHANGES
23
Source: CDCNPA; Data do not fully reflect those declared to national authorities.
LATVIA
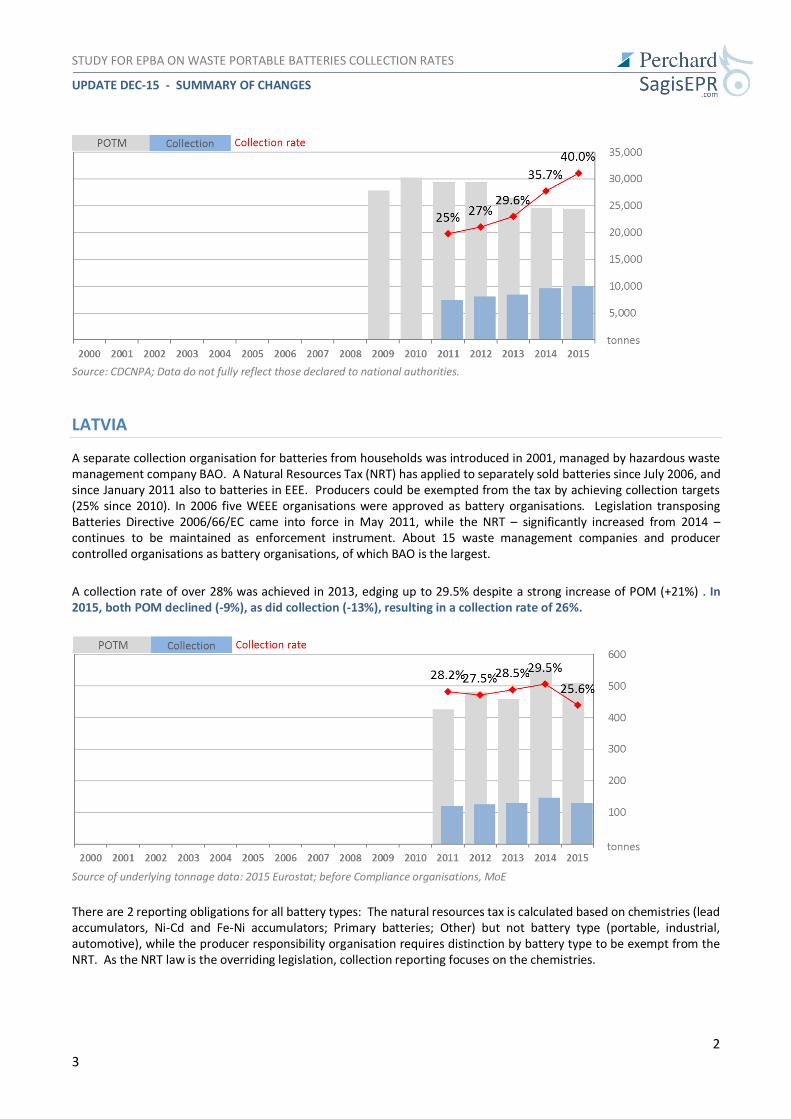
A separate collection organisation for batteries from households was introduced in 2001, managed by hazardous waste management company BAO. A Natural Resources Tax (NRT) has applied to separately sold batteries since July 2006, and since January 2011 also to batteries in EEE. Producers could be exempted from the tax by achieving collection targets (25% since 2010). In 2006 five WEEE organisations were approved as battery organisations. Legislation transposing Batteries Directive 2006/66/EC came into force in May 2011, while the NRT – significantly increased from 2014 – continues to be maintained as enforcement instrument. About 15 waste management companies and producer controlled organisations as battery organisations, of which BAO is the largest.
A collection rate of over 28% was achieved in 2013, edging up to 29.5% despite a strong increase of POM (+21%) . In 2015, both POM declined (-9%), as did collection (-13%), resulting in a collection rate of 26%.
Source of underlying tonnage data: 2015 Eurostat; before Compliance organisations, MoE
There are 2 reporting obligations for all battery types: The natural resources tax is calculated based on chemistries (lead accumulators, Ni-Cd and Fe-Ni accumulators; Primary batteries; Other) but not battery type (portable, industrial, automotive), while the producer responsibility organisation requires distinction by battery type to be exempt from the NRT. As the NRT law is the overriding legislation, collection reporting focuses on the chemistries.
STUDY FOR EPBA ON WASTE PORTABLE BATTERIES COLLECTION RATES
UPDATE DEC-15 - SUMMARY OF CHANGES
24
LITHUANIA
Since 2003, producers have had to pay an environmental pollution tax (EPT) on batteries. From 2008, producers could avoid the tax if they achieved collection targets by buying recycling notes from recyclers or through collective organisations. The collection target was lowered from 80% in 2011 to 25% in 2012, but the tax effectively increased by a factor of 6, which boosted the membership of the two producer controlled compliance organisations.
EPT and the producer responsibility regulations are very complex, inconsistent and subject to frequent changes. A better alignment of the two could significantly simplify compliance.
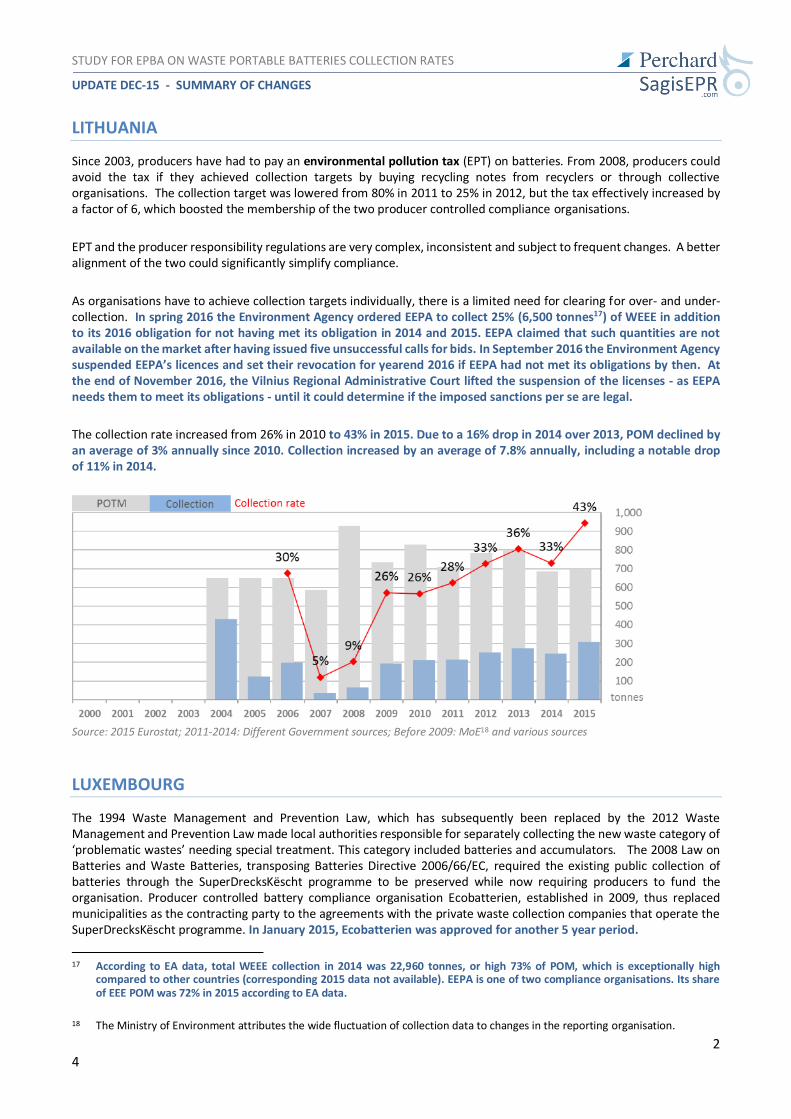
As organisations have to achieve collection targets individually, there is a limited need for clearing for over- and under-collection. In spring 2016 the Environment Agency ordered EEPA to collect 25% (6,500 tonnes17) of WEEE in addition to its 2016 obligation for not having met its obligation in 2014 and 2015. EEPA claimed that such quantities are not available on the market after having issued five unsuccessful calls for bids. In September 2016 the Environment Agency suspended EEPA’s licences and set their revocation for yearend 2016 if EEPA had not met its obligations by then. At the end of November 2016, the Vilnius Regional Administrative Court lifted the suspension of the licenses - as EEPA needs them to meet its obligations - until it could determine if the imposed sanctions per se are legal.
The collection rate increased from 26% in 2010 to 43% in 2015. Due to a 16% drop in 2014 over 2013, POM declined by an average of 3% annually since 2010. Collection increased by an average of 7.8% annually, including a notable drop of 11% in 2014.
Source: 2015 Eurostat; 2011-2014: Different Government sources; Before 2009: MoE18 and various sources
LUXEMBOURG
The 1994 Waste Management and Prevention Law, which has subsequently been replaced by the 2012 Waste Management and Prevention Law made local authorities responsible for separately collecting the new waste category of ‘problematic wastes’ needing special treatment. This category included batteries and accumulators. The 2008 Law on Batteries and Waste Batteries, transposing Batteries Directive 2006/66/EC, required the existing public collection of batteries through the SuperDrecksKëscht programme to be preserved while now requiring producers to fund the organisation. Producer controlled battery compliance organisation Ecobatterien, established in 2009, thus replaced municipalities as the contracting party to the agreements with the private waste collection companies that operate the SuperDrecksKëscht programme. In January 2015, Ecobatterien was approved for another 5 year period.
17 According to EA data, total WEEE collection in 2014 was 22,960 tonnes, or high 73% of POM, which is exceptionally high
compared to other countries (corresponding 2015 data not available). EEPA is one of two compliance organisations. Its share of EEE POM was 72% in 2015 according to EA data.
18 The Ministry of Environment attributes the wide fluctuation of collection data to changes in the reporting organisation.
STUDY FOR EPBA ON WASTE PORTABLE BATTERIES COLLECTION RATES
UPDATE DEC-15 - SUMMARY OF CHANGES
25
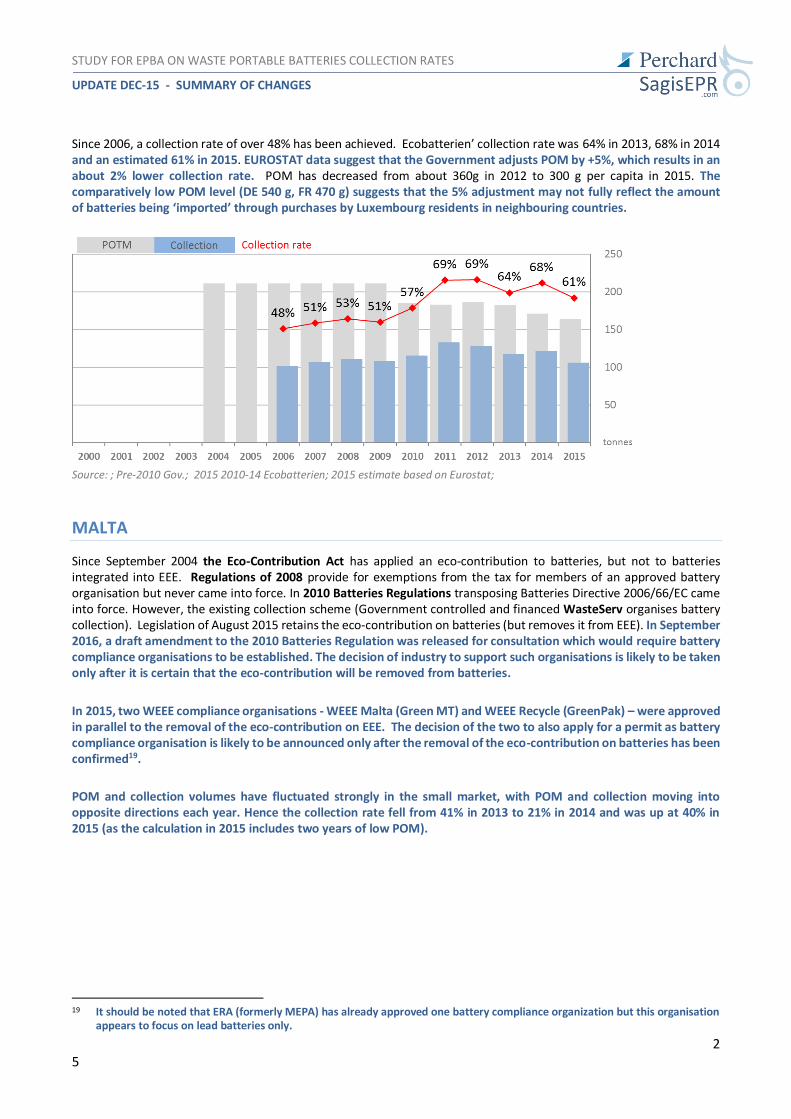
Since 2006, a collection rate of over 48% has been achieved. Ecobatterien’ collection rate was 64% in 2013, 68% in 2014 and an estimated 61% in 2015. EUROSTAT data suggest that the Government adjusts POM by +5%, which results in an about 2% lower collection rate. POM has decreased from about 360g in 2012 to 300 g per capita in 2015. The comparatively low POM level (DE 540 g, FR 470 g) suggests that the 5% adjustment may not fully reflect the amount of batteries being ‘imported’ through purchases by Luxembourg residents in neighbouring countries.
Source: ; Pre-2010 Gov.; 2015 2010-14 Ecobatterien; 2015 estimate based on Eurostat;
MALTA
Since September 2004 the Eco-Contribution Act has applied an eco-contribution to batteries, but not to batteries integrated into EEE. Regulations of 2008 provide for exemptions from the tax for members of an approved battery organisation but never came into force. In 2010 Batteries Regulations transposing Batteries Directive 2006/66/EC came into force. However, the existing collection scheme (Government controlled and financed WasteServ organises battery collection). Legislation of August 2015 retains the eco-contribution on batteries (but removes it from EEE). In September 2016, a draft amendment to the 2010 Batteries Regulation was released for consultation which would require battery compliance organisations to be established. The decision of industry to support such organisations is likely to be taken only after it is certain that the eco-contribution will be removed from batteries.
In 2015, two WEEE compliance organisations - WEEE Malta (Green MT) and WEEE Recycle (GreenPak) – were approved in parallel to the removal of the eco-contribution on EEE. The decision of the two to also apply for a permit as battery compliance organisation is likely to be announced only after the removal of the eco-contribution on batteries has been confirmed19.
POM and collection volumes have fluctuated strongly in the small market, with POM and collection moving into opposite directions each year. Hence the collection rate fell from 41% in 2013 to 21% in 2014 and was up at 40% in 2015 (as the calculation in 2015 includes two years of low POM).
19 It should be noted that ERA (formerly MEPA) has already approved one battery compliance organization but this organisation
appears to focus on lead batteries only.
STUDY FOR EPBA ON WASTE PORTABLE BATTERIES COLLECTION RATES
UPDATE DEC-15 - SUMMARY OF CHANGES
26
Source: MEPA
NETHERLANDS
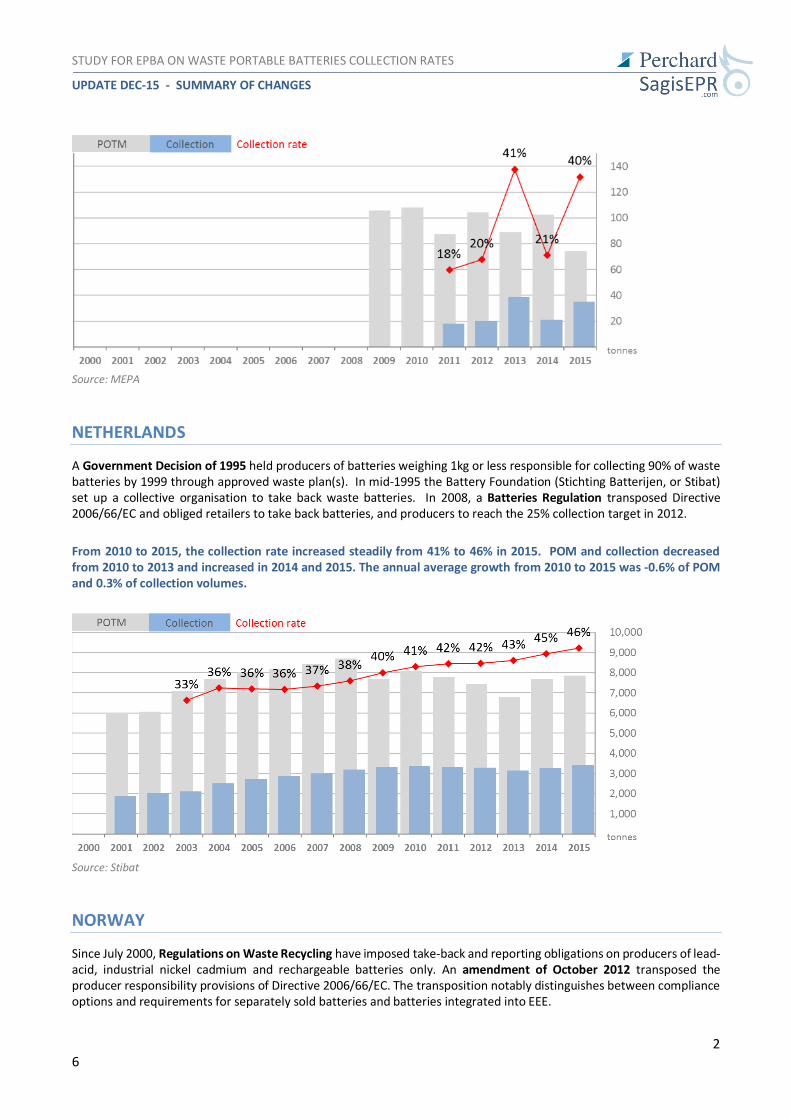
A Government Decision of 1995 held producers of batteries weighing 1kg or less responsible for collecting 90% of waste batteries by 1999 through approved waste plan(s). In mid-1995 the Battery Foundation (Stichting Batterijen, or Stibat) set up a collective organisation to take back waste batteries. In 2008, a Batteries Regulation transposed Directive 2006/66/EC and obliged retailers to take back batteries, and producers to reach the 25% collection target in 2012.
From 2010 to 2015, the collection rate increased steadily from 41% to 46% in 2015. POM and collection decreased from 2010 to 2013 and increased in 2014 and 2015. The annual average growth from 2010 to 2015 was -0.6% of POM and 0.3% of collection volumes.
Source: Stibat
NORWAY
Since July 2000, Regulations on Waste Recycling have imposed take-back and reporting obligations on producers of lead-acid, industrial nickel cadmium and rechargeable batteries only. An amendment of October 2012 transposed the producer responsibility provisions of Directive 2006/66/EC. The transposition notably distinguishes between compliance options and requirements for separately sold batteries and batteries integrated into EEE.

STUDY FOR EPBA ON WASTE PORTABLE BATTERIES COLLECTION RATES
UPDATE DEC-15 - SUMMARY OF CHANGES
27
Since 1999, Rebatt AS has been the only collective organisation for separately sold portable batteries. It shares its management with and operates collection under the name of Batteriretur, which has been the organisation for automotive lead-acid batteries since 1993. Producers of batteries integrated into EEE comply through one of five competing WEEE organisations.
The legal requirements to report POM weights only came into force from October 2012 but research for this report indicates that EUROSTAT data up to 2015 do not include batteries POM in EEE. Therefore we maintain our previous approach to estimate POM in this update by assuming that they contribute 36% of total POM, which results in similar POM per capita as the reported data from SE and DK.
The collection rate is subject to significant uncertainties about volumes of batteries in EEE and WEEE: On the basis of a number of reasoned assumptions20, we estimate a ‘collection’ rate (or recycling rate) of portable batteries was 45% in 2015.
As regards collection, in this update we newly added - for the years 2011 to 2015 - a stream of waste batteries that arises from WEEE during WEEE treatment as shown in EE-Registeret annual WEEE reports. From 2011 to 2014, this stream was 6.5 times as high as the amount of waste portable batteries that the single battery organisation Elretur received from WEEE compliance organisations. As these batteries are not collected by or returned to a battery compliance organisation the addition of this stream is arguable. Taking it into account substantially increases the ‘collection’ volume of our estimate and results in a collection rate similar to the one arrived at by EUROSTAT data, though underlying POM and collection volumes are higher.
On this basis, we estimate the ‘collection’ rate (or rather the recycling rate) of portable batteries was 45% in 2015.
Source: Collection data: Batteriretur; POM estimates based on Batteriretur communication
POLAND
Since 2002, the Act on Entrepreneurs’ Obligations has required producers to individually achieve collection targets and pay a product fee if the targets are not met. The Batteries and Accumulators Act of 2009 left the collection target cum product fee mechanism in place. The Act does not define or regulate compliance organisations and battery collectors. However, a comprehensive amendment to the Batteries Act introduced inter alia a formal role for compliance organisations from 2015.
20 In this update we newly added - for the years 2011 to 2015 - a stream of waste batteries that arises from WEEE during WEEE
treatment which is about 6.5 times as high as the amount of waste portable batteries that the single battery organisation Elretur receives from WEEE compliance organisations.
STUDY FOR EPBA ON WASTE PORTABLE BATTERIES COLLECTION RATES
UPDATE DEC-15 - SUMMARY OF CHANGES
28
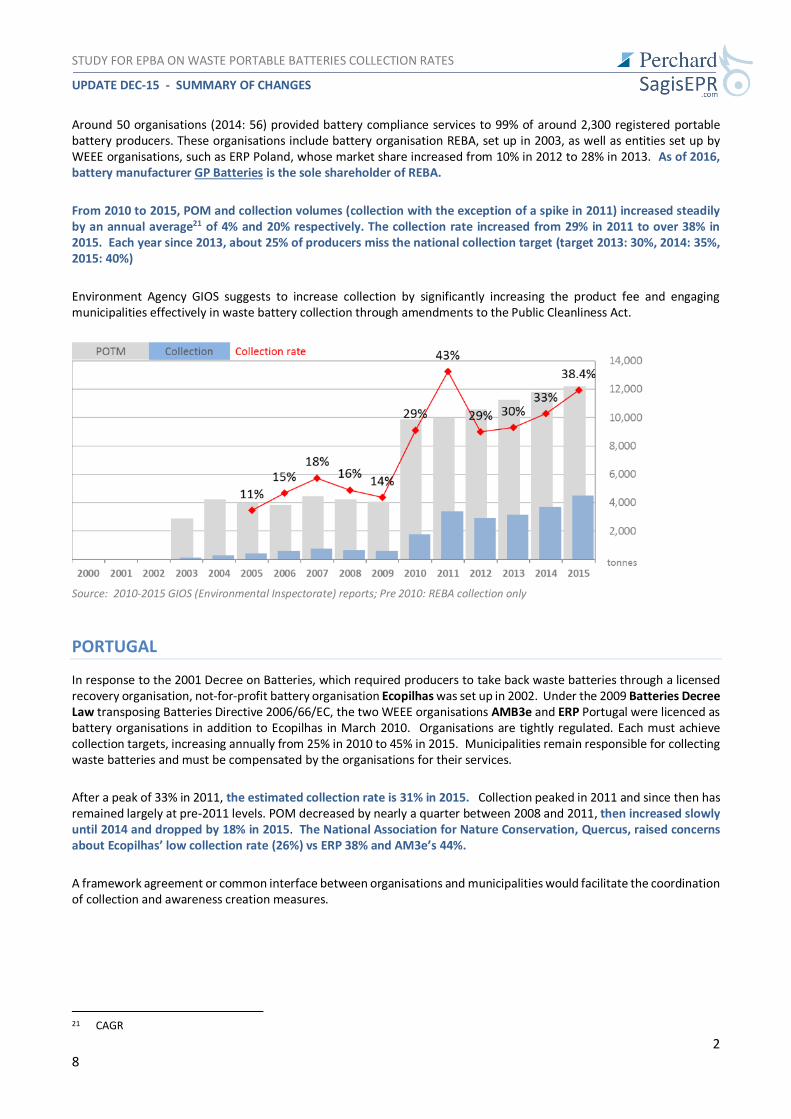
Around 50 organisations (2014: 56) provided battery compliance services to 99% of around 2,300 registered portable battery producers. These organisations include battery organisation REBA, set up in 2003, as well as entities set up by WEEE organisations, such as ERP Poland, whose market share increased from 10% in 2012 to 28% in 2013. As of 2016, battery manufacturer GP Batteries is the sole shareholder of REBA.
From 2010 to 2015, POM and collection volumes (collection with the exception of a spike in 2011) increased steadily by an annual average21 of 4% and 20% respectively. The collection rate increased from 29% in 2011 to over 38% in 2015. Each year since 2013, about 25% of producers miss the national collection target (target 2013: 30%, 2014: 35%, 2015: 40%)
Environment Agency GIOS suggests to increase collection by significantly increasing the product fee and engaging municipalities effectively in waste battery collection through amendments to the Public Cleanliness Act.
Source: 2010-2015 GIOS (Environmental Inspectorate) reports; Pre 2010: REBA collection only
PORTUGAL
In response to the 2001 Decree on Batteries, which required producers to take back waste batteries through a licensed recovery organisation, not-for-profit battery organisation Ecopilhas was set up in 2002. Under the 2009 Batteries Decree Law transposing Batteries Directive 2006/66/EC, the two WEEE organisations AMB3e and ERP Portugal were licenced as battery organisations in addition to Ecopilhas in March 2010. Organisations are tightly regulated. Each must achieve collection targets, increasing annually from 25% in 2010 to 45% in 2015. Municipalities remain responsible for collecting waste batteries and must be compensated by the organisations for their services.
After a peak of 33% in 2011, the estimated collection rate is 31% in 2015. Collection peaked in 2011 and since then has remained largely at pre-2011 levels. POM decreased by nearly a quarter between 2008 and 2011, then increased slowly until 2014 and dropped by 18% in 2015. The National Association for Nature Conservation, Quercus, raised concerns about Ecopilhas’ low collection rate (26%) vs ERP 38% and AM3e’s 44%.
A framework agreement or common interface between organisations and municipalities would facilitate the coordination of collection and awareness creation measures.
21 CAGR

STUDY FOR EPBA ON WASTE PORTABLE BATTERIES COLLECTION RATES
UPDATE DEC-15 - SUMMARY OF CHANGES
29
Source:2015 EUROSTAT; Before: Estimates from organisations, notably Ecopilhas (difference to EUROSTAT data 2013/4 minor)
ROMANIA
Although Batteries Directive 2006/66/EC was transposed by a Decree in 2008 and producers had to be registered from July 2009, subsidiary legislation required for implementation was delayed until November 2011 and the first battery organisation was only approved in April 2012. Romania is one of a the few ‘new‘ member states that transposed the Batteries Directive without a state fund mechanism. However, a June 2016 amendment introduces a penalty fee for not reaching the collection target (from 2018) and for erroneous POM reporting (in 2017). An amendment in August 2016 inter alia introduces an obligation for local authorities to collect waste batteries and removes the possibility of battery compliance organisations operating under ‘tacit approval’ (considered to have been granted if authorities do not respond to an applicant in time).
Currently four portable battery organisations are operating.
Five years after start of the operations, the collection rate reached 32% in 2014. Waste portable battery collection essentially doubled each year until 2013 and increased by 6% in 2014. POM dropped 47% in 2013 but was back to the 2012 level in 2014. Data for 2015 are not yet available.
Source: Ministry of Environment (MoE), 2015 data are not available and in this graph assumed to be 2014 values;

STUDY FOR EPBA ON WASTE PORTABLE BATTERIES COLLECTION RATES
UPDATE DEC-15 - SUMMARY OF CHANGES
30
SLOVAKIA
Since 2001, the Product Fee Act has subjected separately sold batteries to fees of the Recycling Fund on 100% of batteries placed on the market less the amount of batteries collected by producers themselves or collected on their behalf. The Recycling Fund is a non-state body run by a Government-appointed Board of Directors. Waste management companies Mach Trade and Elektrorecyling are two of four companies mandated to operate battery collection organisations for municipalities, financed by local taxes and the Recycling Fund. A new Waste Act, in force from 2016, introduced full EPR (competing organisation with clearing house), requires producers to comply though approved compliance organisations (that must be controlled by producers) and abolishes the Recycling Fund from 2017. In December 2015, a number of implementing regulations were published, including a ‘Decree on EPR and management of selected product waste streams’ which provides detailed registration requirements, authorization and reporting requirements. In May 2016, six organisations were approved as compliance organisations for portable battery producers, including Asekol, SEWA (ERP), Naturpak, E-cycling and Slowmas
The collection rate climbed from 18% in 2010 to 61% in 2012 and, after fluctuations, was 53% in 2015. The exceptionally high rates are supported by comparatively low POM (173 g per capita in 2015; for comparison: PL 321 g, CZ 376g). Collection volumes on a per capita basis are comparable to those in neighbouring countries.
Source: Ministry of Environment
SLOVENIA
Since 2003, municipalities have been obliged to separately collect hazardous wastes including batteries. They remain responsible for financing their collection infrastructure. In 2008 and 2010, Decrees transposing Batteries Directive 2006/66/EC required individual producers of separately sold batteries to achieve collection targets by taking back waste batteries from retailers, municipalities and their own collection points through approved waste management plans. Producers of EEE with integrated batteries do not need a separate waste management plan for batteries, but comply through their WEEE management plan. Three WEEE organisations, ZEOS, Interseroh and Slopak offer ‘joint’ battery management plans that were approved in November 2009.
Collection through the approved battery waste management plans increased quickly from 5 g per capita in 2009 to 125 g in 2011. In 2011, POM dropped 57%, letting the collection rate climb to 33% in 2012. In 2015 POM dropped to its lowest level yet, while collection increased (to 10% below its high of 2012), causing the collection in 2015 to peak at 35%.

STUDY FOR EPBA ON WASTE PORTABLE BATTERIES COLLECTION RATES
UPDATE DEC-15 - SUMMARY OF CHANGES
31
Source: Republic of Slovenia Statistical Office
SPAIN
Royal Decree 45/1996 held the Autonomous Communities responsible for separately collecting waste batteries. Royal Decree 106/2008 transposing Batteries Directive 2006/66/EC made producers responsible for taking back waste batteries and left each Autonomous Community responsible for authorising organisations operating on their territory. Decentralisation of authority slowed the implementation of producer compliance organisations and complicates waste flow monitoring. Though the legal framework for simplified requirements has been in place since 2012, these have yet to be fully implemented through an amendment to the Batteries Decree. In 2015 a new WEEE Decree extended EEE reporting and take back obligations to ‘batteries that the end-user cannot manually remove from WEEE’. The (unknown) POM weight of these batteries is reflected in the WEEE collection target calculation.
Producers comply through battery organisation Ecopilas, set up in 2000 by electronics association Asimelec and, from around 2009, also through WEEE organisations ERP, ECOLEC and EcoRAEE. In 2014, Ecopilas share of POM was an estimated 64% and its share of collection about 60%. ERP – whose members include Duracell – contributed about an estimated 34% to POM and 39% to collection. In 2015, Ecolec collected 6% of total waste portable batteries.
The collection increased from 34% in 2012 to 39% in 2014, and decreased to 37% in 2015, as POM grew 10%. POM had peaked in 2010, dropped until 2013 and increased back up to near the 2010 level in 2015. Collection increased by annual average of 5% since 2010, with large increases in 2010 and 2012 and 2014.
Source: POM national register; Collection: Compliance organisations
STUDY FOR EPBA ON WASTE PORTABLE BATTERIES COLLECTION RATES
UPDATE DEC-15 - SUMMARY OF CHANGES
32
SWEDEN
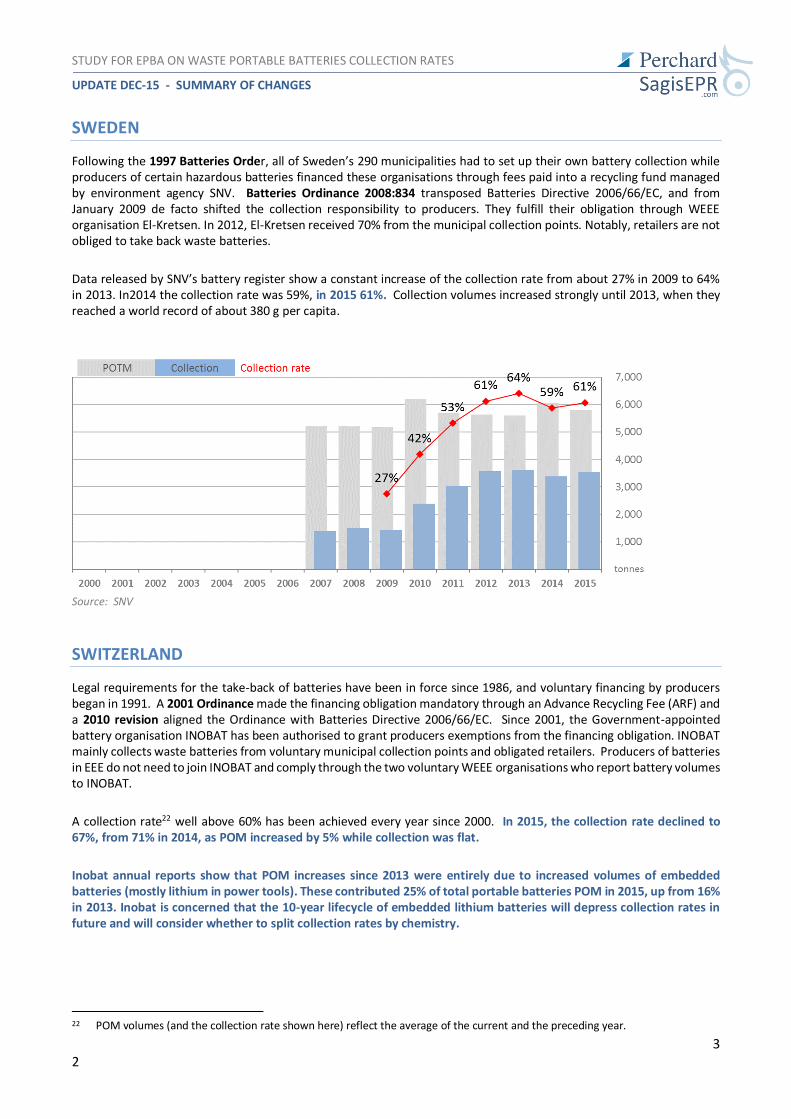
Following the 1997 Batteries Order, all of Sweden’s 290 municipalities had to set up their own battery collection while producers of certain hazardous batteries financed these organisations through fees paid into a recycling fund managed by environment agency SNV. Batteries Ordinance 2008:834 transposed Batteries Directive 2006/66/EC, and from January 2009 de facto shifted the collection responsibility to producers. They fulfill their obligation through WEEE organisation El-Kretsen. In 2012, El-Kretsen received 70% from the municipal collection points. Notably, retailers are not obliged to take back waste batteries.
Data released by SNV’s battery register show a constant increase of the collection rate from about 27% in 2009 to 64% in 2013. In2014 the collection rate was 59%, in 2015 61%. Collection volumes increased strongly until 2013, when they reached a world record of about 380 g per capita.
Source: SNV
SWITZERLAND
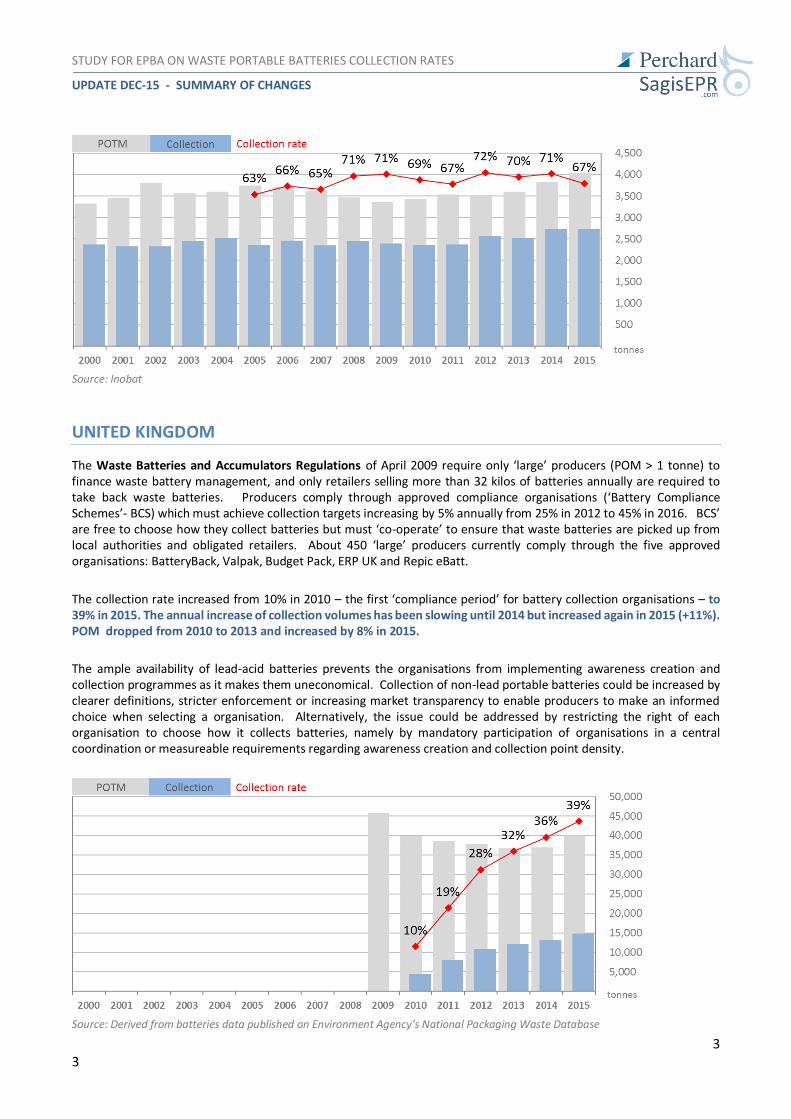
Legal requirements for the take-back of batteries have been in force since 1986, and voluntary financing by producers began in 1991. A 2001 Ordinance made the financing obligation mandatory through an Advance Recycling Fee (ARF) and a 2010 revision aligned the Ordinance with Batteries Directive 2006/66/EC. Since 2001, the Government-appointed battery organisation INOBAT has been authorised to grant producers exemptions from the financing obligation. INOBAT mainly collects waste batteries from voluntary municipal collection points and obligated retailers. Producers of batteries in EEE do not need to join INOBAT and comply through the two voluntary WEEE organisations who report battery volumes to INOBAT.
A collection rate22 well above 60% has been achieved every year since 2000. In 2015, the collection rate declined to 67%, from 71% in 2014, as POM increased by 5% while collection was flat.
Inobat annual reports show that POM increases since 2013 were entirely due to increased volumes of embedded batteries (mostly lithium in power tools). These contributed 25% of total portable batteries POM in 2015, up from 16% in 2013. Inobat is concerned that the 10-year lifecycle of embedded lithium batteries will depress collection rates in future and will consider whether to split collection rates by chemistry.
22 POM volumes (and the collection rate shown here) reflect the average of the current and the preceding year.
STUDY FOR EPBA ON WASTE PORTABLE BATTERIES COLLECTION RATES
UPDATE DEC-15 - SUMMARY OF CHANGES
33
Source: Inobat
UNITED KINGDOM
The Waste Batteries and Accumulators Regulations of April 2009 require only ‘large’ producers (POM > 1 tonne) to finance waste battery management, and only retailers selling more than 32 kilos of batteries annually are required to take back waste batteries. Producers comply through approved compliance organisations (‘Battery Compliance Schemes’- BCS) which must achieve collection targets increasing by 5% annually from 25% in 2012 to 45% in 2016. BCS’ are free to choose how they collect batteries but must ‘co-operate’ to ensure that waste batteries are picked up from local authorities and obligated retailers. About 450 ‘large’ producers currently comply through the five approved organisations: BatteryBack, Valpak, Budget Pack, ERP UK and Repic eBatt.
The collection rate increased from 10% in 2010 – the first ‘compliance period’ for battery collection organisations – to 39% in 2015. The annual increase of collection volumes has been slowing until 2014 but increased again in 2015 (+11%). POM dropped from 2010 to 2013 and increased by 8% in 2015.
The ample availability of lead-acid batteries prevents the organisations from implementing awareness creation and collection programmes as it makes them uneconomical. Collection of non-lead portable batteries could be increased by clearer definitions, stricter enforcement or increasing market transparency to enable producers to make an informed choice when selecting a organisation. Alternatively, the issue could be addressed by restricting the right of each organisation to choose how it collects batteries, namely by mandatory participation of organisations in a central coordination or measureable requirements regarding awareness creation and collection point density.
Source: Derived from batteries data published on Environment Agency’s National Packaging Waste Database
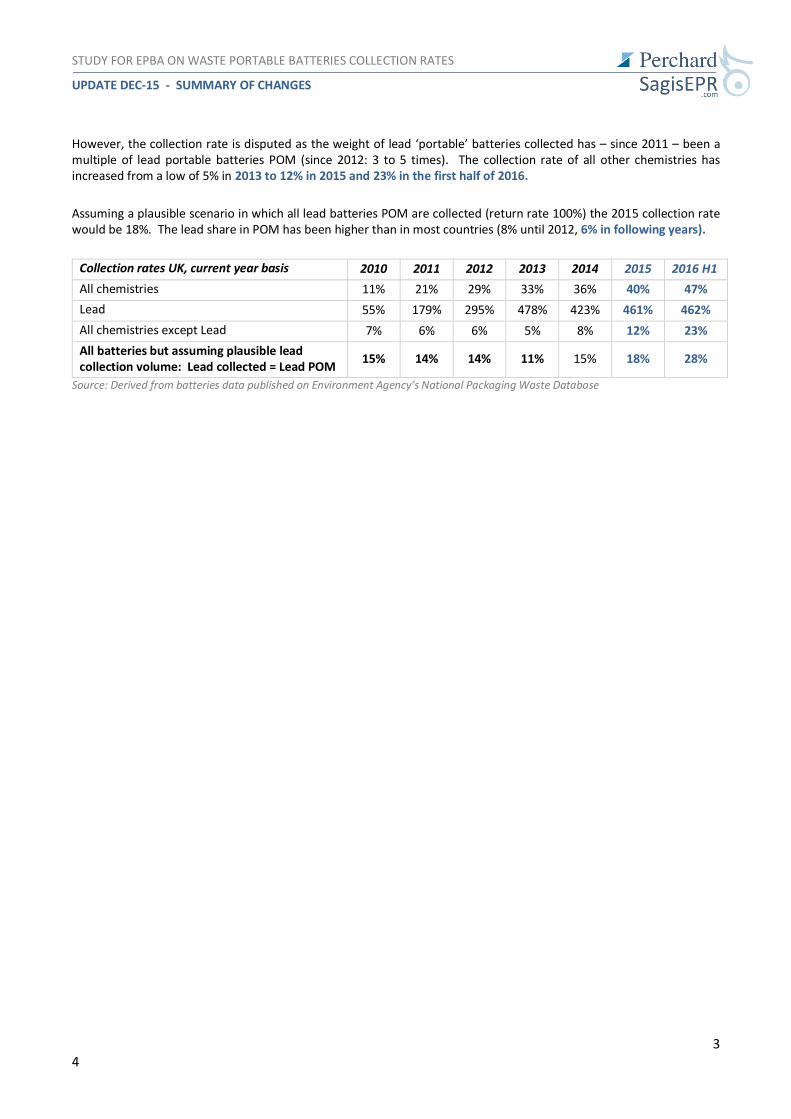
STUDY FOR EPBA ON WASTE PORTABLE BATTERIES COLLECTION RATES
UPDATE DEC-15 - SUMMARY OF CHANGES
34
However, the collection rate is disputed as the weight of lead ‘portable’ batteries collected has – since 2011 – been a multiple of lead portable batteries POM (since 2012: 3 to 5 times). The collection rate of all other chemistries has increased from a low of 5% in 2013 to 12% in 2015 and 23% in the first half of 2016.
Assuming a plausible scenario in which all lead batteries POM are collected (return rate 100%) the 2015 collection rate would be 18%. The lead share in POM has been higher than in most countries (8% until 2012, 6% in following years).
Collection rates UK, current year basis 2010 2011 2012 2013 2014 2015 2016 H1
All chemistries 11% 21% 29% 33% 36% 40% 47%
Lead 55% 179% 295% 478% 423% 461% 462%
All chemistries except Lead 7% 6% 6% 5% 8% 12% 23%
All batteries but assuming plausible lead collection volume: Lead collected = Lead POM
15% 14% 14% 11% 15% 18% 28%
Source: Derived from batteries data published on Environment Agency’s National Packaging Waste Database