the commercial bank (p. s.q.c ... - personal banking
TRANSCRIPT

The Commercial Bank (P.S.Q.C.) Financial ResultsFor the quarter ended 31 March 2021

Forward Looking Statements
• This presentation and subsequent discussion may contain certain forward-looking statements with respect
to certain plans and current goals and expectations of Commercial Bank and its associated companies
relating to their future financial condition and performance. These forward-looking statements do not
relate only to historical or current facts but also represent Commercial Bank’s expectations and beliefs
concerning future events. By their nature forward-looking statements involve known and unknown risks
and uncertainty because they relate to future events and circumstances including a number of factors
which are beyond Commercial Bank’s control. As a result, Commercial Bank’s actual future results or
performance may differ materially from the plans, goals and expectations expressed or implied in such
statements.
• Any forward-looking statements made by or on behalf of Commercial Bank speak only as of the date they
are made. Commercial Bank does not undertake to update forward-looking statements to reflect any
changes in Commercial Bank’s expectations with regard thereto or any changes in events, conditions or
circumstances on which any such statement is based. The information, statements and opinions contained
in this presentation do not constitute a public offer under any applicable legislation or an offer to sell or
solicitation of an offer to buy any securities or financial instruments or any advice or recommendation with
respect to such securities or other financial instruments.
2

STRATEGIC INTENT
CONSOLIDATED HIGHLIGHTS AND PERFORMANCE
ALTERNATIF BANK PERFORMANCE
3

Strategic intent
1
2
3
4
5
6
7
8
9A region-wide ‘Alliance of banks’ with closer integration of risk protocols and business strategy for sustainable earnings
Market leader for compliance and good governance - conservative dividend pay-out policy (aim for maximum 50% pay-out ratio)
‘One Team – One Bank’ culture
Deepen our digital leadership through end-to-end process automation
Focus on client experience as a key differentiator
Costs broadly held flat until CB moves back into alignment with the market average
Reshape and diversify our loan book
De-risk legacy assets, diversify the portfolio and proactively exit high risk names
Maintain a minimum CET1 range of 11.0% to 11.5%
4

STRATEGIC INTENT
CONSOLIDATED HIGHLIGHTS AND PERFORMANCE
ALTERNATIF BANK PERFORMANCE
5

Executive summary
Results
Capital & Funding
Reshaping Loan Book
Costs
Subsidiaries& Associates
Strategic Focus Progress
Provisioning
• Net profit of QAR 602.7 million, up by 50.0% compared to the same period in Q1 2020.• Normalized operating income of QAR 1,086.5 million, up by 8.4% (+28.0% on reported basis) • Normalized NIMs increased to 2.6% from 2.5% (reported 2.4%) in Q1 2020.• Operating profit of QAR 795.0 million, up by 8.8% as compared to Q1 2020.• Total assets of QAR 163.1 billion, up by 11.4% .• “Best Bank in Qatar 2021” from the Global Finance.• The “Serving Business Owners” and the “Data Management and Security” awards in Private Banking and Wealth Management in Qatar for 2021 from Euromoney.• S&P revised outlook to “Positive” indicating the possibility of an upgrade in the next 12 – 24 months.
• CET1 1, Tier 1 and Total Capital Ratios at 12.0%, 16.3% and 18.3%, respectively, as compared to 11.1%, 14.6% and 16.6% at Mar 2020. • Successfully launched a senior unsecured five-year bond for USD 500 million. The issuance was oversubscribed 3.8 times and had one of the lowest coupon ever
achieved by a Qatari FI issuer on a public transaction.• Issued international AT1 of USD 500 million in March 2021.• Low cost deposits have increased by 26.6%, year-on-year.
• Consolidated loan book stood at QAR 99.4 billion, up 12.0% vs Mar 2020. • To support our corporate customers and the economy, we have postponed loan installments and interest payments.• Focus remains on re-shaping profile of the lending book, by diversifying risk across a range of sectors including decreasing real estate exposure and increasing exposure
to government and public sector. Government sector increased by 31.9%.
• NPL ratio decreased to 4.2% at Mar 2021 compared to 5.0% at Mar 2020, while loan coverage ratio (including ECL) increased to 105.9% as compared to 84.6% at Mar 2020.
• Gross provisions at QAR 275.3 million, higher by 28.7% in Q1 2021 mainly on account of higher provisions on NPL customers. • Gross cost of risk increased to 108 bps from 94 bps in Q1 2020, however net cost of risk at 87 bps compared with 83 bps in Q1 2020 due to strong recoveries.
• Normalized consolidated Cost to Income ratio decreased from 27.1% (reported 19.5%) in Q1 2020 to 26.8% (reported 31.5%) and in Qatar from 23.3% (reported 13.9%) in Q1 2020 to 22.2% (reported 27.5%).
• Alternatif Bank reported net loss of TL 41.3m (QAR 20.7m), compared to a net profit of TL 40.3m in Q1 2020.• NBO reported net profit of OMR 6.9m (CB’s share QAR 22.7m), down by 36.2% as compared to Q1 2020.• UAB reported a net profit of AED 10.2m (CB’s share of QAR 4.0m), as compared to net loss of AED 70.4m in Q1 2020.
6Normalized number excludes the impact of fully hedge staff performance rights scheme. Due to accounting requirements it results in a gross up of operating income and operating cost lines, so accordingly, the impact is removed to show the underlying trend of the results.
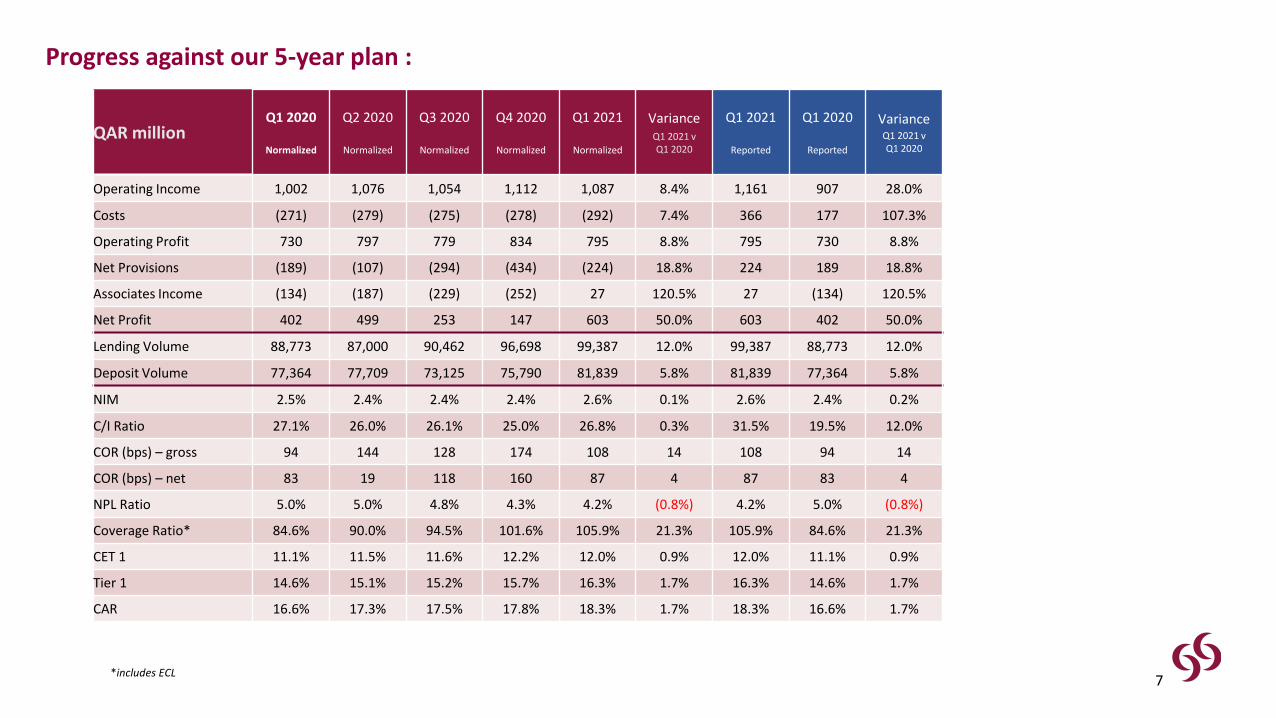
Progress against our 5-year plan :
QAR millionQ1 2020
Normalized
Q2 2020
Normalized
Q3 2020
Normalized
Q4 2020
Normalized
Q1 2021
Normalized
VarianceQ1 2021 v Q1 2020
Q1 2021
Reported
Q1 2020
Reported
VarianceQ1 2021 v Q1 2020
Operating Income 1,002 1,076 1,054 1,112 1,087 8.4% 1,161 907 28.0%
Costs (271) (279) (275) (278) (292) 7.4% 366 177 107.3%
Operating Profit 730 797 779 834 795 8.8% 795 730 8.8%
Net Provisions (189) (107) (294) (434) (224) 18.8% 224 189 18.8%
Associates Income (134) (187) (229) (252) 27 120.5% 27 (134) 120.5%
Net Profit 402 499 253 147 603 50.0% 603 402 50.0%
Lending Volume 88,773 87,000 90,462 96,698 99,387 12.0% 99,387 88,773 12.0%
Deposit Volume 77,364 77,709 73,125 75,790 81,839 5.8% 81,839 77,364 5.8%
NIM 2.5% 2.4% 2.4% 2.4% 2.6% 0.1% 2.6% 2.4% 0.2%
C/I Ratio 27.1% 26.0% 26.1% 25.0% 26.8% 0.3% 31.5% 19.5% 12.0%
COR (bps) – gross 94 144 128 174 108 14 108 94 14
COR (bps) – net 83 19 118 160 87 4 87 83 4
NPL Ratio 5.0% 5.0% 4.8% 4.3% 4.2% (0.8%) 4.2% 5.0% (0.8%)
Coverage Ratio* 84.6% 90.0% 94.5% 101.6% 105.9% 21.3% 105.9% 84.6% 21.3%
CET 1 11.1% 11.5% 11.6% 12.2% 12.0% 0.9% 12.0% 11.1% 0.9%
Tier 1 14.6% 15.1% 15.2% 15.7% 16.3% 1.7% 16.3% 14.6% 1.7%
CAR 16.6% 17.3% 17.5% 17.8% 18.3% 1.7% 18.3% 16.6% 1.7%
7*includes ECL

Group Profitability Consolidated Balance Sheet
Performance Ratios Capital
Group Financial Performance – Quarter ended 31 March 2021
QAR Million Q1 2021 Q1 2020 %
Net interest income 856 809 5.9%
Non-interest income 305 98 210.2%
Total costs (366) (177) 107.3%
Net provisions (224) (189) 18.8%
Associates income(loss)
27 (134) 120.5%
Net profit after tax 603 402 50.0%
QAR Million 31.03.21 31.03.20 %
Total assets 163,080 146,404 11.4%
Loans & advances 99,387 88,773 12.0%
Investment Securities 25,452 26,204 -2.9%
Customer Deposits 81,839 77,364 5.8%
Total equity 23,415 20,624 13.5%
31.03.21 31.03.20
ROAE 10.6% 7.5%
ROAA 1.5% 1.1%
NIM 2.6% 2.4%
31.03.21 31.03.20
RWA (QAR million) 116,804 116,445
Tier 1 ratio (Basel III) 16.3% 14.6%
Total Capital ratio (Basel III) 18.3% 16.6%
8

Leader in Digital Innovation Driving Customer Experience and Cost Benefits
Corporate• Best Cash Management Bank (2016 – 2020) from The Asian Banker • Best Transaction Bank in Qatar (2018-2020) from The Asian Banker• Best Online Cash Management (2019, 2020) from Global Finance• Best Trade Finance Service (2019, 2020) from Global Finance• Best Mobile Banking App from Global Finance and International Finance
Retail• Best Retail Bank in Qatar (2017-2020) from The Asian Banker• The “Serving Business Owners” and the “Data Management and Security”
awards in Private Banking and Wealth Management in Qatar for 2021 from Euromoney.
Innovation Awards• Best Bank in Qatar from Global Finance (2021)• Best Performing Bank from The Banker (2020)• Best Digital Bank from ASIAMoney (2020)• Most Innovative Digital Bank from International Finance (2020)• Best Consumer Digital Bank, Best Online Product Offering, and Most
Innovative Digital Bank from Global Finance (2020)
Source: Company information.9

2.2% 2.1%2.3% 2.4% 2.5% 2.6%
2017 2018 2019* 2020* Q1 2020* Q1 2021*
Profitability Net interest margin
Operating Profit
Net interest income as a % of average interest earning assets, including (i) Loans and advances to customers (ii) bonds and (iii) loans to other credit institutions
Normalized net interest income up by 7.4% to QAR 856.0m (+5.9 on reported basis) in Mar 2021 v Mar 2020.
Normalized NIM increased to 2.6% in Mar 2021 vs 2.5% (actual reported 2.4%) in Mar 2020.
Increase in margins resulted from proactive management of the cost of funding.
In Turkey, unexpected high increase in the interest rate volatility caused an impact on ALM resulting in lower net interest income compared to Q1 2020.
Normalized non-interest income up by 12.3% to QAR 230.5m (+210.2% to QAR 304.8m on reported basis) in Mar 2021 v Mar 2020.
Net income from investment activities increased byQAR 123.2m due to unrealized mark to market movement in investments.
Normalized net fee and commission income decreased by QAR 97.8m (however, up by 83.4 million on reported basis) mainly on account of the underlying hedge of the performance rights scheme due to the movement in CB share price.
Earnings Performance – Quarter ended 31 March 2021
2,204 2,3352,753
3,141
730 795
2017 2018 2019* 2020 Q1 2020 Q1 2021
10
*Represents normalized operating profit
*Represents normalized NIM

37.5%
33.4%
28.7%
26.0%27.1% 26.8%
2017 2018 2019* 2020* Q1 2020* Q1 2021*
Operating Expenses Cost to Income Ratio Consolidated
Cost to Income Ratio Domestic
Cost to income ratio at 26.8% (actual reported 31.5%), down by 0.3%as compared to Q1 2020 mainly on account of growth in operating income by QAR 84.6m on normalized basis.
Continued focus on digital processes and tight expense management.
In Qatar, normalized Cost to Income Ratio improved from 23.3% (actual reported 13.9%) in Q1 2020 to 22.2% (actual reported 27.5%)in Q1 2021.
Continuous income growth and cost efficiency further improves cost income ratio
33.0%
28.5%
25.5%
22.0%23.3%
22.2%
2017 2018 2019* 2020* Q1 2020* Q1 2021*
*Represents Normalized C/I ratio
11

Consumption, 13%
Real Estate, 13%
Services, 16%
Commercial, 13%
Contracting, 3%
Gov. & Semi-Gov. Agencies,
35%
Other, 1%Industry, 1%
Outside Qatar, 5%
Loans to customers at QAR 99.4bn, grew by 12.0% v Mar 2020.
Growth in consumption and government & public sectors .
Reduction in real estate and services sectors.
Loan book diversified across sectors.
Corporate customers represent 87.7% of total loan book
Focus continues on improving market share in Government and Public sector.
Summary Loan book breakdown by division – March 2021
Qatari banks credit facilities breakdown by sector – Mar 2021 Loan book breakdown by sector – March 2021
Source: QCB
Improved loan book structure
12
Corporate88%
Retail12%
Sector Mar-21 Mar-20
Govt and Public Sector 19% 16%
Industry 8% 9%
Commercial 13% 13%
Services 25% 29%
Contracting 4% 4%
Real Estate 19% 21%
Consumption 9% 7%
Other 3% 1%
100% 100%
805 839 983 1,146 987 1079
927 713 483 494
517 725 726 546
746
552
3,025 2,825 2,295
2,6352352
2702
5.0%
5.6%
4.9%
4.3%
5.0%
4.2%
2017 2018 2019 2020 Q1 2020 Q1 2021
Retail UHNW SME Corporate Gross NPLs / Gross Loans
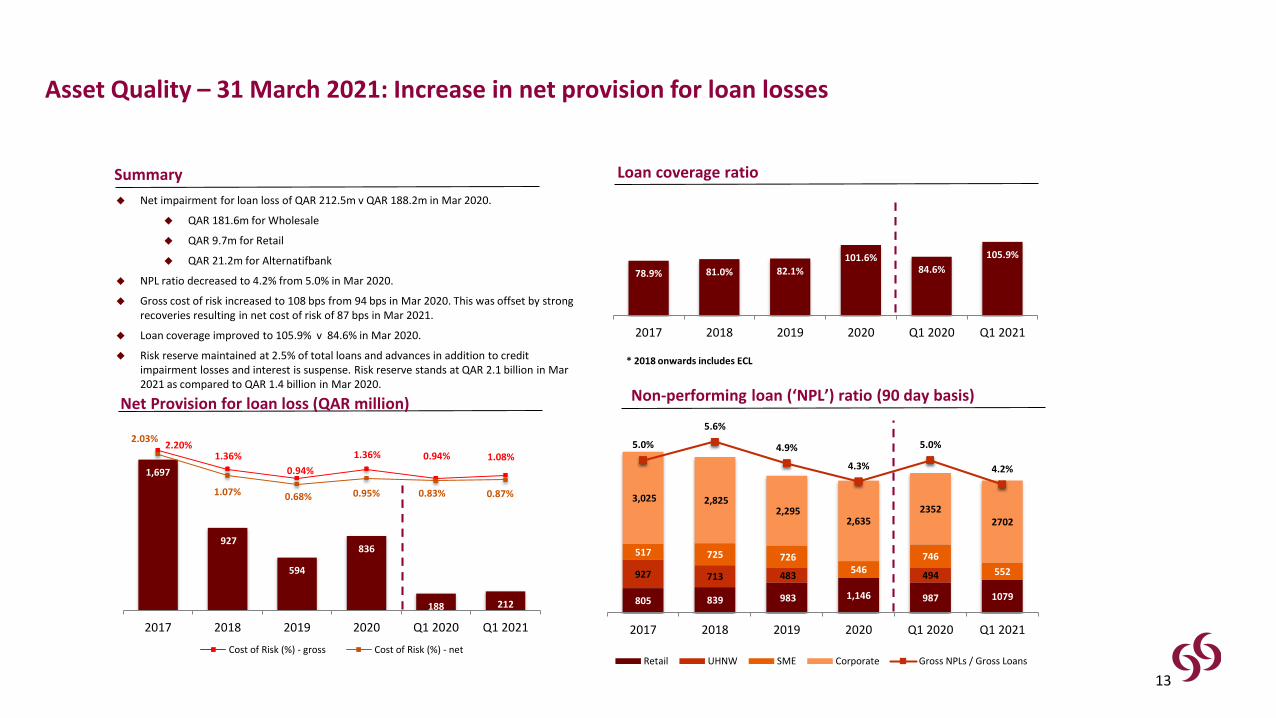
Summary Loan coverage ratio
Non-performing loan (‘NPL’) ratio (90 day basis)
Net impairment for loan loss of QAR 212.5m v QAR 188.2m in Mar 2020.
QAR 181.6m for Wholesale
QAR 9.7m for Retail
QAR 21.2m for Alternatifbank
NPL ratio decreased to 4.2% from 5.0% in Mar 2020.
Gross cost of risk increased to 108 bps from 94 bps in Mar 2020. This was offset by strong recoveries resulting in net cost of risk of 87 bps in Mar 2021.
Loan coverage improved to 105.9% v 84.6% in Mar 2020.
Risk reserve maintained at 2.5% of total loans and advances in addition to credit impairment losses and interest is suspense. Risk reserve stands at QAR 2.1 billion in Mar 2021 as compared to QAR 1.4 billion in Mar 2020.
78.9% 81.0% 82.1%
101.6%84.6%
105.9%
2017 2018 2019 2020 Q1 2020 Q1 2021
Asset Quality – 31 March 2021: Increase in net provision for loan losses
Net Provision for loan loss (QAR million)
* 2018 onwards includes ECL
13
1,697
927
594
836
188 212
2.20%1.36%
0.94%
1.36% 0.94% 1.08%
2.03%
1.07% 0.68% 0.95% 0.83% 0.87%
2017 2018 2019 2020 Q1 2020 Q1 2021
Cost of Risk (%) - gross Cost of Risk (%) - net

50%
14%
14%
16%6%
Customers' Deposits
Total Shareholders'Equity
Due to Banks andFinancial Institutions
Debt Securities & Otherborrowings
Other Liabilities
Summary Total funding mix – 31 March 2021
Debt issued and other borrowed funds Commercial Bank credit ratings
Customers’ deposits at QAR 81.8bn, up by 5.8% vs Mar 2020 representing 50.2% of the total balance sheet
Successfully launched a senior unsecured five-year bond for USD 500 million. The issuance was oversubscribed 3.8 times and one of the lowest prices by a Qatari FI issuer on a public transaction.
Well diversified funding mix
Total equity represents 14.4% of funding mix
Funding : Continue to build up diverse sources of funding
Rating Agency
Foreign Ccy Deposits/IDR Bank
StrengthOutlook Date
LT ST
S&P BBB+ A-2 bb+ Positive Apr 21
Moody’s A3 Prime 2 ba1 Stable Dec 20
Fitch A F1 bb+ Stable Dec 20
14
Issuance Type (QARm) Mar-21 Mar-20
Subordinated Notes 1,823 1,272
EMTN 9,114 7,150
Senior Notes 210 407
Other loans (including CPs) 14,935 13,141
Total 26,082 21,970
Corporate, 19%
Individuals, 23%
Non Resident, 28%
Gov. & Semi-Gov. Agencies,
30%
2017 2018 2019 2020 Q1 2020 Q1 2021
Time Deposits Savings Deposits Demand & Call Deposits
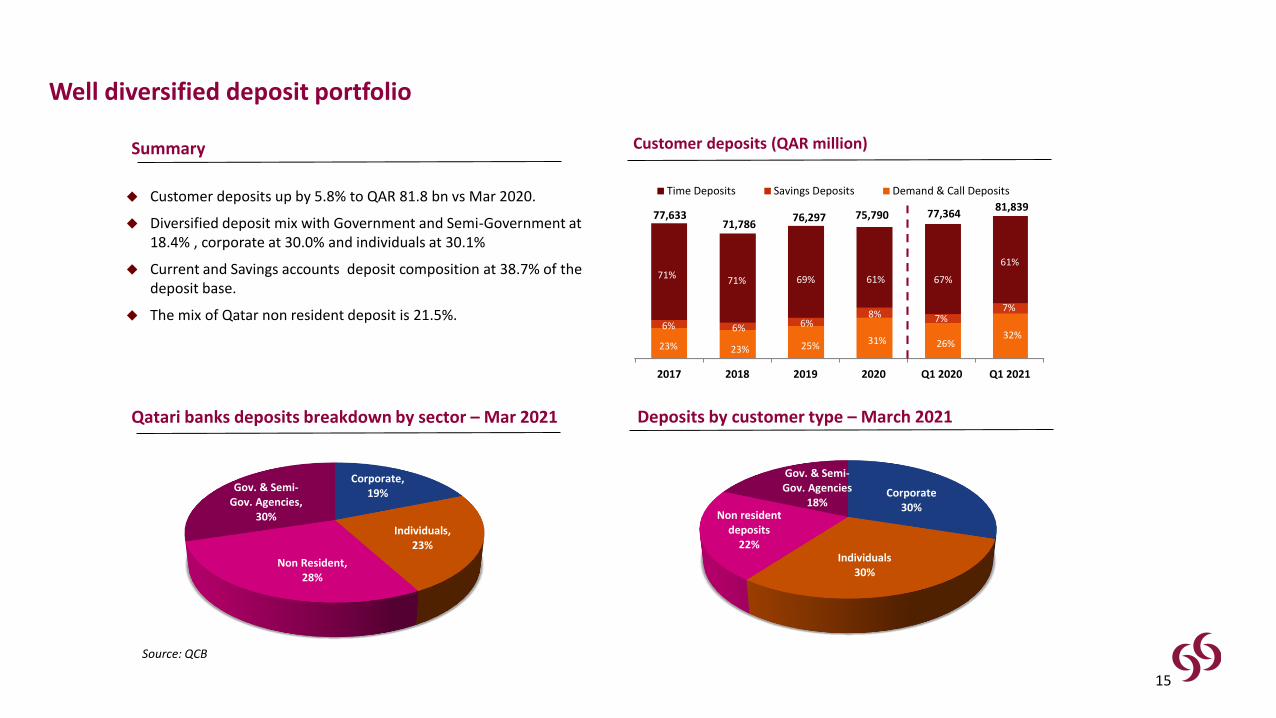
Summary Customer deposits (QAR million)
Qatari banks deposits breakdown by sector – Mar 2021 Deposits by customer type – March 2021
Customer deposits up by 5.8% to QAR 81.8 bn vs Mar 2020.
Diversified deposit mix with Government and Semi-Government at18.4% , corporate at 30.0% and individuals at 30.1%
Current and Savings accounts deposit composition at 38.7% of the deposit base.
The mix of Qatar non resident deposit is 21.5%.
Source: QCB
Well diversified deposit portfolio
77,63371,786
76,297
Corporate30%
Individuals30%
Non resident deposits
22%
Gov. & Semi-Gov. Agencies
18%
75,790
15
71%71% 69% 61%
6% 6% 6%8%
23% 23% 25% 31%
77,364
67%
7%
26%
81,839
61%
7%
32%
Equities1.5%
Government Bonds84.3%
Investment Funds0.1%
Other debt sec14.1%
15,37719,629
22,206 26,844 25,778 26,204 25,242
12%14%
16%18%
17%18%
16%
2016 2017 2018 2019 2020 Q1 2020 Q1 2021
Investment securities % of Total Assets
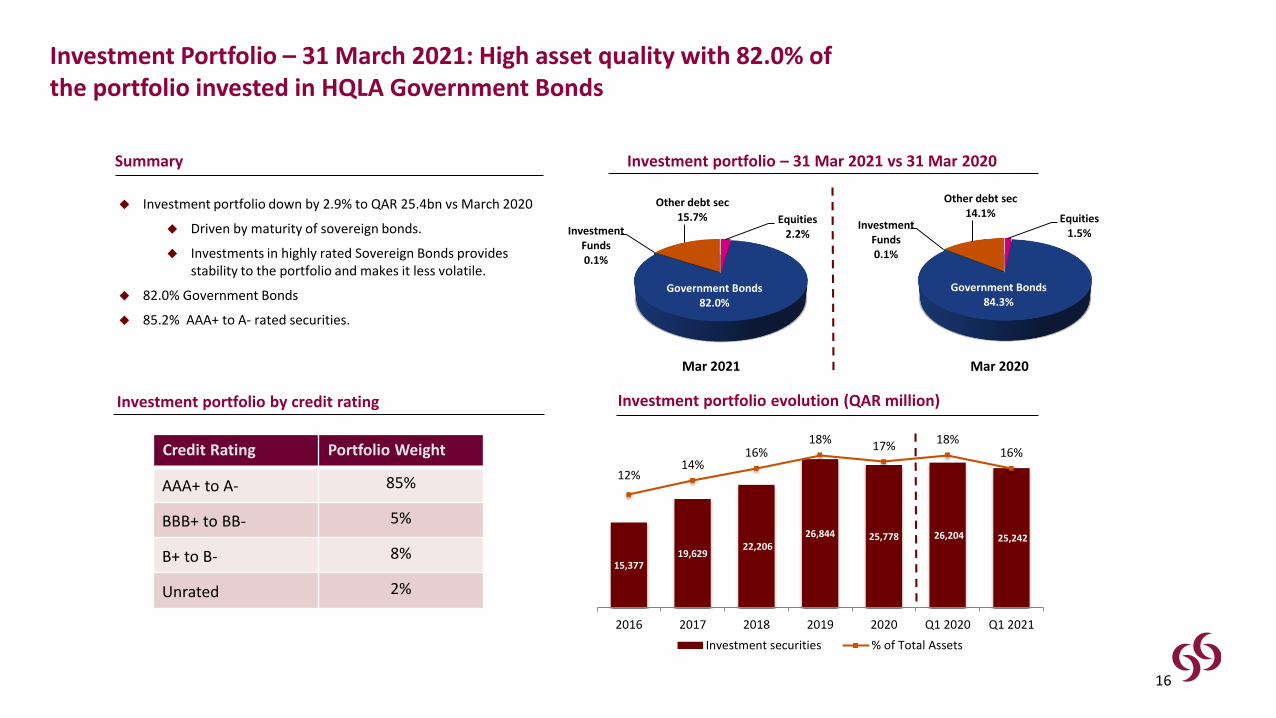
Summary Investment portfolio – 31 Mar 2021 vs 31 Mar 2020
Investment portfolio evolution (QAR million)
Investment portfolio down by 2.9% to QAR 25.4bn vs March 2020
Driven by maturity of sovereign bonds.
Investments in highly rated Sovereign Bonds provides stability to the portfolio and makes it less volatile.
82.0% Government Bonds
85.2% AAA+ to A- rated securities.
Investment Portfolio – 31 March 2021: High asset quality with 82.0% of the portfolio invested in HQLA Government Bonds
Investment portfolio by credit rating
Credit Rating Portfolio Weight
AAA+ to A- 85%
BBB+ to BB- 5%
B+ to B- 8%
Unrated 2%
Mar 2021 Mar 2020
16
Equities2.2%
Government Bonds82.0%
Investment Funds0.1%
Other debt sec15.7%

0.10.15
0.2
0.10.05
2016 2017 2018 2019 2020
Cash dividend Bonus shares
Summary Total equity (QAR million)
Dividend distribution per share (QAR) Capital Adequacy Ratio (Basel III)
Capitalization Levels – 31 March 2021
11
.2%
10
.5%
11
.1%
12
.2%
11
.1%
12
.0%
14
.5%
14
.0%
14
.4%
15
.7%
14
.6%
16
.3%
16
.1%
15
.5%
16
.4%
17
.8%
16
.6%
18
.3%
2017 2018 2019 2020 Q1 2020 Q1 2021
CET1 Tier1 Total Capital ratioMin ratios 2019: CET1 9%Tier1 11%, Total Capital ratio 14%
Total equity at QAR 23.4bn up by QAR 1.2bn from Dec 2020, due to:
Increase in AT1 capital by QAR 1.8bn following the successful issuance of our first international AT1 of USD 500 million in March 2021.
Increase in retained earnings by QAR 0.1bn on account of profits in Q1 2021 adjusted by the dividends payment of 2020 and transferred to risk reserve QAR 0.1bn.
Decrease in fair value reserve by QAR 0.6bn
Decrease in foreign currency translation by QAR 0.2bn.
Capital Adequacy Ratio at 18.3% (Basel III)2017 2018 2019 2020 Q1 2020 Q1 2021
Reserves AT1 Equity
21,021 19,85621,756 22,170
17
63%60% 63% 64%
19% 20% 18% 18%
18% 18%20% 19%
61%
19%
20%
20,624
66%
17%
17%
23,415

Profitability Balance Sheet
Performance Ratios Capital
Commercial Bank Financial Performance – Quarter ended 31 March 2021(CB Domestic)
QAR Million Q1 2021 Q1 2020 %
Net interest income 797 716 11.3%
Non-interest income 302 58 418.1%
Total costs (302) (108) 180.4%
Net provisions (189) (143) 31.8%
Net profit 608 523 16.2%
QAR Million 31.03.21 31.03.20 %
Total assets 147,615 130,666 13.0%
Loans & advances 89,298 77,557 15.1%
Investment Securities 23,839 24,870 -4.1%
Customer Deposits 73,648 68,479 7.5%
Total equity 23,104 20,429 13.1%
31.03.21 31.03.20
ROAA 1.7% 1.7%
NIM 2.7% 2.5%
Cost income ratio 27.5% 13.9%
31.03.21 31.03.20
RWA (QAR million) 99,768 97,332
Tier 1 ratio 17.0% 14.9%
Total Capital ratio 18.1% 15.8%
18

132 129 128117
31 3144 51 51
18 11 7
2017 2018 2019 2020 Q1 2020 Q1 2021
Operating Income Profit
National Bank of Oman (NBO) NBO Performance (OMR million)
Net profit after tax at OMR 6.9m, down by 36.2% as compared to Q1 2020.
Net operating income at OMR 31.1m, up by 1.3% from Q1 2020.
Net interest income decreased by 1.1% to OMR 22.1m.
Non-interest income up by 7.5% to OMR 9.0m.
Net provisions increased to OMR 6.9m from OMR 2.4m in Q1 2020.
Loan portfolio at OMR 2.9bn, up by 1.5% as compared to Mar 2020.
Customer’s deposits at OMR 2.6bn, down by 3.5% as compared to Mar 2020.
Associates’ Performance - 31 March 2021
United Arab Bank (UAB) UAB Performance (AED million)
Net profit of AED 10.2m in Q1 2021, as compared to net loss of AED 70.4 m in Q1 2020.
Net operating income up by 5.3% to AED 132.3m v AED125.6m in Q1 2020.
Net interest income down by 26.8% to AED 64.1m.
Non-interest income up by 79.6% to AED 68.2m.
Provisions decreased to AED 62.5m vs AED 132.4m in Q1 2020.
Loan book down by 24.8%, to AED 8.5bn v Mar 2020.
Customer’s deposits decreased by 3.2% to AED 10.8bn v Mar 2020.
677 647545
403
126 13217 77
-471
-667
-70
10
2017 2018 2019 2020 Q1 2020 Q1 2021
Operating Income Profit (Loss)
19
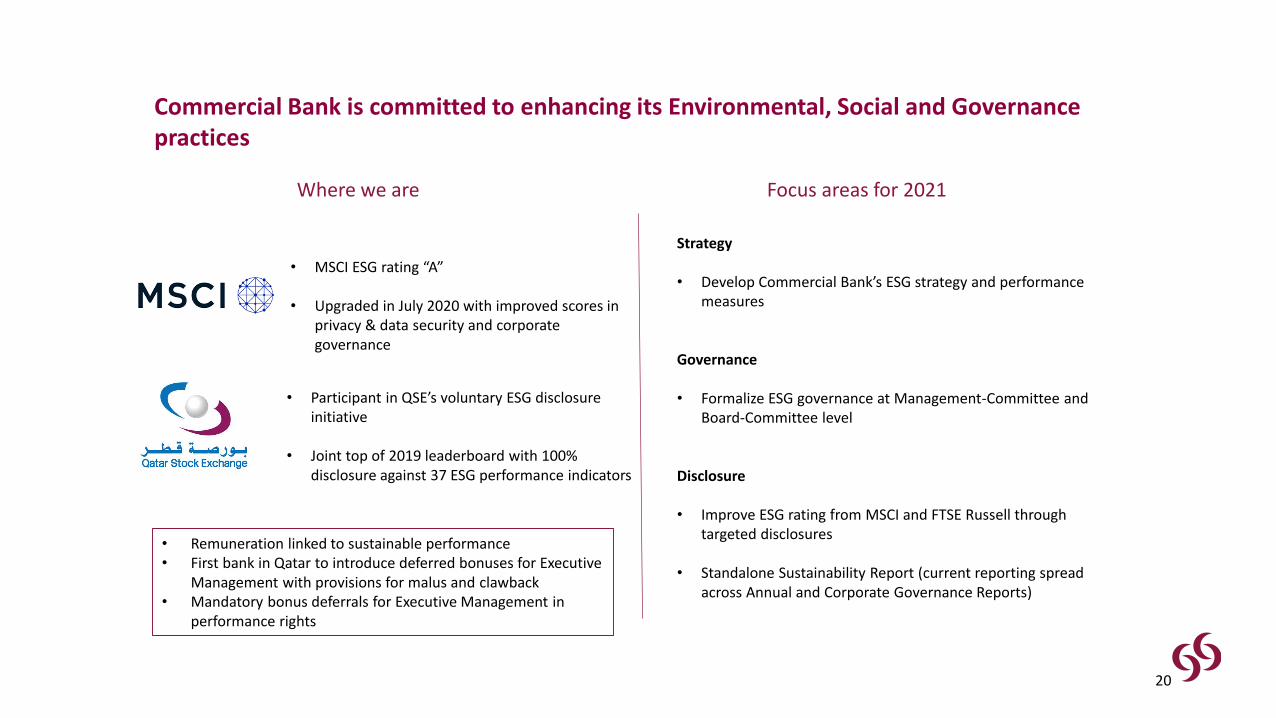
Commercial Bank is committed to enhancing its Environmental, Social and Governance practices
• MSCI ESG rating “A”
• Upgraded in July 2020 with improved scores in privacy & data security and corporate governance
• Participant in QSE’s voluntary ESG disclosure initiative
• Joint top of 2019 leaderboard with 100% disclosure against 37 ESG performance indicators
Where we are Focus areas for 2021
Strategy
• Develop Commercial Bank’s ESG strategy and performance measures
Governance
• Formalize ESG governance at Management-Committee and Board-Committee level
Disclosure
• Improve ESG rating from MSCI and FTSE Russell through targeted disclosures
• Standalone Sustainability Report (current reporting spread across Annual and Corporate Governance Reports)
• Remuneration linked to sustainable performance • First bank in Qatar to introduce deferred bonuses for Executive
Management with provisions for malus and clawback• Mandatory bonus deferrals for Executive Management in
performance rights
20
STRATEGIC INTENT
CONSOLIDATED HIGHLIGHTS AND PERFORMANCE
ALTERNATIF BANK PERFORMANCE
21

Turkey Macroeconomics
22
102.07
97.92
95.1895.60
50
60
70
80
90
100
110
120
De
c-1
9
Jan
-20
Feb
-20
Mar
-20
Ap
r-2
0
May
-20
Jun
-20
Jul-
20
Au
g-2
0
Sep
-20
Oct
-20
No
v-2
0
De
c-2
0
Jan
-21
Feb
-21
Mar
-21
Real Sector ConfidenceTR PMICap. Util.Consumer Confidence
-59.0
-28.3
2.0
-36.8 -37.8
-24.3-9.1
19.0
50.9
8.4
5.0
-60
-40
-20
0
20
40
60
De
c-1
7
Ap
r-1
8
Au
g-1
8
De
c-1
8
Ap
r-1
9
Au
g-1
9
De
c-1
9
Ap
r-2
0
Au
g-2
0
De
c-2
0
Ap
r-2
1
Au
g-2
1
De
c-2
1
CAD 12m cum.CAD-Excl.gold&energy
CAD (USD billion)
Leading Indicators
• Strong growth momentum in H2 2020 is maintained in Q1
with 6% growth, while continuing volatilities limit positivity.
• 2021 full year GDP growth expectation is 3.5-4.0%
• Replacement of CBRT Governor generated volatility in financial
markets, tight CBRT policy may contain further volatilities.
• CAD to GDP will decline to 3% in 2021 from 5.2% with tourism
income and lower gold imports mainly in H2 2020.
• CPI will rise to 17-17.5% in May, before starting to decline
mainly in Q4 2021 to 13.5% by y/e 2021.
• Demand should be contained to maintain both financial and
price stability.
Moderation in Economy / Credibility Required
Inflation
Exports: 17.6%Imports: 10.9%*Q1 2021 - yoy
16.20
13.52
31.20 16.88
0
10
20
30
40
50
De
c-1
6
Mar
-17
Jun
-17
Sep
-17
De
c-1
7
Mar
-18
Jun
-18
Sep
-18
De
c-1
8
Mar
-19
Jun
-19
Sep
-19
De
c-1
9
Mar
-20
Jun
-20
Sep
-20
De
c-2
0
Mar
-21
Jun
-21
Sep
-21
De
c-2
1
CPI PPI I%
Strong Leading Indicators6% Q1 yoy GDP Growth Trend
Upside RisksPPI / FX Pass through

Turkish Banking Sector
23
• Limited growth in loans through decreasing lending appetite
• Low demand for borrowing due to high interest rate environment and front loaded growth in 2021
• Improving asset quality thanks to limited new NPL inflow
• Pressure on NIM due to sharp increase in funding costs, 30% YoY decrease in NII in 2 months
• 6% decrease in net fee and commissions
• 46% decrease in net profit with ROAE standing at 8.4%
Q1 2021 Sector
Highlights
YTD Growth in Essential Products NPL Ratio & CoR
Source: BRSA Weekly Data (*) as of February 2021
Turkish Banking Sector Key Figures
4% 4%
-3%
4%5%
3%
0.3% 1%
16%
11% 10%
17%
Sector Private Banks AlternatifBank
Loan Deposit Demand Deposit Non-Cash Loan
5.2%
4.4%
Private Banks AlternatifBank
NPL
3.4%
1.1%
Private Banks AlternatifBank
CoR

Alternatif Bank – 1Q21 Financials
24
Profitability
Balance Sheet
• Moderate asset growth in real terms, 9% nominal growth
• Fully hedged balance sheet structure against depreciation of TRY
• Maintained loan book with selective lending approach
• Improved asset quality through decrease in NPL volume, 4.7% NPL ratio
• Increasing NPL coverage from 80% to 87%
• Several new funding sources established from international markets
• Solid capital through USD 25m capital injection and USD 200m AT-1
• NII down by 21% YoY due to sharp increase in TRY funding costs
• Decrease in net fee and commission with lower transaction volume
• Additional pressure on operating income following higher swap costs
• Increase in Opex is maintained below yearly inflation
• 42% decrease in provision expenses excluding free provisions
• 1.1% CoR well below sector average of 3.4%
• TRY 27m free provision against possible volatility in markets

Q&A
25