the competitive strength of the danish milk production from a global and eu perspective
TRANSCRIPT

EDF Congress 2006, Denmark
The competitive strength ofthe Danish milk production
from a Global and EU perspective
Preben MikkelsenDanish Cattle Federation

EDF Congress 2006, Denmark
1. Danish Cattle Federation2. The Global milk production structure3. The political framework in EU4. The future of milk quota in EU5. Future challenges and possibilities6. Competitive strength of Danish milk
production7. Concluding remarks
EDF Congress 2006, Denmark
1. Danish Cattle Federation

EDF Congress 2006, Denmark
The Danish Cattle Federation
The Danish Cattle Federation is a unifyingbody working to improve specific conditions ofcattle farming and being the spokesman ofcattle farmersand we work to
Ensure the best possible earnings for cattle farmers
Optimise the industry by a plough to plate approach and viewing the industry as a whole
Organise service, advising and control assignments
EDF Congress 2006, Denmark
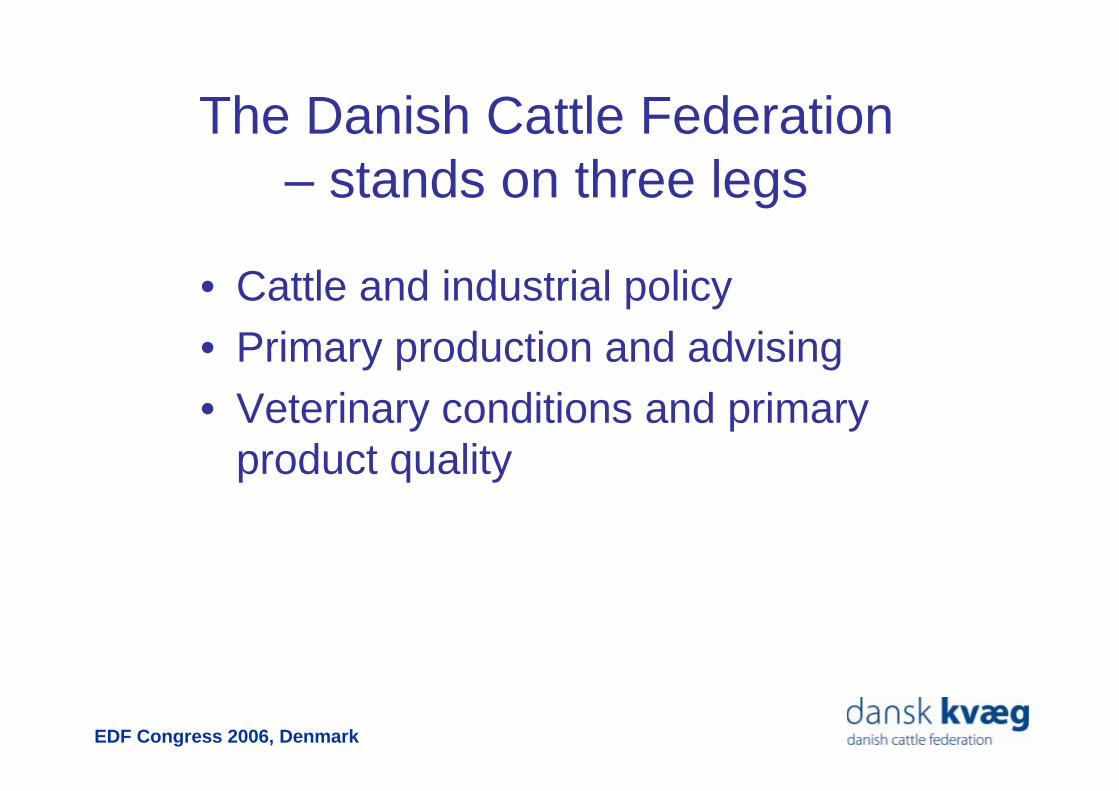
The Danish Cattle Federation – stands on three legs
• Cattle and industrial policy• Primary production and advising• Veterinary conditions and primary
product quality
EDF Congress 2006, Denmark
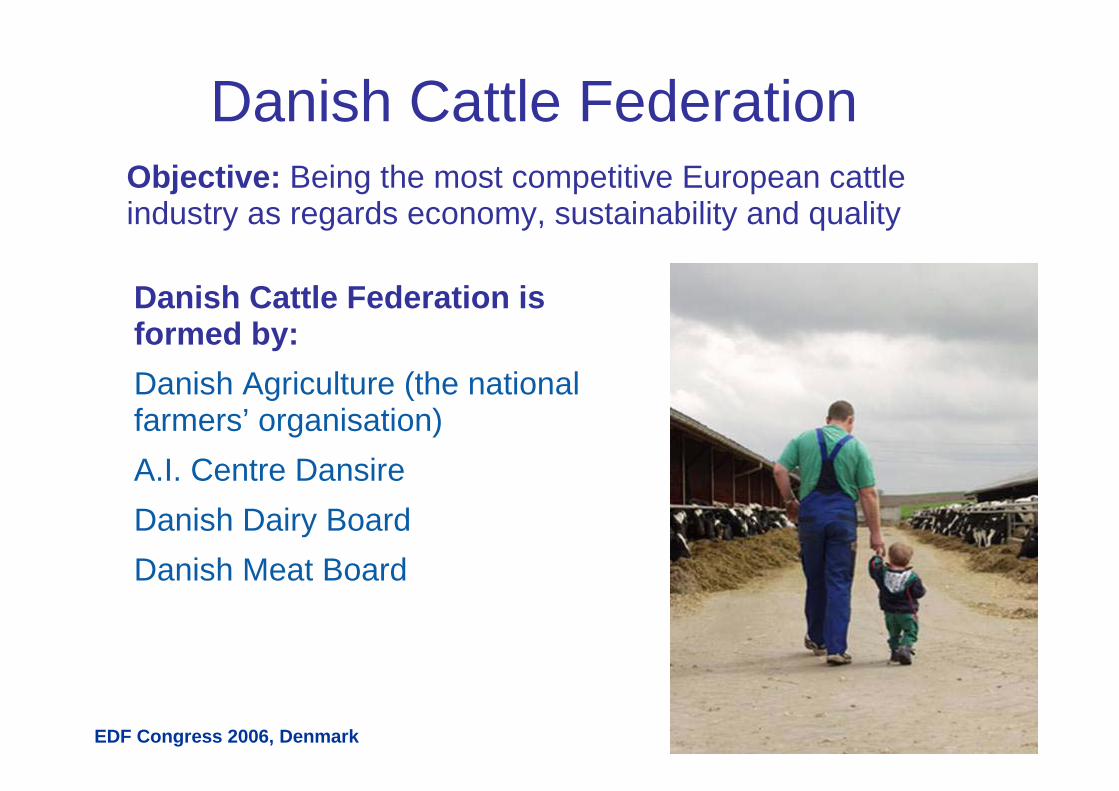
Danish Cattle Federation
Danish Cattle Federation is formed by:
Danish Agriculture (the national farmers’ organisation)
A.I. Centre Dansire
Danish Dairy Board
Danish Meat Board
Objective: Being the most competitive European cattleindustry as regards economy, sustainability and quality

EDF Congress 2006, Denmark
2. The Global milk productionstructure
EDF Congress 2006, Denmark
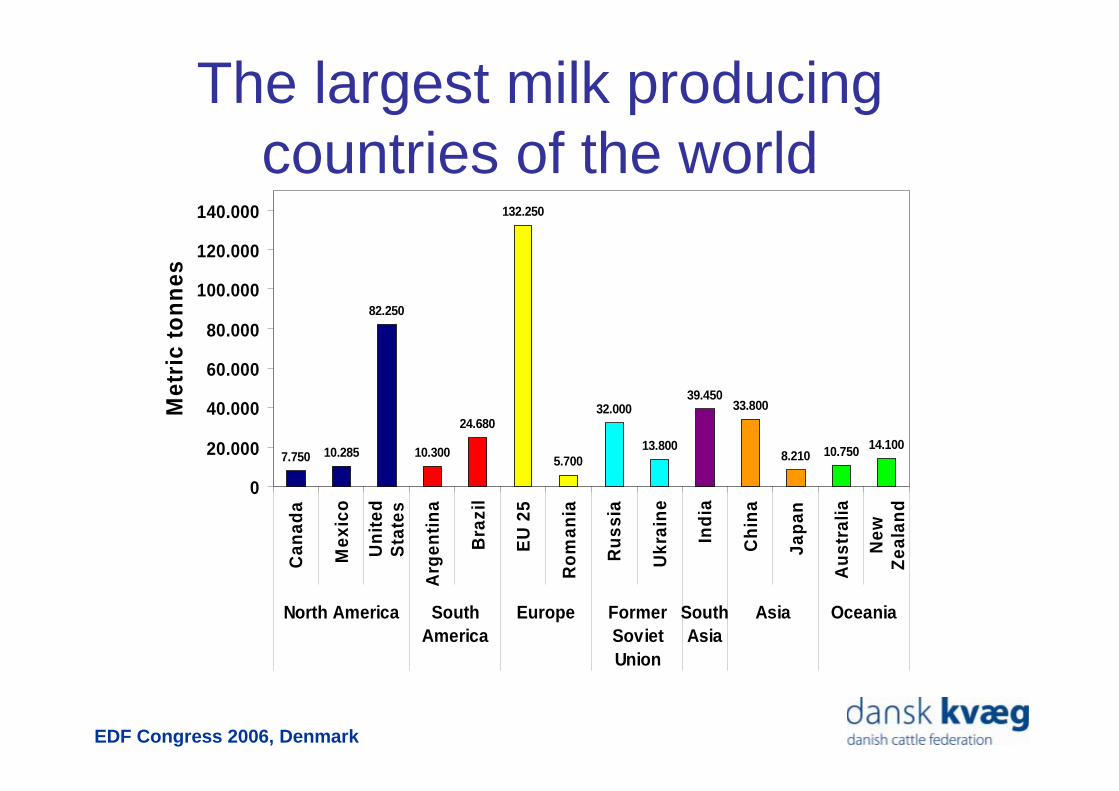
The largest milk producing countries of the world
7.750 10.285
82.250
10.300
24.680
132.250
5.700
32.000
13.800
39.45033.800
8.210 10.750 14.100
0
20.000
40.000
60.000
80.000
100.000
120.000
140.000
Can
ada
Mex
ico
Un
ited
Sta
tes
Arg
enti
na
Bra
zil
EU
25
Ro
man
ia
Ru
ssia
Ukr
ain
e
Ind
ia
Ch
ina
Jap
an
Au
stra
lia
New
Zea
lan
d
North America SouthAmerica
Europe FormerSovietUnion
SouthAsia
Asia Oceania
Met
ric
ton
nes

EDF Congress 2006, Denmark
The biggest players on the world market
EU is loosing market shares to Oceania!
Others17%
Australia10%
New Zealand
33%
Argentina3%
EU35%
USA2%
Australia7%
New Zealand
23%
Others24%
EU40%
USA6%
1990 2004
EDF Congress 2006, Denmark
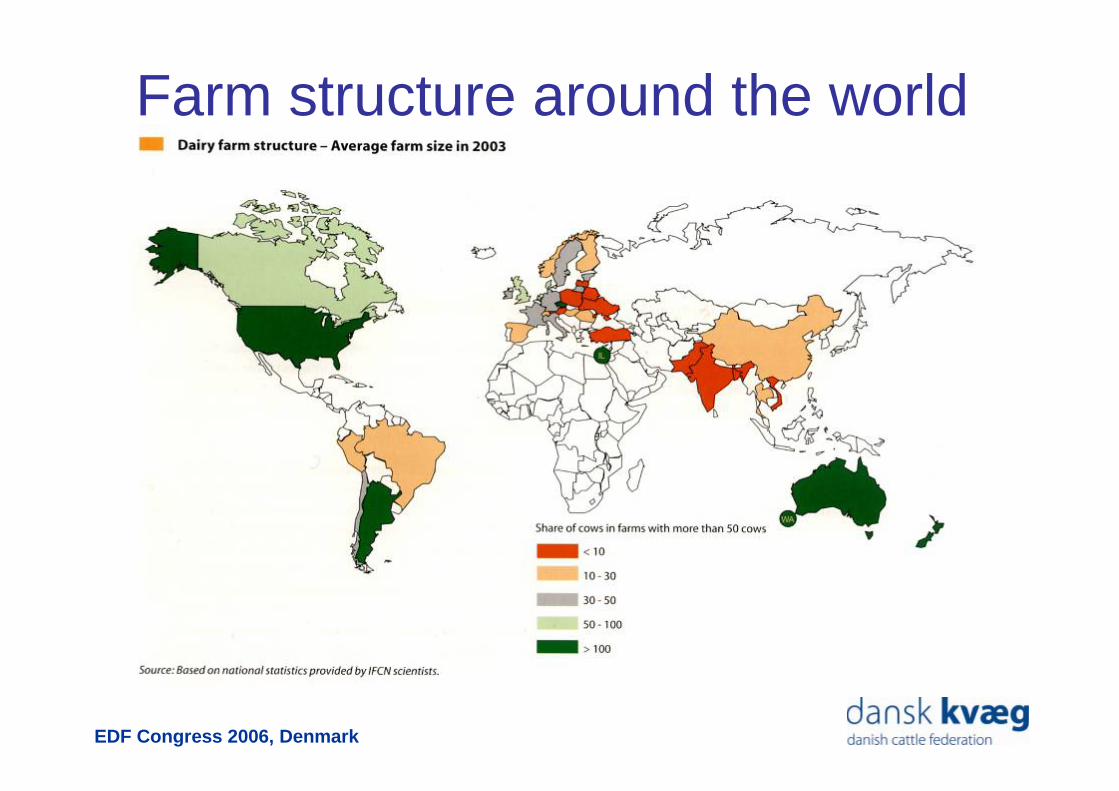
Farm structure around the world

EDF Congress 2006, Denmark
Milk price around the world (2004)
Source: IFCN Dairy Report 2005, national statistics, estimations
30-40> 40
20-25< 20
Milk price in US-$ / 100 kg milk
25-30
32
22
EDF Congress 2006, Denmark
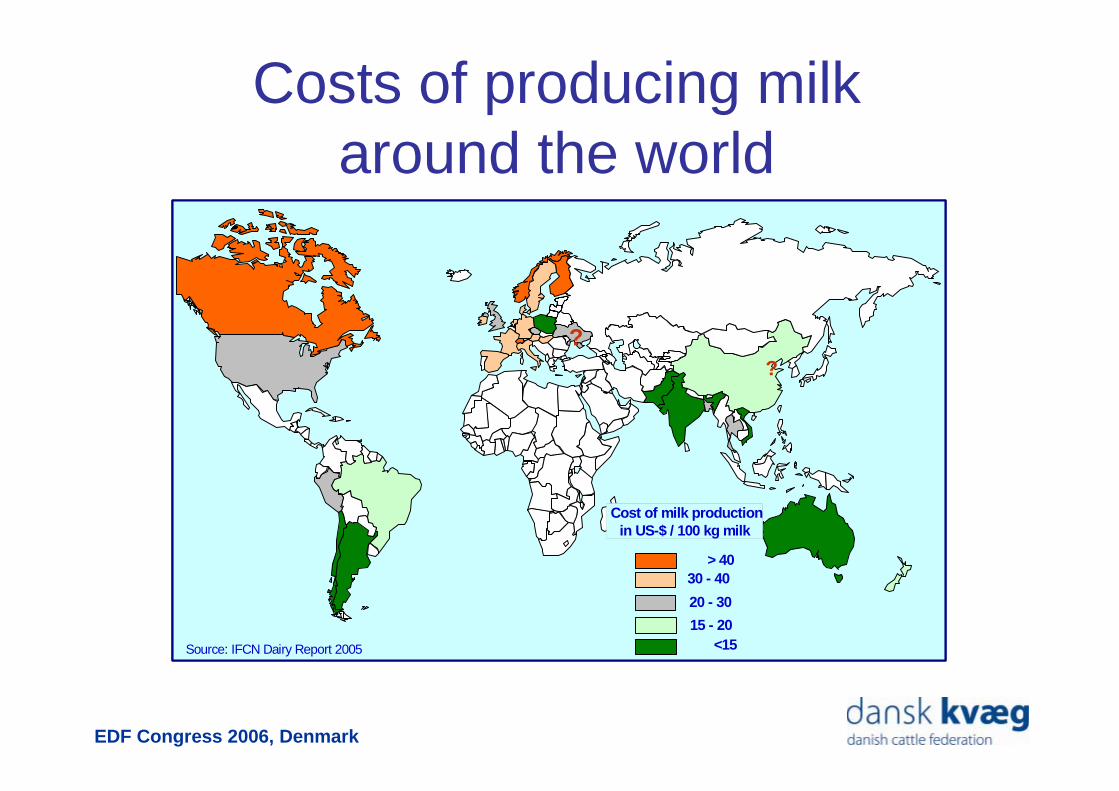
Costs of producing milk around the world
30 - 40> 40
15 - 20<15
20 - 30
Cost of milk productionin US-$ / 100 kg milk
Source: IFCN Dairy Report 2005
??
30 - 40> 40
15 - 20<15
20 - 30
Cost of milk productionin US-$ / 100 kg milk
Source: IFCN Dairy Report 2005
??

EDF Congress 2006, Denmark
Reasons for differences in costs of production
New Zealand
DenmarkBrazil
19,0002,9751,6302,70010,963Land price per ha, $
2010-121,52-310Labor costs per hour, $
5,0004,500*700-800500-6002,800Capital input per cow, $
8,8009,1001,2004,1003,700Milk yield per cow, kg
10010514139291Average herd size, number of cows
DenmarkUSABrazilArgentinaNZ
Argentina USA
* 145 cow farm in Wisconsin. Large farm i.e. >700 cows: 2,500$
Source: IFCN Dairy report 2005

EDF Congress 2006, Denmark
3. The political framework in EU

EDF Congress 2006, Denmark
Reform of the milk policy
Quotas: Extension of the quota system until 2014/153 x 0.5% quota increase in Denmark from 2006/07-2008/09
Prices:Reduction of the intervention price
– butter: 3x7% in 2004, ’05 and ’06 + 4% in 2007– SMP: 3x5% in 2004-2006
Intervention ceiling of 70,000 t for butter in 2004/05 dropping to 30,000 t in 2008/09
Compensation:Partial compensation for the reduction of intervention pricesDecoupling in Denmark in 2005
05.08.2003
EDF Congress 2006, Denmark
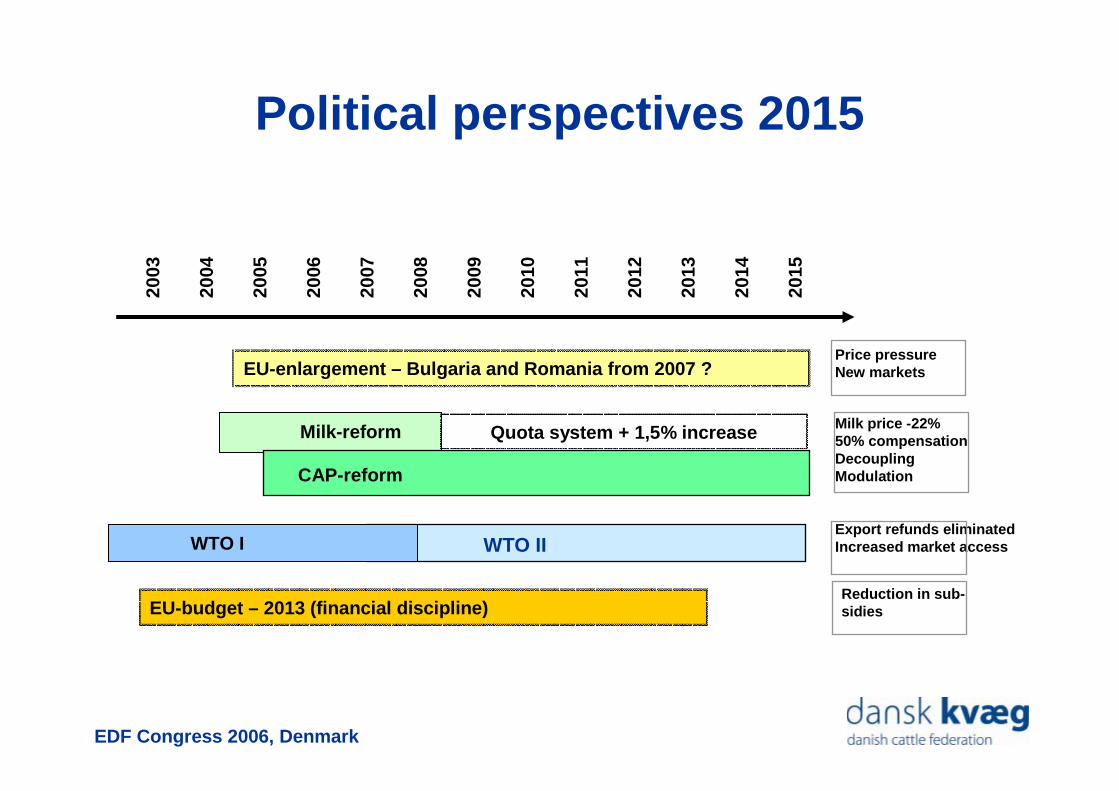
WTO II
Price pressureNew markets
Milk price -22%50% compensationDecouplingModulation
Export refunds eliminatedIncreased market access
2003
2004
2005
2006
2007
2008
2009
2010
2011
2012
2013
2014
2015
WTO I
Milk-reform
Political perspectives 2015
EU-enlargement – Bulgaria and Romania from 2007 ?
CAP-reform
EU-budget – 2013 (financial discipline)Reduction in sub-sidies
Quota system + 1,5% increase
EDF Congress 2006, Denmark
4. The future of milk quotas in EU

EDF Congress 2006, Denmark
Market balance in EU28To ensure the good balance
60
70
80
90
100
110
120
130
140
150
160
1998
2000
2002
2004
2006
2008
2010
2012
2014
Mio
. to
ns
60
70
80
90
100
110
120
130
140
150
160
Mio
. to
ns
Exports
Sales EU
Milk deliveries + imports
Milk deliveries
Prognosis 2006-2015:
- Consumption in EU: +1% p.a.
- Quota: +0,5% p.a.*
- Imports: 2.5% of comsumption p.a. in 2006/07 rising to 5% p.a. in 2012-2015
- Exports: 13.5 mio. tons p.a. falling to 10 mio. tons in 2013-2015
* Quota increase not included for B, F, GR, LUX, AUST, FIN, SW and U.K.

EDF Congress 2006, Denmark
The market and the quota
The expected market development leaves room for a gradual, annualquotaenlargement of 0.5-1% with a continued market balance – should beevaluated on an annual basis dependent on the development.
Impact:• Preparation for termination of the quota system• Gives certain possibilities for competitive countries• It is expected that Denmark will utilize the quota increase –an increase will have a minor, calming impact on the quota
price• Countries not utilizing the quota, will have no negative impact

EDF Congress 2006, Denmark
Future of the quota system
Several countries discuss termination of the quota system
It ”simply” calls for a blocking minority (90 seats) to terminate
quotas (Sweden, Denmark, U.K., Italy and Poland)
Requirements up to 2015:
• flexibility
• gradual phasing out / gradual increase of quota
• clear signal in due time
EDF Congress 2006, Denmark
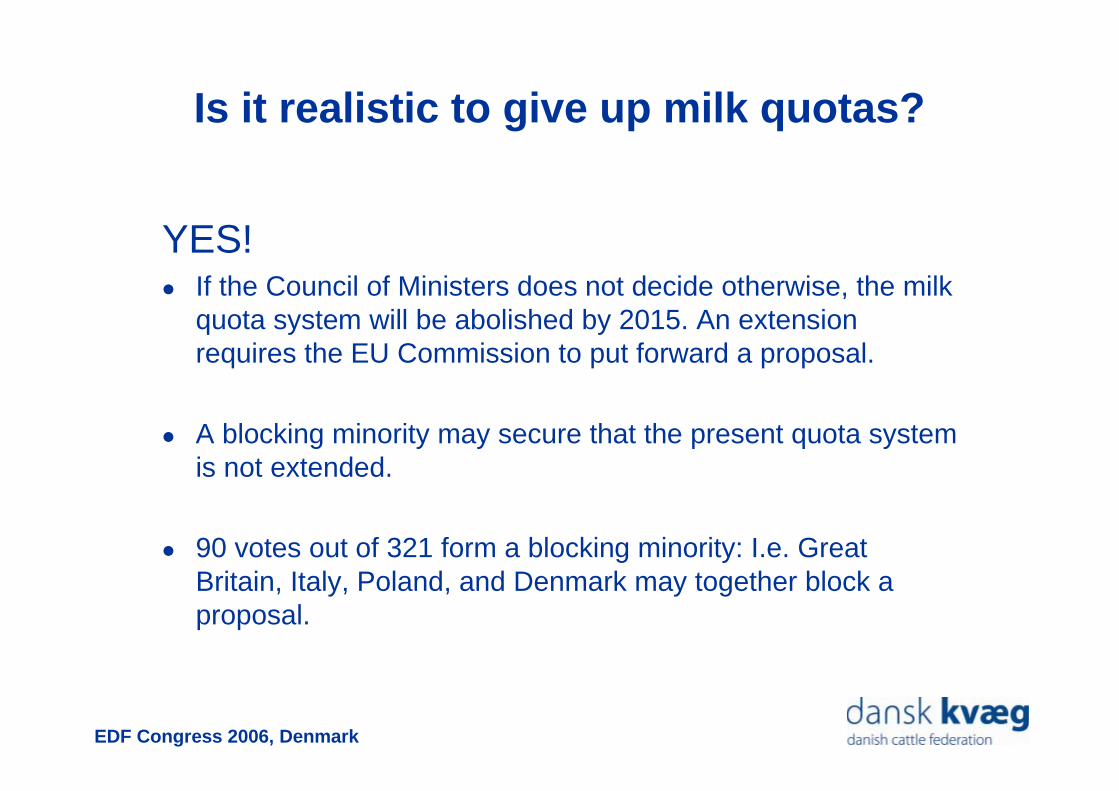
Is it realistic to give up milk quotas?
YES! If the Council of Ministers does not decide otherwise, the milk quota system will be abolished by 2015. An extension requires the EU Commission to put forward a proposal.
A blocking minority may secure that the present quota system is not extended.
90 votes out of 321 form a blocking minority: I.e. Great Britain, Italy, Poland, and Denmark may together block a proposal.
EDF Congress 2006, Denmark
5. Future challenges and possibilities

EDF Congress 2006, Denmark
Challenges and countermovesThe challenges
– Lower milk price– Less economic support– Stricter environmental
regulations– More focus on animal welfare
The countermove of the dairy farmer– Cost minimization– Increase in farm size– Exploitation of new
technological advances and new knowledge
– Focus on strategy, leadership and management

EDF Congress 2006, Denmark
New knowledge and new technologyBetter machinery
Better milking systems
Better housing facilities
Better feeding equipment
EDF Congress 2006, Denmark
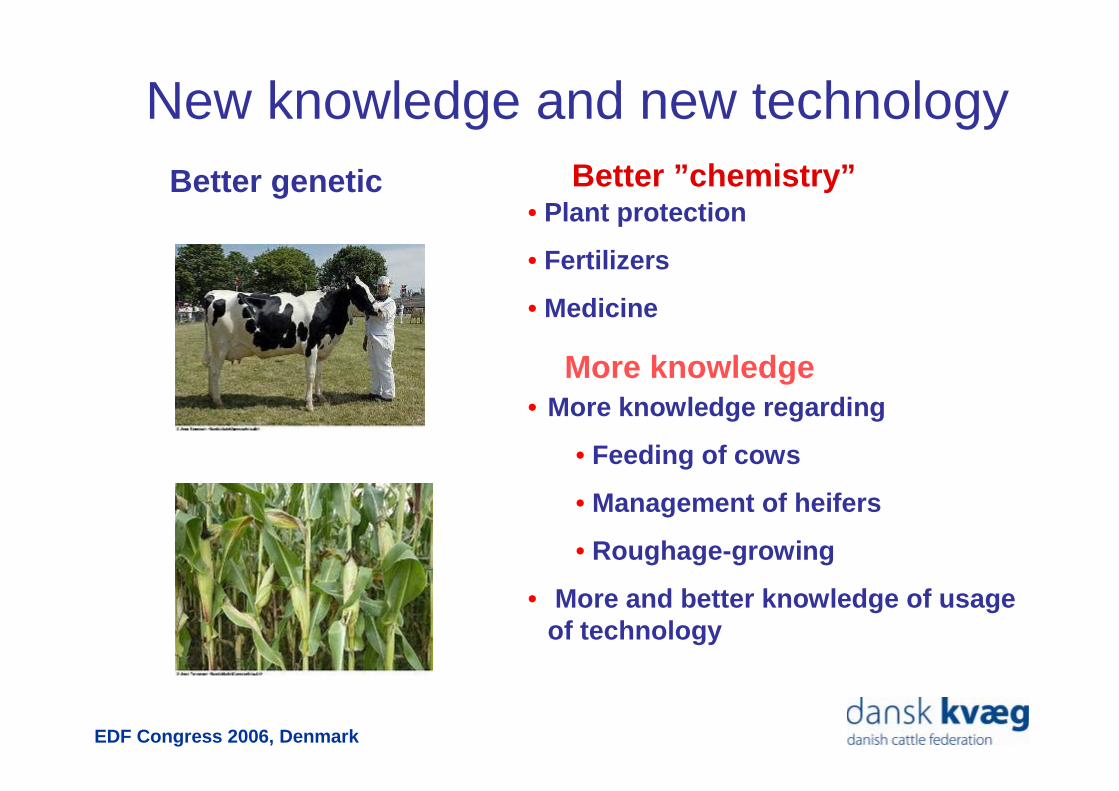
New knowledge and new technologyBetter genetic
• Plant protection
• Fertilizers
• Medicine
Better ”chemistry”
• More knowledge regarding
• Feeding of cows
• Management of heifers
• Roughage-growing
• More and better knowledge of usage of technology
More knowledge

EDF Congress 2006, Denmark
Technology will monitor the herdHealth and reproduction Feed uptake
Health and reproduction
The registrations are converted into useful information

EDF Congress 2006, Denmark
The role of the farmer is changing
From • Doing all the farm work
– Milking– Feeding– Field work– Monitoring the herd
To• Strategy formulation• Management of
production and economy• Management of labor• “Management” of
consultants• Monitoring the herd by use
of technology
Manager and leaderTo
Skilled craftsman
From

EDF Congress 2006, Denmark
Trends for the coming yearsregarding ownership
The family farm
From To
The family farm
The limited company
Thenetwork
Cr.
S
C
EDF Congress 2006, Denmark
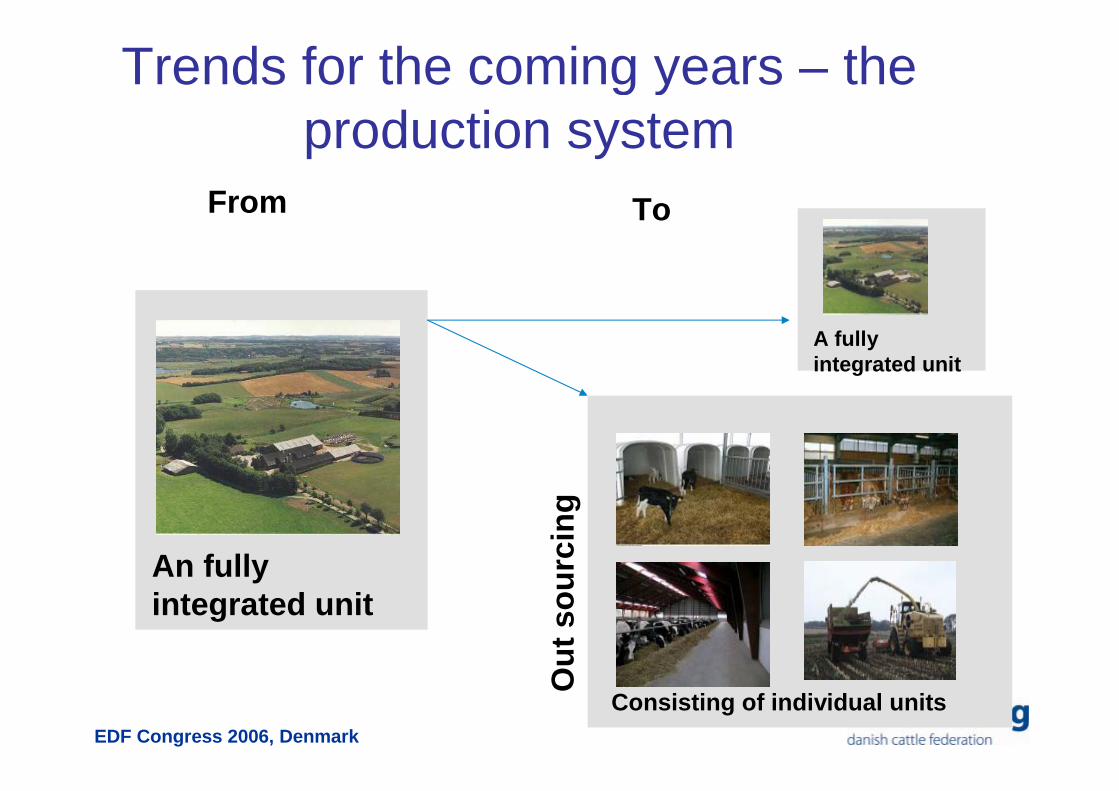
Trends for the coming years – the production system
From
An fully integrated unit
To
A fully integrated unit
Consisting of individual units
Ou
t so
urc
ing

EDF Congress 2006, Denmark
The role of the advisor is changing
The traditional role• Specialist on specific subjects
such as: Feeding, animal health, economy etc.
• Treatment of sick animals• The recipient of the advice is the
dairy farmer• Little communication between
the different advisors• Little focus on the farm as a
whole• Knowledge and advisory tools
are very
The new role• Technology takes over much of the
registration on the farm• Due to technology diseases can be
identified at an earlier stage• Prevention of diseases• Specialist and discussion partner • The recipient of the advice could
be several people on the farm• More focus on the farm as a whole• The advisor acts in a team of
advisors• Knowledge and advisory tools are
important but so are collaboration and communication skills
• Sharing knowledge
EDF Congress 2006, Denmark
6. Competitive strength of theDanish milk production

EDF Congress 2006, Denmark
Net capital and liabilities
0% 10% 20% 30% 40% 50% 60% 70% 80% 90% 100%
Denmark
Sweden
Norway
Finland
Netherlands
Germany
France
Spain
U.K.
Ireland
Poland
Hungary
USA
Brasil
Kina
Australia
New Zealand
Net capital Liabilities
EDF Congress 2006, Denmark
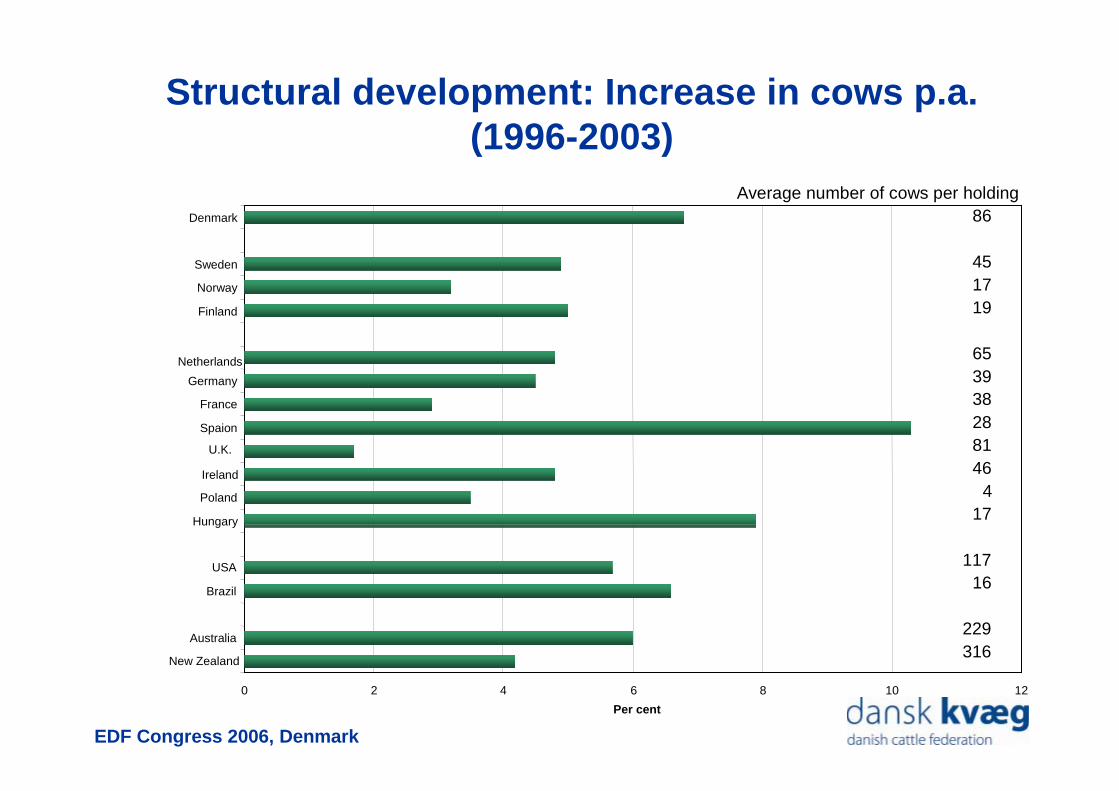
Structural development: Increase in cows p.a. (1996-2003)
0 2 4 6 8 10 12
Denmark
Sweden
Norway
Finland
Netherlands
Germany
France
Spaion
U.K.
Ireland
Poland
Hungary
USA
Brazil
Australia
New Zealand
Per cent
Average number of cows per holding86
451719
653938288146
417
11716
229316
EDF Congress 2006, Denmark
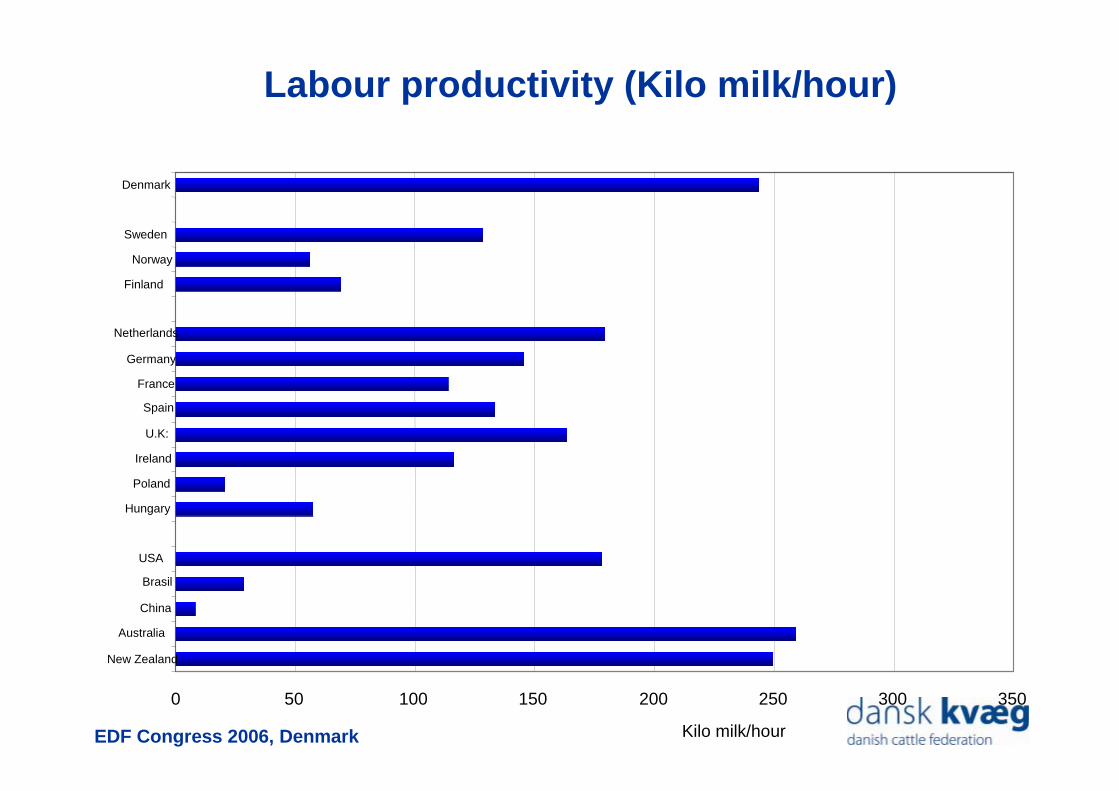
Labour productivity (Kilo milk/hour)
0 50 100 150 200 250 300 350
Denmark
Sweden
Norway
Finland
Netherlands
Germany
France
Spain
U.K:
Ireland
Poland
Hungary
USA
Brasil
China
Australia
New Zealand
Kilo milk/hour

EDF Congress 2006, Denmark
Danish milk productionInternational competitiveness
Structure: 6.8% annual increase in farm sizes
Working productivity: Only exceeded by NZ and Australia. High wages, but well-educated, efficient and ready for readjustments
Debt ratio: 75% = top achievement, but resultis a high investment level = geared for international competition

EDF Congress 2006, Denmark
Investments on dairy farms
0
1000
2000
3000
4000
5000
6000
7000
1992
1993
1994
1995
1996
1997
1998
1999
2000
2001
2002
2003
2004
Inve
stm
ents
, DK
K p
er c
ow
Quota exchangeintroduced
EDF Congress 2006, Denmark
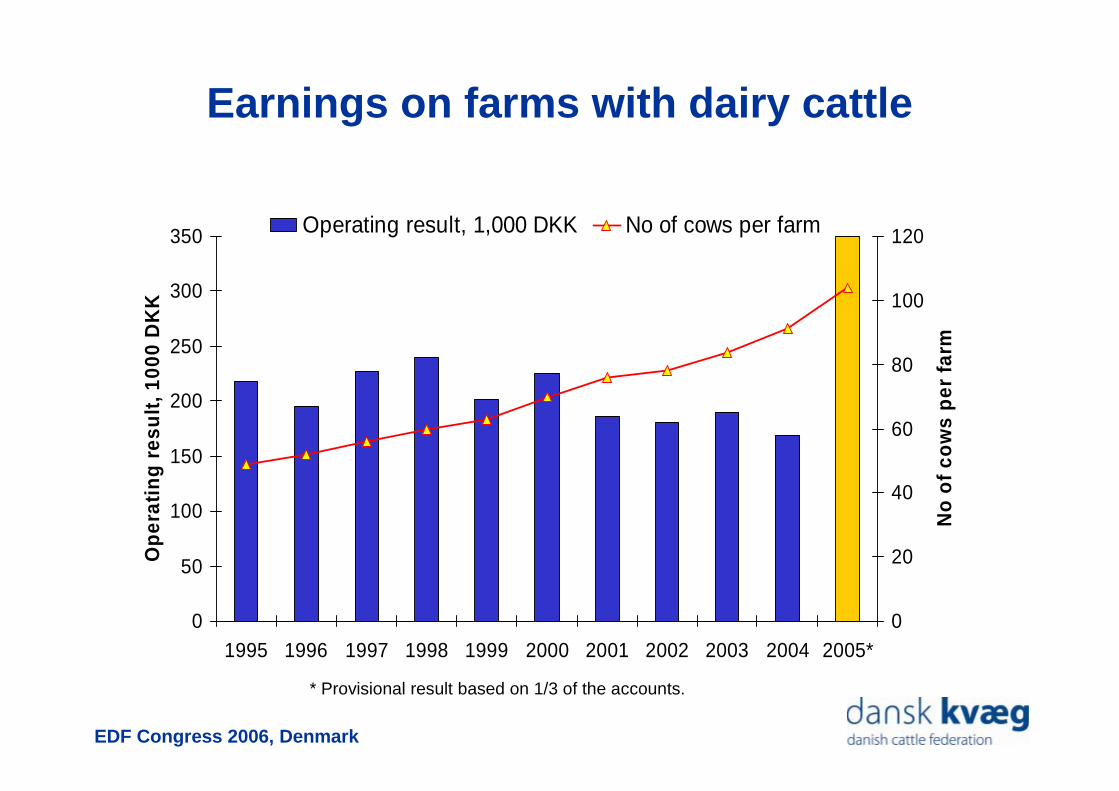
Earnings on farms with dairy cattle
0
50
100
150
200
250
300
350
1995 1996 1997 1998 1999 2000 2001 2002 2003 2004 2005*
Op
erat
ing
res
ult
, 100
0 D
KK
0
20
40
60
80
100
120
No
of
cow
s p
er f
arm
Operating result, 1,000 DKK No of cows per farm
* Provisional result based on 1/3 of the accounts.
EDF Congress 2006, Denmark
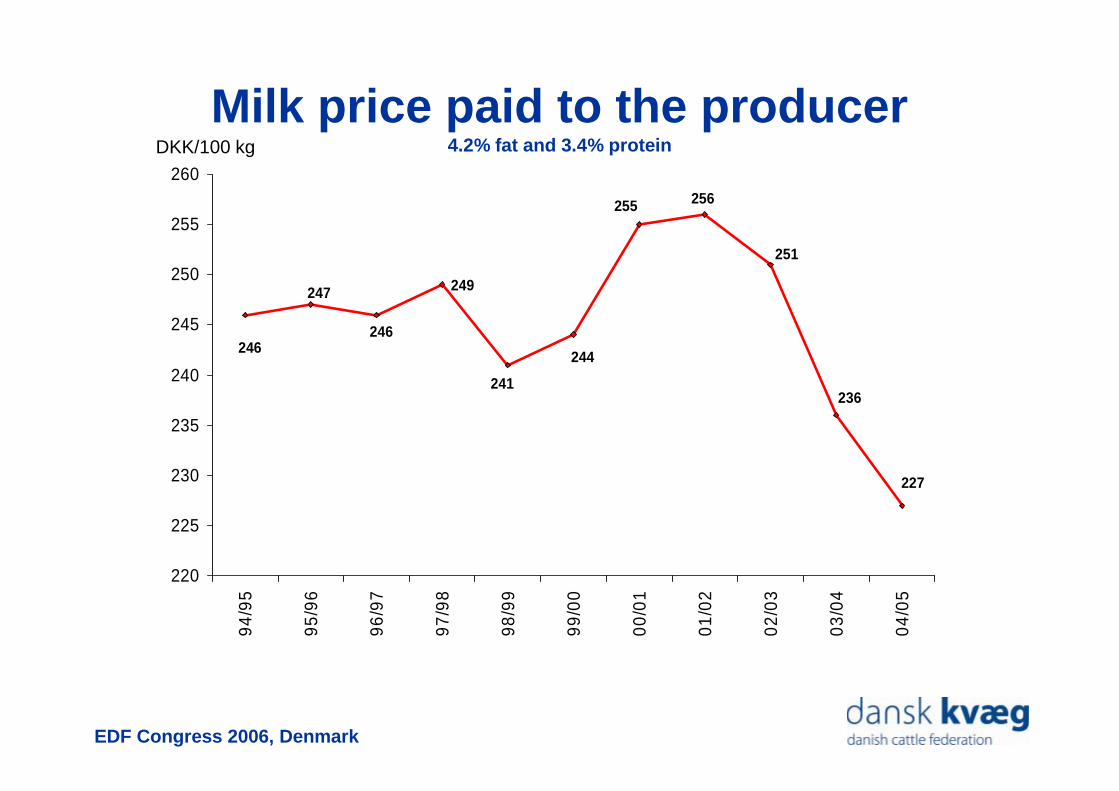
249
227
244
241
246
236
251
255 256
247
246
220
225
230
235
240
245
250
255
260
94/9
5
95/9
6
96/9
7
97/9
8
98/9
9
99/0
0
00/0
1
01/
02
02/
03
03/
04
04/
05
DKK/100 kg
Milk price paid to the producer4.2% fat and 3.4% protein

EDF Congress 2006, Denmark
Milk price paid to the producer in other countries DKK per 100 kg (4.2% fat and 3.4% protein)
1402901662562332552412632552001
1352251502182062242222602362004
133*2101782162042212162562272005
1161881302221982302302662512003
-1%-7%+18%-1%-1%-2%-3%-2%-4%in DKK
-5%-6%+5%-1%-1%-2%-3%-2%-4%in nat’lcurrency
1202181472332062412332662562002
Change in 2005 compared to 2004, percentage
NZUSPLDEUKNLFRFINDK1
Year
Note: 1) The Danish prices are October year prices* Estimated prices
EDF Congress 2006, Denmark
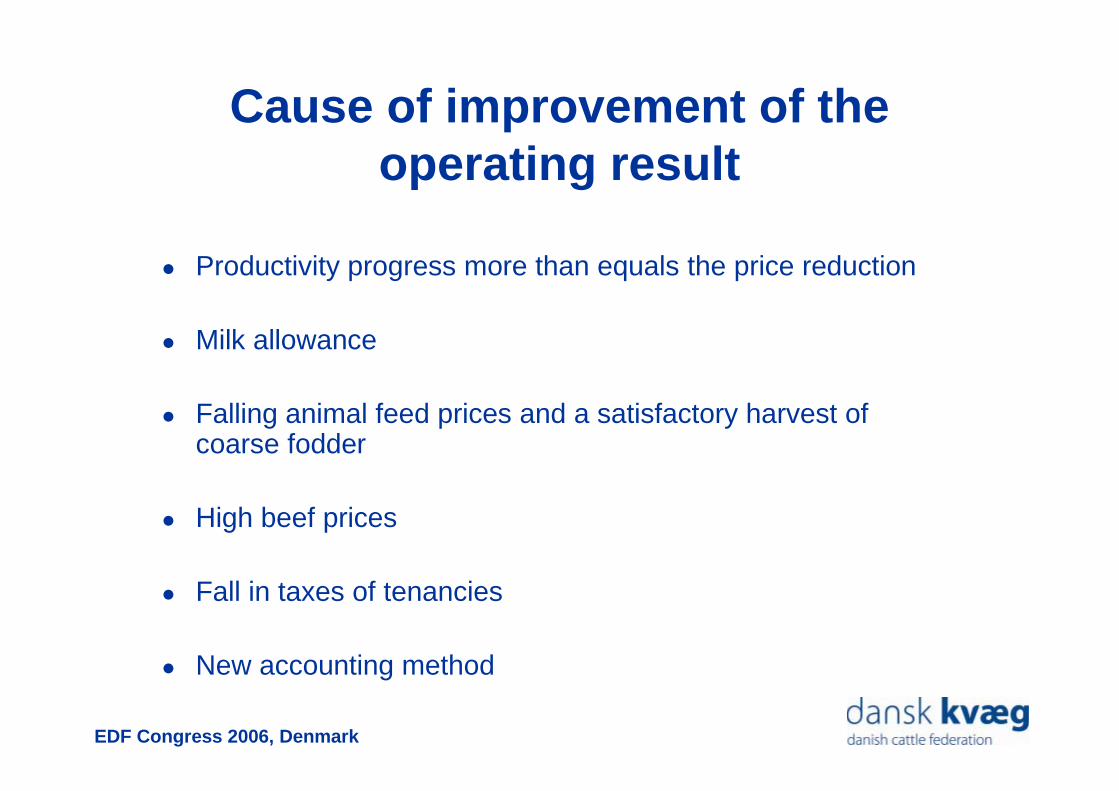
Cause of improvement of theoperating result
Productivity progress more than equals the price reduction
Milk allowance
Falling animal feed prices and a satisfactory harvest ofcoarse fodder
High beef prices
Fall in taxes of tenancies
New accounting method
EDF Congress 2006, Denmark
7. Concluding remarks

EDF Congress 2006, Denmark
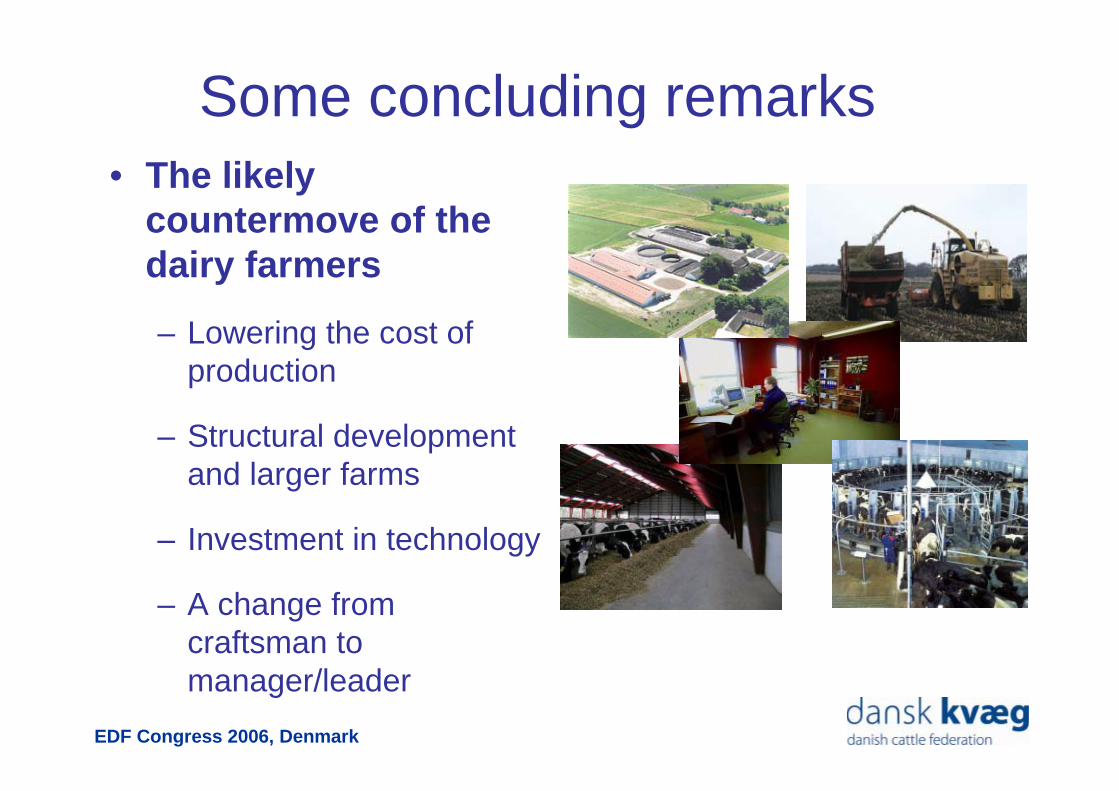
Some concluding remarks
• The surrounding environment of the dairy farms in the EU is changing
– Milk price is decreasing and the income of the farms is under pressure
– Economic support to farmers is likely to decrease
– Decoupling of support from production changes the competitiveness of the dairy farms
EDF Congress 2006, Denmark
Some concluding remarks• The likely
countermove of the dairy farmers
– Lowering the cost of production
– Structural development and larger farms
– Investment in technology
– A change from craftsman to manager/leader

EDF Congress 2006, Denmark
If you prepare and change focusfrom support to the market –
there will be a bright future for the European milk producer.