the competitiveness effects of european environmental fiscal reforms
TRANSCRIPT

European Review of Energy Markets- volume 3, issue 1, April 2009 The competitiveness effects of European environmental fiscal reforms
Terry Barker, Paul Ekins, Sudhir Junankar, Hector Pollitt & Philip Summerton
[2009] 7 EREM © European Energy Institute and contributors 1
The competitiveness effects of European environmental fiscal reforms
Terry Barker, Cambridge Econometrics, UK1 Paul Ekins, King’s College London, UK2
Sudhir Junankar, Cambridge Econometrics, UK3 Hector Pollitt, Cambridge Econometrics, UK4
Philip Summerton, Cambridge Econometrics, UK5
Key words: energy/carbon taxes; environmental fiscal reform;
competitiveness; macroeconomic modelling
1 Terry Barker is Director of the Cambridge Centre for Climate Change Mitigation Research (4CMR), Department of Land Economy, University of Cambridge, and Chairman of Cambridge Econometrics. He works on modelling the energy-environment-economy (E3) system at UK, EU and global levels. See: http://www.4CMR.org 2 Paul Ekins* has a PhD in economics from Birkbeck College, University of London, and is Professor of Energy and Environment Policy at King’s College London. His work focuses on energy policy, and the modelling of the energy system, on innovation, and on the role of economic instruments such as environmental taxes in the context of achieving an environmentally sustainable economy. *Corresponding author: Department of Geography, King’s College London, The Strand, London WC2R 2LS. 3 Sudhir Junankar is Manager of CE’s UK Energy-Environment Service, and leads the use of MDM, CE’s E3 model of the UK economy, to implement studies exploring scenario outcomes for energy demand, emissions and the UK economy. He also contributes his expertise to European projects based on the use of CE’s E3 model for Europe, E3ME. See:http://www.camecon.com/aboutce/cvs/sj.htm 4 Hector Pollitt leads on the operation and development of CE’s large-scale European econometric energy-environment-economy model, E3ME (see www.e3me.com). This includes the application of the model for research, forecasting and impact assessment, including analysis of energy policy and sustainable development strategies. 5 Philip Summerton is an economist whose specialisation is in the application of CE’s large-scale E3 models. His project experience includes: the lead modeller on a project for the Green Fiscal Commission; a study of the competitive effects of ETR in Europe (COMETR) for the EC and a study of resource productivity associated with ETR within Europe for the Anglo-German Foundation.

European Review of Energy Markets- volume 3, issue 1, April 2009 The competitiveness effects of European environmental fiscal reforms
Terry Barker, Paul Ekins, Sudhir Junankar, Hector Pollitt & Philip Summerton
2 [2009] 7 EREM © European Energy Institute and contributors
This paper derives from work carried out by Cambridge Econometrics (CE) as part of the Framework 6 project funded by DG Research of the European Commission, ‘The Competitiveness Effects of Environmental Tax Reforms’ (COMETR), financial support for which is gratefully acknowledged. Information about COMETR may be found at http://www2.dmu.dk/cometr/index.htm.
1. Introduction
The international competitiveness of economies and sectors is affected by mitigation actions (see surveys by Boltho (1996), Adams (1997) and Barker and Köhler (1998)). In the long run, exchange rates change to compensate for persistent loss of national competitiveness, but this is a general effect and particular sectors can lose or gain competitiveness. In the short run, higher costs of fossil fuels lead to a loss in sectoral price competitiveness especially in energy-intensive industries. The effects of domestic mitigation actions on a region’s international competitiveness are divided in the literature into the effects on price and non-price competitiveness. On the issue of re-location of industry, Sijm et al. (2004) conclude that ‘existing studies cannot provide a clear picture about the effect of environmental policy on the relocation of energy intensive industries; but they do indicate that - if a relation between environmental policy and relocation should exist - it is statistically weak.’ (p. 165). Zhang and Baranzini (2004) have reviewed empirical studies of the effects of Annex I action on international competitiveness. The study by Baron and ECON-Energy (1997) for the Annex I expert group on the UNFCCC is typical of the studies reviewed. They report a static analysis of the cost increases from a tax of $100/tC on four energy-intensive sectors in nine OECD economies (iron & steel, other metals, paper & pulp and chemicals). Average cost increases are very low, less than about 3% for all country-sectors studied, with higher cost increases in Canada (all 4 sectors), Australia (both metals sectors) and Belgium (iron & steel). They conclude that ‘empirical studies on existing carbon/energy taxes seem to indicate that competitive losses are not significant’. This supports the conclusions of the IPCC’s Third Assessment Report (TAR, IPCC 2001), namely that ‘reported effects on international competitiveness are very small and that at the firm

European Review of Energy Markets- volume 3, issue 1, April 2009 The competitiveness effects of European environmental fiscal reforms
Terry Barker, Paul Ekins, Sudhir Junankar, Hector Pollitt & Philip Summerton
[2009] 7 EREM © European Energy Institute and contributors 3
and sector level, given well-designed policies, there will not be a significant loss of competitiveness from tax-based policies to achieve targets similar to those of the Kyoto Protocol.’ (p. 589). This paper describes modelling to assess the impacts on international competitiveness of environmental tax reforms (ETRs). ETR is intended to shift taxation away from beneficial activities, such as employment, towards damaging activities such as pollution. The idea is to implement specific taxes to encourage households and industries to behave in a way which is environmentally sustainable. The revenues thereby generated are used to reduce burdensome taxes to complete the ETR. A number of European countries (Denmark, Finland, Germany, Netherlands, Sweden, UK) have already implemented an ETR, by increasing some environmental taxes and decreasing other taxes, so that the overall package was more or less revenue neutral. Although economic theory suggests that ETR should be implemented in such a way as to equalise marginal abatement costs across the economy, in fact, the ETRs so far implemented have generally exempted or provided special treatment (e.g. through reduced tax rates) for energy-intensive industries, in an effort to mitigate perceived effects on competitiveness. The modelling has sought to give insights into the effects of both the ETR itself and these exemptions.
2. Modelling the EU Energy-Environment-Economy System with E3ME41
E3ME (Energy-Environment-Economy Model for Europe) is a general model for Europe designed to address issues that link developments and policies in the areas of energy, the environment and the economy. The European economy is becoming more and more integrated; at the same time, the relationship between economic activity, energy use and the environment is of pressing concern for European policy and political debate. The guiding principles of the model are such that it is: • elaborated at a European rather than at a national level, with the
national economies being treated as countries of Europe • dealing with energy, the environment, population and the economy in

European Review of Energy Markets- volume 3, issue 1, April 2009 The competitiveness effects of European environmental fiscal reforms
Terry Barker, Paul Ekins, Sudhir Junankar, Hector Pollitt & Philip Summerton
4 [2009] 7 EREM © European Energy Institute and contributors
one modelling framework and allowing short-term deviations to occur while convergence to a long-run outcome takes place
• designed from the outset to address issues of central importance for economic, energy and environmental policy at the European level
• capable of providing highly disaggregated short- and long-term economic and industrial forecasts for business and government
• capable of analysing long-term structural change in energy demand and supply and in the economy
• focused on the contribution of research and development, and associated technological innovation, on the dynamics of growth and change
E3ME is a multisectoral dynamic regional econometric model capable of providing a long-term equilibrium solution. The model uses input-output tables, but combines them with the time-series analysis used in macroeconometric models. It has been developed following the structure of a regionalised E3 model of the UK economy (Barker and Peterson, 1987) which has been used to analyse in detail the effect of existing and proposed carbon/energy taxes on the UK economy. Models in the same tradition for national economies have been developed by the INFORUM group of modellers (see Almon, 1991). E3ME version 4.1 is comprehensively described in the model manual (http://www.camecon-e3memanual.com/), which includes a full set of results from the estimated equations. The role of trade is central to the analysis of competitiveness of an individual region or industry. Trade is an important feature in a regional model such as E3ME for two main reasons. First, European integration has led to a rise in the openness in many EU markets, with an associated rise in the ratio of exports to total final demand. Second, exports and imports represent the linkage between the countries in E3ME, so any effects moving from one region to another are transmitted through this area of the model. The modelling of exports and imports is similar in structure, in terms of income and price effects and also because they use similarly constructed variables. All trade is treated as if it takes place through a European pool. The export and import volume equations represent each region’s exports into this pool and imports from it. Total exports and imports have been separated into two sub-components, one for intra-EU trade and one for extra-EU trade. However, it is not possible to identify separate trade prices for intra- and extra- EU trade, and therefore the export and import price specifications are for all exports and imports, regardless of destination or

European Review of Energy Markets- volume 3, issue 1, April 2009 The competitiveness effects of European environmental fiscal reforms
Terry Barker, Paul Ekins, Sudhir Junankar, Hector Pollitt & Philip Summerton
[2009] 7 EREM © European Energy Institute and contributors 5
source. The determinants of export volumes in the model can be separated into two groups of effects, those associated with income and those with prices. A proxy for technical progress (accumulated gross fixed investment plus R&D expenditure) is also included in the equations. The technical progress indicators are used as a measure of innovation and product quality and estimate the non-price competitiveness of an industry. They are also included to cope with the quality effect on prices caused by increased levels of investment and R&D. One of the purposes of E3ME is to provide a consistent and coherent treatment of fiscal policy in relation to greenhouse gas emissions. All the energy and emission taxes are converted into a consistent set of units (€/toe). These taxes are then added to the costs of the fuels. Tax revenues can be calculated from fuel use; the revenues will be reduced according to the fall in use, but will rise according to price inflation and any escalator in the tax rates. In considering the competitive response of different sectors and companies, there are two important questions to be answered: • are the prices of the product set in the world markets or by the
producer or in the local markets? • how flexible is the process of production in responding to an increase in
costs? If the price is fixed in the world market, then no increase in costs arising from an increase in energy taxes can be passed on to prices. If the process of production is also fixed (e.g. because the product requires long-lived capital stock), then it might be very expensive to change the technology or move the plant; so all extra costs must be paid out of profits. If the industry or the company is not profitable, then the extra costs could lead to plant closing. However, this is an extreme outcome and most industries and companies have the ability to pass extra costs on to their customers and to change their production process to reduce emissions and avoid some of the increase in taxes. For these reasons, changes in manufacturing export and import volumes do not give enough information about the effects on competitiveness. The effects on unit costs can be compared to those on export prices to see which sectors have their profit margins squeezed by

European Review of Energy Markets- volume 3, issue 1, April 2009 The competitiveness effects of European environmental fiscal reforms
Terry Barker, Paul Ekins, Sudhir Junankar, Hector Pollitt & Philip Summerton
6 [2009] 7 EREM © European Energy Institute and contributors
being forced to accept world prices for their products, while at the same time being unable to avoid increases in their unit costs (see Barker 1998). The net effect on industrial and import prices will eventually feed through to consumer prices and will affect relative consumption of goods and services depending on the carbon/energy content and on their price elasticities. The higher consumer prices will then lead to higher wage claims. The econometric evidence supports the theoretical presumption that all the tax is eventually paid by the final consumer; and this condition is imposed in the long-term solution of the model. The changes in relative fuel prices as a result of the tax will change fuel use, depending on substitution elasticities. The fuel price increases will be passed on to more general increases in prices, which will cause substitution in consumers’ expenditure, in exports and between imports and domestic production. These changes will feed back to fuel use. CO2 emissions are derived directly from the use of different fuels. If employment costs are reduced when tax revenues are recycled, then industrial employment will be stimulated directly, with a further indirect effect as labour-intensive goods and services gain in relative price competitiveness. The scenarios reported on here assume that the ETRs in each country are revenue neutral in each year; in this way the results presented later describe a shift in the tax burden to energy use from the more general economy, rather than an increase in the overall tax burden. Of the six countries examined, a variety of methods were used to recycle the tax revenues and in some cases a combination of methods was used. The revenue recycling methods considered in E3ME are: changes in income tax; employers’ social security contributions; employees’ social security contributions; benefit rates; and the tax treatment of investment in energy-saving technology.

European Review of Energy Markets- volume 3, issue 1, April 2009 The competitiveness effects of European environmental fiscal reforms
Terry Barker, Paul Ekins, Sudhir Junankar, Hector Pollitt & Philip Summerton
[2009] 7 EREM © European Energy Institute and contributors 7
3. Specification of ETR scenarios
As noted above, a number of European countries (Denmark, Finland, Germany, Netherlands, Sweden, UK) have already implemented an ETR, by increasing some environmental (mainly energy or carbon) taxes and decreasing other taxes in compensation, so that the overall package was more or less revenue neutral. The ETRs varied widely by country, often involving several different taxes and tax rates, which changed over time. There is no space to provide details of the ETRs here (for example, which taxes were introduced or increased, and which reduced), for which see Ekins & Speck 2008. The following scenarios, summarized in Table 1, were generated by E3ME over the period 1994 to 2012 so that the projection period includes Phase 2 of the EU Emissions Trading Scheme (ETS): • R: the Reference Case, which is a counterfactual projection without the
ETRs that had been implemented, but including current and expected developments in the EU economy, e.g. the EU ETS
• B: the Baseline (or just Base) Case, which is an endogenous solution of
E3ME over the period 1994-2012. The historical part of the baseline
TABLE 1: MODELLED SCENARIOS
Scenario ETR Revenue Recycling Exemptions
1 Reference (R) No No N/A
2 Baseline (B) Yes Yes Yes
3 Exemptions (E) Yes Yes No
4 Compensation (C) No Yes N/A

European Review of Energy Markets- volume 3, issue 1, April 2009 The competitiveness effects of European environmental fiscal reforms
Terry Barker, Paul Ekins, Sudhir Junankar, Hector Pollitt & Philip Summerton
8 [2009] 7 EREM © European Energy Institute and contributors
solution covers the period 1994-2002. This scenario includes the ETR as implemented in the above Member States, as well as any exemptions or special treatment for industries and the compensating reduction in another tax, all as they were implemented. This scenario is calibrated closely to the observed outcome through using historical data which include the effects of ETR implementation
• E: the case with the tax elements of the ETRs and compensating tax
reductions (i.e. revenue recycling) but where any exemptions and special treatment for particular industries or sectors have been removed
• C: the case without the tax elements of the ETRs, but retaining the
reductions in taxes as implemented in the ETRs. Therefore this scenario subtracts the energy and carbon taxes (so there is no ETR) from the baseline but does not change the tax reductions as in the baseline. By comparing scenario C to the baseline the effects of the energy and carbon taxes can be isolated. By comparing scenario C to the reference case the effects of the compensating tax reductions can be isolated.
These scenarios allow the ETR to be decomposed country by country (in each of the six ETR countries) into three components: the full tax, the exemptions, the compensation via revenue recycling. The price and non-price competitiveness effects are considered to see whether any inferences can be drawn about the Porter hypothesis (that environmental policy can increase business competitiveness). The results are discussed in the next section for each Member State with an ETR and some comparisons are made relating to the impact of ETR on economic activity in the ETR and non-ETR countries in the EU.
4. The effects of the ETRs
4.1. The Baseline Scenario
The Baseline scenario is an endogenous model solution of E3ME that fully covers the period 1994-2012 annually, with the ETRs in the six ETR countries as implemented. It is calibrated to be consistent with a combination of historical data and forecast. The historical part of the Baseline solution, which is used for the ex-post analysis of 1994-2002 (or 2003 where the data were available at the time of the modelling) comes

European Review of Energy Markets- volume 3, issue 1, April 2009 The competitiveness effects of European environmental fiscal reforms
Terry Barker, Paul Ekins, Sudhir Junankar, Hector Pollitt & Philip Summerton
[2009] 7 EREM © European Energy Institute and contributors 9
from E3ME’s historical databanks. The main sources for these are the OECD, Eurostat and the International Energy Agency (IEA). These data include the effects of ETR in the 1990s, and any accompanying exemptions and revenue recycling methods. The forecast part of the Baseline solution, which is used for the ex-ante analysis, is derived from a combination of DG TREN’s Energy and Transport Trends to 2030 (published by the European Environment Agency, EEA), and the IEA’s Energy Price Assumptions. All the charts in this section compare results against the Reference case for ease of interpretation, i.e. when results for the Baseline case are shown as a percentage difference, this means the percentage difference caused by the combination of the environmental taxes and the revenue recycling.
CHART 1: THE EFFECT OF ETR ON TOTAL FUEL DEMAND
-8
-6
-4
-2
0
1994 1997 2000 2003 2006 2009 2012Note(s) : % difference is the difference between the base case and the counterfactual
reference case.Source(s) : CE.
Denmark
Netherlands
UK
Germany
FinlandSweden
% difference

European Review of Energy Markets- volume 3, issue 1, April 2009 The competitiveness effects of European environmental fiscal reforms
Terry Barker, Paul Ekins, Sudhir Junankar, Hector Pollitt & Philip Summerton
10 [2009] 7 EREM © European Energy Institute and contributors
4.2. Overall effects of ETR in ETR countries
This section compares the results for the Baseline case against the Reference case, i.e. it illustrates the difference to 2012 between what did happen (with revenue neutrality assumed in each case through the revenue recycling mechanisms) and what would have happened had there been no ETR. Exemptions, non-payments and negotiated agreements are included in the Baseline as accurately as possible as they happened, subject to the total revenues matching the published figures in each case. Therefore the data used for this analysis are the tax revenues resulting from the ETR, with effective tax rates determined by the ratio of revenues divided by fuel use. The taxes are not assumed to have any effect other than to increase energy prices (e.g. there are no extra awareness effects), with the exception of the effect that has been shown to be associated with the announcement of the Climate Change Levy (CCL) in the UK. As the taxes included in the analysis increased fuel prices, the primary effect is expected to be a reduction in the demand for energy. The scale of the reduction will depend on the tax rates, on how they are applied to the various fuels and fuel user groups, on how easy it is for fuel users to substitute between the different fuel types and non-fuel inputs, and on the scale of the secondary effects from resulting changes in economic activity. The modelling shows that all the six countries show a reduction in fuel demand from the ETR (see Chart 1). In most cases the reduction in fuel demand was in the region of 4%, although it was slightly larger in Sweden and Finland than the other countries. A key feature of the results is the recovery in fuel demand in several of the examined countries over 2004-05 in the Baseline case relative to the Reference case, due to higher world energy prices, included in both the Baseline and Reference cases. In most of the ETRs, the environmental taxes were not raised in line with fuel prices (and in some cases may have been reduced), implying a reduction in the relative change in fuel prices. For example, a tax that doubled the price of oil for households in 2003 may only have increased it by 50% in 2005. Consequently the change in fuel demand becomes less in these years. After 2004, the environmental taxes are assumed to increase in line with the consumer price index (not energy prices). Results after 2004 are therefore mainly a reflection of the changing energy prices, and the dynamic and lagged effects of the ETRs. A reduction in atmospheric emissions from lower fuel consumption would be expected. The scenario results show that there are reductions in GHGs

European Review of Energy Markets- volume 3, issue 1, April 2009 The competitiveness effects of European environmental fiscal reforms
Terry Barker, Paul Ekins, Sudhir Junankar, Hector Pollitt & Philip Summerton
[2009] 7 EREM © European Energy Institute and contributors 11
in all six ETR countries from the ETR (see Chart 2). This is consistent with national policies to meet the European Burden Sharing Agreement targets, by which EU countries have agreed to emit a specified level of GHGs over the period 2008-12. The effects closely follow the results for total fuel consumption, with the largest reductions occurring in countries with the highest tax rates.
CHART 2: THE EFFECT OF ETR ON GHG EMISSIONS
-8
-6
-4
-2
0
1994 1997 2000 2003 2006 2009 2012
Denmark
Netherlands
Germany
Finland Sweden
Note(s) : % difference is the difference between the base case and the counterfactualreference case.
Source(s) : CE.
UK
% difference
The largest reductions in emissions occur in Finland and Sweden. It should be noted that in most cases the fall in emissions is relatively larger than the fall in fuel demand, indicating that the tax policies are efficient at reducing emissions. As a general rule, the effects of the ETR will be positive on economic activity, depending on how the revenues from the environmental taxes are recycled. This is because tax distortions in the labour market are reduced in the revenue recycling measures. Lowering labour taxes encourages employers to hire more staff (in the case of employers’ contributions) and

European Review of Energy Markets- volume 3, issue 1, April 2009 The competitiveness effects of European environmental fiscal reforms
Terry Barker, Paul Ekins, Sudhir Junankar, Hector Pollitt & Philip Summerton
12 [2009] 7 EREM © European Energy Institute and contributors
encourage more people to join the labour force (in the case of income taxes). Unlike some economic models, E3ME does not assume that economies operate optimally and shifts in the tax burden will therefore not necessarily have a negative effect on output. However, it is likely that there will be short-term transition costs, so the gains may not be immediate. All six of the ETR countries have an increase in GDP as a result of the ETR (see Chart 3). In Sweden, the effects take slightly longer to come through, as the very large increase in household electricity taxes depresses real incomes in the short run. Finland has a short-term boost to GDP from the effects of the taxes on fuel demand, because a reduction in the demand for imported fuel improves the country’s trade balance.
CHART 3: THE EFFECT OF ETR ON GDP
-0.5
0
0.5
1
1994 1997 2000 2003 2006 2009 2012
Denmark
Netherlands
UK
Germany
Finland
Sweden
Note(s) : % difference is the difference between the base case and the counterfactualreference case.
Source(s) : CE.
% difference
The ETR caused employment in some of the ETR countries to increase by as much as 0.5%. Employment increases because the revenue from the ETR is used to reduce employers’ social contributions, therefore wage costs are reduced, and hence firms are able to increase their labour force. This is the case for Denmark, Germany and the UK. In Denmark the ETR has an

European Review of Energy Markets- volume 3, issue 1, April 2009 The competitiveness effects of European environmental fiscal reforms
Terry Barker, Paul Ekins, Sudhir Junankar, Hector Pollitt & Philip Summerton
[2009] 7 EREM © European Energy Institute and contributors 13
immediate effect on the level of employment, which remains nearly 0.5% higher throughout the modelling period (see Chart 4). In Germany a more modest increase in employment is recorded of approximately 0.2% increased employment against the reference case. However, in the UK the change in employment is small. This is because the revenue recycled to reduce social security contributions was much smaller. Interestingly employment in Sweden was higher due to the ETR despite revenues being used to reduce income tax and not social security contributions. This is because the increase in GDP as a result of the ETR has caused employment to increase slightly compared to the reference case.
CHART 4: THE EFFECT OF ETR ON EMPLOYMENT
-0.5
0
0.5
1
1994 1997 2000 2003 2006 2009 2012
Denmark
UK
Germany
Sweden
Note(s) : % difference is the difference between the base case and the counterfactualreference case.
Source(s) : CE.
% difference
Investment levels remain unchanged for most of the ETR countries. Chart 5 shows that investment levels are virtually unchanged between the baseline and the reference case for the UK and Denmark, (similarly for Finland and the Netherlands although this is not shown). In Sweden, investment increases as a result of the ETR by nearly 1.5% in 2006. Conversely, in

European Review of Energy Markets- volume 3, issue 1, April 2009 The competitiveness effects of European environmental fiscal reforms
Terry Barker, Paul Ekins, Sudhir Junankar, Hector Pollitt & Philip Summerton
14 [2009] 7 EREM © European Energy Institute and contributors
Germany investment falls as a result of the ETR, this is due primarily to an increase in energy prices as a factor cost, but also due to the relative cost of capital to labour.
CHART 5: THE EFFECT OF ETR ON INVESTMENT
-1
-0.5
0
0.5
1
1.5
1994 1997 2000 2003 2006 2009 2012
Denmark
UK Germany
Sweden
Note(s) : % difference is the difference between the base case and the counterfactualreference case.
Source(s) : CE.
% difference
The revenue recycled into social security contributions in Germany means that labour becomes relatively cheaper compared to capital and hence capital investment falls, albeit by less than 1% when compared to the reference case. Furthermore by 2012 the levels of investment are broadly similar between the baseline and the reference scenarios. As the ETRs result in higher fuel prices it is considered likely that there will be an increase in the overall price level. The degree of this is likely to be dependent on the scale of the increase in fuel costs, how easy it is for industry and consumers to switch between fuels to cheaper alternatives (and non-energy inputs) and how much of the cost is passed on by industry to consumers (this is dependent on the level of competition in the industry, which is estimated econometrically for each region and sector). It should

European Review of Energy Markets- volume 3, issue 1, April 2009 The competitiveness effects of European environmental fiscal reforms
Terry Barker, Paul Ekins, Sudhir Junankar, Hector Pollitt & Philip Summerton
[2009] 7 EREM © European Energy Institute and contributors 15
also be noted that the revenue recycling may have a depressing effect on inflation when the revenues are recycled through reductions in employers’ social security contributions (i.e. labour costs). This is demonstrated for Germany (where just under half the revenues were used for reducing employers’ contributions) in Chart 6.
CHART 6: PRICE EFFECTS IN GERMANY
-0.4-0.3-0.2-0.10.00.10.20.30.4
1994 1997 2000 2003 2006 2009 2012
The Price Effect of Tax and Revenue Recycling
The Price Effect of Revenue Recycling on its own
Note(s) : % difference is the difference between base case and the counterfactual reference case for Tax and Revenue Recycling and is the difference between the no revenue recycling case and the base case for revenue recycling.
Source(s) : CE.
% difference
In Denmark and the UK, there were no significant increases in the overall price index. In the UK this is because the tax is relatively small and was compensated with slightly cheaper labour costs. In Denmark the tax was larger, but was again compensated with lower labour costs (see Chart 7). The measure of inflation shown in Chart 7, the consumer price index, will record a larger increase in cases where the taxes are levied on households rather than industry. The reason for this is that the consumer price index is a weighted average of the price of consumer products, including energy. In the cases where the tax is levied on households the whole tax is reflected in the consumer price index, rather than just the share that is passed on by

European Review of Energy Markets- volume 3, issue 1, April 2009 The competitiveness effects of European environmental fiscal reforms
Terry Barker, Paul Ekins, Sudhir Junankar, Hector Pollitt & Philip Summerton
16 [2009] 7 EREM © European Energy Institute and contributors
industry. Therefore it is not unexpected that the largest increases are in the Netherlands and, in particular, in Sweden.
CHART 7: CONSUMER PRICE INDEX
-1
0
1
2
3
4
5
1994 1997 2000 2003 2006 2009 2012
Germany
NetherlandsFinland
Sweden
% difference
Note(s) : % difference is the difference between the base case and the counterfactualreference case.
Source(s) : CE.
Wage effects are key to determining price increases, and the relative economic effects of price increases. The wage equations in E3ME are based on a union bargaining system with spillovers between sectors and countries, and reactions to productivity growth, average consumer prices and relative benefit and unemployment rates. A full set of parameters is estimated independently for each region and sector. The largest increase in wages by far is in Sweden, where there is an average increase of 3-4% (roughly the same as the increase in the CPI). In the other countries, the effect on wages is in the region 0-0.5%, with the largest increases in the Netherlands and Finland. In terms of competitiveness this is very important, because wages are the biggest single determinant of unit costs. The effect on industry prices in Sweden is not that great, however, with only an increase of around 0.3%. In the Netherlands and Finland, the

European Review of Energy Markets- volume 3, issue 1, April 2009 The competitiveness effects of European environmental fiscal reforms
Terry Barker, Paul Ekins, Sudhir Junankar, Hector Pollitt & Philip Summerton
[2009] 7 EREM © European Energy Institute and contributors 17
average effect on prices is around 0.1%, and less in the other countries. The Porter hypothesis suggests that environmental regulation can induce efficiency and innovation and improve competitiveness as efficiency gains partially, or more than fully, offset the costs of complying with the regulation. These results show, in contrast, that in the absence of revenue recycling mechanisms, ETR leads to a net loss of output in all examined countries (except Finland). However, when there is revenue recycling, ETR, as modelled within E3ME, produces a small ‘double dividend’ effect in every country, with GDP increasing by up to 0.5% compared to the Reference case. In the following section we shall consider the individual impacts of the fuel taxes, the revenue recycling and the tax exemptions on each of the ETR countries. A direct method for investigating the impact on competitiveness is to determine whether or not the introduction of ETR caused export and import levels to change in the ETR countries. Chart 8 shows the effects of the ETR on aggregate exports by region. In the largest two ETR countries, Germany and the UK the ETR has very little effect on exports, similarly there was little effect on exports in Finland and Sweden (not shown in the chart for presentational reasons). However Denmark and the Netherlands see a small increase in exports over the period, in the case of Denmark this is the result of lower labour costs as revenues are recycled by reducing the social security contribution. Sweden witnesses, as Chart 9 shows, the largest increase in imports, aggregate imports are 0.8% higher as a result of the ETR. It is unlikely that this represents a reduction in competitiveness in the domestic market for home producers, rather, given that GDP increases by 0.5% in Sweden and that revenue is recycled into reducing income taxes, it is more probable that imports increase as a result of increased consumer spending. Both Germany and the UK, the two largest ETR economies, see little change in imports as a result of the ETR.

European Review of Energy Markets- volume 3, issue 1, April 2009 The competitiveness effects of European environmental fiscal reforms
Terry Barker, Paul Ekins, Sudhir Junankar, Hector Pollitt & Philip Summerton
18 [2009] 7 EREM © European Energy Institute and contributors
CHART 8: THE EFFECT OF ETR ON EXPORTS
-0.1
0
0.1
0.2
0.3
0.4
0.5
1994 1997 2000 2003 2006 2009 2012
DenmarkNetherlands
UK Germany
Note(s) : % difference is the difference between the base case and the counterfactualreference case.
Source(s) : CE.
% difference
CHART 9: THE EFFECT OF ETR ON IMPORTS
-1
-0.5
0
0.5
1
1994 1997 2000 2003 2006 2009 2012
Denmark
UK
Germany
Finland
Sweden
Note(s) : % difference is the difference between the base case and the counterfactualreference case.
Source(s) : CE.
% difference

European Review of Energy Markets- volume 3, issue 1, April 2009 The competitiveness effects of European environmental fiscal reforms
Terry Barker, Paul Ekins, Sudhir Junankar, Hector Pollitt & Philip Summerton
[2009] 7 EREM © European Energy Institute and contributors 19
4.3. The effects of ETR in non-ETR countries
The aggregate GDP effects of the 1990s’ tax reforms are dominated by the results for Germany. Considering the German tax reforms on their own, there is an impact on all other countries, with and without their own tax reforms. It is not therefore surprising that there is little overall effect in Europe before the implementation of the German tax reforms in 1999 (see Chart 10). The effects in the other European countries are thus dominated by their trade patterns with Germany. Countries that export to Germany themselves gain when German demand for their products grows. It should be noted that results for other ETR countries trading with Germany will include similar effects. The overall scale of the difference is very small, an increase in GDP of 0.3% in the ETR countries equates to about half of one quarter’s growth, while an increase of 0.05% is six times smaller again.
CHART 10: THE EFFECTS OF ETR: GDP IN ETR AND NON ETR COUNTRIES
-0.1
0.0
0.1
0.2
0.3
1994 1997 2000 2003 2006 2009 2012
ETR Countries
% difference
Non ETR Countries
Note(s) : % difference is the difference between the base case and the counterfactualreference case.
Source(s) : CE.

European Review of Energy Markets- volume 3, issue 1, April 2009 The competitiveness effects of European environmental fiscal reforms
Terry Barker, Paul Ekins, Sudhir Junankar, Hector Pollitt & Philip Summerton
20 [2009] 7 EREM © European Energy Institute and contributors
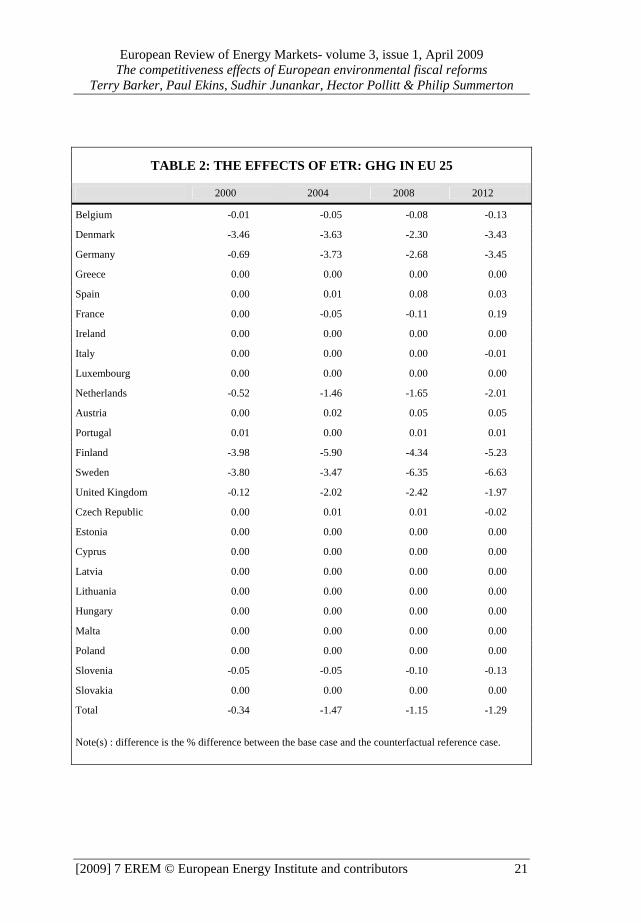
Table 2 shows the effects of the ETR in the six countries and whether there are any cross-regional effects between the ETR countries and non-ETR countries. The results show that the ETRs have very little effect on the greenhouse gas emissions of other EU countries. This is consistent with there being little carbon leakage within the EU, the process by which a reduction in carbon emissions in one region leads to an increase in carbon emissions in a second region, due to an ETR causing a relocation of industry. It also highlights that unilateral ETR action has a positive effect, reducing greenhouse gas emissions without having a detrimental effect (i.e. increasing them) elsewhere: this is a key finding from the COMETR project.
European Review of Energy Markets- volume 3, issue 1, April 2009 The competitiveness effects of European environmental fiscal reforms
Terry Barker, Paul Ekins, Sudhir Junankar, Hector Pollitt & Philip Summerton
[2009] 7 EREM © European Energy Institute and contributors 21
TABLE 2: THE EFFECTS OF ETR: GHG IN EU 25
2000 2004 2008 2012
Belgium -0.01 -0.05 -0.08 -0.13
Denmark -3.46 -3.63 -2.30 -3.43
Germany -0.69 -3.73 -2.68 -3.45
Greece 0.00 0.00 0.00 0.00
Spain 0.00 0.01 0.08 0.03
France 0.00 -0.05 -0.11 0.19
Ireland 0.00 0.00 0.00 0.00
Italy 0.00 0.00 0.00 -0.01
Luxembourg 0.00 0.00 0.00 0.00
Netherlands -0.52 -1.46 -1.65 -2.01
Austria 0.00 0.02 0.05 0.05
Portugal 0.01 0.00 0.01 0.01
Finland -3.98 -5.90 -4.34 -5.23
Sweden -3.80 -3.47 -6.35 -6.63
United Kingdom -0.12 -2.02 -2.42 -1.97
Czech Republic 0.00 0.01 0.01 -0.02
Estonia 0.00 0.00 0.00 0.00
Cyprus 0.00 0.00 0.00 0.00
Latvia 0.00 0.00 0.00 0.00
Lithuania 0.00 0.00 0.00 0.00
Hungary 0.00 0.00 0.00 0.00
Malta 0.00 0.00 0.00 0.00
Poland 0.00 0.00 0.00 0.00
Slovenia -0.05 -0.05 -0.10 -0.13
Slovakia 0.00 0.00 0.00 0.00
Total -0.34 -1.47 -1.15 -1.29
Note(s) : difference is the % difference between the base case and the counterfactual reference case.

European Review of Energy Markets- volume 3, issue 1, April 2009 The competitiveness effects of European environmental fiscal reforms
Terry Barker, Paul Ekins, Sudhir Junankar, Hector Pollitt & Philip Summerton
22 [2009] 7 EREM © European Energy Institute and contributors
GDP changes are shown in Table 3. Interestingly only Belgium experiences a reduction in GDP, by 2012, as a result of the ETRs, albeit a very small reduction. Most of the non-ETR countries experience no change in GDP, furthermore, the increases in GDP experienced by the ETR countries is small although not insignificant.

European Review of Energy Markets- volume 3, issue 1, April 2009 The competitiveness effects of European environmental fiscal reforms
Terry Barker, Paul Ekins, Sudhir Junankar, Hector Pollitt & Philip Summerton
[2009] 7 EREM © European Energy Institute and contributors 23
TABLE 3: THE EFFECTS OF ETR: GDP IN EU 25
2000 2004 2008 2012
Belgium 0.02 0.02 -0.05 -0.08
Denmark 0.05 0.24 0.34 0.43
Germany 0.05 0.05 0.29 0.39
Greece 0.00 0.00 0.00 0.00
Spain 0.01 0.02 0.03 0.05
France 0.01 0.01 0.05 0.03
Ireland 0.00 0.00 0.00 0.00
Italy 0.00 0.02 0.06 0.06
Luxembourg 0.00 0.00 0.00 0.00
Netherlands 0.00 0.11 0.18 0.27
Austria 0.02 0.03 0.07 0.06
Portugal 0.00 -0.02 -0.01 0.02
Finland 0.47 0.91 0.51 0.50
Sweden -0.08 -0.15 0.14 0.52
United Kingdom 0.02 0.01 0.06 0.09
Czech Republic 0.01 -0.01 0.00 0.00
Estonia 0.00 0.00 0.00 0.00
Cyprus* 0.00 0.00 0.00 0.00
Latvia 0.00 0.00 0.00 0.00
Lithuania 0.00 0.00 0.00 0.00
Hungary 0.01 0.01 0.01 0.01
Malta* 0.00 0.00 0.00 0.00
Poland 0.01 0.02 0.02 0.03
Slovenia 0.16 0.03 0.07 0.01
Slovakia 0.02 0.01 0.02 0.00
Total 0.02 0.04 0.12 0.16
Note(s): difference is the % difference between the base case and the counterfactual reference case.

European Review of Energy Markets- volume 3, issue 1, April 2009 The competitiveness effects of European environmental fiscal reforms
Terry Barker, Paul Ekins, Sudhir Junankar, Hector Pollitt & Philip Summerton
24 [2009] 7 EREM © European Energy Institute and contributors
4.4. The effects of the exemptions
It is not always easy to define the exemptions from the environmental taxes. For example, there may be little difference between a lower tax rate and an exemption from a higher tax rate. It is almost impossible to obtain data for lost revenues from exemptions, and the data that do exist are likely to include other non-payments. In the scenario for no exemptions (E) we have defined a tax with no exemptions as the full tax rate, and revenues from this tax are calculated as tax rate * fuel use. This is the opposite case to the Baseline scenario, where tax rates are defined as revenues/fuel use. This approach makes the implicit assumption that all non-payments are exemptions and not, for example, due to tax evasion. Generally, the effects are fairly linear, in that the higher tax rates cause a larger decrease in fuel use and emissions, and this feeds through to the wider economy. Usually the effects of the exemptions are quite small, however. The largest effect is in the Netherlands, because the tiered electricity and gas rates to business are assumed to be exemptions, and therefore, when these are removed, industry pays the highest tax rates and the effects on fuel demand are much greater. In comparison, there is little difference in Sweden. Charts 11 to 16 below show the difference the exemptions make to fuel use in different countries.

European Review of Energy Markets- volume 3, issue 1, April 2009 The competitiveness effects of European environmental fiscal reforms
Terry Barker, Paul Ekins, Sudhir Junankar, Hector Pollitt & Philip Summerton
[2009] 7 EREM © European Energy Institute and contributors 25
CHART 11: THE EFFECTS OF EXEMPTIONS: FUEL USE IN DENMARK
-8.0
-6.0
-4.0
-2.0
0.0
1994 1997 2000 2003 2006 2009 2012
Baseline vs Reference
% difference
Source(s) : CE.
No Exemptions vs Reference
CHART 12: THE EFFECTS OF EXEMPTIONS: FUEL USE IN GERMANY
-8.0
-6.0
-4.0
-2.0
0.0
2.0
1994 1997 2000 2003 2006 2009 2012
Baseline vs Reference
% difference
Source(s) : CE.
No Exemptions vs Reference

European Review of Energy Markets- volume 3, issue 1, April 2009 The competitiveness effects of European environmental fiscal reforms
Terry Barker, Paul Ekins, Sudhir Junankar, Hector Pollitt & Philip Summerton
26 [2009] 7 EREM © European Energy Institute and contributors
CHART 13: THE EFFECTS OF EXEMPTIONS: FUEL USE IN THE NETHERLANDS
-14.0
-12.0
-10.0
-8.0
-6.0
-4.0
-2.0
0.0
1994 1997 2000 2003 2006 2009 2012
Baseline vs Reference
% difference
Source(s) : CE.
No Exemptions vs Reference
CHART 14: THE EFFECTS OF EXEMPTIONS: FUEL USE IN FINLAND
-8.0
-6.0
-4.0
-2.0
0.0
2.0
1994 1997 2000 2003 2006 2009 2012
Baseline vs Reference
% difference
Source(s) : CE.
No Exemptions vs Reference

European Review of Energy Markets- volume 3, issue 1, April 2009 The competitiveness effects of European environmental fiscal reforms
Terry Barker, Paul Ekins, Sudhir Junankar, Hector Pollitt & Philip Summerton
[2009] 7 EREM © European Energy Institute and contributors 27
CHART 15: THE EFFECTS OF EXEMPTIONS: FUEL USE IN SWEDEN
-8.0
-6.0
-4.0
-2.0
0.0
2.0
1994 1997 2000 2003 2006 2009 2012
Baseline vs Reference
% difference
Source(s) : CE.
No Exemptions vs Reference
CHART 16: THE EFFECTS OF EXEMPTIONS: FUEL USE IN THE UK
-4.0
-3.0
-2.0
-1.0
0.0
1.0
2.0
1994 1997 2000 2003 2006 2009 2012
Baseline vs Reference
% difference
Source(s) : CE.
No Exemptions vs Reference

European Review of Energy Markets- volume 3, issue 1, April 2009 The competitiveness effects of European environmental fiscal reforms
Terry Barker, Paul Ekins, Sudhir Junankar, Hector Pollitt & Philip Summerton
28 [2009] 7 EREM © European Energy Institute and contributors
4.5. Isolating the effects of the taxes
This section looks briefly at one of the alternative scenarios that is designed to identify the effects of the energy taxes on their own without any revenue recycling. One would expect the higher energy prices on their own to have a negative impact on GDP (although in one region, Finland, GDP increases due to energy imports, particularly oil and gas, falling). The assumptions underlying this analysis are stylised and therefore not necessarily realistic. As the national governments are not using the extra revenues to reduce labour taxes or increase spending, it is assumed that they are used simply to reduce national debt. As the government sector and interest rates are exogenous in E3ME, this is effectively saying that there is an increase in the overall tax burden and the revenues raised by government are leaving the system. The overall effect (higher fuel prices with no compensating measures) is equivalent to an increase in world energy prices in countries that have no domestic oil and gas resources. The level of the tax in the UK was too small to appear on Chart 17 below so has been removed (the effect on GDP was in the region of -0.02%). The results are broadly in line with expectations for most of the countries. The largest tax reforms were in Sweden, where the inflationary consequences had a significant effect on real household incomes and consumption. As household spending is the largest single contributor to GDP, it is not surprising that Chart 17 shows a relatively large fall in GDP in Sweden, particularly over the period of the introduction of ETR. Household spending is also reduced in the Netherlands as a result of higher electricity prices. Effects on employment varied across the countries examined. The key determinants of employment are the effects of changes in output and the various elasticities between employment and output and employment and energy prices. Any impact on wages from higher consumer prices will also affect employment rates, but it is assumed that employers’ social security rates do not change (as there is no revenue recycling in this scenario). There were small falls in employment in the region of 0.02% in Denmark and Germany but larger falls of up to 0.1% in the Netherlands and Finland. There was little change in Sweden, but a slight increase in the UK, as businesses substituted labour for energy.

European Review of Energy Markets- volume 3, issue 1, April 2009 The competitiveness effects of European environmental fiscal reforms
Terry Barker, Paul Ekins, Sudhir Junankar, Hector Pollitt & Philip Summerton
[2009] 7 EREM © European Energy Institute and contributors 29
CHART 17: THE EFFECT OF ETR WITHOUT REVENUE RECYCLING ON GDP
-1
-0.5
0
0.5
1994 1997 2000 2003 2006 2009 2012
Denmark
Netherlands
GermanyFinland
Sweden
% difference
Note(s) : % difference is the difference between the base case and the compensation only case.
Source(s) : CE.
5. Summary of results and conclusions
5.1. Fuel use and greenhouse gas emissions (GHGs)
The ETRs caused a reduction in fuel use and GHGs in all six of the examined countries. The size of the reduction in fuel demand is dependent on both the tax rates imposed, how they are applied to the various fuels and fuel user groups, how easy it is for fuel users to substitute between the various fuel types and non-fuel inputs and the scale of the secondary effects from resulting changes in economic activity. In most cases, the reduction in fuel demand was around 4%, although it was slightly larger in Finland than in the other ETR countries. A key feature of the results is the recovery in fuel demand in several of the examined countries over 2004-05 in the Baseline case relative to the Reference case, due to higher world energy prices, and the consequent reduction in the relative change in fuel prices caused by the ETRs. The average reduction in fuel demand across the six ETR countries examined was 2.6% in 2004 and the average reduction in

European Review of Energy Markets- volume 3, issue 1, April 2009 The competitiveness effects of European environmental fiscal reforms
Terry Barker, Paul Ekins, Sudhir Junankar, Hector Pollitt & Philip Summerton
30 [2009] 7 EREM © European Energy Institute and contributors
greenhouse gas emissions was 3.1% in 2004. The largest fall in fuel use was in Finland (4.8%) which also had the largest fall in emissions (5.9%). The impact on GHGs depends on both the impacts on fuel use and the relative consumption levels for each fuel type. The largest reductions in emissions occur in the countries with the highest tax rates. Finland and Sweden, for example, experience the largest reductions in emissions, in most cases exceeding the decline in fuel demand, providing evidence for the efficiency of ETRs in reducing emissions. In contrast, the German ETR was not particularly efficient because it did not include coal. For the EU25 as a whole, GHGs are 1.3% below baseline by 2012 as a result of the ETRs analysed in this report.
5.2. Taxes and revenues
Taxes as a share of total fuel costs fell after 2000 as energy prices rose. For example, ETR caused a 10% increase in petrol prices in Denmark in 2002 but less than 5% increase in 2005. If the ETR countries had increased taxes in line with energy costs the reduction in emissions would undoubtedly have been larger. Revenue recycling meant that the cost of ETR to the economy is significantly reduced and can be expected to result in an increase in GDP. The macroeconomic impacts vary from country to country, depending on how the revenues from environmental taxes are recycled. The gains may not, however, be immediate, as there are likely to be transition costs. For all six of the examined countries the ETRs led to an increase in economic activity. In Sweden, the positive effects on GDP take longer to come through, as the very large rise in household electricity taxes depresses real incomes in the short run. Finland, in contrast, experiences a short-term boost to GDP from the effects of taxes on fuel demand, because the reduction in demand for imported fuel improves the country’s trade balance. The tax shift due to the ETRs is relatively small, accounting for at most 1.25% of GDP in any ETR country (Finland in 2004).
5.3. Economic and employment impacts
The scale of the longer-term economic impacts (i.e. the difference between the Baseline and Reference case) is small but nevertheless significant, with GDP increasing by between 0.1% and 0.5% in each ETR country, and about 0.1% for the EU25 total, up to 2012. ETR caused employment in some of the ETR countries to increase by as much as 0.5%. Employment

European Review of Energy Markets- volume 3, issue 1, April 2009 The competitiveness effects of European environmental fiscal reforms
Terry Barker, Paul Ekins, Sudhir Junankar, Hector Pollitt & Philip Summerton
[2009] 7 EREM © European Energy Institute and contributors 31
increases because the revenue from the ETR is used to reduce employers’ social security contributions, therefore wage costs are reduced, and hence firms are able to increase their labour force. This is the case for Denmark, Germany, with increases of 0.5% and 0.2% respectively, in the base compared with the reference case. In Sweden, employment is slightly higher due to ETR despite the use of revenues to cut income tax and not social security contributions. This is because the increase in GDP (rather than the reduction in relative labour costs) as a result of ETR causes employment to be higher than in the reference case.
5.4. Impacts on prices
As ETRs result in higher fuel prices, there is likely to be an increase in the overall price level. The effect on prices, however, will depend on several factors, including the scale of increase in fuel costs, the ease with which industry and consumers can switch to cheaper alternatives (and non-energy inputs), how much of the cost increase is passed on to consumers (which in turn will depend on the level of competition) and the revenue recycling methods used. In the UK and Denmark there were no significant increases in the overall price index because the tax increase was compensated by lower labour costs. The largest inflationary effects from ETRs were in the Netherlands and, in particular, in Sweden. This reflects the fact that the measure of inflation used, the consumer price index (CPI), will record a larger increase in cases where the taxes are levied on households rather than industry. In the case of Germany, however, the revenue recycling associated with the ETR has a depressing effect on prices, because the ETR revenues were used to reduce employers’ contributions and this outweighs the inflationary effect of the energy price increases.
5.5. Sectoral effects
The exemptions offered to certain fuel user groups diluted the effects of the ETRs and reduced their impact. The effects are generally linear in that the higher tax rates cause a larger decrease in fuel use and emissions and this has impacts through to the wider economy. The effects of exemptions, however, are usually quite small. The largest effect from exemptions is in the Netherlands, because the tiered electricity and gas rates to business are assumed, de facto, to be exemptions. When these are removed in scenario E, industry pays the highest tax rates and the consequent effects on fuel
European Review of Energy Markets- volume 3, issue 1, April 2009 The competitiveness effects of European environmental fiscal reforms
Terry Barker, Paul Ekins, Sudhir Junankar, Hector Pollitt & Philip Summerton
32 [2009] 7 EREM © European Energy Institute and contributors
demand are much greater when compared with the Reference case. In conclusion, therefore, this modelling exercise has suggested that, when revenues are appropriately recycled, ETR can lead to both environmental and economic benefits – a policy win-win – although the latter are only small. The results seem robust in that they are derived from sound econometric principles and use official data. But of course all econometric estimation assumes that the structural influences underlying economic development remain unchanged over the forecast period, so that the results should be interpreted in terms more as the kind of outcomes that might be expected on the basis of past experience, rather than as firm predictions of what will happen, for the future may be full of shocks and surprises (such as the financial crisis and ensuing recession) which no econometrics can foresee.
6. References
Adams, J. (1997) Globalisation, Trade, and Environment. in (ED.), O. (Ed.) Globalisation and Environment: Preliminary Perspectives. Paris, OECD. Almon, C. (1991) ‘The INFORUM Approach to Interindustry Modelling’, Economic Systems Research, Vol.3 No.1, pp.1-7. Barker, T. (1998): ‘The effects of competitiveness of coordinated versus unilateral fiscal policies reducing GHG emissions in the EU: an assessment of a 10% reduction by 2010 using the E3ME model’, Energy Policy, Vol 26, No. 14, pp. 1083-1098. Barker, T. & Köhler, J. (1998) International Competitiveness and Environmental Policies. Edward Elgar Publishers, Aldershot, England. Barker, T., & Peterson, A. Eds. (1987). The Cambridge Multisectoral Dynamic Model of the British Economy, Cambridge University Press, Cambridge. Baron, R. & ECON-ENERGY (1997) Economic/Fiscal instruments: Competitiveness Issues Related to Carbon/Energy Taxation. in UNFCCC, A. I. E. G. O. T. (Ed.) Policies and Measures For Common Action Working Paper 14. Paris, OECD/IEA.

European Review of Energy Markets- volume 3, issue 1, April 2009 The competitiveness effects of European environmental fiscal reforms
Terry Barker, Paul Ekins, Sudhir Junankar, Hector Pollitt & Philip Summerton
[2009] 7 EREM © European Energy Institute and contributors 33
Boltho, A. (1996) Assessment: International Competitiveness. Oxford Review of Economic Policy, 12, 1-16. Ekins, P. & Speck, S. 2008 ‘Environmental Tax Reform in Europe: Energy Tax Rates and Competitiveness’, in Chalifour, N., Milne, J., Ashiabor, H., Deketelaere, K. & Kreiser, L. (Eds.) 2008 Critical Issues in Environmental Taxation: International and Comparative Perspectives, Vol.V, Oxford University Press, Oxford, pp.77-105. IPCC (2001), Third Assessment Report of the Intergovernmental Panel on Climate Change, Cambridge University Press. Sijm, J. P. M., Kuik, O. J., Patel, M., Oikonomou, V., Worrell, E., Lako, P., Annevelink, E., Nabuurs, G. J. & Elbersen, H. W. (2004) Spillovers of Climate Policy An assessment of the incidence of carbon leakage and induced technological change due to CO2 abatement measures. Netherlands Research Programme on Climate Change Scientific Assessment and Policy Analysis. ECN. Zhang, Z. & Baranzini, A. (2004) What Do We Know About Carbon Taxes? An inquiry into their Impacts on Competitiveness and Distribution of income, Energy Policy, 32 (2004), 507-518.