the complete college tennessee act and the outcomes-based
TRANSCRIPT

Tennessee Higher Education Commission
The Complete College Tennessee Act
and the
Outcomes-Based Funding Formula
David L Wright and Russ Deaton
THEC
Southern Legislative Conference 66th Annual Meeting
Charleston, West Virginia
July 31, 2012

Tennessee Higher Education Commission
Tennessee Public Higher Education Governance/Coordination Structure

Tennessee Higher Education Commission
Tennessee Higher Education
prior to CCTA
• Master Plan; limited buy-in from institutions
o Little link between funding and state goals
• Performance Funding program allocated 5.5%
of budget on measures tied to Master Plan
• Enrollment-based funding formula
o Hadn’t been fully funded since mid 1990s
• Geography and demography drove institutional
growth

Tennessee Higher Education Commission
Tennessee Higher Education
prior to CCTA
• Lottery scholarship
o Implemented in 2004; based on Georgia HOPE
o Primarily served the traditional-aged college-going
population
o Exceptions: Adult student grant; Technical skills
grant
o Covers a decreasing percentage of tuition and fees
o Favored the universities and private institutions
o Weak funding of state need-based grant

Tennessee Higher Education Commission
Tennessee Higher Education
Fiscal Realities
• Fewer state dollars for institutional
operations
o 20% cut over the last 5 years
• Enrollment growth
• Cost inflation
• Tuition spiral
• Exacerbated by recent recession

Tennessee Higher Education Commission
Tennessee Public Higher Education
Operating Revenues
Total Revenue per FTE - Universities
Inflation Adjusted
$0
$1,500
$3,000
$4,500
$6,000
$7,500
$9,000
$10,500
$12,000
$13,500
$15,000
1999-00 2000-01 2001-02 2002-03 2003-04 2004-05 2005-06 2006-07 2007-08 2008-09 2009-10 2010-11 2011-12
ARRA/MOE
StFees
StAppr

Tennessee Higher Education Commission
CCTA Context
NEEDED:
A new vision for Tennessee
higher education

Tennessee Higher Education Commission
CCTA Context
• Unprecedented fiscal circumstances
• Emphasis on policy alignment
o Statewide policy audit (April 2009, NCHEMS)
• Opportunity for higher ed to function as an
integral part of a state agenda.

Tennessee Higher Education Commission
CCTA Overview
• Public Agenda
• Outcomes-based Funding Formula
• Mission Differentiation
• Articulation & Transfer
• Remedial & Developmental Education
• Community College System
• Research
www.tn.gov/thec

Tennessee Higher Education Commission
2010-2015 Public Agenda for
Tennessee Higher Education
• Primary focus = increasing educational
attainment
• “Public agenda” language was intentional
• Narrowly focused -- on CCTA implementation
• A Public Agenda annual Progress Report on the
Complete College TN website will provide
accountability for Agenda implementation

Tennessee Higher Education Commission
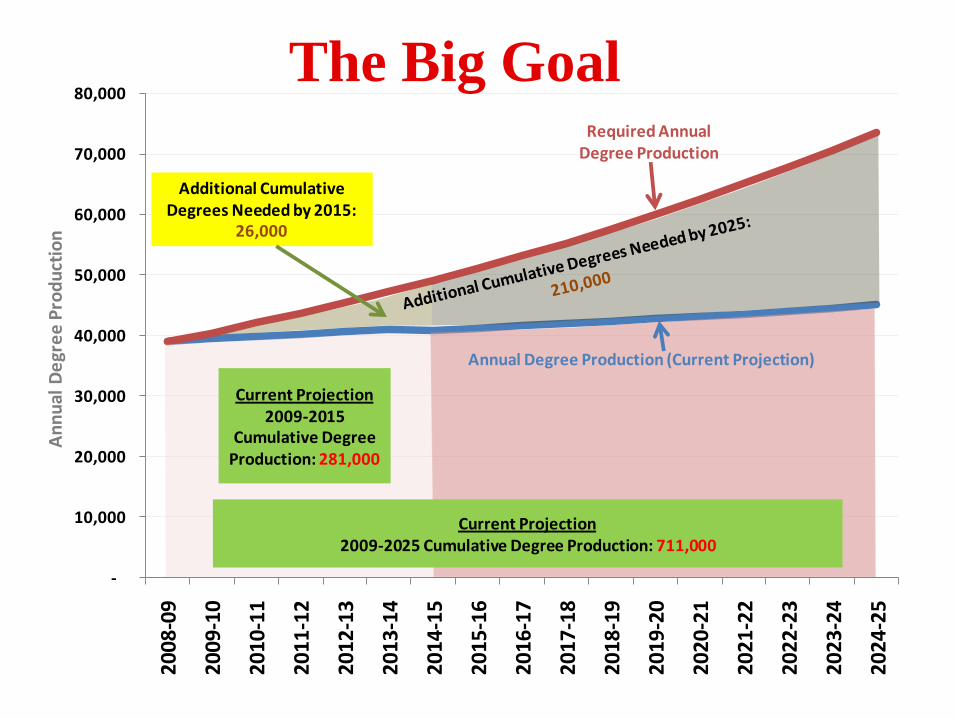
• The “Big Goal”
• Informed by THEC Student Flow Model
• Achieve the U.S. avg in ed attainment by 2025
• Needed:
o 26,000 additional cumulative degrees by 2015
o 210,000 by 2025
o 4% annual increases in certificate and degree
production; every year from now to 2025
o Goal includes private non-profits and for-profits
2010-2015 Public Agenda for
Tennessee Higher Education
-
10,000
20,000
30,000
40,000
50,000
60,000
70,000
80,000
2008
-09
2009
-10
2010
-11
2011
-12
2012
-13
2013
-14
2014
-15
2015
-16
2016
-17
2017
-18
2018
-19
2019
-20
2020
-21
2021
-22
2022
-23
2023
-24
2024
-25
An
nu
al D
egr
ee
Pro
du
ctio
n
Additional Cumulative Degrees Needed by 2015:
26,000
Current Projection2009-2015
Cumulative Degree Production: 281,000
Current Projection2009-2025 Cumulative Degree Production: 711,000
Annual Degree Production (Current Projection)
Required Annual Degree Production
The Big Goal

Tennessee Higher Education Commission
• Required by the CCTA
• Why important? Excellent institutions ≠ higher ed system meeting State needs
• Institutional Mission Differentiation Carnegie Classification
Academic Degree Programs by level and field
Undergraduate/graduate mix
Sub-populations
Research capacity
• Goal: avoid duplication of programs & services
• Core of outcomes funding formula
• Institutions constructed the profiles systems
endorsed THEC approved
Mission Profiles

Tennessee Higher Education Commission
Mission and Student Success
• CCTA Productivity and Efficiency: Progress
through system, institutional, and faculty
leadership
o Articulation and Transfer
Fully transferrable General Education Core
Universally transferrable 19-hour paths
o Dual Admission agreements
o Remedial/Developmental reform
o Common Course Numbering

Tennessee Higher Education Commission
Outcomes Based Formula
• Primary features:
Direct reflection of the productivity focus of the
2010-15 Public Agenda.
Outcomes rather than enrollments.
Unique weighting structure for each outcome for
each campus.
Weighted outcomes reflect institutional mission
differentiation.

Tennessee Higher Education Commission
• 30-year program; builds on indicators from existing
cycles
• Quality Assurance focused
• Accountability instrument for Master Plan
• Serves as THEC statutorily-required State
performance report for General Assembly
• Contributes to student success as the unifying goal of
Public Agenda, outcomes based funding formula, and
Performance Funding
Performance Funding

Tennessee Higher Education Commission
Performance Funding
Standard I
Quality of Student
Learning & Engagement
75%
Institutional performance measured by achievement
of student learning, program evaluation and
satisfaction studies
Standard II
Quality of Student
Access and Student
Success
25%
Institutional performance measured by achievement
of credentials earned for selected student
sub-populations
2010-15 Performance Funding Cycle Two Quality Assurance Standards

18
Tennessee Higher Education Commission
Tennessee’s Outcomes-Based
Funding Formula:
An Analysis of the First Two Years

19
Tennessee Higher Education Commission
Tennessee Finance Policy Reform
• In January 2010, Tennessee passed the
“Complete College Tennessee Act.”
• The legislation called for reforms in several
areas:
– student transfer
– research collaboration
– funding formula policy
20
Tennessee Higher Education Commission
• TN retired its enrollment based model and built
a funding formula that is entirely a function of
outcomes.
• The TN design, utilizing outcomes and an
institution-specific weighting structure, is unique
in higher education finance policy.
Funding Formula Policy

21
Tennessee Higher Education Commission
• This is not simply a reform to TN’s long-
standing Performance Funding program.
• The outcomes-based model completely replaces
the enrollment-based model.
• There is no enrollment-based allocation in TN.
TN Outcomes-Based Model

22
Tennessee Higher Education Commission
TN Funding Formula Evolution

23
Tennessee Higher Education Commission
TN Funding Formula Evolution

24
Tennessee Higher Education Commission
• Rather than counting enrollments, the TN
model simply counts outcomes such as
degrees.
• There are no state-imposed targets or pre-
determined goals.
• The outcomes are weighted to reflect
institutional mission.
TN Outcomes-Based Model

25
Tennessee Higher Education Commission
TN Outcomes-Based Formula
Outcome
Student Progression: 24 Credit Hours
Student Progression: 48 Credit Hours
Student Progression: 72 Credit Hours
Bachelors Degrees
Masters Degrees
Doctoral/Law Degrees
Research/Grant Funding
Student Transfers
Degrees per 100 FTE
Graduation Rate
Universities
26
Tennessee Higher Education Commission
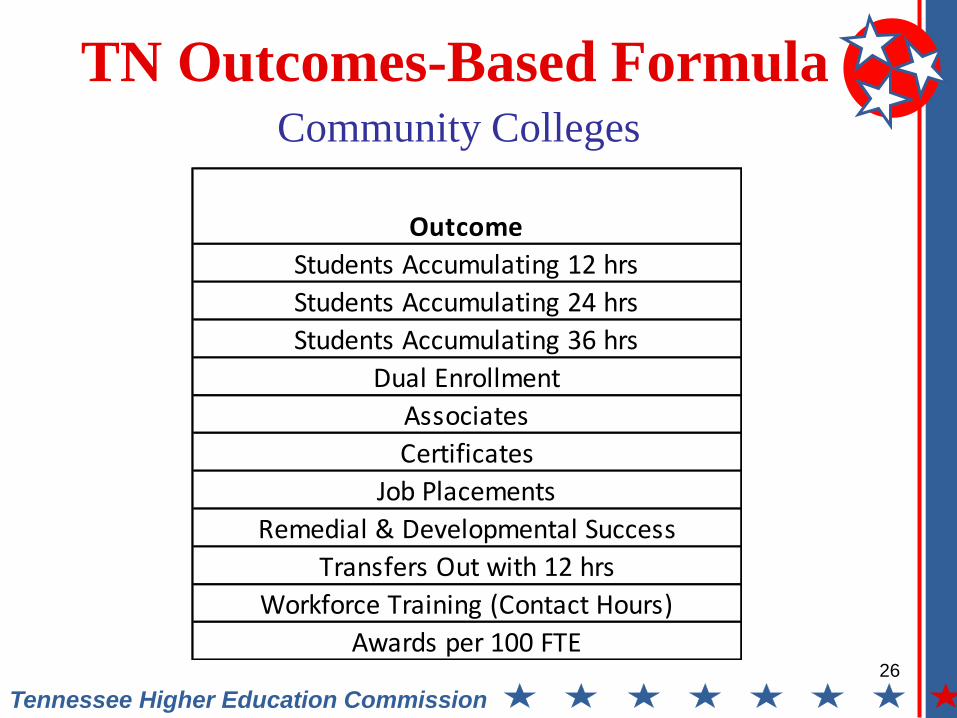
TN Outcomes-Based Formula
Outcome
Students Accumulating 12 hrs
Students Accumulating 24 hrs
Students Accumulating 36 hrs
Dual Enrollment
Associates
Certificates
Job Placements
Remedial & Developmental Success
Transfers Out with 12 hrs
Workforce Training (Contact Hours)
Awards per 100 FTE
Community Colleges

Tennessee Higher Education Commission
TN Outcomes-Based Formula
Bachelors degrees; little
research/doctoral degrees
Extensive doctoral degrees
and emphasis on research
Weights Based on Institutional Mission APSU UTM TTU UTC MTSU ETSU TSU UM UTK
Student Progression: 24 Credit Hours 3% 3% 3% 3% 3% 3% 3% 2% 2%
Student Progression: 48 Credit Hours 5% 5% 5% 5% 5% 5% 5% 3% 3%
Student Progression: 72 Credit Hours 7% 7% 7% 7% 7% 7% 7% 5% 5%
Bachelors Degrees 30% 30% 25% 25% 25% 25% 25% 25% 15%
Masters Degrees 15% 15% 15% 15% 15% 15% 15% 15% 15%
Doctoral/Law Degrees 0% 0% 5% 5% 5% 7.5% 7.5% 10% 10%
Research/Grant Funding 10% 10% 10% 10% 10% 12.5% 12.5% 12.5% 15%
Student Transfers 10% 10% 10% 10% 10% 5% 5% 5% 5%
Degrees per 100 FTE 15% 15% 10% 10% 10% 10% 10% 10% 10%
Graduation Rate 5% 5% 10% 10% 10% 10% 10% 12.5% 20%
100% 100% 100% 100% 100% 100% 100% 100% 100%

28
Tennessee Higher Education Commission
• Outcomes model utilized for 2011-12 and
2012-13 state budget cycles.
• The outcomes model is not for the
allocation of new state funding, but for all
state funding ($750 million).
• The model works with flat, increasing or
decreasing state appropriations.
TN Outcomes-Based Model

29
Tennessee Higher Education Commission
TN Outcomes-Based Formula
• All state funding is back up for grabs every
year.
• No institution is entitled to some minimal
level of appropriations that is based on
prior-year funding.
• State appropriations have to be earned
anew each year.

30
Tennessee Higher Education Commission
TN Outcomes Formula
• 100% of state appropriations are subject
to reallocation each year to reflect
productivity changes.
• The TN model is engineered such that
productivity changes generate state
appropriations changes largely within a
+/-2% range.

31
Tennessee Higher Education Commission
TN Outcomes-Based Formula

32
Tennessee Higher Education Commission
TN Outcomes-Based Formula

33
Tennessee Higher Education Commission
-4.0%
-3.0%
-2.0%
-1.0%
0.0%
1.0%
2.0%
2010-11 2011-12 2012-13
Cumulative Change in Appropriations Due to Formula
APSU
ETSU
MTSU
TSU
TTU
UM
UTC
UTK
UTM
Total Funding

34
Tennessee Higher Education Commission
Outcomes Based
Model Advantages
• The outcomes model is linked directly to the
educational attainment goals of TN’s Public
Agenda.
• The outcomes model establishes a framework for
government to have an ongoing policy discussion
with higher education.
• The model is adjustable to account for new
outcomes or a different policy focus (changing
the weights).

35
Tennessee Higher Education Commission
Outcomes Based
Model Advantages
• The structure (outcomes & weights) of the
outcomes-based model is the key innovation.
• The specific outcomes and weights that TN
chose fit our state’s context and current needs.
• Other states could adopt the general design and
decide for themselves what outcomes are
valuable and how they should be weighted to
reflect institutional mission.

36
Tennessee Higher Education Commission
TN Outcomes Formula
• Extensive information, including the
formula model, is available on the
THEC homepage.
• www.tn.gov/thec

Tennessee Higher Education Commission
Contact Information
David L Wright
Chief Policy Officer
615-509-6020
Russ Deaton
Chief Fiscal Officer
615-532-3860
www.tn.gov/thec