the components of systematic risk and their …web.usm.my/journal/aamjaf/vol...
TRANSCRIPT

AAMJAF, Vol. 11, No. 2, 151–176, 2015
© Asian Academy of Management and Penerbit Universiti Sains Malaysia, 2015
ASIAN ACADEMY of MANAGEMENT JOURNAL
of ACCOUNTING and FINANCE
THE COMPONENTS OF SYSTEMATIC RISK AND THEIR DETERMINANTS IN THE MALAYSIAN EQUITY
MARKET
Hooy Chee-Wooi1* and Robert D. Brooks2
1 School of Management, Universiti Sains Malaysia, 11800 Pulau Pinang, Malaysia
2 Department of Econometrics and Business Statistics, Monash University, 900, Dandehong Road, Caulfield East VIC 3145, Australia
*Corresponding author: [email protected]
ABSTRACT We examine the country components of world systematic risk in the context of Bursa Malaysia. World systematic risk is divided into the US, developed markets, regional markets, major trading partners, and the rest of the world. We tested market and 9 firm-characteristic-sorted portfolios, based on size, value and liquidity. Using monthly data for the 1988–2010 period, our analyses show that the US and regional factors are the most important sources of systematic risk. Tracing the time-varying betas of the US and regional factors, we find that they are driven by economic risk and financial risk, respectively. Keywords: systematic risk, time-varying beta, country risk, Malaysia, equity INTRODUCTION
Over the last several decades, Asian firms have significantly increased their international investments as the Malaysian economy has successfully integrated into the global production system. Despite the interruption of the 1997 Asian financial crisis, the performance of Malaysian firms has been outstanding compared with their counterparts in developed countries and other parts of the developing world (World Investment Report, 2006). As Asian emerging markets have developed and become increasingly integrated into the world economy, implicit and explicit investment barriers have been significantly reduced, causing firm exposure to systematic risk to increase, with increased instability over time. As Malaysia is a small and open emerging market, Malaysian firms offer a unique opportunity to study the dynamics of systematic risk exposure of firms in Asian emerging countries. According to the World Investment Report because 1995, Malaysian firms have been among the most active international investors in emerging markets, behind only firms from China and Russia in terms of value.1
Indeed, outward FDI from Malaysia has exceeded its inward flows since 2006

Hooy Chee-Wooi and Robert D. Brooks
152
(ASEAN Investment Report, 2012). Moreover, Malaysian equity markets have undergone dynamic changes over the years. As statistics from the World Federation of Exchanges show, before the 1997 Asian crisis, Malaysia's equity market was third behind Japan and Hong Kong in terms of market capitalisation, although it has dropped to 8th place since the beginning of the new millennium. The Malaysian economy also experienced a long period of capital controls and fixed exchange rates from 1998 to 2005. Thus, it would also be interesting to observe how firm systematic risk behaves under a fixed currency regime. The financial markets of Malaysia have limited depth and liquidity and are not fully integrated into the world markets. Under these conditions, systematic risk exposure of listed firms on Bursa Malaysia (known as Kuala Lumpur Stock Exchange before April 2004) cannot be fully captured by the standard asset pricing model, developed for developed market exchanges. A partial segmented asset pricing model that allows for decomposition of different sources of systematic risk is thus more appropriate. This paper aims to examine which factors represent the main sources of systematic risk for Malaysian listed firms and the main drivers of such risk. To date, the Capital Asset Pricing Model (CAPM) remains one of the most popular models in asset pricing. Within the primary framework of the CAPM, the firm is posited to be driven by common systematic risk. Although this is not empirically realistic, this single index setting has been quite popular, as it reduces a large multivariate process to one of lower dimension.2 To cater to the limitations of the single-factor model, many types of multifactor models have been proposed in the literature. Much focus has been placed on macroeconomic variables, such as the exchange rate (see Adler & Dumas, 1983; Dumas & Solnik, 1995; Lin, 2011), interest rates (see Flannery & James, 1984; Flannery, Hameed and Harjes, 1997), and multiple global economic fundamentals (see Ferson & Harvey, 1993; 1994). On the other hand, more microeconomically oriented studies have focused on fundamental firm characteristics, including size and value (see Fama-French, 1996), momentum (see Jegadeesh & Titman, 1993), liquidity (see Amihud & Mendelson, 1986) and idiosyncratic risk (see Bali & Cakici, 2010). An international version of the CAPM and some of its variations has also been proposed; see, for example, the International CAPM (ICAPM) of Stehle (1977) and the international version of the firm factors of Fama and French (1998). In an international setting, another line of research has focused on multi-country models. A multi-country model basically decomposes world systematic risk into various sub-systematic risks. For example, Brooks and Del Negro (2005) decompose systematic risk into regional, country and industry components; Bekaert, Harvey and Ng (2005) and Bekaert, Hodrick and Zhang (2009) decompose systematic risk into world and regional components; while

Components of Systematic Risk & Determinant in Malaysia
153
Heaney and Hooper (1999), Adler and Qi (2003) and Hooy and Goh (2010) decompose systematic risk into world and economic or trading bloc components.
Our study is divided into two sections. In the first section, we follow the multi-country approach to decomposing world systematic risk for Malaysia into five sub-groupings, i.e., the US market, developed markets, regional markets, major trading partners, and the rest-of-the-world. This decomposition enables us to determine which component of systematic risk has had the strongest influence on Malaysian firms. Our empirical evidence for the Malaysian market portfolio shows that the US and the regional factors are the most important sources of systematic risk for Malaysian firms, consistent with the findings of most multi-country analysis in the literature. In the second section, we examine the time-varying betas of the US and regional factors and find that the dynamics of these two sources of systematic risk can be explained by the financial crises that occurred over the last two decades. We then examine possible determinants of the US and regional factors, using country risk ratings to determine whether political, economic or financial risk of the respective factors affects their systematic risk dynamics.
DECOMPOSITION OF SYSTEMATIC RISK We first examine the systematic risk of the Malaysian market portfolio under a single-factor International Asset Pricing Model, based on Stehle (1977):
,,, tMtWWtM err ++= βα (1)
Where FttMtM RRr −= ,, and tFtWtW RRr ,,, −= are the market and world excess returns over the risk free asset (proxied by the US 3-month treasury bill rate) at time period t. The coefficient Wβ is a constant parameter equal to
[ ])var(/),cov( ,,, tWtWtM rrr . Applying Model (1) to the Malaysian market portfolio assumes that the Malaysian market is fully integrated into the world market, such that the return on the Malaysian market portfolio is systematically related to the world market premium. We shall call this setting the World CAPM (WCAPM).
Because the world portfolio is a comprehensive information measure, we decompose systematic risk into five components and examine Malaysian market exposure to these five sub-components. Our decomposition yields the following:
( ), , , ,W US DM RG TP RWr r r r r r= (2)

Hooy Chee-Wooi and Robert D. Brooks
154
where USr , DMr , RGr , TPr , RWr are the portfolio excess returns for the US market, developed markets, regional markets, trading-partner stock markets and the rest-of-the-world markets. Thus, our general empirical model is given by the following equation:
, , , , , , ,1 2 3 4 5 M t US t DM t RG t TP t RW t i tr r r r r r eα β β β β β= + + + + + + (3)
where rM,t is the Malaysian market portfolio excess return, and all five
explanatory factors are sub-components of the world portfolio excess return. The market index, KLCI, is employed to proxy for the Malaysian market portfolio. We test several different settings, from two factors to five factors, adding one factor at a time to determine whether the factor loadings and their significance levels are sensitive to different settings.
The first component is the US factor. The US market is taken as a stand-alone component, given the undisputed role of the US market as the world financial centre over the last several decades. Indeed, mainstream research in almost all finance areas is based on the US market. Because the US market is used to proxy for the world portfolio, in the remainder of the paper, we refer to the one-factor (US) model as the International CAPM (ICAPM).
We take as our second factor the influence of other developed markets. In
the literature, some studies use the G7 countries to proxy for the world factor; as we have designated the US as a single factor, we identify five of the remaining G7 countries, namely, Canada, France, Germany, Italy and the UK, together with Spain, Australia and Switzerland, as a group. Spain, Australia and Switzerland are ranked 7th, 11th, and 13th, respectively, in the world ranking of stock markets in terms of size, the highest rankings for developed markets after the G7 countries (World Federation of Exchanges, 2009). Japan (a G7 member) is designated to represent another factor, namely, that of a major Malaysian trading partner, as discussed below. We form a size-weighted portfolio for these 8 markets and refer to this factor as the developed-market (DM) factor.
Our third component is the regional (Asian) factor, covering neighbouring markets that share with Malaysia a similar business and risk profile. In addition to being geographically close, these markets engage in substantial trade and have strong cultural links with Malaysia. On the other hand, these attributes have made these markets competitors with Malaysia to attract foreign capital. If these markets can offer relatively better investment opportunities and incentives, the attractiveness of Malaysia will erode. The list of regional markets

Components of Systematic Risk & Determinant in Malaysia
155
includes other ASEAN countries, i.e., Indonesia, the Philippines, and Thailand, well-known as industrial competitors of Malaysia, and other more advanced East Asia markets such as Hong Kong, South Korea and Taiwan. Singapore and Japan are excluded from this factor because they are included in the trading partner factor. We construct a 6-country portfolio, weighted by the sizes of countries' equity markets, which we call the regional-market factor (RG).
Chen and Zhang (1997), Van Rijckeghem and Weder (2001), and Dumas,
Harvey and Ruiz (2003) have highlighted the influence of the real sector on country systematic risk. As Malaysia is a small and open economy, we wish to determine whether the Malaysian stock market has significant exposure to the market performances of her major trading partners. As can be seen in Figure 1, over the last two decades, Malaysia has had more than a 10% annual trade share with her top three counterparts, i.e., Singapore, the US, and Japan. With respect to the others, Malaysia's trade shares have been well below 6%, except for China after 2007, with China emerging as Malaysia's second largest trading partner behind Singapore after 2009. These four countries consistently account for approximately 50% of Malaysia's total trade with more than 200 countries around the world. Because the US effect has been removed as a stand-alone component, we form a trade-weighted average portfolio involving only Singapore, Japan and the Chinese mainland. We shall henceforth call this the trade-partner (TP) factor.
Figure 1. Trade pattern of Malaysia 2010 top 10 trade partners (% of world trade). The monthly data are obtained from Direction of Trade Statistics, International Monetary
Fund, IMF (http://elibrary-data.imf.org/DataExplorer.aspx).
In addition to the above factors, we have added a buffer component called the rest-of-the-world (RW) factor. This factor contains the remaining stock markets, i.e., those not included among any of the above four factors. As the world portfolio consists of 45 markets (MSCI All Country World Index), this

Hooy Chee-Wooi and Robert D. Brooks
156
portfolio covers the remaining 27 markets [45 − 1(US) − 8(DM) – 6(RG) – 3(TP)] listed in the MSCI.
In our analysis, we use monthly data covering the period from January
1988 to June 2010. We collected the total return series (RI) from MSCI, while the market weights (market values) were obtained from DataStream. Trade series were taken from Direction of Trade Statistics of the International Monetary Fund (IMF), and the risk free rate is proxied by the US 3-month Treasury bill rate. THE ISSUE OF ORTHOGONALITY One empirical issue involved in estimating the above model is the orthogonality of the decomposed factors. Given the dominance of the US economy at the global level, the US factor should be highly correlated with the other four factors. This issue is not specifically addressed in previous literature, e.g., studies of Bekaert et al. (2005), Adler and Qi (2003) and Heaney and Hooper (1999). Following Stehle (1977) and Jorion and Schwartz (1986), we orthogonalise each factor from the US portfolio and use the orthogonalised series to replace the original series to avoid multicollinearity.3 We only consider the US factor, as it is assumed to be the only factor common to all countries. First, we run the following regression to orthogonalise the US factor with respect to all other countries in their respective portfolios:
, , , DM DMi t US t i tr br e= +
, , , RG RGi t US t i tr br e= +
, , , TPi t US t i tTPr br e= +
We then used value-weighted methods to form the component portfolios:
∑=i
DMti
DMtitDM ewr ,,,
∑=i
RGti
RGtitRG ewr ,,,
∑=i
TPti
TPtitTP ewr ,,,
where DM
tiw , and RGtiw , are the size-weighted ratios (measured by market
capitalisation) of market i in each portfolio, respectively, and TPtiw , is the trade-
weighted ratio of market i in Malaysia's total trade. Finally, we regressed the

Components of Systematic Risk & Determinant in Malaysia
157
above orthogonalised portfolios on the world portfolio (MSCI ALL Country Index) and used the residual terms to represent the rest-of-the-world portfolio ( tRWr , = tRWe , ):
Let us examine the explanatory power of the orthogonal factor versus the non-orthogonal factor in explaining Malaysian stock market returns in Table 1. To gain insight into how each factor was influenced by the US factor, we estimated a simple regression of each factor on the Malaysian market portfolio. R2 values are reported in the "Orthogonal" column. It is clear that the explanatory power of each factor drops significantly after the US influence is removed. The most significant drop in R2 occurs with the DM factor, from 18.47% to 4.69%. This implies that the developed markets are highly exposed to the US market. After discounting the US effect, the net influence of the orthogonal DM factor is only 4%, while the US market alone can explain approximately 14% of the variation in KLCI. Interestingly, the orthogonal RG factor and TP factor still account for approximately 30% and 20% of the variation in the Malaysian market portfolio, respectively. This implies that the Malaysian market has high exposure to the regional markets as well as to those of its major trading partners. The result is consistent even when GARCH modelling is employed. As a result, we employed the orthogonalised factors in our estimations.
Table 1 Explanatory power (R2) of non-orthogonal versus orthogonal factors (in %)
OLS
GARCH
Non-
orthogonal Orthogonal Changes Non-orthogonal Orthogonal Changes
US 14.20
13.37
DM 18.47 4.69 –74.61 17.82 4.14 –76.78
RG 42.33 29.88 –29.40 40.86 28.18 –31.04
TP 32.92 21.92 –33.40 31.78 18.53 –41.69
EMPIRICAL ESTIMATES OF THE DECOMPOSITION MODEL Table 2 reports the summary of the descriptive statistics and the correlation structure of our series. We observe that the Malaysian market portfolio is quite volatile compared with the other series; given that the other series are all for internationally weighted portfolios, some diversification effect applies, reducing their volatility. Excluding the RW portfolio, the DM portfolio is the most stable
, 1 , 2 , 3 , 4 , , World t US t DM t RG t TP t RW tr b r b r b r b r e= + + + +

Hooy Chee-Wooi and Robert D. Brooks
158
portfolio, while the RG portfolio is the most volatile. As these portfolios represent developed and emerging markets, respectively, this is consistent with expectations of the behaviour of volatility. The RW factor does not offer much in the way of diversification opportunities to international investors compared with the East Asian countries in the RG portfolio. The Malaysian market portfolio also exhibits high leptokurtosis, and thus, a GARCH model could be helpful in modelling. Table 2 Descriptive statistics and correlation matrix
Malaysia World US DM RG TP RW
Panel A: Descriptive statistics
Mean 0.6595 0.5401 0.7135 0.0878 –0.1012 –0.0984 –0.0549 Maximum 40.5781 11.2401 10.8189 7.6034 24.0116 13.2369 2.4317 Minimum –35.9522 –22.0530 –18.7554 –8.4720 –27.2879 –13.1918 –2.5558
Stdev 8.5086 4.5458 4.3396 2.9595 5.8584 4.5590 0.6204 Skewness –0.2589 –0.9189 –0.8101 –0.1971 –0.0408 –0.0504 0.1842
Kurtosis 7.0284 5.3876 4.6512 3.2346 5.4713 3.2926 5.3251 Normality 184.8937 101.7530 59.9827 2.3586 61.9056 0.8378 48.4885
(0.0000)*
(0.0000)* (0.0000)* (0.3075) (0.0000)* (0.6578)
(0.0000)*
Observation 269 269 269 269 243 210 210
Panel B: Correlation matrix
Malaysia 1.0000
World 0.4475 1.0000
US 0.3535 0.9310 1.0000
DM 0.2389 0.3439 0.0439 1.0000
RG 0.5864 0.2513 0.0724 0.3424 1.0000
TP 0.4650 0.2893 0.0332 0.3989 0.7092 1.0000
RW –0.0175 0.1468 0.0115 0.0061 0.0017 –0.0019 1.0000
Note: Figures in parentheses are probabilities; Stdev is the standard deviation; the normality test is the Jarque-Bera test. * denote significance at the 1% level.
Next, we turn to the estimation of the decomposed model, with different value-weighted component portfolios. As shown in Table 3, we first test a one-factor model, using the world portfolio; we then test another one-factor model, using the US portfolio. The adjusted R2 of the WCAPM is approximately 21%. With the US factor, the adjusted R2 drops to only 13%. However, when the RW factor is added, the adjusted R2 of the model rebounds to 21%, the same level as with the WCAPM. When more factors are added, the adjusted R2 values obtained

Components of Systematic Risk & Determinant in Malaysia
159
are actually higher than for the WCAPM. This result is as expected when the added orthogonalised factors (from the US) are included in the WCAPM.
When we add the DM factor, R2 remains 21%, but the adjusted R2
drops to 19%. Clearly, the orthogonal DM factor does not add any value. Interestingly, when we include the RG factor, both R2 and adjusted R2 increase to 40%, and the DM and RW factors become statistically insignificant. The coefficient of the RG factor (0.6114) is also higher than the US factor (0.5874). When the TP factor is added, the coefficient of the RG factor rises still more (0.6596), and the coefficient of the US factor drops (0.5555), but only the US and RG factors are statistically significant, with adjusted R2 rising to 42.70%. We thus conclude that in the world portfolio, only the US and regional factors are important.
We further examine whether our decomposition approach is affected by
different characteristics of firms. Among the list of important firm characteristic reported in the asset pricing literature, we give priority to three popular characteristics; size (market value), value (book-to-market) and liquidity (trading volume). We construct three equal weighted portfolios based on each of the three firm characteristics. In total, we have nine characteristic-sorted portfolios. Our sorting procedure is as follow: first, we rank all firms based on firm characteristic values; we then divide them into three groups at the 33.3% and 66.67% percentiles of the total cumulative characteristics values and form nine stock return portfolios, using an equal weighted method. This means that each of the groups might not have the same number of firms. We take this approach instead of equally dividing the firms into three groups. We then repeat the above procedure for every 5-year window. The number of firms for each of the 5-year rebalanced characteristic-sorted portfolios over our 20-year sample period is tabulated in Table 4. The summary of the descriptive statistics of these nine portfolios is reported in Table 5. In essence, the average returns of these portfolios are not consistent with their characteristics, except for the value portfolio where the portfolio returns drop as the portfolio value increases. For size and liquidity, we observe that the medium portfolios offer the highest returns, followed by the large and liquid portfolios, respectively. However, the standard deviation of the portfolios is fairly consistent across characteristics; smaller size, higher value, and more liquid portfolios are all more volatile. One interesting observation in Table 5 is that size portfolios and value portfolios are highly correlated, but liquidity portfolios have a very low correlation with both size and value portfolios.

Hooy Chee-Wooi and Robert D. Brooks
160
Table 3 Decomposition pricing of Bursa Malaysia aggregate market index
World CAPM1
International CAPM
2-factor International
CAPM
3-factor International
CAPM
4-factor International
CAPM
5-factor International
CAPM
Constant 0.6078 (0.0644)*
0.6531 (0.0775)*
0.8819 (0.0056)***
0.9642 (0.0039)***
0.5070 (0.0983)*
0.0468 (0.8904)
US 0.7340 (0.0000)***
0.6188 (0.0000)***
0.6156 (0.0000)***
0.6192 (0.0000)***
0.5880 (0.0000)***
0.5672 (0.0000)***
DM 0.5709 (0.0000)***
0.1333 (0.2567)
0.0790 (0.5311)
RG 0.6093 (0.0000)***
0.6656 (0.0000)***
TP 0.1094 (0.3369)
RW 0.9407 (0.0000)***
0.7609 (0.0011)***
0.1335 (0.5777)
–1.1673 (0.0035)***
Constant Variance
2.3017 (0.0080)****
2.9759 (0.0086)***
2.1072 (0.0195)**
2.0232 (0.0233)**
1.4629 (0.0796)*
1.4707 (0.0786)*
ARCH 0.2288 (0.0000)***
0.2095 (0.0003)***
0.2470 (0.0000)***
0.2429 (0.0000)***
0.1933 (0.0001)***
0.2613 (0.0001)***
GARCH 0.7258 (0.0000)***
0.7344 (0.0000)***
0.7159 (0.0000)***
0.7217 (0.0000)***
0.7685 (0.0000)***
0.7163 (0.0000)***
R2 0.2061 0.1337 0.2127 0.2121 0.4117 0.4315 Adj R2 0.2032 0.1305 0.2068 0.2032 0.4018 0.4176
LogL –864.5228 –881.0087 –863.0953 –862.9173 –755.5255 –649.9449 AIC 6.4649 6.5874 6.4617 6.4678 6.2842 6.2757
SBC 6.5317 6.6542 6.5419 6.5613 6.3992 6.4191 Q(12) 12.4030
(0.4140)* 11.4100 (0.4940)
13.5680 (0.3290)
14.2230 (0.2870)
19.0600 (0.0870)*
17.4020 (0.1350)
Q(24) 31.4020 (0.1430)*
33.2510 (0.0990)*
32.3400 (0.1190)
33.1120 (0.1020)
33.2730 (0.0980)*
28.2830 (0.2480)
Q2 (12) 12.9170 (0.3750)*
11.8860 (0.4550)
10.9490 (0.5330)
9.6835 (0.6440)
16.1870 (0.1830)
13.3290 (0.3460)
Q2 (24) 23.0850 (0.5150)*
24.1030 (0.4560)
20.1630 (0.6870)
18.8270 (0.7610)
23.2380 (0.5060)
16.5930 (0.8650)
Note: 1For the World CAPM, instead of the US factor, the MSCI All-Country world portfolio is used. *,**,*** denote significance at the 10%, 5% and 1% levels, respectively. LogL is the log-likelihood functions value, while AIC and SC denote the Akaike and Schwarz values, respectively. Q(12), Q(24), Q2(12) and Q2(24) are the Box Pierce portmanteau test statistics applied to the standardised residuals and squared standardised residuals for lag 12 (1 year) and lag 24 (2 years). Figures in parentheses are probabilities.
Components of Systematic Risk & Determinant in Malaysia
161
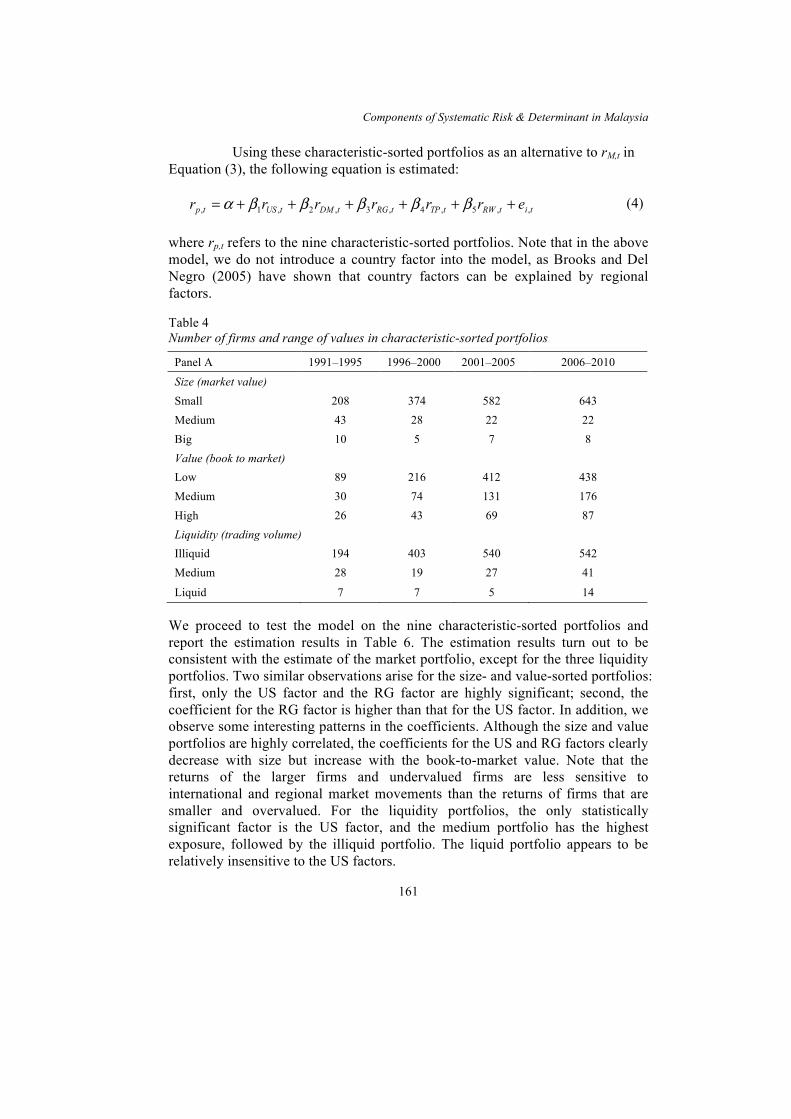
Using these characteristic-sorted portfolios as an alternative to rM,t in Equation (3), the following equation is estimated:
,,5,4,3,2,1, titRWtTPtRGtDMtUStp errrrrr ++++++= βββββα (4)
where rp,t refers to the nine characteristic-sorted portfolios. Note that in the above model, we do not introduce a country factor into the model, as Brooks and Del Negro (2005) have shown that country factors can be explained by regional factors. Table 4 Number of firms and range of values in characteristic-sorted portfolios
Panel A 1991–1995 1996–2000 2001–2005 2006–2010
Size (market value) Small 208 374 582 643 Medium 43 28 22 22 Big 10 5 7 8 Value (book to market) Low 89 216 412 438 Medium 30 74 131 176 High 26 43 69 87 Liquidity (trading volume) Illiquid 194 403 540 542 Medium 28 19 27 41
Liquid 7 7 5 14 We proceed to test the model on the nine characteristic-sorted portfolios and report the estimation results in Table 6. The estimation results turn out to be consistent with the estimate of the market portfolio, except for the three liquidity portfolios. Two similar observations arise for the size- and value-sorted portfolios: first, only the US factor and the RG factor are highly significant; second, the coefficient for the RG factor is higher than that for the US factor. In addition, we observe some interesting patterns in the coefficients. Although the size and value portfolios are highly correlated, the coefficients for the US and RG factors clearly decrease with size but increase with the book-to-market value. Note that the returns of the larger firms and undervalued firms are less sensitive to international and regional market movements than the returns of firms that are smaller and overvalued. For the liquidity portfolios, the only statistically significant factor is the US factor, and the medium portfolio has the highest exposure, followed by the illiquid portfolio. The liquid portfolio appears to be relatively insensitive to the US factors.

Hooy Chee-Wooi and Robert D. Brooks
162

Components of Systematic Risk & Determinant in Malaysia
163

Hooy Chee-Wooi and Robert D. Brooks
164
ESTIMATING THE TIME-VARYING US AND REGIONAL SYSTEMATIC RISKS AND THEIR DETERMINANTS The Two-Factor Model In the final section, we present evidence that only two components of the world portfolio, the US factor and the regional factors, are statistically significant in explaining the Malaysian market portfolio and firm-characteristic portfolios sorted by firm size, firm value and firm liquidity. This is consistent with the country-decomposition literature. In this section, we take the further step of tracing the dynamics of each of these two factors in driving Malaysian stock market performance. We aim to track the time-varying dynamics of the factor loadings and their relative influences. For this purpose, we estimate a 2-factor version of Equation (3):
,,,,, ttRGtRGtUStUStMY errr +++= ββα (5) The parameter estimates for the above 2-factor model in the static version are:
, , ,
2 2
0.5970( )+0.6631 ( )
0.4138 0.4089MY t US t RG tr r r
R Adj R
α= +
= =
Note that with two factors, the explanatory power of the model has achieved 40%, very close to the 5-factor model reported in Table 3. This shows that the other 3 factors (DM, TP and RW) do not add significant explanatory power to variations in Malaysian equities, justifying our focus on the 2-factor model.
It is possible that the factor loadings vary over different phases of the business cycle (see Bos and Newbold, 1984; Riddick, 1992; Brooks, Faff and Lee, 1992; Faff, Lee and Fry, 1992; and, more recently, Koutmos and Knif, 2002, and Yao and Gao, 2004, for evidence of time varying systematic risk). Over the last two decades, there were some episodes of financial turbulence in the world stock market. The 1997 Asian financial crisis, the 2001 collapse of the dotcom bubble, and the 2007/08 subprime crisis are amongst the most notable episodes of turbulence. Moreover, the Malaysian economy underwent some structural changes during this period. From January to December 1994, Malaysia implemented a short period of monetary and capital controls, aiming to restrict short-term capital inflows amid rising inflationary pressures. In September 1998, Malaysia implemented broader based capital controls to prevent capital outflows, de-internationalised ringgit exchange rates, and pegged the ringgit at

Components of Systematic Risk & Determinant in Malaysia
165
USD3.8/RM to offset the growing threat of the 1997 Asian financial crisis. The ringgit was only de-pegged in July 2005. An examination of time-varying loadings allows us to determine whether exposure of Malaysian firms to the US factor and the regional factor show any pattern of exposure to these structural changes. Time-Varying Systematic Risk in a 2-Factor Model We specify time-varying parameters in the form of conditional betas, following the equations in Roll (1977, p. 167). We adopt the equations and reset them to estimate the time-varying betas in our 2-factor model in equation (4), using the following setting:
cov( , ) var( ) cov( , ) cov( , )1 1 1 1ˆ, var( ) var( ) cov( , )1 1 1
r r r r r r rMYt MYtUSt t RGt t RGt t USt RGt tUS t r r r rUSt t RGt t USt RGt tβ
Ω Ω − Ω Ω− − − −=Ω Ω − Ω− − −
(6)
cov( , ) var( ) cov( , ) cov( , )1 1 1 1ˆ
, var( ) var( ) cov( , )1 1 1
r r r r r r rMYt MYtRGt t USt t USt t USt RGt tRG t r r r rUSt t RGt t USt RGt t
βΩ Ω − Ω Ω− − − −=
Ω Ω − Ω− − − (7)
where tUS ,β̂ and tRG,β̂ measure exposure to the systematic world factor and the systematic regional factor, respectively. Based on Equations (6) and (7), dynamic time-varying factor loadings can be obtained once we have the conditional variance-covariance series, which can be formulated in a multivariate model setting. We employ the CCC-GARCH multivariate model for this purpose.4
In Figure 2, we do not observe total dominance of the regional factor over the US factor, although the two factors move together very closely. In general, the regional beta was dominant in the Malaysian stock market during the boom period until capital controls were imposed in September 1998. This is the period of the so-called Asian miracle, which resulted from liberalisation in the early 1990s.5 The US factor, which was quite significant before and during the ERM crisis and during the early months of the 1997 Asian financial crisis, started to become dominant in the Malaysian stock market portfolio with the pegging of the RM to the USD from September 1998 to July 2005. However, beginning with the de-pegging of the RM in July 2005, the dominance of the US factor became ambiguous. In fact, the US factor appears to have lost its influence on the Malaysian market since late 2003.6 The inception of the US subprime mortgage crisis in early 2008 again found the US factor becoming dominant over the Malaysian market.7

Hooy Chee-Wooi and Robert D. Brooks
166
0.0
0.4
0.8
1.2
1.6
2.0
2.4
88 90 92 94 96 98 00 02 04 06 08 10
Dec94Tequilacrisis
July97Asiancrisis
Mar08Subprimecrisis
Sep92ERMcrisis
Mar00dot-combubbleburst
Aug98Russiancrisis
Sep01911attack
Capital ControlJan-Aug94
Capital ControlSep98-Jul05
Figure 2. Plotting of the time-varying betas for the market portfolios. Plotting is from
April 1990 to June 2010. The back line is US systematic risk, while the red bolded line is RG systematic risk.
We also estimated the time-varying betas of the 2-factor model for the
nine characteristic-sorted portfolios. Graphs are presented in Figure 3. Generally, the patterns of the graphs in Figure 3 are all quite consistent with the market portfolio plotted in Figure 2: First, the regional factor dominates over the US factor after the September 1992 ECM crisis through the September 1998 fixed exchange rate regime; second, the US factor becomes dominant over the USD pegging regime as well as after the inception of the US subprime mortgage crisis in March 2008. Unlike the market portfolio, we observe that the rise of the regional factor in the period from mid-2005 (USD de-pegging) to early 2008 occurs in the medium size portfolio only. In addition, the medium size portfolio exhibits the highest response to the regional factor during the first capital control period in 1994. This result implies that such firms might be more exposed to the regional factor than other firms, leading to an increase in the impact of the regional factor on the market portfolio, as depicted in Figure 2.

Components of Systematic Risk & Determinant in Malaysia
167
0.0
0.5
1.0
1.5
2.0
2.5
1988 1990 1992 1994 1996 1998 2000 2002 2004 2006 2008 20100.0
0.5
1.0
1.5
2.0
2.5
1988 1990 1992 1994 1996 1998 2000 2002 2004 2006 2008 20100.0
0.5
1.0
1.5
2.0
2.5
1988 1990 1992 1994 1996 1998 2000 2002 2004 2006 2008 2010
0.0
0.5
1.0
1.5
2.0
2.5
1988 1990 1992 1994 1996 1998 2000 2002 2004 2006 2008 20100.0
0.5
1.0
1.5
2.0
2.5
1988 1990 1992 1994 1996 1998 2000 2002 2004 2006 2008 20100.0
0.5
1.0
1.5
2.0
2.5
1988 1990 1992 1994 1996 1998 2000 2002 2004 2006 2008 2010
0.0
0.5
1.0
1.5
2.0
2.5
1988 1990 1992 1994 1996 1998 2000 2002 2004 2006 2008 20100.0
0.5
1.0
1.5
2.0
2.5
1988 1990 1992 1994 1996 1998 2000 2002 2004 2006 2008 20100.0
0.5
1.0
1.5
2.0
2.5
1988 1990 1992 1994 1996 1998 2000 2002 2004 2006 2008 2010
ValueSize Liquidity
Big /High /Liquid
Medium
Small /Low /Illiquid
Figure 3. Plotting of the time-varying betas for the characteristic-sorted portfolios. Plotting is from April 1990 to June 2010. The back line is US systematic risk, while the
red bolded line is RG systematic risk. The Determinants of Time-Varying Systematic Risks Our purpose in tracing the time-varying US and regional components of systematic risk faced by Malaysian firms is to examine possible driving forces behind these exposures. Since the establishment of the concept of systematic risk by Sharpe (1964) and others, many scholars have attempted to explain the determinants of systematic risk. Early literature in this vein focused on the role of market versus accounting variables in explaining systematic risk exposure; see, for example, Beaver and Manegold (1975) and Bowman (1979). The accounting fundamentals that explain firm static systematic risk are found to be financial leverage, earnings variability, growth, and cyclical factors; see the survey of Ryan (1997). Most of these fundamentals are also found to drive the conditional beta in an international dataset (see Ferson and Harvey, 1997). However, unlike the accounting literature, there is no consensus in the macroeconomic literature regarding systematic risk determinants; see, for example, Robichek and Cohn (1974), Bos and Newbold (1984) and Abell and Krueger (1989). More recent work, addressing the issue from a country risk perspective rather than a systematic risk perspective, focuses on the unanticipated component of macroeconomic factors (the unanticipated component in ARIMA modelling of the variables) as a possible explanation of time-varying country (systematic) risk. Gangemi, Brooks and Faff (2000), for example, relate the conditional betas from

Hooy Chee-Wooi and Robert D. Brooks
168
the WCAPM as a measure of time-varying country risk of the Australian market to a list of business cycle variables, but their results show that only exchange rate surprises are statistically significant. Goldberg and Veitch (2002) also document that exchange rate surprises in Brazil and Mexico matter for variations in Argentina's conditional beta. Verma and Soydemir (2006) extend the analysis to four Latin markets, reporting a consistent result; they find that local exchange rate surprises affect Brazil and Mexico, and money supply surprises affect all four markets except Argentina, while external surprises in the G7's real interest rate and inflation also affect the conditional betas of all four Latin markets. More recently, Marshall, Maulana and Tang (2009), examining the same issue using a panel analysis of 20 emerging markets, find that local interest rates, local inflation and US interest rates are significant determinants of time-varying betas.
As highlighted in the literature, the world beta, estimated using the WCAPM applied to a country portfolio, is a measure of country risk. In this study, as we have decomposed Malaysia's world systematic risk into two country components, we shall relate the two country components of systematic risk or so-called country risk to the rating of country risk reported by the International Country Risk Guide (ICRG). Erb, Harvey and Viskanta (1996a; 1996b) show that the ICRG country risk indexes are correlated with beta, future equity returns and equity valuation measures, while Diamonte, Liew and Stevens (1996) and Bilson, Brailsford and Hooper (2002) find that ICRG can explain return variation in emerging markets very well. Moreover, Oetzel et al. (2001), comparing four different country risk measures (Investor, Euromoney, ICRG and PRS), conclude that ICRG performed the best in predicting actual realised risks reflected in currency instability, a proxy for the financial crisis. Here, we would like to examine how well the relevant ICRG rating can explain the time-varying US and regional systematic risk (country risk) that we have extracted.
In Table 7, we tabulate the three ICRG indexes and their sub-components
for Malaysia, the US and the RG factor (average over the six countries), namely, the political risk index (PR), economic risk index (ER), and financial risk index (FR). For political risk, it is clear that the US has the lowest risk among the three except with respect to External Conflict (due to involvement in several external wars). For Economic Risk, the US is riskier in Real GDP Growth (developed nations have relatively slow growth) and the Current Account as a Percentage of GDP (the US has had a deficit profile for over a decade). With respect to Financial Risk, the US clearly differs from its emerging economy counterparts, as the US has lower scores in all five items except Foreign Debt as a Percentage of GDP. Relative to Malaysia and the US, the regional RG factor scores lower in several Political Risk indicators as well as Annual Inflation under Economic Risk and Exchange Rate Stability under Financial Risk.

Components of Systematic Risk & Determinant in Malaysia
169
Table 7 Average ICRG monthly risk indexes and their components for 1990–2010
Factor Malaysia Regional US Political Risk
1. Government stability 9.5742 8.3649 9.2527 2. Socioeconomic conditions 8.3049 6.9625 8.7363 3. Investment profile 8.2830 8.6873 10.7473 4. Internal conflict 10.5440 9.5531 10.5769 5. External conflict 10.5220 9.9440 8.4396 6. Corruption 2.9313 2.7253 4.2253 7. Military in politics 5.0000 3.7289 5.0000 8. Religious tensions 4.0000 4.3672 5.5907 9. Law and order 3.9066 3.9332 5.4588 10. Ethnic tensions 4.2143 4.5009 4.9780 11. Democratic accountability 3.4396 4.4359 5.8434 12. Bureaucracy quality 2.9560 2.7262 4.0000
Economic Risk 1. GDP per head 2.3868 2.4614 4.7203 2. Real GDP growth 7.9418 7.5318 7.3670 3. Annual inflation rate 9.1978 8.7564 9.4478 4. Budget balance 5.9555 6.7342 6.5951 5. Current account as a percentage of GDP 13.1830 12.1936 10.1736
Financial Risk 1. Foreign debt as a percentage of GDP 6.3901 6.7262 7.7720 2. Foreign debt service as a percentage of exports of
goods and services 9.6648 8.9066 7.6016
3. Current account as a percentage of exports of goods and services 12.6593 12.4661 9.4615
4. Net international liquidity as months of import cover 2.9259 2.7426 1.0130 5. Exchange rate stability 9.1703 8.9016 9.1648
Note: Higher scores in every index reflect lower risk. The scores of each sub-component reflect the contribution (weight) of each sub-component in formulating the three indexes.
We relate both the systematic risks to the logarithm of the composite level of political risk, economic risk and financial risk, as shown in the following equations:
, , 1 1 , 2 , 3 , ,ˆ ˆ log( ) log( ) log( ) RG t RG t RG t US t US t i tPolR EconR FinR eβ α β δ δ δ−= + + + + + (8)
)log()log()log(ˆˆ,,3,2,11,, titRGtRGtRGtRGtRG eFinREconRPolR +++++= − δδδβαβ
(9)

Hooy Chee-Wooi and Robert D. Brooks
170

Components of Systematic Risk & Determinant in Malaysia
171
The estimates for Models (8) and (9) are reported in Table 8 and Table 9, respectively. Note that we have estimated the country risk exposure for both the aggregate market portfolio and the 9 firm portfolios in both tables.
We make two observations on the modelling before turning to the
estimates of the country risk ratings. First, the persistency of the mean and variance for both systematic risks is well captured by the autoregressive and GARCH terms in the mean and variance processes, respectively. For US systematic risk, we find that a Threshold GARCH (TGARCH) model can well describe the variance process, where the variance parameters are highly significant, and the asymmetric term is significant with a leverage effect (the asymmetric coefficient is negative). For RG systematic risk, a GARCH(1,1) model is sufficiently well fitted, and the GARCH process (sum of ARCH and GARCH) is not explosive, except for the illiquid portfolio. Both models pass the diagnostic Q and Q2 tests except in several cases, but the latter results are not highly statistically significant. Second, the explanatory power of both models is reasonably high. The adjusted R2 for the model of RG systematic risk is approximately 76% on average. For the US systematic risk model, the adjusted R2 is only approximately 69% but with wider variations across different firm portfolios.
Our results show, consistently across all portfolio regressions except
those for the normal and liquid portfolios, that systematic risk arising from exposure to the US market is significantly associated with US Economic Risk. The high-value and small-size portfolios have the highest associations with Economic Risk in the respective characteristic-sorted portfolios, while the illiquid portfolio exhibits a very small sensitivity to the US factor. Political Risk is not significant at the aggregate level but is significant with respect to the three value portfolios and the small-size portfolio, with high-value and low-value portfolios having very high exposure to Political Risk. Financial Risk is not statistically significant with respect to US systematic risk.
On the other hand, RG systematic risk is shown to be associated only
with the region's average Financial Risk, with the largest and most statistically significant association for the average-size portfolio, followed by the large-size portfolio. RG systematic risk for both the normal and liquid portfolios also shows significant exposure to Financial Risk, although the coefficients are relatively small.
Note that the estimated coefficients for the country risk indexes are all
positive. Given that a higher country risk rating implies a lower country risk level, the positive coefficients indicate that lower US economic risk and lower regional financial risk will induce increased systematic risk exposure to the US and

Hooy Chee-Wooi and Robert D. Brooks
172
regional factors, respectively. At first glance, this may seem counterintuitive. One possible explanation is that the Malaysian stock market tends to be more inward-looking (hence exhibit lower systematic risk) when political, financial and/or economic risks of US and regional markets are rising. When external market conditions are improving, the Malaysian stock market becomes less insulated and more exposed. We can say that the Malaysian market is, in a sense, becoming more globally integrated, as the R2 of the 2-factor WCAPM model can be used to draw inferences regarding market integration (see Pukthuanthong & Roll, 2009). CONCLUSION This paper has two main objectives. First, we addressed the country-grouping decomposition of world systematic risk of the Malaysian stock market. We decomposed the world portfolio into 5 sub-groupings: US market, developed markets, regional markets, major trading partners, and the rest of the world. We sought to determine which of these five sub-groupings of the world portfolio contributes to world systematic risk of the Malaysian market portfolio. We also tested firm characteristic-sorted portfolios based on size, value and liquidity. The results show that only the US and regional factors are statistically significant in explaining the Malaysian market portfolio and firm characteristic-sorted portfolios.
We then proceeded to trace the time-varying behaviour of the betas of these two factors, using a 2-factor model setting in a trivariate-GARCH modelling framework. We find that these two time-varying betas match international financial crises and economic regimes in Malaysia over the last two decades. We then related them to country risk ratings provided by ICRG. After modelling the high degree of mean and variance persistency in these time-varying betas, our results show that US economic risk can explain US systematic risk especially well for high value and small size Malaysian firms, while regional financial risk can explain regional systematic risk of large and average size firms. Political risk only affects small size firms or firms with extreme book-to-market values.
Our findings lead to several conclusions. First, pricing of firms listed on
Bursa Malaysia to world systematic risk is mainly driven by US and regional factors. Additionally, our 2-factor model has greater explanatory power than the WCAPM. Second, if we refer to explanatory power as a yardstick of market integration (see Pukthuanthong and Roll, 2009), we can conclude that the Malaysian market/firm is still a good candidate for a global country diversification strategy, as the explanatory power of the model is still far from perfect. Third, exposure to these two factors is time-varying with respect to

Components of Systematic Risk & Determinant in Malaysia
173
different regimes of the Malaysian economy, and approximately 70% of this variation is significantly driven by the US economic climate and regional (Asia) financial uncertainty. For the fund manager, such outcomes suggest that a country diversification strategy must be time-varying as well and that the two indicators noted above can serve as guides to portfolio restructuring.
ACKNOWLEDGEMENT
This research is funded by The Ministry of Higher Education Malaysia (Fundamental Research Grant Scheme no. 203/PMGT/6711253).
NOTES
1. Firms from India have only aggressively invested in overseas markets over the last few years, with India's outward FDI surpassing that of Malaysia in 2006. Another emerging Asian country that has had a higher outward FDI than Malaysia is Indonesia but only over 2 years, 2004 and 2005. See statistics in the World Investment Report for 1995–2012 for details.
2. See Roll's (1977) critiques. 3. Stehle (1977) and Jorion and Schwartz (1986) construct an orthogonal
world/global factor in their ICAPM model. The only difference is that we do not include a constant in the first pass regression to retain the individual mean in the orthogonalised series. This allows us to calculate the value-weighted portfolios in the next stage, using orthogonalised series with a different intercept.
4. Following Bollerslev, Engle and Wooldridge (1988), the variance-covariance matrix of the CCC multivariate model of stock returns series is assumed to follow a quadratic form as follows: BHBAACCH tttt 111 −−− ′+Ξ′Ξ′+′= ; where C is the 3 × 3 lower triangular matrix of constants, and A and B are 3 × 3 diagonal matrices
of coefficients. The restriction, 2,
2,,
2, tjjtiitijtij hhh ρ= , is imposed, where ijρ is the
conditional correlation of variables i and j, with i ≠ j, while 2ijh is the (i, j) element
in tH . 5. The economy of the four dragons, i.e., NIC-4, comprised of Hong Kong,
Singapore, South Korea, and Taiwan, picked up in the mid 1980s; while the four tigers of Indonesia, Malaysia, the Philippines and Thailand started to industrialise their economies and liberalise their financial markets in the late 1980s.
6. With the end of the US dot-com crisis and developed market recession (as a result of the dot-com crisis) in 2003 and the strong rebound of the East Asian emerging markets, there was strong speculation that the ringgit was undervalued against the USD. The market thus expected a revaluation or de-pegging to occur beginning in 2004.

Hooy Chee-Wooi and Robert D. Brooks
174
7. The effect of the subprime mortgage crisis was felt when Bursa Malaysia suspended trading for one hour after a sharp 10% fall in the composite index on 10 March 2008.
REFERENCES Abell, J., & Krueger, T. (1989). Macroeconomic influences on beta. Journal of
Economics and Business, 4l, 185–193. Adler, M., & Dumas, B. (1983). International portfolio choice and corporation finance: A
synthesis. The Journal of Finance, 38(3), 925–984. Adler, M., & Qi, R. (2003). Mexico's integration into the North American capital market.
Emerging Market Review, 4, 91–120. Amihud, Y., & Mendelson, H. (1986). Asset pricing and the bid ask spread. Journal of
Financial Economics, 17, 223–249. ASEAN Investment Report 2012 (2012). The changing FDI landscape. Jakarta: ASEAN
Secretariat. Bali, T. G., & Cakici, N. (2010). World market risk, country-specific risk and expected
returns in international stock markets. Journal of Banking and Finance, 34, 1152–1165.
Beaver, W., & Manegold, J. (1975). The association between market – determined and accounting – determined measures of systematic risk: some further evidence. Journal of Financial and Quantitative Analysis, 10(2), 231-284.
Bekaert, K. G., Harvey, C. R., & Ng, A. (2005). Market integration and contagion. Journal of Business, 78, 39–69.
Bekaert, K. G., Hodrick, R., & Zhang, S. H. (2009). International stock return comovements. The Journal of Finance, 64(6), 2591–2626.
Bilson, C., Brailsford, T., & Hooper, V. (2002). The explanatory power of political risk in emerging markets. International Review of Financial Analysis, 11, 1–27.
Bollerslev, T., Engle, R. F., & Wooldridge, J. M. (1988). A capital asset pricing model with time-varying covariances. Journal of Political Economy, 96 (1), 116–131.
Bos, T., & Newbold, P. (1984). An empirical investigation of the possibility of stochastic systematic risk in the market model. The Journal of Business, 57(1), 35–41.
Bowman, R. (1979). The theoretical relationship between systematic risk and financial (accounting) variables. The Journal of Finance, 34(3), 617–630.
Brooks, R., & Del Negro, M. (2005). Country versus region effects in international stock returns. Journal of Portfolio Management, 31(4), 67–72.
Brooks, R. D., Faff, R. W., & Lee, J. H. H. (1992). The form of time variation of systematic risk: some Australian evidence. Applied Financial Economics, 2, 191–198.
Chen, N. F., & Zhang, F. (1997). Correlations, trades, and stock returns of the Pacific-Basin markets. Pacific-Basin Finance Journal, 5, 559–577.
Diamonte, R. L., Liew, J. M., & Stevens, R. L. (1996). Political risk in emerging and developed markets. Financial Analysts Journal, 52(3), 71–76.
Dumas, B., Harvey, C. R., & Ruiz, P. (2003). Are correlations of stock returns justified by subsequent changes in national outputs? Journal of International Money and Finance, 22, 777–811.

Components of Systematic Risk & Determinant in Malaysia
175
Dumas, B., & Solnik, B. (1995). The world price of foreign exchange risk. The Journal of Finance, 50(2), 445–479.
Erb, C. B., Harvey, C. R., & Viskanta, T. E. (1996a). Political risk, economic risk and financial risk. Financial Analysts Journal, 52(6), 28–46.
Erb, C. B., Harvey, C. R., & Viskanta, T. E. (1996b). Expected returns and volatility in 135 countries. Journal of Portfolio Management, 22(3), 46–58.
Faff, R. W., Lee, J. H. H., & Fry, T. R. L. (1992). Time stationarity of systematic risk: Some Australian evidence. Journal of Business Finance and Accounting, 19(2), 253-270.
Fama, E. F., & French, K. R. (1996). Multifactor explanations of asset pricing anomalies. The Journal of Finance, 51(1), 55–84.
Fama, E. F., & French, K. R. (1998). Value versus growth: The international evidence. The Journal of Finance, 53(6), 1975–1999.
Ferson, W. E., & Harvey, C. R. (1993). The risk and predictability of international equity returns. The Review of Financial Studies, 6, 527–566.
Ferson, W. E., & Harvey, C. R. (1994). Sources of risk and expected returns in global equity markets. Journal of Banking and Finance, 18, 775–803.
Ferson, W. E., & Harvey, C. R. (1997). Fundamental determinants of national equity market returns: a perspective on conditional asset pricing. Journal of Banking and Finance, 21, 1625–1665.
Flannery, M. J., Hameed, A. S., & Harjes, R. H. (1997). Asset pricing, time-varying risk premia and interest rate risk. Journal of Banking and Finance, 21, 315–335.
Flannery, M. J., & James, C. M. (1984). The effect of interest rate changes on the common stock returns of financial institutions. The Journal of Finance, 39(4), 1141–1153.
Gangemi, M. A. M., Brooks, R. D., & Faff, R. W. (2000). Modeling Australia's country risk: a country beta approach. Journal of Economics and Business, 52(3), 259–276.
Goldberg, C., & Veitch, J. (2002). Country risk and the currency contagion effect: A case study of Argentina. Journal of Management Research, 2(1), 151–170.
Heaney, R., & Hooper, V. (1999). World, regional and political risk influences upon Asia Pacific equity market returns. Australian Journal of Management, 24, 131–142.
Hooy, C. W., & Goh, K. L. (2010). Exposure to the world and trading-bloc risks: A multivariate capital asset pricing model. Research in International Business and Finance, 24, 206–222.
Jegadeesh, N., & Titman, S. (1993). Returns to buying winners and selling losers: implications for stock market efficiency. The Journal of Finance, 48(1), 65–91.
Jorion, P., & Schwartz, E. (1986) Integration vs. segmentation in the Canadian stock market. The Journal of Finance, 41(3), 603–614.
Koutmos, G., & Knif, J. (2002). Estimating systematic risk using time varying distributions. European Financial Management, 8(1), 59–73.
Lin, C. H. (2011). Exchange rate exposure in the Asian emerging markets. Journal of Multinational Financial Management, 21(4), 224–238.
Marshall, A., Maulana, T., & Tang, L. (2009). The estimation and determinants of emerging market country risk and the dynamic conditional correlation GARCH model. International Review of Financial Analysis, 18, 250–259.

Hooy Chee-Wooi and Robert D. Brooks
176
Oetzel, J. G., Ting-Toomey, S., Masumoto, T., Yokochi, Y., Pan, X., Takai, J., & Wilcox, R. (2001). Face and facework in conflict: a cross-cultural comparison of China, Germany, Japan, and the United States. Communication Monographs, 68, 235–258.
Pukthuanthong, K., & Roll, R. W. (2009). Global market integration: An alternative measure and its application. Journal of Financial Economics, 94, 214–232.
Riddick, L. A. (1992). The effects of regulation on stochastic systematic-risk. Journal of Regulatory Economics, 4(2), 139–157.
Robichek, A. A., & Cohn, R. A. (1974). The economic determinants of systematic risk. The Journal of Finance, 29(5), 439–447.
Roll, R. (1977). Arcitique of the asset pricing theory's test; Part I: An equilibrium theory of value for market forecasts. Journal of Business, 54, 363–406.
Ryan, S. (1997). A survey of research relating accounting numbers to systematic equity risk, with implications for risk disclosure policy and future research. Accounting Horizons, 11(2), 82–95.
Sharpe, W. F. (1964). Capital asset prices: A theory of market equilibrium under conditions of risk. The Journal of Finance, 19, 425–442.
Stehle, R. (1977). An empirical test of the alternative hypotheses of national and international pricing of risky assets. The Journal of Finance, 32(2), 493–502.
Van Rijckeghem, C., & Weder, B. (2001). Sources of contagion: Is it finance or trade? Journal of International Economics, 54(2), 293–308.
Verma, R., & Soydemir, G. (2006). Modeling country risk in Latin America: A country beta approach. Global Finance Journal, 17(2), 192–213.
World Federation of Exchange. (2009). 2009 annual statistics reports of the world federation of exchange. Retrieved from http://www.world-exchanges.org/statistics/annual
World Investment Report. (2006). FDI from developing and transition economies: Implications for development. Switzerland: United Nations.
Yao, J., & Gao, J. (2004). Computer-intensive time-varying model approach to the systematic risk of Australian industrial stock returns. Australian Journal of Management, 29(1), 121–145.