the comprehensive urbanization level index (culi) as a new
TRANSCRIPT

The comprehensive urbanization level index (CULI) as a new approach to reclassifying urban and rural settlements in Egypt
M. Mehaina1, I. El-Bastawissi2 & H. Ayad1 1Department of Architecture, Faculty of Engineering, Alexandria University, Egypt 2Faculty of Architectural Engineering, Beirut Arab University, Lebanon
Abstract
Classifying communities into urban and rural is essential in the governmental and institutional decision making process. However, the notion of urban and rural varies from one country to another. Some nations classify settlements into urban and rural according to a population threshold, others according to prevailing professions in the community and another method is from a social aspect. The Egyptian State’s method to classify urban and rural communities depends on the Ministry of Interior (MoI) decrees based primarily on population numbers along with other factors like the existence of certain land uses. Within this context, the research pinpointed some ambiguous facts related to that classification. Hence, the current study is pursuing a new method to address this issue. This is to be done by constructing a composite index (CI) that ranges from 0–1 with a threshold value of 0.5 where the lower values are considered rural and the higher are inferred to as urban. The research followed the OECD method to construct the index. The analytical study is carried out on 6 governorates and the data entry for the 34 utilized indicators is made on 459 “sheiakha” which is the smallest administrative unit to collect data upon. Data entry and the construction of the index along with its validation is done using SPSS. The CI results ranges from 0.27 to 0.76 with a cut-off value of 0.56. Accordingly, all “sheiakha” are reclassified and cross-compared to the existing classification. Furthermore, spatial analysis of the index outcomes, using ArcGIS-ArcInfo, shows that high/low levels of urbanization cluster together with no sharp cutting
www.witpress.com, ISSN 1743-3541 (on-line) WIT Transactions on Ecology and The Environment, Vol 204, © 2016 WIT Press
doi:10.2495/SC160261
This paper is part of the Proceedings of the 11 International Conference th
on Urban Regeneration and Sustainability (SC 2016) www.witconferences.com
edge, but rather a piecemeal decrease in urbanization level from the centre of the urban cluster to the outer suburbs. Keywords: urbanization, urban rural classification, composite index, spatial analysis, Egypt.
1 Introduction
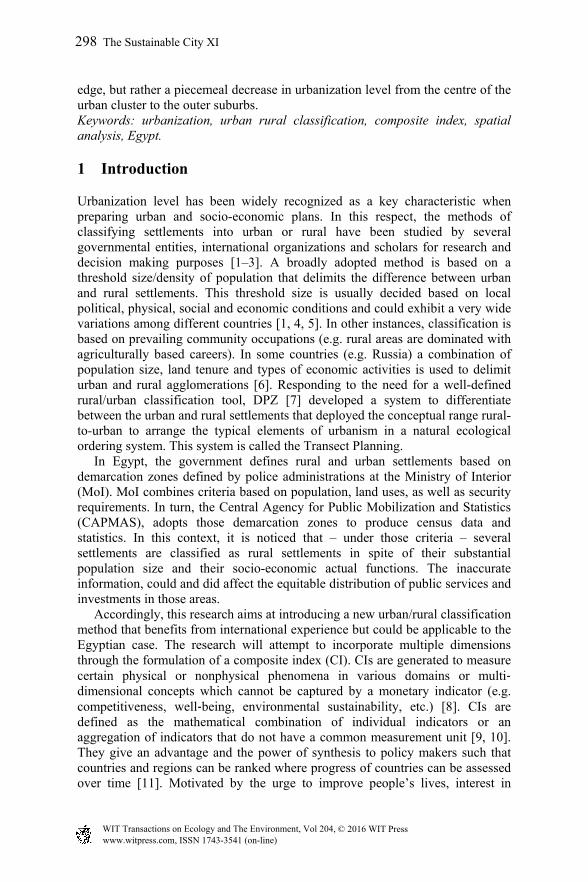
Urbanization level has been widely recognized as a key characteristic when preparing urban and socio-economic plans. In this respect, the methods of classifying settlements into urban or rural have been studied by several governmental entities, international organizations and scholars for research and decision making purposes [1–3]. A broadly adopted method is based on a threshold size/density of population that delimits the difference between urban and rural settlements. This threshold size is usually decided based on local political, physical, social and economic conditions and could exhibit a very wide variations among different countries [1, 4, 5]. In other instances, classification is based on prevailing community occupations (e.g. rural areas are dominated with agriculturally based careers). In some countries (e.g. Russia) a combination of population size, land tenure and types of economic activities is used to delimit urban and rural agglomerations [6]. Responding to the need for a well-defined rural/urban classification tool, DPZ [7] developed a system to differentiate between the urban and rural settlements that deployed the conceptual range rural-to-urban to arrange the typical elements of urbanism in a natural ecological ordering system. This system is called the Transect Planning. In Egypt, the government defines rural and urban settlements based on demarcation zones defined by police administrations at the Ministry of Interior (MoI). MoI combines criteria based on population, land uses, as well as security requirements. In turn, the Central Agency for Public Mobilization and Statistics (CAPMAS), adopts those demarcation zones to produce census data and statistics. In this context, it is noticed that – under those criteria – several settlements are classified as rural settlements in spite of their substantial population size and their socio-economic actual functions. The inaccurate information, could and did affect the equitable distribution of public services and investments in those areas. Accordingly, this research aims at introducing a new urban/rural classification method that benefits from international experience but could be applicable to the Egyptian case. The research will attempt to incorporate multiple dimensions through the formulation of a composite index (CI). CIs are generated to measure certain physical or nonphysical phenomena in various domains or multi‐dimensional concepts which cannot be captured by a monetary indicator (e.g. competitiveness, well‐being, environmental sustainability, etc.) [8]. CIs are defined as the mathematical combination of individual indicators or an aggregation of indicators that do not have a common measurement unit [9, 10]. They give an advantage and the power of synthesis to policy makers such that countries and regions can be ranked where progress of countries can be assessed over time [11]. Motivated by the urge to improve people’s lives, interest in
298 The Sustainable City XI
www.witpress.com, ISSN 1743-3541 (on-line) WIT Transactions on Ecology and The Environment, Vol 204, © 2016 WIT Press

constructing composite indices started to emerge when Haribson and Myers [12] proposed a composite indicator that focused on human resource development. A few years later, the United Nations Research Institute for Social Development (UNRISD) proposed an index of socio-economic development designed by McGranahan and Tacoli [13]. Following, many other indices were developed, yet, it was not until the Human Development Index (HDI) was developed in 1990 in the Human Development Report, that CIs received wider attention [11]. The HDI is considered one of the most recognized utilized indices. It reflects life expectancy, education level and living standards in each country, and is used by the United Nations for the estimation of progress and annual country comparisons based on human development. Later many indices were introduced, of them the index developed by UN-Habitat: the City Prosperity Index (CPI). Several methods are used to construct a CI [14, 15]. For example, Al Haji [16] applied three ways of weighting, which were the simple equal average; the use of theoretical weights, and the principle component analysis. Hermans and Van der Bossche [17] studied the issue of assigning weights to individual indicators. Also, Currie-Alder et al. [11] proposed 5 steps to construct a CI: (a) specify the purpose of measure; (b) select of dimensions, indicators and weights; (c) choose mathematical structure; (d) perform robustness test; (e) get feedback from different stakeholders. However, due to its comprehensiveness and robustness, the study adapted the OECD’s [15] method to construct the proposed CI.
2 Tools and methods
The paper proposes that assessing the urbanization level from a comprehensive approach is an attempt to practically classify administrative units into urban and rural. And since CIs are expected to grasp the complexity of such interlocking phenomenon. Accordingly, the notion of constructing the comprehensive urbanization level index (CULI) arose. Based on the OECD [15], to construct the CULI the following steps are to be followed.
2.1 Steps to build a CI according to the OECD [15]
2.1.1 Developing the theoretical framework This initial phase involves the integration of a broad set of viewpoints that compose the phenomena being studied. This framework should guide the choice of the underlying indicators. Consequently, having a community of peers who are willing to accept the theoretical framework.
2.1.2 Selecting indicators Selection of domains and sub indicators is considered a key debate about CIs. In practice, the selection of dimensions and indicators has usually been based on: (a) existing data or convention; (b) theory; (c) public consensus; (d) ongoing deliberative participatory processes; (e) empirical evidence or analysis [18]; (f) pragmatism or intuitive appeal [11, 19]. However, it is frequently the case in
The Sustainable City XI 299
www.witpress.com, ISSN 1743-3541 (on-line) WIT Transactions on Ecology and The Environment, Vol 204, © 2016 WIT Press
constructing any CI, the index is constrained by data availability. Hence, no CI so far has escaped criticism in this respect, that’s why selecting indicators is considered a trade-off in the CI construction [11]. Moreover, the selection of the indicators should also consider policy relevance, redundancy and correlation.
2.1.3 Multivariate analysis and normalization of indicators This phase includes investigating the underlying data structure in addition to determining how the domains of the CI are statistically related and making redundancy necessary checks. According to OECD [15], this process can be done using Principle Component Analysis (PCA) or Factor Analysis (FA) with the goal to reveal how different variables change in relation to each other. Normalization of data means to express the proposed indicators in the same unit. Complicated methods exists, however normalization can also be done by ranking techniques, Z-scores standardization and re-scaling.
2.1.4 Weighting and aggregation of inputs The process of weighting involves emphasizing the contribution of some indicators to the final result by giving them more weight in the analysis. Data Envelopment Analysis and FA methods are recommended for the weighting process. As for aggregation, it has to be clearly identified whether it makes sense to allow for compensability among indicators. Aggregation could be done using linear aggregation; multi-criteria analysis and min/max range.
2.1.5 Testing the robustness of the CI The robustness of the CI has to be assessed via the uncertainty analysis in order to determine what sources of uncertainty mostly influence the CI scores.
2.1.6 Other steps The OECD [15] proposed other steps including a phase to reveal the main drivers of good or bad performance. Another phase is the association with other variables where linkages help to understand many socio-economic aspects. The final stage is the presentation and dissemination. Analogous to the HDI, the CULI intends to deliver a value for each administrative unit/”sheiakha” ranging from 0-1. Moreover, the study suggests a cutoff value of 0.5 where: (a) 0 ≦ CULI < 0.1 indicates a totally rural case; (b) 0.1 ≦ CULI < 0.5 infers a semi-rural case; (c) 0.5 ≦ CULI < 0.9 implies a semi-urban case; (d) 0.9 ≦ CULI ≦ 1 indicates an entirely urban case. The CULI is built for 459 “sheiakha” featuring 6 Governorates (fig. 1). Based on that cutoff value, the administrative units encompassed in the study are reclassified into urban and rural. Consequently a measure of agreement is undergone between the existing CAPMAS classification and the proposed reclassification according to the CULI. The SPSS17 software is used in all data entry and necessary statistical analysis to construct and validate the CULI. Following the construction of the proposed CI, the CULI values are mapped for each “sheiakha” followed by spatial analysis. The first step in the spatial analysis is the Spatial Autocorrelation (Moran’s I) analysis. This is to indicate the geographical spatial patterns for the CULI concentrations whether it is
300 The Sustainable City XI
www.witpress.com, ISSN 1743-3541 (on-line) WIT Transactions on Ecology and The Environment, Vol 204, © 2016 WIT Press

Figure 1: Map of Egypt showing the governorates included in the practical study.
dispersed, clustered or random. Consequently, a hotspot analysis (Getis-Ord Gi) of the CULI outcomes is carried to determine the spatial locations of high/low values and accordingly interpreting their geographical justification. The ArcGIS-ArcInfo10.2 software is utilized for mapping, conducting spatial analysis and maps production.
2.2 Building the Composite Index
The transformation from rural to urban is a process that could be measured using CULI. Four domains could affect the urbanization process: spatial expansions; economy; public services; society and lifestyle [20–22]. Accordingly, the current research will utilize these factors in the process of indicators’ selection. The process for selecting the indicators should consider certain points i.e. involving the stakeholders, redundancy and availability etc. However, due to the absence of a group of unanimously accepted indicators to measure how much a settlement is urban or rural, in other words to assess the comprehensive urbanization level, thus, after consulting different officials from variant governmental authorities in Cairo and Alexandria, the research firstly proposed a set of 55 indicators to build the CULI. However, some indicators are almost unobtainable and others are available only on higher administrative levels. Hence, a reduced list of 34 indicators is used to build the CULI (see table 1). The standardization and normalization are done by the Ranking method for all variables on each case from 1–4. These 4 ranks are tiered based on the Natural Breaks method for ranking of the indicators values where value 1 indicates a rural settlement, 2 is semi-rural, 3 is semi-urban and 4 is urban. The weighting is done using the equal weights method for each variable. As for the aggregation it is carried out using Min/Max Range method. The first step in testing the validity of the CULI is actually a pre-requisite analytical step for undergoing step number two; the Factor Analysis Explained Variance (FAEV). This first step is the KMO and Bartlett’s test of specificity. As shown in table 2, the result is 0.92 which is considered a high value as the rule of thumb is over
The Sustainable City XI 301
www.witpress.com, ISSN 1743-3541 (on-line) WIT Transactions on Ecology and The Environment, Vol 204, © 2016 WIT Press

Table 1: The utilized list of indicators.
Id Domain Indicator1
spatial expansion
total area2 % of inhibited areas3 % of open space4 % of water bodies5 % of agricultural land6 proximity to main roads7 proximity to railways8
economy
% of agricultural labour force9 % of industry labour force
10 % of services labour force11 % of self employed12 % of handicrafts workers13 % of employment14 living standard gap15 contribution to GDP16 per capita GDP17 poverty headcount under poverty line18
public services
literacy rate19 % of enrolment in all levels of education20 % of children not enrolled in primary education 21 mean density in primary schools22 % of students in private schools23 # of doctors per 10,000 of people24 # of beds per 10,000 of people25 # of health units per 100,000 of people26 under 5 children who are under weight 27 under 5 children dying28 expected life on birth29 % of population connected to electricity30 % of population connected to drainage system 31 % of population connected to water32
society/lifestyle total population
33 rate of annual growth34 # of people working on community service
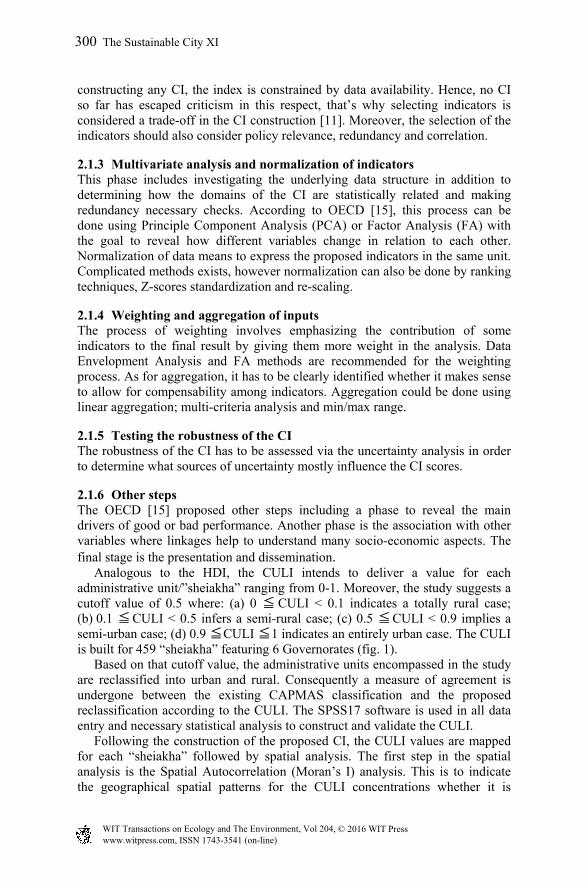
0.5. This means that the FAEV can be carried efficiently. As shown in table 3, the FAEV result is 82.7%, meaning that the selected indicators describe almost 83% of the comprehensive urbanization level in Egypt. The last examination to endorse the CULI is the receiver operating characteristic (ROC) curve that evaluates the accuracy of the developed index as an assessment method for comprehensive urbanization. The rule of thumb for the AUC is 0.5 and the test result is equal to 0.95 meaning that the used indicators represent almost 95% of the comprehensive urbanization phenomenon (fig. 2). Moreover, the ROC curve
302 The Sustainable City XI
www.witpress.com, ISSN 1743-3541 (on-line) WIT Transactions on Ecology and The Environment, Vol 204, © 2016 WIT Press

also indicates the cutoff point between urban and rural “sheiakha” by a value of 0.56 as shown in table 4. This value which is almost equal to the 0.5 value suggested before by the study. In view of that, all the “sheiakha” incorporated in the study are classified based on their CULI to urban or rural. Consequently, the Kappa Measure of Agreement is made between the CAPMAS classification and the proposed reclassification. The result is 0.8 and this implies an 80% matching between both methods (table 5).
Table 2: KMO and Bartlett’s test of specificity for the CULI.
Table 3: The CI, factor analysis explained variance.
Table 4: The cut-off value for the CI according to the ROC curve coordinates.
Table 5: Kappa measure of agreement.
The Sustainable City XI 303
www.witpress.com, ISSN 1743-3541 (on-line) WIT Transactions on Ecology and The Environment, Vol 204, © 2016 WIT Press
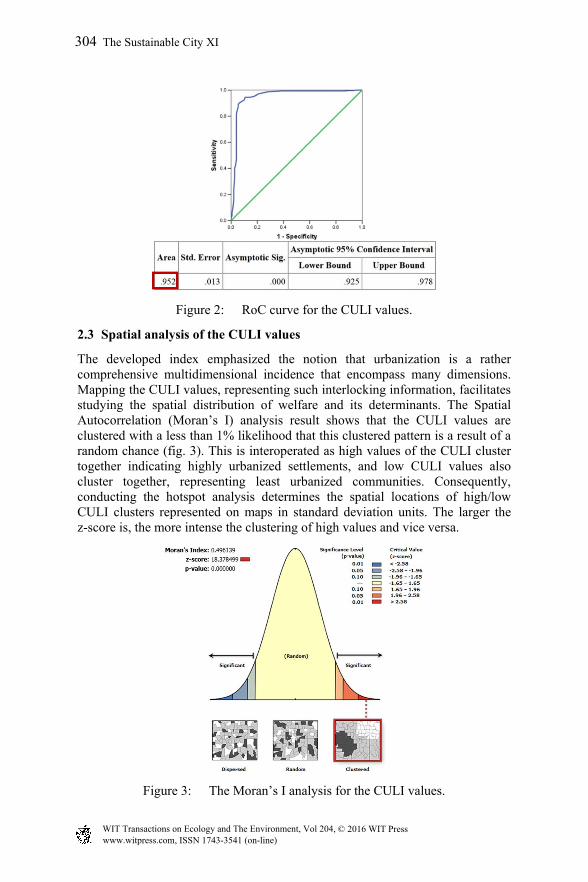
Figure 2: RoC curve for the CULI values.
2.3 Spatial analysis of the CULI values
The developed index emphasized the notion that urbanization is a rather comprehensive multidimensional incidence that encompass many dimensions. Mapping the CULI values, representing such interlocking information, facilitates studying the spatial distribution of welfare and its determinants. The Spatial Autocorrelation (Moran’s I) analysis result shows that the CULI values are clustered with a less than 1% likelihood that this clustered pattern is a result of a random chance (fig. 3). This is interoperated as high values of the CULI cluster together indicating highly urbanized settlements, and low CULI values also cluster together, representing least urbanized communities. Consequently, conducting the hotspot analysis determines the spatial locations of high/low CULI clusters represented on maps in standard deviation units. The larger the z-score is, the more intense the clustering of high values and vice versa.
Figure 3: The Moran’s I analysis for the CULI values.
304 The Sustainable City XI
www.witpress.com, ISSN 1743-3541 (on-line) WIT Transactions on Ecology and The Environment, Vol 204, © 2016 WIT Press
3 Results and findings
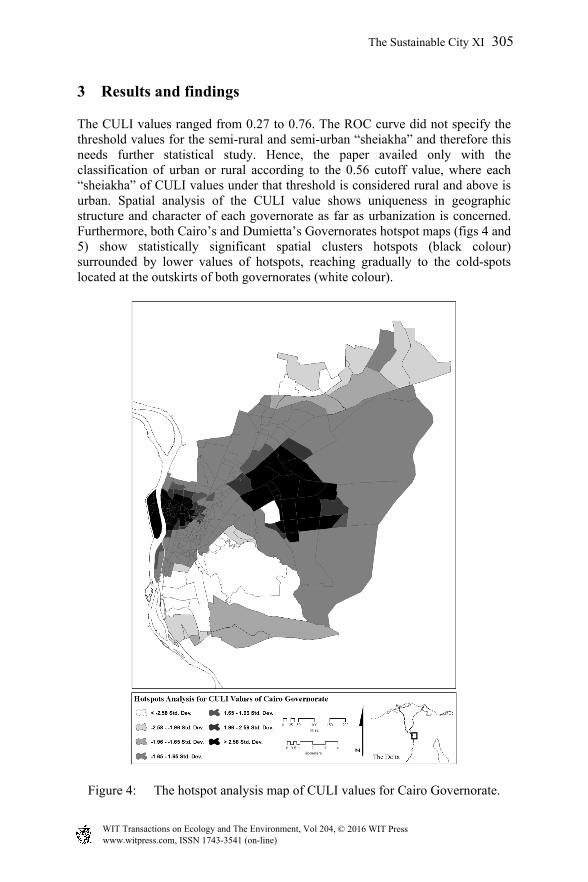
The CULI values ranged from 0.27 to 0.76. The ROC curve did not specify the threshold values for the semi-rural and semi-urban “sheiakha” and therefore this needs further statistical study. Hence, the paper availed only with the classification of urban or rural according to the 0.56 cutoff value, where each “sheiakha” of CULI values under that threshold is considered rural and above is urban. Spatial analysis of the CULI value shows uniqueness in geographic structure and character of each governorate as far as urbanization is concerned. Furthermore, both Cairo’s and Dumietta’s Governorates hotspot maps (figs 4 and 5) show statistically significant spatial clusters hotspots (black colour) surrounded by lower values of hotspots, reaching gradually to the cold-spots located at the outskirts of both governorates (white colour).
Figure 4: The hotspot analysis map of CULI values for Cairo Governorate.
The Sustainable City XI 305
www.witpress.com, ISSN 1743-3541 (on-line) WIT Transactions on Ecology and The Environment, Vol 204, © 2016 WIT Press

Figure 5: The hotspot analysis map of CULI values for Dumietta Governorate.
306 The Sustainable City XI
www.witpress.com, ISSN 1743-3541 (on-line) WIT Transactions on Ecology and The Environment, Vol 204, © 2016 WIT Press
4 Conclusions
This research introduces the CULI as a new approach to classify settlements into urban and rural. Several statistical methods validated the CULI values and ascertained its credibility. Hence, the CULI could be considered as an attempt to assist the Egyptian State Government to achieve proper urban governance through practical classification of local administrative units. Moreover, conducting spatial analysis on the CULI values shows that highly urbanized settlements are clustered together indicating main urban clusters in each governorate. Also, least urbanized settlements cluster together growing on the peripheries of main urban clusters indicating deprived zones. Lastly, it is also concluded that there is no a sharp cutting edge between highly and least urbanized settlements, but rather a piecemeal decrease in urbanization level from the centre of the urban cluster to the outer suburbs.
References
[1] United Kingdom Government official website, https://www.gov.uk/ government/collections/rural-urban-definition
[2] United Nations, http://www.un.org/esa/population/meetings/EGM_ PopDist
[3] Bhagat, R. B., Rural‐Urban Classification and Municipal Governance in India. Singapore Journal of Tropical Geography, 26(1), 2005, pp. 61-73, 2005.
[4] United States Census Bureau, https://www.census.gov/geo/reference/ua/ urban-rural-2000.html
[5] FAO, http://www.fao.org/docrep [6] Country Studies/Area Handbook Series sponsored by the U.S.
Department, http://countrystudies.us/russia/48.htm [7] Duany Plater-Zyberk & Company, www.dpz.com [8] Pérez, V.; Guerrero, F.; González, M.; Pérez, F. and Caballero, R.,
Composite Indicator for the Assessment of Sustainability: The Case of Cuban Nature-Based Tourism Destinations. Ecological Indicators, 29, pp. 316–324, 2013.
[9] Tarantola, S., Ten Steps to Build Composite Indicators. Working Paper, QMSS-2, Vienna, 2010.
[10] Saisana, M. and Tarantola, S., (2002). State-of-the-art report on current methodologies and practices for composite indicator development. EUR 20408 EN© European Communities – European Commission Joint Research Center (EC-JRC), 2002.
[11] Currie-Alder, Bruce, Kanbur, Ravi, Malone, David M. & Medhora, Rohinton, International Development: Ideas, Experiences and Prospects, Oxford University Press, pp. 135–145, 2014.
[12] Haribson, F., and Myers, A., Education, Manpower and Economic Growth, New York: McGraw-Hill Book p. 229, 1964.
The Sustainable City XI 307
www.witpress.com, ISSN 1743-3541 (on-line) WIT Transactions on Ecology and The Environment, Vol 204, © 2016 WIT Press

[13] McGranahan, G. and Tacoli, C., Rural–Urban Migration in China: Policy Options for Economic Growth, Environmental Sustainability and Equity. International Institute for Environment and Development (iied), Human Settlements Working Paper Series Rural–Urban Interactions and Livelihood Strategies, No. 12, 2006.
[14] OECD, Handbook on Constructing Composite Indicators: Methodology and User Guide. OECD, JRE (Organization for Economic Co-operation and Development, European Union, Joint Research Center – European Commission), 2005.
[15] OECD, Handbook on Constructing Composite Indicators: Methodology and User Guide. OECD, JRE (Organization for Economic Co-operation and Development, European Union, Joint Research Center – European Commission), 2008.
[16] Al Haji, G., Towards a Road Safety Development Index (RSDI): Development of an International Index to Measure Road Safety Performance. Department of Science and Technology, Linkoping University. Licentiate Thesis No. 1174, 2005.
[17] Hermans, E., Van der Bossche, F., Wets, G., Combining road safety information in a performance index. Accident Analysis and Prevention 40, pp. 1337–1344, 2008.
[18] Alkire, S., Choosing Dimensions: The Capability Approach and Multidimensional Poverty. Chronic Poverty Research Centre, Working Paper No. 88, 2008.
[19] Booysen, F., An Overview and Evaluation of Composite Indices of Development. Social Indicators Research, 59, pp. 115-51, 2002.
[20] Siciliano, G., Urbanization strategies, Rural Development and Land Use Changes in China: A Multiple Level Integrated Assessment. Land Use Policy, 29: pp. 165–178, 2012.
[21] Shen, L.; Peng, Y.; Zhang, X. and Wu, Y., An Alternative Model for Evaluating Sustainable Urbanization. Cities, 29, pp. 32–39, 2012.
[22] Spatial Evaluation and Regionalization of Comprehensive Urbanization Level in China. Geoinformatics, 2011 19th International Conference. Wang. Y.; Fang, C. and Wang, Z., IEEE: Shanghai, pp. 1–6, 24–26, 2011.
308 The Sustainable City XI
www.witpress.com, ISSN 1743-3541 (on-line) WIT Transactions on Ecology and The Environment, Vol 204, © 2016 WIT Press