the concept of non-nuclear development of the … · 3 abbreviations npp — nuclear power plant...
TRANSCRIPT
All-Ukraine Environmental NGO “MAMA-86” The National Environmental Centre of UkraineYouth Environmental NGO “Ecoclub”, Rivne
Dniprodzerzhinsk Environmental NGO “The Voice of Nature”Environmental Culture Centre “Bakhmat”, Artemivsk
The Concept of Non-nuclear Development
of the Power Industry of Ukraine
Kyiv — 2006

3
Abbreviations
NPP — Nuclear power plant A&R — alternative and renewable energy sources
WEP — Wind electric plant IES — the integrated energy system of Ukraine
GDP — Gross Domestic Product PER — primary energy resources
INF — irradiated nuclear fuel APL — aerial power transmission line
HEP — hydroelectric plant RW — radioactive waste
HESP — hydroelectric storage plant FEs — nuclear fuel elements
GTE — gas turbine engine TEPP — turbo-expander power plantMinor
HEPs — minor hydropower plants
Contents
Executive summary ........................................................................................................................ 4Preface ............................................................................................................................ 6Introduction ............................................................................................................................ 71. Analysis of key indicators of predicted development of Ukrainian
economy and power industry up to 2030 ................................................................................ 82. Risks of the “nuclear” scenario of development of the power
industry of Ukraine ............................................................................................................... 133. Energy strategies of European countries ................................................................................ 204. Main energy conservation measures ...................................................................................... 225. Renewable energy sources ..................................................................................................... 24 5.1. Bio-energy ................................................................................................................... 25 5.2. Wind power .................................................................................................................. 28 5.3. Solar heaters ................................................................................................................. 29 5.4. Photovoltaics ................................................................................................................ 29 5.5. Geothermal energy ....................................................................................................... 29 5.6. Hydropower ................................................................................................................. 296. Cogeneration ........................................................................................................................ 31 7. Reduction of heat and electric energy losses .................................................................. 32 7.1. Reduction of heat losses in the housing and utilities sector ............................................ 32 7.2. Reduction of electric energy losses in the course of transmission ................................... 348. Utilisation of coalbed methane .............................................................................................. 359. Reconstruction of the gas transportation system .................................................................... 3610. Utilisation of discharge heat of boilers ................................................................................... 3711. Utilisation of natural gas pressure .......................................................................................... 3812. Utilisation of industrial gases ................................................................................................. 3913. Development of traditional energy resources ......................................................................... 4014. The Non-nuclear Scenario of Development of the Power Industry of Ukraine up to 2030. ..... 42Conclusions ............................................................................................................................ 44Recommendations ......................................................................................................................... 45

4
Executive summary
The Concept of Non-nuclear Development of the Power Industry of Ukraine was developed by Ukrainian environmental NGOs in response to unwillingness of the Government to consider seriously alternatives to the “nuclear” scenario of the draft Energy Strategy of Ukraine up to 2030 (the draft was approved by the Cabinet of Ministers of Ukraine on March 15, 2006).
Notwithstanding numerous applications of NGOs, the Government had failed to conduct broad public discussions on the draft Strategy before its approval.
The goal of this document is to demonstrate that there is an alternative to the nuclear scenario of devel-opment of the power industry complex of Ukraine. First and foremost, the alternative relies on imple-mentation of energy-saving and energy efficient technologies, real practical application of renewables and alternative energy sources. However, the alternative also stipulates review of the scenario of sharp reduction of consumption of natural gas.
The Concept provides critical analysis of data and conclusions of the Strategy. In particular, in Section 1, it is shown that the Strategy’s forecast of fuel and energy consumption for 2030 was overestimated by 213.1 million tons of conventional fuel, suggesting low quality of the whole document. Such an over-estimation makes one sceptical about all other data and conclusions of the Strategy, in particular as for the need to construct 22 new reactor units, sharp reduction of consumption of natural gas and ignoring substantial capacity of renewables. In Section 2, authors prove that the Strategy declaration of the need to extend operational service life of existing NPPs and to construct 22 new reactor units is not duly sub-stantiated by comprehensive estimates of technological, environmental, social and economic risks of the nuclear scenario — as a result, associated costs are substantially underestimated.
Examples of developed European countries in Section 3 suggest that even in conditions of stable GDP growth with associated patterns of demand in heat and electric energy, there are real alternatives to the nuclear path of power industry development. In particular, the EU plans to increase the share of renew-ables in the energy consumption of EU countries to 20% by 2020 (the German Government proposes to set the target even higher — 30% for the EU and 40% for Germany).
Key energy conservation options and associated costs (see Table 4.1. Potential options for introduc-tion of energy-saving technologies and necessary investments at page 23) are proposed in Section 4. In Section 5, assessments of potential capacity of renewable energy sources and forecasts of their ap-plication in Ukraine up to 2050 are provided. The Section provides a detailed account of potential capacity of bio-energy, wind power, solar collectors, photovoltaics, geothermal energy and hydropower. Section 6 is dedicated to cogeneration of heat and electricity as an option that allows to reduce fuel consumption at the same energy output. Section 7 is dedicated to analysis of reduction of heat and electric energy losses in the sphere of housing and utilities at stages of power generation, transportation and consumption. In Section 8, potential utilisation of coalbed methane for electricity generation in Ukraine is considered. Sections 9, 10, 11 and 12 are dedicated to reconstruction of gas transportation networks, utilisation of discharge energy of boilers, utilisation of natural gas pressure and application of industrial gases, respectively.
In terms of coal and oil consumption, Section 13 — Development of Traditional Energy Sources — re-lies on data of the Strategy, but it proposes another scenario of use of natural gas as the most environ-mentally sound traditional fuel: instead of substantial reduction, the scenario stipulates some increase (10%). Appropriateness of the gas scenario is based on much lower estimated costs comparatively to costs of development and operation of new nuclear reactor units and management of irradiated nuclear fuel, as well as on obviously lower associated risks.
5
Possible non-nuclear scenario of development of the power industry of Ukraine up to 2030 is presented in Section 14. The scenario stipulates: the share of nuclear power at the level of 2.1 million tons of conventional fuel annually to be produced by 2 reactor units that will not exceed their normal operat-ing time by 2030 (RNPP-4 and KhNPP-2); consumption of natural gas close to consumption of coal (gas will meet 33.3% and coal will meet 35.4% of the overall demand in fuel and energy resources); followed by renewables and alternative energy sources — 16.3%. Biomass energy and wind power will make the main contribution to the share of renewable energy sources. Overall, renewables will allow to meet 11.7% (33.54 million tons of conventional fuel/year) of the energy demand, in line with trends in developed countries in Europe and elsewhere (see Fig. 14.2. The structure of consumption of primary energy sources in Ukraine in 2030, according to the non-nuclear scenario of development of the power industry (at the overall consumption of 285.7 million tons of conventional fuel) at page 43).
Analysis of available capacity and potential options of application of energy-saving technologies, alterna-tive and renewable energy sources allows to conclude that the alternative to the nuclear option of develop-ment of the power industry of Ukraine really exists, making the Strategy’s declared necessity of construc-tion of 22 new reactor units and establishment of the closed nuclear fuel cycle in Ukraine unjustified.
Recommendations for the Government of Ukraine propose to admit that approval of the draft Energy Strategy was a misjudgement and to develop a new draft. These activities should start from a dedicated study of actual energy losses in different economic sectors in order to assess the overall energy conser-vation capacity. The forecast of consumption of primary energy sources in Ukraine in 2030 should be reassessed downward, accounting for assessments of GDP growth and reduction of the GDP’s energy intensity. Predicted shares of renewables in the overall consumption of fuel and energy resources in 2030 should be reassessed, accounting for higher use of bio-energy and wind power. Ukraine should reject the option of commissioning of any new reactor units, all operational reactor units should be decommis-sioned as planned instead of the expansion of nuclear power capacity. It is necessary to make transpar-ent cost estimates for processing and storage of nuclear waste, irradiated nuclear fuel and other costs of the nuclear power complex, unforeseen by the Energy Strategy. Funds, allocated for construction of new reactor units should be invested into development of energy efficient technologies, alternative and renewable energy sources. In the framework of development of the new draft Energy Strategy, it is necessary to develop alternative scenarios of development of the power industry of Ukraine, accounting for provisions of the Concept of the Non-nuclear Development of the Power Industry of Ukraine. The Government should conduct broad public discussions on the draft Strategy and alternative scenarios, with involvement of all stakeholders and in convenient terms, allowing their comprehensive review.
Development of the Concept was initiated, co-ordinated and funded by All-Ukraine Environmental NGO “MAMA-86”. The range of authors of the Concept of Non-nuclear Development of the Power Industry of Ukraine incorporated “MAMA-86”, the National Environmental Centre of Ukraine, EcoClub NGO (Rivne), The Voice of Nature NGO (Dniprodzerzhinsk), “Bakhmat” Environmental Culture Centre (Artemivsk), experts and advisors of the Agency for Renewable Energy NGO and “Biomassa” NTC, with participation of V.I. Usatenko, the expert of the National Radiation Protection Committee under the Verkhovna Rada of Ukraine.
The full text of the Concept is available at: www.mama-86.org.ua/files/nnconcept_eng.pdf.

6
Preface
This document was developed as a response of environmental NGOs to unwillingness of the Government of Ukraine to consider seriously alternatives to the “nuclear” scenario of development of the power in-dustry. The concept suggests a potential option that allows to avoid construction of new nuclear reac-tors.
The concept of “non-nuclear” development of the power industry of Ukraine accounts for data of the draft official Energy Strategy of Ukraine up to 2030, and partly relies on these data. For comparison, information materials and estimates of the National Academy of Sciences of Ukraine are used (inc. the Institute of Technical Thermal Physics and the Institute of Renewable Energy), as well as materials of the Agency for Renewable Energy NGO and “Biomass” Scientific and Technical Centre?.
The Concept does not pretend to be exclusive or to represent the only available alternative, facts and figures in the documents may be further updated and corrected. The Concept was intended to serve as a base for broad public discussions, with involvement of all stakeholders, on strategies of development of the power industry of Ukraine, accounting for all potential alternatives, that pose lowest possible envi-ronmental, economic, political and social risks for the country.
Development of the Concept was initiated, co-ordinated and funded by All-Ukraine Environmental NGO “MAMA-86”. The range of authors of the Concept incorporates “MAMA-86”, the National Environmental Centre of Ukraine, EcoClub NGO (Rivne), The Voice of Nature NGO (Dniprodzerzhinsk), “Bakhmat” Environmental Culture Centre (Artemivsk).
Experts Geletukha G. G., Zhelezna T. A. and Konechenkov A. E. participated in the development of the Concept, as well as Usatenko V. I., the expert of the National Radiation Protection Commission under the Verkhovna Rada of Ukraine.

7
Introduction
Ukraine is an independent country that dynamically develops and gradually strengthens its political and economic positions in Europe and the World. Similarly to any other country, the power industry is extremely important for Ukraine, as it directly affects economic development and living standards of the country’s population. Now Ukraine is at a very important stage of identification of its energy policy up to 2030.
The last version of the draft Energy Strategy of Ukraine up to 2030 (referred hereinafter to as the Energy Strategy or Strategy) was developed by a working group, established by the Ministry of Fuel and Power Industry of Ukraine. The draft substantially differs from the previous version, developed primarily by the Institute of General Power Industry of the National Academy of Sciences of Ukraine, however, the draft refers to the Institute’s text as a base for the Strategy development. The key novelty of the draft Energy Strategy of Ukraine up to 2030 is associated with its reliance on development of nuclear power: extension of service life of 12 operational reactor units and construction of 22 new reactor units, includ-ing 2 additional reactor units at Khmelnitsk NPP, 9 reactor units to replace old ones that near comple-tion of their service life and 11 brand new ones.
Authors of the Energy Strategy insist that in the course of the Strategy development they accounted inter alia for results of public discussions. As we know, by “public discussions” they meant the meeting of the public board under the Ministry of Fuel and Power Industry, that unanimously supported the proposed draft. One can definitely state that no broad discussions and consultations with all stakehold-ers were held, and no alternative scenarios were considered, therefore the official draft Strategy might be considered as one of many potential options, instead of the only existing option for development of the power industry of Ukraine.
At the same time, there are numerous objective risks of the “nuclear” scenario of the power industry development that have not been accounted for in the official Strategy draft.
This document intends to demonstrate that there is an alternative to the “nuclear” scenario of develop-ment of the power industry of Ukraine. First and foremost, the alternative relies on introduction of en-ergy saving and energy efficient technologies and real materialisation of available capacity of alternative and renewable energy sources. However, this alternative stipulates also review of the scenario of radical reduction of consumption of natural gas and stipulates some increase of gas consumption.
8
1. Analysis of key indicators of predicted development of Ukrainian economy and power industry up to 2030
Main indicators of predicted development of the economy and power industry, according to the Energy Strategy
The draft Energy Strategy of Ukraine up to 2030 defines three periods of economic development up to 2030: up to 2010 — the period of innovations-based restructuring; 2011—2020 — the period of outpace development of the traditional services sector of the Ukrainian economy. These periods of development should result in establishment of foundations of a post-industrial economy. In the period from 2021 to 2030, the country is expected to complete its transition to a post-industrial society with relevant struc-tural changes in the economy.
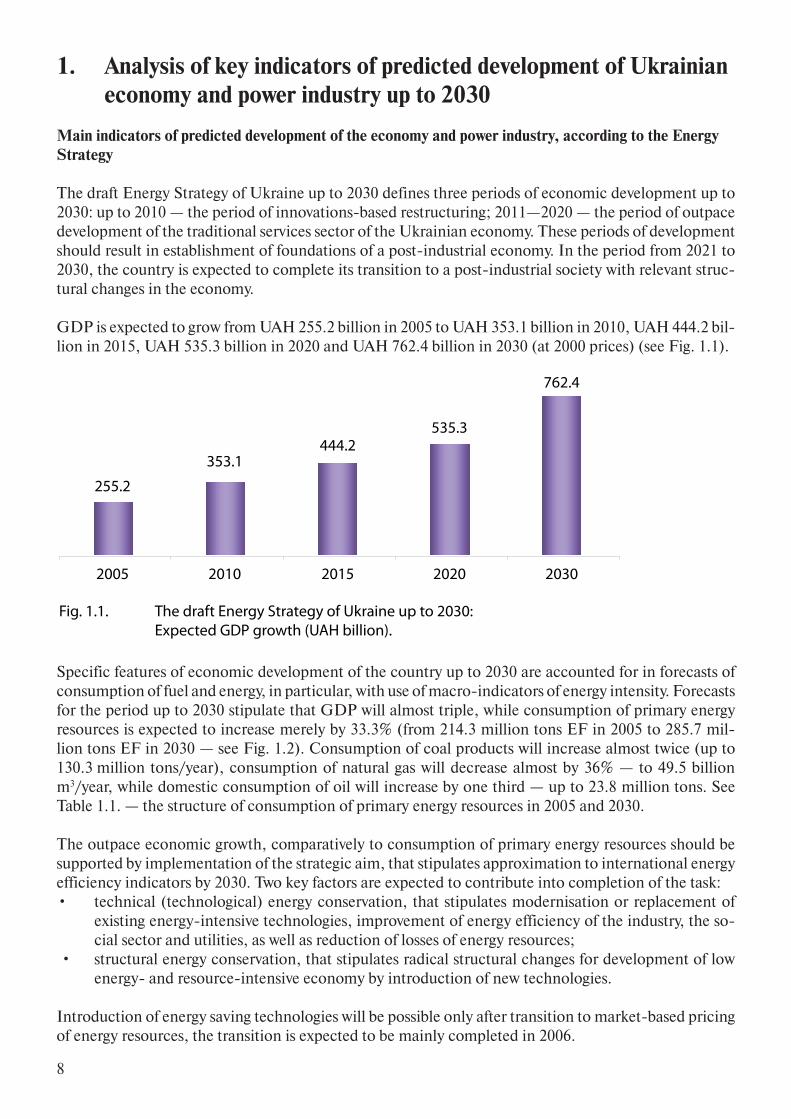
GDP is expected to grow from UAH 255.2 billion in 2005 to UAH 353.1 billion in 2010, UAH 444.2 bil-lion in 2015, UAH 535.3 billion in 2020 and UAH 762.4 billion in 2030 (at 2000 prices) (see Fig. 1.1).
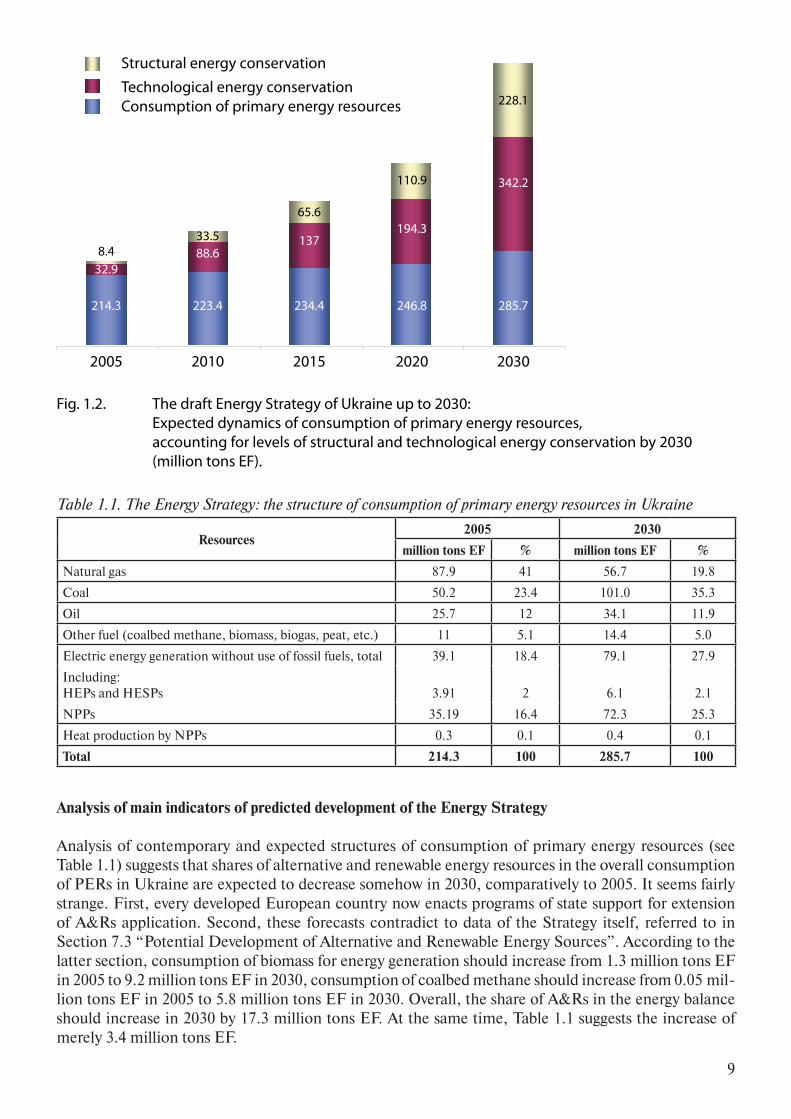
Specific features of economic development of the country up to 2030 are accounted for in forecasts of consumption of fuel and energy, in particular, with use of macro-indicators of energy intensity. Forecasts for the period up to 2030 stipulate that GDP will almost triple, while consumption of primary energy resources is expected to increase merely by 33.3% (from 214.3 million tons EF in 2005 to 285.7 mil-lion tons EF in 2030 — see Fig. 1.2). Consumption of coal products will increase almost twice (up to 130.3 million tons/year), consumption of natural gas will decrease almost by 36% — to 49.5 billion m3/year, while domestic consumption of oil will increase by one third — up to 23.8 million tons. See Table 1.1. — the structure of consumption of primary energy resources in 2005 and 2030.
The outpace economic growth, comparatively to consumption of primary energy resources should be supported by implementation of the strategic aim, that stipulates approximation to international energy efficiency indicators by 2030. Two key factors are expected to contribute into completion of the task:• technical (technological) energy conservation, that stipulates modernisation or replacement of
existing energy-intensive technologies, improvement of energy efficiency of the industry, the so-cial sector and utilities, as well as reduction of losses of energy resources;
• structural energy conservation, that stipulates radical structural changes for development of low energy- and resource-intensive economy by introduction of new technologies.
Introduction of energy saving technologies will be possible only after transition to market-based pricing of energy resources, the transition is expected to be mainly completed in 2006.
�����
����������
�����
�����
���� ���� ���� ���� ����
����������� �������������������������������������������������� � ����������������������������������
9
Table 1.1. The Energy Strategy: the structure of consumption of primary energy resources in Ukraine
Resources2005 2030
million tons EF % million tons EF %
Natural gas 87.9 41 56.7 19.8
Coal 50.2 23.4 101.0 35.3
Oil 25.7 12 34.1 11.9
Other fuel (coalbed methane, biomass, biogas, peat, etc.) 11 5.1 14.4 5.0
Electric energy generation without use of fossil fuels, total 39.1 18.4 79.1 27.9
Including: HEPs and HESPs 3.91 2 6.1 2.1
NPPs 35.19 16.4 72.3 25.3
Heat production by NPPs 0.3 0.1 0.4 0.1
Total 214.3 100 285.7 100
Analysis of main indicators of predicted development of the Energy Strategy
Analysis of contemporary and expected structures of consumption of primary energy resources (see Table 1.1) suggests that shares of alternative and renewable energy resources in the overall consumption of PERs in Ukraine are expected to decrease somehow in 2030, comparatively to 2005. It seems fairly strange. First, every developed European country now enacts programs of state support for extension of A&Rs application. Second, these forecasts contradict to data of the Strategy itself, referred to in Section 7.3 “Potential Development of Alternative and Renewable Energy Sources”. According to the latter section, consumption of biomass for energy generation should increase from 1.3 million tons EF in 2005 to 9.2 million tons EF in 2030, consumption of coalbed methane should increase from 0.05 mil-lion tons EF in 2005 to 5.8 million tons EF in 2030. Overall, the share of A&Rs in the energy balance should increase in 2030 by 17.3 million tons EF. At the same time, Table 1.1 suggests the increase of merely 3.4 million tons EF.
������������������������������
������������������������������������������������������������������������
���� ���� ���� ���� ����
�������
����
�����
�����
��������
��������
�����
����� ����� ����� ����� �����
����������� �������������������������������������������������� � ��������������������������������������������������������������� � ����������������������������������������������������������������������������������� � ������������������
10
The Strategy refers to consumption of primary energy resources in 2005 at the level of 214.3 million tons EF. If we use the above figure and expected rates of GDP growth (3 times or 4.5% of annual growth), by 2030, the overall consumption of PERs should reach 642.9 million tons EF (without accounting for structural and technological energy conservation), instead of 856 million tons EF, as the Energy Strategy suggests (285.7+342.2+228.1=856 — see Fig. 1.2). Therefore, predicted consumption of PERs in 2030 is overestimated by 213.1 million tons EF, suggesting a low quality of the document, that reason-ably allows one to question all other data and conclusions of the Strategy. The contribution of structural and technological energy conservation measures is expected to reach 570.3 millions tons EF by 2030. Let us assume that the latter figure is correct. In such a case, by means of simple deduction (642.9–570.3=72.6) one may state that in 2030, Ukraine would need only 72.6 million tons EF. If so, Ukraine would not need to construct 22 new reactor units and extend service life of 13 already operational ones. Actually, one may find errors and inconsistencies even at initial pages of the Energy Strategy.
There are another considerations, suggesting that authors of the Energy Strategy overestimated pre-dicted consumption of PERs in Ukraine by 2030: now, energy intensity of the Ukrainian GDP reaches 0.89 kg EF per $1 (PPP) or 2.6 times higher than the global average energy intensity of GDP. So high energy intensity is caused by excessive consumption of energy per unit of industrial output, that, in its turn, causes growing import of hydrocarbons to Ukraine. High energy intensity of GDP of Ukraine is associated with a substantial technological lagging in the majority of industries, in the housing and utili-ties sector, with inadequate industrial structure of the national economy, and inter alia with import/ex-port operations and influense of “shadow economy”.
If we account for the GDP growth figures of the Strategy, it is obvious that PERs demand will increase by 2030. At the same time, one may expect that energy intensity of GDP will decrease and gradu-ally it will reach global averages. In such a case it seems fairly possible that these 2 factors (i.e. GDP growth in 3 times and decrease of GDP energy intensity in 2.6 times) may partly compensate each other and consumption of PERs (without accounting for potential energy conservation) will not increase to 285.7 million toms EF/year (i.e. in 1.33 times), and might reach a lower figure, e.g. 246.5 million tons EF/year, if we apply 3/2.6 ratio. Authors of the Strategy argued that they accounted for the above fac-tor and assumed that in 2030, energy intensity of GDP will reach 0.36 kg EF/$1. If so, one can hardly understand the expected growth of overall PERs consumption to the level of 856 million tons EF/year, instead of 642.9 million tons EF/year (see above). Nobody can be sure that these considerations were taken into account, when the figure of 285.7 million tons EF/year was estimated. It is clear that the forecast of PERs consumption in Ukraine in 2030 should be reassessed downward. Any reduction of the latter figure is an additional argument for exclusion of the “nuclear” component from the Strategy (i.e. construction of 22 new reactor units and extension of service life of 13 already operational ones).
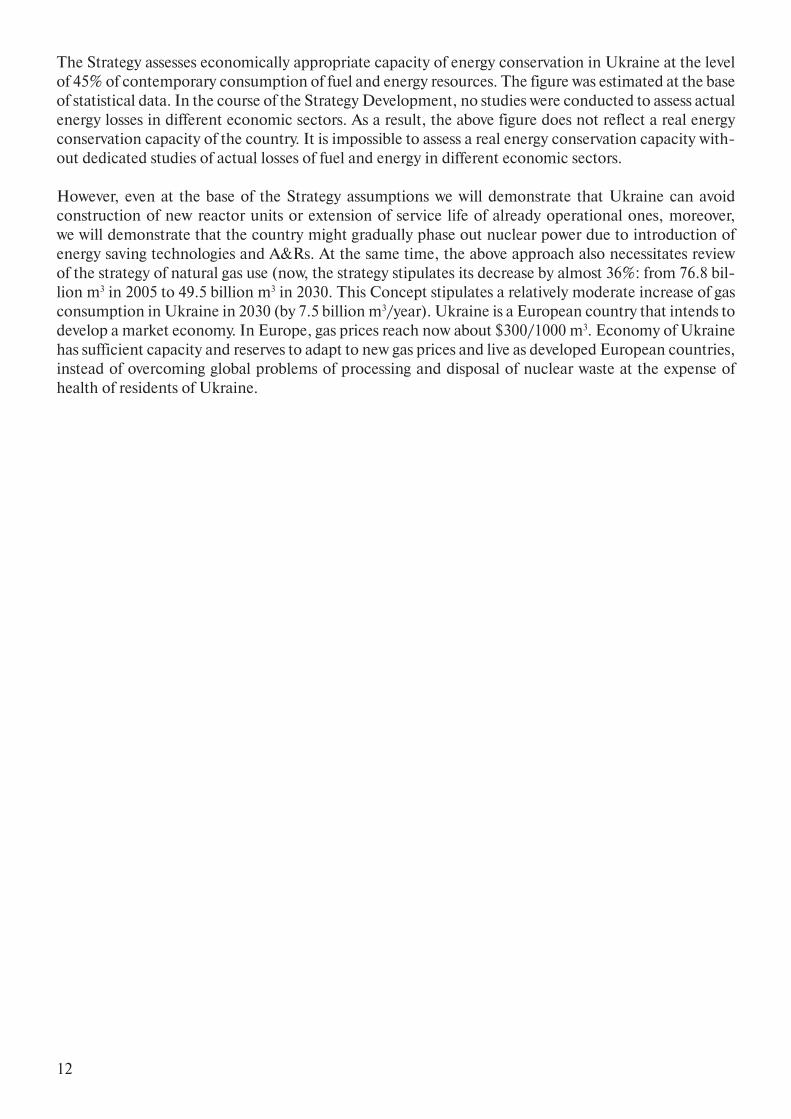
The Energy Strategy stipulates growth of electric energy generation in Ukraine from 189.2 TWh*hours in 2005 to 420.1 TWh*hours in 2030. (see Fig. 1.3). A comparison of PERs consumption and electric energy generation suggests that, in the period from 2005 to 2030, PERs consumption is expected to increase in 1.33 times, while growth of electric en-ergy generation is expected to increase in 2.22 times. One may ask about the rea-sons for such a difference. The answer may be found in Section “The Strategy of Development of Electric Power Sector”.
���� ���� ���� ���� ����
���
���
���
���
���
���
���
���
��
�
�����
������
���
����������
������
�����
�������������������������������������������������������������������� ��������������������������������������������������������������

11
Authors plan to “reduce the share of natural gas due to natural enhancement of estimated generating capacity of NPPs...” by 2030. Overall consumption of fossil fuel for generation of heat energy by power plants and boilers should decrease from 43.3 million tons EF in 2020 to 26.2 million tons EF in 2030 (i.e. by 17.1 million tons EF annually) due to “intensive introduction of heat pumps and electric heat storage appliances in the period from 2016 to 2030”.
The amount of 17.1 million tons EF/year corresponds to generation of 139.21 TWh*hours/year by NPPs or (approximately) to annual generation of 11 NPP reactor units with capacity of 1500 MWh each: 1500 MWh × 8700 hours/year × 11 = 143.55 TWh*hours/year.
Correspondingly, the draft Energy Strategy of Ukraine up to 2030 stipulates construction of 11 NPP reactor units with capacity of 1500 MWh each at new sites in the period from 2013 to 2030. Therefore, authors of the Strategy propose to reduce the share of fossil fuel in generation of heat energy (by switching to electric heating) and generate the necessary additional electric energy by expansion of nuclear generat-ing capacity.
In connection with the expected electric power demand in Ukraine, it is appropriate to refer to the example of the Czech Republic. Electric energy consumption and generation figures for the country, for 15 recent years, are shown at Fig. 1.4. As it is well known, the Czech Republic belongs to the most economically successful post-communist countries and recently is was classified as a developed country. The Czech Republic has already undergone processes, that Ukraine expects to undergo. As can be seen, in 1990, electric energy consumption in the Czech Republic reached 53,037 GWh*hours, in 2005, it in-creased to 57,664 GWh*hours or in 1.09 times. If we extrapolate the trend to 30 years ahead, the growth will reach 1.19 times. In the period from 1990 to 2005, electric energy generation in the Czech Republic increased in 1.3 times. The Czech example suggests that the Energy Strategy substantially overestimated electric energy consumption and generation figures for Ukraine in 2030.
In this document we do not attempt to check all approaches and figures of the Strategy, however, they also give some room for doubt.
�����
�����������������������������������������������������������
������
���
��������������������������������������������������������������������������������������������
12
The Strategy assesses economically appropriate capacity of energy conservation in Ukraine at the level of 45% of contemporary consumption of fuel and energy resources. The figure was estimated at the base of statistical data. In the course of the Strategy Development, no studies were conducted to assess actual energy losses in different economic sectors. As a result, the above figure does not reflect a real energy conservation capacity of the country. It is impossible to assess a real energy conservation capacity with-out dedicated studies of actual losses of fuel and energy in different economic sectors.
However, even at the base of the Strategy assumptions we will demonstrate that Ukraine can avoid construction of new reactor units or extension of service life of already operational ones, moreover, we will demonstrate that the country might gradually phase out nuclear power due to introduction of energy saving technologies and A&Rs. At the same time, the above approach also necessitates review of the strategy of natural gas use (now, the strategy stipulates its decrease by almost 36%: from 76.8 bil-lion m3 in 2005 to 49.5 billion m3 in 2030. This Concept stipulates a relatively moderate increase of gas consumption in Ukraine in 2030 (by 7.5 billion m3/year). Ukraine is a European country that intends to develop a market economy. In Europe, gas prices reach now about $300/1000 m3. Economy of Ukraine has sufficient capacity and reserves to adapt to new gas prices and live as developed European countries, instead of overcoming global problems of processing and disposal of nuclear waste at the expense of health of residents of Ukraine.

13
2. Risks of the “nuclear” scenario of development of the power industry of Ukraine
The draft Energy Strategy of Ukraine up to 2030 stipulates increase of electric energy generation by NPPs in 2.3 times in 2030, comparatively to 2005 — from 94.4 to 219.0 billion kWh*hours/year (see Fig. 2.1). To this end, in 2030, Ukraine must have 29.5 GWh of installed NPPs generating capacity. The Strategy stipulates to increase the generating capacity by construction of 22 new reactor units: 2 additional units at Khmelnitsk NPP (1 GWh each), 9 reactor units to replace already operational ones that will be gradually decommissioned (10.5 GWh in total), 11 reactor units at new sites with the overall generating capacity of 16 GWh. Besides that, the Strategy stipulates extension of service life of 13 already operational reactor units. These measures are substantiated by the need to maintain in 2005—2030, the share of NPPs in the overall electric energy generation at the level of 2005 (i.e. about 52% of the overall annual electric energy generation in Ukraine).
Authors of the Strategy argue that reduction of the share of natural gas for heat energy production “due to natural enhancement of estimated generating capacity of NPPs..,” serves as the key argument for maintaining such high contribution of NPPs. First, it is not clear why Ukraine chooses the option of gas consumption reduction as the only response to the increase of gas prices to the European levels. If we account for major investments necessary for development of nuclear power and associated infra-structures, decommissioning of NPPs, etc. gas would remain an attractive fuel even after major price increases. Second, the proposed replacement means that some generated electric energy will be used for production of heat energy. However, in the case of electric energy generation with use of fossil fuel, electric heating is considered as the least efficient option. In the case of expansion of nuclear generating capacity, as the Strategy stipulate, Ukraine will have excessive generating capacity that might (theoreti-cally) be used for heating and hot water supply. However, even in such a case, situation is ambiguous.
����� �������
���
���
���
���
���
���
���
���
��
�
����� ����� ����� ����� �����
������
���
�����
���������� �������������������������������������������������� � ������������������������������������������������������������������������

14
Ukrainian NPPs as future exporters of electric energy to Russia?
Potentially substantial excessive electric energy, generated by new reactor units is expected to be export-ed. The Government of Ukraine makes statements on the need to develop export capacity of the pow-er industry of Ukraine, ignoring such serous obstacles as fierce competition with Bulgaria, the Czech Republic, Slovakia and Romania, that also intend to export electric power. The latter countries have better chances to operate at the European power market due to their status of EU member-states, lower power transmission costs, etc.
General increase of electric energy consumption would mean higher fluctuations of daily and annual demand. As NPPs are not reactive, it would be increasingly difficult to smooth differences between peak demand and falls in conditions of higher shares of nuclear power in the overall generation capac-ity. In early 1990s, the share of installed capacity of nuclear power plants reached 30% and demand fluctuations were easily compensated by thermal power plants and HEPs. Shares of NPPs grew only at the expense of decommissioning of thermal power plants. Now excessive electric energy, generated by Ukrainian NPPs is exported ... to Russia. Therefore, if generating capacity of NPPs will increase, Ukraine will become increasingly dependent on energy export to Russia — should Russia refuse to buy Ukrainian electric energy, the Ukrainian power industry will be face serious negative consequences.
Technological and economic risks of the “nuclear renaissance”
There is a serious technological obstacle for implementation of the scenario of construction of 11 addi-tional reactor units to replace 17.1 million tons EF for heating purposes. The obstacle is associated with the need of radical modernisation of existing power supply networks. In the majority of cases, existing power supply networks cannot operate at higher currents, necessary in the case of a broad application of electric heating. For example, an average flat with floor space of 80 m2 needs estimated heat energy sup-ply in winter seasons at the level of 8 kWh. Now the heat supply is provided by district heating networks. In the majority of cases, wiring of average residential houses allows to supply about 2—3 kWh of electric power. In other words, a large scale switch to electric heating would necessitate increase of operational loads of power supply networks in more than three times. Associated costs should be adequately ac-counted for in the Energy Strategy.
Ideas of the Strategy, associated with application of heat pumps and heat storage installations (for con-sumption of cheaper electric energy at night-time tariffs) also were not duly explored. It is absolutely clear, that their introduction would also require high investment costs, that should be accounted for in costs of “heat energy”, generated by NPPs. In the case of heat pumps, costs of 1 kWh of a heat pump installed capacity reach about $200—300. Even if a half of electric energy, generated by newly built re-actor units will be used by heat pumps, associated costs will exceed $2 billion.
Development of the national nuclear fuel cycle is too expensive and requires major investments. Due to long-term construction works in nuclear power industry, provision of loans to such facilities is not an at-tractive option for finance institutions and banks. As for construction of new reactor units themselves, a large time gap between their design and construction (6—10 years) results in technological lagging, as it is fairly possible that new, more efficient and safe technologies would be developed in the period of time from today’s completion of design of nuclear power facilities to their final commissioning after multi-billion investments. This is particularly true for WWER reactors, designed in 1970s. In other words, they rely on technologies that will be 60 years old by 2030, moreover, use of WWER reactors presumes a complete dependence on Russia. The Strategy stipulates terms of construction of 4—6 years — these figures seems unrealistic if we account for experience of other countries. Rush construction works are always prone to low quality, and as a result, to high risks of accidents. All NPP construction projects,
15
that have been implemented in 15 recent years proved to be more expensive and took more time than initially planned.
Generally, major costs, associated with use of nuclear power, are not accounted for in relevant cost esti-mates. Such costs include large scale investments necessary for development of infrastructures for man-agement of radioactive waste, including their collection, transportation, treatment and final disposal. Every stage of management of radioactive waste is associated with risks of radiation exposure, releases of radioactive substances and unauthorised use (terrorism). Management of radioactive waste in Ukraine is almost non-existent. The nuclear power industry expects public funding for waste management pro-grams (i.e. state subsidising of one of power producers). Such an approach has nothing in common with principles of a liberal market, that Ukraine seeks to develop.
Dependence of the “nuclear” scenario of development of the power industry of Ukraine on Russia
The key political risk of the nuclear scenario of development of the power industry of Ukraine is associ-ated with the fact of potential threat of almost complete dependence on Russia as a supplier of nuclear fuel, similarly to the situation with natural gas. Ukraine has only one raw material (uranium), but now Ukrainian uranium allows to meet only 30% of the nuclear power industry demand. The rest is supplied by the Russian party. Ukraine does not have a complete nuclear fuel cycle at the national territory, while its development would require major additional resources that are simply unavailable. Ukraine does not have technologies and capacity for processing and final disposal of irradiated nuclear fuel (INF) and radioactive waste (RW). The problem of safe management of INF and RW is a priority that necessitates major investment. Nuclear fuel elements are also supplied by Russia. Authors of the Strategy recognise all these facts and they propose a series of measures to overcome associated problems. Unfortunately enough, their proposals generally seem to be absolutely unconvincing and declarative, moreover, they often propose to develop brand new technologies. For example, they only recognise the need “to de-velop, by 2010, key technical solutions for the system of long-term management and storage of RW and implement priority actions that should ensure reception and management of high-activity RW, returned from the Russian Federation”. As for the problem of INF, they even propose to postpone addressing of the problem, referring to “long-term (50 year or more) storage of INF, pending deci-sion-making on its processing or final disposal”. This means a loan with unknown but extremely high interests, that contemporary Ukrainian authorities plan to pay at the expense of Ukrainians who will live here 50 years later (naturally, without seeking their consent). Situation with fuel assemblies seems fairly similar. The Strategy stipulates to undermine positions of the only monopolist supplier of nuclear fuel (Russia) and to diversify suppliers. However, such a process is extremely complicated and now it is only at the stage of studies. A transition of fuel elements of other suppliers might require several decades and major investments.
As for plans to use nuclear fuel of distant suppliers (e.g. US), one can hardly even estimate risks of transportation of large amounts of nuclear fuel by air/sea. Moreover, use of non-Russian fuel in Russian reactors annuls warranties of producers, designers and scientific supervisors of Russian equipment.
Security of NPPs operations: old and new risks
Security of NPPs operations represent another problem. Higher numbers of operational reactor units mean higher potential health and environmental risks, regardless all statements on environmentally safe NPPs operations and relentless improvements of radiation control and monitoring systems. At average, two accidents per month are registered at NPPs of Ukraine (34 accidents in 2005).
The long awaited technological breakthrough in nuclear power industry has failed to materialise. So far, there are no reactors that are safe due to their design principles. All nuclear reactors that operate and

16
will operate in Ukraine, slowly burn nuclear fuel. As a result, the human factor still remains relevant, as to err is human. A human error at an operational NPP would entail much higher costs comparatively to human errors in other spheres. All Ukrainian NPPs face a common problem of intake of water from surface water bodies to compensate evaporation in cooling ponds and towers. These processes result in reduction of river drain. For example, we may list possible accidents associated with design of NPPs, that may generate disastrous consequences for the whole country:• uncontrolled chain reaction;• accident release of coolant from the first circuit;• complete switch-off of power supply at NPPs and other nuclear facilities in the case of simultane-
ous emergency switch-off of their stand-alone power supply units.
All Ukrainian NPPs face a common problem of intake of water from surface water bodies to compen-sate evaporation in cooling ponds and towers. These processes result in reduction of river drain. For example, according to local residents, Khmelnitsk NPP, that operates a cooling pond, continuously pumps water from the Goryn — the main river of Rivne Oblast. Initially, according to the NPP design, the NPP was expected to pump waster from the river only in low water seasons. As a result, water levels and water quality in the Goryn river substantially decreased.
In 1996, the State Committee for Water Management reviewed the adjusted project of construction of Tashlyk HESP (THESP) and had concluded that the project failed to address problems of water avail-ability, safe water use and water protection in the downstream section of the Southern Bough. A hydro-environmental assessment of environmental impacts of activities of THESP construction project and further development of the South Ukraine NPP suggested that these projects should not be implement-ed due to their adverse environmental impacts in the region. Now, the South Ukraine NPP actually operates a once-through water supply system in violation of Article 96 of the Water Code of Ukraine; incorporation of the NPP cooling pond (Tashlyk water reservoir) to the integrated water system of Oleksandrivka water reservoir (HEP-HESP) results in establishment of an once-through system of wa-ter supply at the Southern Bough river (the river is the water supply source for the most environmentally and socio-economically depressed zone of the Southern Ukraine). All these developments violate the due water management and environmental legislation of Ukraine.
According to the UN classification, Ukraine is considered as a country with insufficient water resourc-es, moreover, water resources are unevenly distributed at the territory of the country. As a result, nuclear power industry poses a threat to natural resources of Ukraine.
As an example of ignoring geological risks in the course of NPPs siting we may refer to Rivne NPP. The NPP faces major problems, as it was constructed at karst rock. After completion of construction works at the site, land subsidence processes started. As a result, in 1980s, large Zdolbunivskiy Cement Plant for more than a year produced cement only to fill karst cavities by concrete. At that time, soil subsidence proceses were stopped. However, nobody can guarantee that these processes would not resume after initiation of further construction works.
The Strategy states that “the collective radiation dose of the population of Ukraine, associated with electric energy generation by thermal power plants is much higher that the dose associated with electric energy generation by NPPs”. However, the statement is associated with situation in 1990s, when rep-resentatives of the nuclear power industry actually blackmailed the Government by potential accidents and got all possible financing, leaving nothing for modernisation of thermal power plants. Nothing to say that thermal power plants are located closer to major cities, while uranium mines and associated facilities are not considered as constituents of the process of “electric energy generation by NPPs”.

17
Besides that, only one NPP accident might cause an environmental disaster with consequences for several decades, as it happened once at the Chernobyl NPP in April 1986. At the same time, now it is the state budget that bears the finance burden of decommissioning of the Chernobyl NPP and upgrade of “Shelter” facility to the level of an environmentally safe system, while “Energoatom” Co. dreams now about new assets for construction of new NPPs. Modern terrorism-associated risks necessitate a particular attention to risks of accidents at nuclear power facilities.
Problems of radioactive waste, irradiated nuclear fuel, uranium mining and processing waste
The increase of installed generating capacity of NPPs cannot be considered as a “natural” or “cheap” solution, as the problem of radioactive waste still remains unresolved in the World, while in Ukraine the problem is already extremely acute. Now, according to official data, operational NPPs have generated 858 thousand m3 of high-activity RW and 3783 tons of INF. Representatives of the nuclear power indus-try intend to pass the burden of radioactive waste management to future generations.
Management of INF represent an equally complicated problem of the nuclear power industry. Ukraine has not established an integrated system for management of radioactive waste and spent nuclear fuel, as the relevant legislative provisions (Law of Ukraine on Management of Radioactive Waste) and in-ternational commitments of Ukraine demand. Now, Ukraine does not invest into development of a national infrastructure for safe final disposal of RW and INF. So far, rates of accumulation of RW stockpiles in Ukraine substantially exceed the available capacity for their disposal. According to pre-liminary estimates at the base of experience of other countries where similar reactors operate, costs of comprehensive technical solutions for management of RW and INF for one WWER-1000 type reactor, reach about $10—20 million/year. At the same, specialists argue that such measures are possible only if the State Fund for Radioactive Waste Management will be established and electric energy tariffs will be raised, including tariffs for residential consumers. The official Strategy also associates higher tariffs with “financing of programs of management of INF, extension of service life of operational reactor units, accumulation of reserve funds for their decommissioning, construction or replacement and new generation capacity, development of national elements of the nuclear fuel cycle”. But is it appropriate to use such a limited and socially sensitive resource as the rise of energy tariffs for these purposes? Nobody asked the country’s citizens on these matters.
As for Ukrainian INF, up to 2010, all irradiated fuel will be transported to Russia for processing, ac-cording to the inter-governmental treaty. Every year, “Energoatom” Co. spends $60—120 million for transportation of Ukrainian INF to Russia. Since 2010, all radioactive wastes, that were generated by processing of our INF in Russia, will be returned to Ukraine. It is worth to note, that processing of 1 ton of INF generates 7.5 tons of solid and 2200 tons of liquid RW, that must be processed and safely dis-posed. Today, Ukraine has not disposal facilities for INF (INFD). All irradiated fuel is stored on-site, in cooling ponds and on-site storages. These facilities have limited storage capacity and do not meet secu-rity requirements. The project of development of INFD-2 at the site of the Chernobyl NPP has actually failed. The project was financed by a donor organisation from the Nuclear Safety Fund. The Fund was managed by EBDR (EBRD contributed €68.47 million, while Ukraine contributed €35.94 million). At the same time, actual costs of construction of INFD-2 have already reached €95 million and the figure is expected to increase further. According to recent estimates, it is necessary to invest the same amount of money to make this “monument” operational (initial plans stipulated that the facility would become operational in 2003).
The new INFD project was not a subject of public discussion and it gradually becomes more and more scandalous.

18
There is another problem as well — uranium mining and processing waste. The Eastern Uranium Mining Plant has already accumulated 65.5 million m3 of radioactive waste with the overall activity of 120 thousand Ci, while 9 tailing dumps of Prindniprovskiy Chemical Plant contain 36 million m3 of RW with the overall activity of 75 thousand Ci. Waste management at uranium mining and processing plants is particularly complicated in cases when relevant production facilities do not exist any more, as at the former Prindniprovskiy Chemical Plant. Now, 9 tailing dumps of Prindniprovskiy Chemical Plant contain 36 million m3 of RW of uranium ore processing operations with the overall activity of about 75 thousand Ci. The majority of these tailing dumps stay idle, they were not decommissioned and ad-versely affect the environment and health of personnel and local residents. Ore processing operations at the plant were cancelled 14 years ago, however, reclamation works were not launched and only in 2005 some studies were initiated at the site. From the finance allocations, stipulated by the State Program (UAH 5.2 million), only UAH 2.6 million were actually disbursed (or 50%). The Budget of 2006 stipu-lates allocations of UAH 120 million.
A conservative cost estimate for management of low-activity RW (separation, conditioning, packag-ing, transportation and final disposal) suggests $50 per 1 dm3 of radioactive waste1 (figures of 2000). However, there is no available information on overall stockpiles of RW with different activity levels, that substantially complicates any independent assessment of associated waste management costs.
Transportation of radioactive waste and nuclear materials
Operations of nuclear power industry are associated with transportation of large amounts of nuclear materials (uranium ore, enriched uranium, fuel assemblies, spent fuel, radioactive waste, etc.). Larger numbers of NPPs and nuclear facilities mean more transportation operations, higher amounts of cargo and, correspondingly, higher risks.
There is a range of transportation-related risks. First, there are risks of damage of transport contain-ers in the course of accidents (inc. loading, transportation and discharge operations), associated with radiation exposure of personnel and local residents, and environmental contamination. Second, terror-ists may get access to radioactive materials for a “dirty bomb”. Third, in the course of transportation, nuclear materials are particularly vulnerable to terrorist attacks. For them, it is the simplest method of delivery of a “dirty bomb” to the target, as nuclear operators themselves deliver their cargo to human settlements. Radioactive materials are transported by the same roads as passengers, who are not spe-cially protected. Regardless a particular nuclear fuel supplier, these problems will inevitably increase. Development of national fuel production capacity would result in a substantial growth of transportation operations and amounts of nuclear cargo. The alternative plans, that stipulate supply of US nuclear fuel seem even more risky if we account for the need to use ships or even planes for these purposes.
Therefore, expansion of generating capacity of NPPs is not the best possible scenario for development of the power industry of Ukraine.
The Energy Strategy of Ukraine stipulates huge investments into development of nuclear power sector by 2030 (UAH 198.3 billion plus UAH 21.7 billion for development of the nuclear fuel cycle). These funds are allocated as follows:• modernisation, reconstruction and improvement of safety standards of operational NPPs, man-
agement of RW and INF — UAH 5.5 billion;• extension of service life of NPPs — UAH 6.4 billion;• decommissioning of NPPs reactor units — UAH 7.0 billion;
1 The annual report of UkrDO “Radon” (2000).

19
• commissioning of new reactor units and decommissioning of reactor units that exceeded their design service life and the extended service life terms — UAH 179.4 billion;
• development of uranium and zirconium production facilities, ensuring production of uranium concentrate at the level of full demand of NPPs — UAH 20.4 billion;
• construction of a plant for production of nuclear fuel — UAH 1.3 billion.
The above cost breakdown does not reflect real costs of construction of new reactor units, decommis-sioning of old ones and management of RW and INF (inc. separation, conditioning, packaging, trans-portation and final disposal). The state budget annually allocated UAH 250 for maintenance of the idle Chernobyl NPP, while it is “Energoatom” that should pay these costs.
It seems more appropriate to allocate at least some part of these funds for development of renewable en-ergy and introduction of energy saving and energy efficient technologies instead of constructing 22 new reactor units.

20
3. Energy strategies of European countries
Examples of developed European countries suggest that there are real alternatives to the “nuclear” op-tion of power industry development even in conditions of stable GDP growth and associated demands in heat and electric energy.
Development of renewable energy in EU counties is facilitated by “White paper” program and a series of EC Directives on: • doubling the share of renewable energy in the overall energy consumption of EU countries (from
5.4% in 1997 to 12% in 2010);• facilitation of growing shares of electric energy generation from renewables, from 14% in 1997 to
21% in 2010 in 25 EU countries (Directive 2001/77/EC);• facilitation of growing shares of transport bio-fuels to 5.75% by 2010 to 20% by 2020 due to re-
placement of mineral diesel oil and petrol (Directive 2003/30/EC) and by granting tax exempt status to bio-fuel producers (amended Directive on taxation in the sphere of power industry and electric power generation (Directive 2003/96/EC)).
Notwithstanding these ambitious plants, the European Union even now reviews its targets and plans to increase the share of renewable energy in the overall energy consumption of EU countries to 20% by 2020 (in particular, the German Government proposed to set the EU target as 30%, and set the target for Germany at the level of 40%).
Except the “White paper” program, in 2003, the European Commission (Research DG) contracted a research on joint activities in the sphere of study and improvement of non-nuclear power technolo-gies — “Non-Nuclear Energy Research and Technological Development (NNE-RTD)”. The research results should provide information to politicians of EU member-states, associated members and the EC on contemporary state of affairs in Europe in the sphere of study and improvement of non-nuclear power industry technologies.
These research studies, that covered 33 European countries, were implemented by Technopolis from September 2003 to September 2004. In addition, data of the International Energy Agency allow to es-timate that all countries (except the EC) spend annually about €1 billion for research and improvement of non-nuclear power technologies (public financing), while the EC budget reaches about 1/5 of the figure. According to the same Agency, Japan spends about the same amount for similar research, while the US spending is at least twice higher.
Such EU policies suggest reduction of shares of nuclear power and increasing contribution of renewa-bles and energy efficiency.
For example, now Germany generate more energy from renewables than NPPs generate (for several recent years the share of nuclear energy in the overall energy consumption in the country did not exceed 6%). At the same time, in 2005, the share of wind power, solar power, biomass and geothermal energy reached 6.8% of the overall consumption of electric energy, heat energy and fuel. In electric energy generation, nuclear power plants provide now 17.1%, while renewables contribute 21%.
Let us consider another example. Now, Sweden is the only country that intends to develop an oil-free economy. In late 2005, the Government of Sweden set 15-years period for transition to renewable en-ergy (use of local bio-fuel without further development of the nuclear power sector).In addition to general EU targets, almost every EU member-country enacted its own legislative acts on development of renewable energy:

21
• In Germany, in 2004, the Act on Renewable Energy was passed, the Act stipulates that power sup-ply utilities are obliged to buy electric energy generated from renewables at set tariffs. In addition separate tariffs were set for different types of renewables to stimulate development of the sector;
• In Italy, a new law on green energy, stipulates that instead of subsidies for equipment purchase, finance support will depend on energy generation;
• The UK Government extended terms of the Renewable Energy Commitments for 5 additional years and increased the target for the share of renewable energy. As a result, electric energy suppli-ers should generate 15.4% of the national electric energy supply from renewables.
Official statistics of the EU countries clearly demonstrates substantial changes in the power sector in 4—5 recent years. The tables below show electric energy generation figures for three nuclear countries of the EU. These figures reflect real intentions of the European Union to attain its targets of development of renewable power and energy conservation at the expense of reduction of nuclear power.
Table 3.1. Electric energy generation in France
Components 2001 2004
Nuclear power 75% 55%
Hydropower 13.5% 22%
Fossil fuel (coal, gas) 10.5% 22%
Renewables 1% 1%
Table 3.2. Electric energy generation in Germany
Components 2001 2004
Nuclear power 29% 17.1%
Coal 52% 40.3%
Gas 10% 15.6%
Oil 6%
Cogeneration 3%
Renewable energy 6% 21%** including hydropower — 6.5%
Table 3.3. Electric energy generation in Spain
Components 2001 2004
Nuclear power 27% 11%
Coal 31% 31%
Oil 11% 11%
Hydropower 18% 23.6%
Wind power and solar energy 3%
Renewable energy 23.4%*
Other 10%* including wind power — 11.71%

22
4. Main energy conservation measures
There are several priority energy conservation options that would allow to reduce consumption of natu-ral gas substantially and to improve general efficiency of energy generation:• application of renewable energy sources;• introduction of cogeneration technologies;• reduction of heat and electric energy losses in the course of energy generation, transportation and consumption;• utilisation of discharge heat of boilers;• utilisation of industrial gases;• utilisation of coalbed methane;• reconstruction of gas transportation systems;• utilisation of pressure of natural gas.
Implementation of all these measures would result in direct reduction of natural gas consumption for more than 21 billion m3/year, or in replacement of planned NPPs generation capacity. Overall, these measures would allow to replace about 71 million tons EF (see Table 4.1). Necessary associated invest-ments would reach about UAH 302 billion (including about UAH 176.5 billion, already stipulated by the Energy Strategy). Therefore, the additional costs reach only UAH 125.5 billion or much lower that the amount of necessary investments, allocated in the Strategy for development of nuclear power and the nuclear fuel cycle (UAH 220 billion in total).
It is worth to note that modernisation of power distribution networks and reconstruction of the gas trans-portation system are necessary to ensure normal functioning of the country, while energy conservation effects of these measures may be considered as secondary. These works have been already incorporated into the Energy Strategy and will be implemented regardless a particular scenario of development of the Ukrainian power industry.

23
Tab
le 4
.1. P
oten
tial c
apac
ity o
f ene
rgy
cons
erva
tion
tech
nolo
gies
and
nec
essa
ry in
vest
men
tsTe
chno
logi
esTo
tal c
apac
ity
Rep
lace
men
t of
fo
ssil
fuel
, m
illio
n to
ns E
F
Dir
ect
redu
ctio
n of
nat
ural
gas
co
nsum
ptio
n,
billi
on m
3 /yea
r
Ele
ctri
c en
ergy
ge
nera
tion
, T
Wh*
hour
s
Nec
essa
ry
inve
stm
ents
, UA
H
billi
on
Bio
-ene
rgy:
— i
ntr
oduc
tion
of f
ood,
str
aw a
nd
peat
-
fi
lled
boile
rs—
bio
gas
prod
ucti
on a
nd
use
9,07
0 M
Wh
T
731
MW
hT +
405
MW
hE
5.72
1.57
5.0
1.36
3.39
2,41
21,
869
Oth
er r
enew
able
s—
win
d po
wer
— s
olar
hea
ters
— p
hot
ovol
taic
s—
geo
ther
mal
pow
er—
min
or H
EP
s
11,2
90 M
Wh
E
50,0
00 м
2 of s
olar
col
lect
ors
797
MW
hE
1,86
4 M
Wh
T
1,32
1 M
Wh
E
8.68
2.27 0.7
1.09 1.3
2.24
0.94
25 2.0
3.7
60,9
661,
262
16,1
086,
545
11,8
93C
ogen
erat
ion
5,00
0 M
Wh
E8.
1218
.914
,187
Red
ucti
on o
f ene
rgy
loss
es:
— m
oder
nis
atio
n o
f mun
icip
al b
oile
rs—
rep
laci
ng
of o
ld h
eati
ng
pipe
s by
pr
ein
sula
ted
new
pip
es—
in
the
cour
se e
ner
gy c
onsu
mpt
ion
— m
oder
nis
atio
n o
f ele
ctri
c po
wer
di
stri
buti
on n
etw
orks
7,50
0 bo
ilers
7,50
0 km
tran
smis
sion
lin
es: 5
.2 th
ousa
nd
km
(330
—75
0 kV
); 1
1,75
0 M
VA
of t
ran
sfor
mer
s ca
paci
ty**
2.96
3.16 18 9.45
2.55
2.72
27
2,19
2
3,62
31,
440*
82,8
00*
Uti
lisat
ion
of c
oalb
ed m
etha
ne32
0 M
Wh
E0.
930.
82.
681,
344
Rec
onst
ruct
ion
of t
he g
as t
rans
port
atio
n sy
stem
11.6
thou
san
d km
of g
as d
istr
ibut
ion
net
wor
ks;
4.9
thou
san
d ga
s re
gula
tion
faci
litie
s; 2
30 g
as
com
pres
sor
unit
s***
3.48
3.0
92,4
00*
Uti
lisat
ion
of d
isch
arge
hea
t7,
500
boile
rs2.
962.
5575
0U
tilis
atio
n of
indu
stri
al g
ases
2.32
2.0
14.1
71,
000
Uti
lisat
ion
of n
atur
al g
as p
ress
ure
84 in
stal
lati
ons
0.49
1.41
1,01
0T
OT
AL
73.2
23.1
698
.25
301,
801
*
da
ta o
f th
e E
ner
gy S
trat
egy
of U
krai
ne
up to
203
0;
**
a
min
imal
est
imat
e ac
cord
ing
to d
ata
of th
e E
ner
gy S
trat
egy.
In
gen
eral
, th
ere
are
plan
s to
mod
ern
ise
and
deve
lop
all p
ower
sup
ply
net
-w
orks
, acc
oun
tin
g fo
r m
easu
res
for
inte
grat
ion
of t
he
IES
of U
krai
ne
wit
h p
ower
sup
ply
syst
ems
of E
urop
ean
cou
ntr
ies;
**
*
a m
inim
al e
stim
ate
acco
rdin
g to
dat
a of
the
En
ergy
Str
ateg
y.

24
5. Renewable energy sources
At the contemporary stage, the problem of integration of the national economy of Ukraine to the global economy is fairly relevant for the country, as the integration would provide some benefits due to partici-pation in the international division of labour. Further development of international economic co-op-eration of Ukraine necessitates introduction of an energy policy that would be compatible with energy policies of leading countries of the World, particularly the EU member-states. Inadequate energy poli-cies and practical actions of Ukraine might discriminate us in this sphere.
EU countries have opted to reach sustainable development. In the sphere of power industry they make serious efforts to improve their energy security, to expand utilisation of domestic renewable resources and to reduce adverse environmental impacts of power industry. In the period up to 2010, EU countries seek to increase the share of renewables to 12% of the overall consumption of primary energy resources (estimated according to the replacement principle). Implementation of these plans and major techno-logical successes, particularly in the sphere of wind power and biomass energy, induce them to set more ambitious targets. It is clear that transition to sustainable development would require improvements in the sphere of energy efficiency and switching to a large-scale development of renewable energy.
In their forecasts of future economic and power industry development at the base of modern efficient technologies, independent experts suggested possible complete or partial replacement (depending on a particular region) of fissile fuel and nuclear power by renewable energy sources. In the case of ac-celerated application of technically feasible renewable energy resources, the power industry of Ukraine would develop at the same technological and technical base as EU countries.
Fig. 5.1 shows a potential growth of utilisation of renewable energy sources up to 2050, at the base of technically feasible Ukrainian resources. The overall utilisation of renewables would reach about 100 TWh*hours/year in 2030 and 200 TWh*hours/year in 2050. Hydropower, wind power and forest/agricultural biomass are expect-ed to make the highest contribu-tion.
It is worth to note that impor-tance of individual renewable energy technologies depends also on amounts of traditional energy resources they can re-place. HEPs, wind farms and solar panels may generate three times higher amounts of electric energy, comparatively to proc-esses of fossil fuel burning. These technologies allow to generate electric energy without interme-diate use of thermal energy as in the case of fossil fuel burning. Fig. 5.2 shows amounts of fos-sil fuel that would be replaces due to expansion of utilisation of renewable energy resources. In 2030, realistic annual utilisa-tion of renewables may replace
�
��
��
��
��
���
���
���
���
���
���
���
���� ���� ���� ���� ���� ����
�������������
����������
����������������
������
����������
����
���������
����������
������
���������
���������� ���������������������������������������������������������� ������������������������������������������������������

25
equivalent of 20 million tons EF of fissile fuel and nuclear power (and up to 42 million tons EF by 2050).
These data suggest that the con-temporary generation capacity of NPPs (about 94 TWh*hours/year, or fossil fuel equivalent of 35 million tons EF/year), may be replaced in the future by electric energy generation from renew-able sources.
Transition to intensive utilisa-tion of renewables would allow to resolve a range of problems. associated with environmental contamination and the global warming, to mitigate the threat of economic/energy crises.
5.1. Bio-energy
Bio-energy is one of the most promising constituents of renew-able energy resoures in Ukraine. Bio-energy incorporates utilisation of organic biomass of plant and ani-mal origin (wood, straw, agricultural residues, manure, etc.). Besides that, biomass incorporates organic components of solid household waste and (sometimes) peat. Energy applications of biomass mainly rely on solid biomass fuel and liquid or gaseous products (biogas, bio-diesel oil, bio-ethanol). Biomass is a renewable, environmentally clean fuel, that does not intensify the global greenhouse effect.
Now, biomass is the fourth most important fuel in the World, that provides about 2 billion tons EF/year or about 14% of the overall global consumption of primary energy resources (in developing countries, biomass shares may be higher — about 30%, and sometimes as high as 50—80%). In Europe, average shares of biomass fuel of the overall consumption of primary energy resources reach more than 3%. Some countries substantially exceed these average indicators: e.g. Finland — 23% (the country in the World leader in biomass use), Sweden — 18%, Austria — 12%, Denmark — 8%, Germany — 6 %.
Development of bio-energy is a fairly relevant option for Ukraine with its major resources of available biomass fuel (about 24 million tons EF/year) and peat (about 0.6 million tons EF/year) (see Table 5.1). The range of main contributors incorporates straw and other agricultural waste (stalls, corncobs, husk, etc.), as well as wood waste, liquid types of biomass fuel, different types of biogas and fuel trees. Available solid biomass waste requires a priority attention, including wood and straw, while cultivation and use of fuel trees (willows, poplars, sword grass), as well as production of biogas and liquid biomass fuel seem to be realistically introduced in the nearest 5—10 years. Biomass waste (excluding amounts utilised by other economic sectors) may supply more than 10% of the overall Ukraine’s demand in pri-mary energy resources.
�
�
��
��
��
��
��
��
��
��
���� ���� ���� ���� ���� ����
����������
�������������
����������������
������
����������
����
���������
����������
��������������������
���������� ������������������������������������������������������� ������������������������������������������� ������������������������������������������������������
26
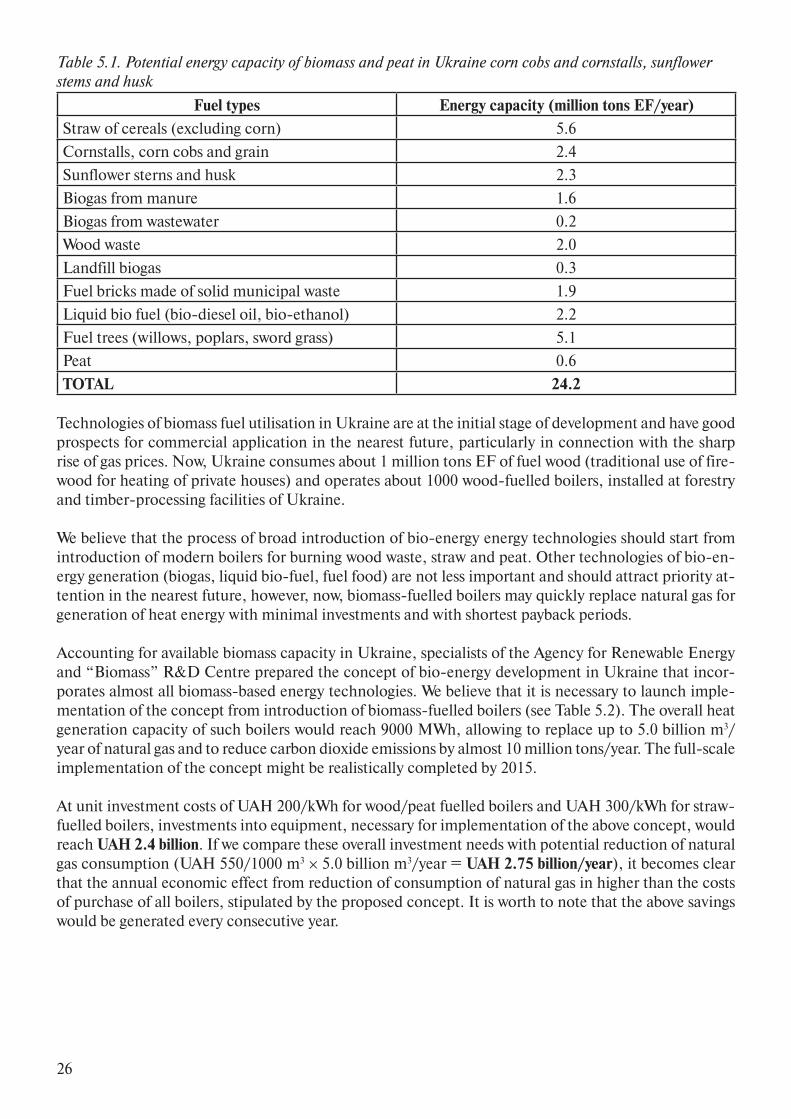
Table 5.1. Potential energy capacity of biomass and peat in Ukraine corn cobs and cornstalls, sunflower stems and husk
Fuel types Energy capacity (million tons EF/year)
Straw of cereals (excluding corn) 5.6
Cornstalls, corn cobs and grain 2.4
Sunflower sterns and husk 2.3
Biogas from manure 1.6
Biogas from wastewater 0.2
Wood waste 2.0
Landfill biogas 0.3
Fuel bricks made of solid municipal waste 1.9
Liquid bio fuel (bio-diesel oil, bio-ethanol) 2.2
Fuel trees (willows, poplars, sword grass) 5.1
Peat 0.6
TOTAL 24.2
Technologies of biomass fuel utilisation in Ukraine are at the initial stage of development and have good prospects for commercial application in the nearest future, particularly in connection with the sharp rise of gas prices. Now, Ukraine consumes about 1 million tons EF of fuel wood (traditional use of fire-wood for heating of private houses) and operates about 1000 wood-fuelled boilers, installed at forestry and timber-processing facilities of Ukraine.
We believe that the process of broad introduction of bio-energy energy technologies should start from introduction of modern boilers for burning wood waste, straw and peat. Other technologies of bio-en-ergy generation (biogas, liquid bio-fuel, fuel food) are not less important and should attract priority at-tention in the nearest future, however, now, biomass-fuelled boilers may quickly replace natural gas for generation of heat energy with minimal investments and with shortest payback periods.
Accounting for available biomass capacity in Ukraine, specialists of the Agency for Renewable Energy and “Biomass” R&D Centre prepared the concept of bio-energy development in Ukraine that incor-porates almost all biomass-based energy technologies. We believe that it is necessary to launch imple-mentation of the concept from introduction of biomass-fuelled boilers (see Table 5.2). The overall heat generation capacity of such boilers would reach 9000 MWh, allowing to replace up to 5.0 billion m3/year of natural gas and to reduce carbon dioxide emissions by almost 10 million tons/year. The full-scale implementation of the concept might be realistically completed by 2015.
At unit investment costs of UAH 200/kWh for wood/peat fuelled boilers and UAH 300/kWh for straw-fuelled boilers, investments into equipment, necessary for implementation of the above concept, would reach UAH 2.4 billion. If we compare these overall investment needs with potential reduction of natural gas consumption (UAH 550/1000 m3 × 5.0 billion m3/year = UAH 2.75 billion/year), it becomes clear that the annual economic effect from reduction of consumption of natural gas in higher than the costs of purchase of all boilers, stipulated by the proposed concept. It is worth to note that the above savings would be generated every consecutive year.

27
Table 5.2. Potential capacity of the Ukrainian market of biomass and peat-fuelled boilers, that might be realistically utilised by 2015.
Equipment types App. capa-city of the Ukrainian
market (units)
Installed capacity (MWh)
Service life
(hours/year)
Replace-ment of fuel and energy resources (million
tons EF/year)
Replace-ment of natu-ral gas (billion
m3/year)
Reduction of emis-sions of СО
2*,
million tons/year
Investment costs, UAH
million
Heating wood-fuelled boilers, 1—10 MWhт
250 500 4400 0.30 0.26 0.51 100
Industrial wood-fuelled boilers, 0.1—5 MWhт
1000 250 8360 0.27 0.24 0.46 50
Household wood-fuelled boilers, 10—50 kWhт
53000 1590 4400 0.96 0.84 1.65 318
Farm straw-fuelled boilers, 0.1—1 MWhт
15900 3180 4400 1.91 1.67 3.27 954
Heating straw-fuelled boilers, 1—10 MWhт
1400 2800 4400 1.68 1.47 2.88 840
Heating peat-fuelled boilers, 0.5—1 MWhт
1000 750 4400 0.6 0.52 1.03 150
TOTAL 72550 9070 5.72 5.00 9.81 2412
* comparatively to burning of natural gas.
According to estimates of experts of the Agency for Renewable Energy and “Biomass’ R&D Centre, in 2030, consumption of wood and wood waste for energy generation purposes would reach about 13 TWh*hours, while 10 years later, the figure might increase to 16.3 TWh*hours/year. Ukraine has sufficient reserves for intensification of wood energy capacity. Even now, there are realistic proposals to enhance yield of our forests to the level of neighbouring countries. As a result, one may expect that wood consumption would increase up to 25 TWh*hours/year by 2050. Now, the amount of straw burning for energy generation purposes reaches the equivalent of 2 GWh*hours/year. Bio-energy development forecasts suggest that consumption of straw and sterns for energy generation purposes would reach the equivalent of 23 TWh*hours/year by 2030, while later the figure might increase up to 50 TWh*hours/year by 2050 (the latter figure corresponds to utilisation of up to 60% or technically available resources).
Unit costs of biomass fuels (costs per unit of energy output in GJ) are much lower, comparatively to natural gas. For example, average prices of fuel straw reach UAH 100/ton. At heat value of 17 MJ/kg, unit energy costs will reach about UAH 6/GJ. At price of wood fuel of UAH 80/ton and average heat value in the range of 10—12 MJ/kg, unit costs of energy will reach about UAH 7/GJ. For comparison, at natural gas prices of UAH 550/1000 m3 and heat value of 35 МДж/м3), unit energy costs for natural gas reach about UAH 16/GJ. Therefore, at above prices, straw is 2.6 times cheaper, and wood is 2.3 time cheaper than natural gas. Local fuel may be much cheaper, or sometimes even free.
Results of technical and economic analysis suggest that generation of heat energy from biomass fuel would be competitive even in the case of application of imported equipment. In the case of applica-tion of Ukrainian equipment, payback periods would reach 1—2 years for wood-fuelled boilers and 2—3 years for straw-fuelled boilers.
In the case of Ukraine, a priority attention to generation of heat energy from biomass is associated with the fact that in the majority of cases, heating applications of biomass fuel allow to replace natural gas (by 100%). For comparison, electric energy generation from renewables allows to replace at average only 17% of natural gas, as gas-fuelled power plants generate only 17% of electric energy in Ukraine.

28
Biogas production is considered as the second most important priority after biomass-fuelled boilers. These technologies include biogas production by anaerobic fermentation of animal waste (e.g. manure) and collection of landfill gas. Biogas contains 50—60% of methane and may be burned in adapted en-gines (for electric energy generation) or replace natural gas in some industrial processes (e.g. at cement plants). Biogas utilisation data from the concept are shown in Table 5.3. In the nearest future, one may expect intensive development of technologies for utilisation landfill biogas and biogas from wastewater treatment facilities, while growth of biogas production from animal waste may be expected after 2010. The overall consumption of biogas in 2030 might reach 10.2 TWh*hours/year, while in 2050 the figure might increase up to 17.4 TWh*hours/year (technically feasible capacity).
If biomass fuel will replace natural gas and liquid fuel, money, that was paid to their producers (eventu-ally to Russia and Turkmenistan) will remain in regions as revenues of biomass suppliers (farmers and forestry facilities). These funds will facilitate development of relevant regions and the whole country, instead of supporting economies of neighbouring countries. Besides that, introduction of bio-energy technologies would promote job creation in Ukraine (5 jobs per 1 MWh of installed heat capacity at average). So, introduction of 9000 MWh heat capacity of biomass-fuelled facilities in the country will be accompanied by creation of 45 thousand new jobs, mainly in rural areas. Besides that, these measures would result in creation of new jobs at plants that manufacturerelevant boilers.
Table 5.3. Potential capacity of biogas utilisation in Ukraine (realistically attainable by 2020).Equipment types App. capa-
city of the Ukrainian
market (units)
Installed capacity
(MWhт+ MWhе)
Service life (hours/year)
Replace-ment of fuel and energy resources
(million tons EF/year)
Replacement of natural
gas (billion m3/year)
Reduction of emissions
of СО2*,
million tons/year
Investment costs, UAH
million
Major biogas fuelled installa-tions
2903 711+325 8360 1.33 1.15 22.36 1465
Minor power gene-rators, fuelled by landfill gas
90 20+80 8360 0.24 0.21 3.26 404
TOTAL 2993 731+405 1.57 1.36 25.62 1869
* comparatively to burning of natural gas
5.2. Wind power
Conditions for development of wind power at the territory of Ukraine are rather favourable. In many regions annual average wind velocities reach 5—5.5 m/sec at the standard height of 10 m over the sur-face. The range of the most promising regions for construction of large wind power plants incorporates Crimea, Carpathian region, coastal areas of the Black sea and the Sea of Azov, Donbass.
Estimates suggest that attainable installed capacity of wind farms in the integrated energy system of Ukraine might reach up to 16,000 MWh, while attainable wind power generation figure might reach 25—30 TWh*hours/year. These figures are often considered as the wind power capacity. The necessary land allocations for construction of wind farms might reach 2500—3000 km2 — these figures seems re-alistic if we account for shallow water areas of the Black sea and the Sea of Azov. Other estimates suggest that Ukraine might allocate 7000 km2 of land for construction of wind farms with the overall generating capacity of 35,000 MWh.
In this study we assume that Ukraine may construct wind farms with the overall capacity of 16,000 MWh, mainly including wind turbines with generating capacity over 1.5—2 MWh. We assumed the annual

29
plant factor of 30% (2630 hours/day), that is fairly realistic for climate conditions of Ukraine in the case of application of modern wind turbines. Expected rates of commissioning of wind power capacity up to 2030 were taken from the Energy Strategy (version of 2002) — the Strategy stipulates the overall ca-pacity of 11,290 MWh and annual generation of almost 25 TWh*year. In the period from 2030 to 2050, some decrease of the rate is anticipated (due to replacement of wind farms commissioned earlier). In such a case, the wind power capacity would reach 42 TWh*hours/year. By 2050, the technical capac-ity of wind power (as it is understood now) would be completely utilised and electric energy generation might reach up to 42 TWh*hours/year.
5.3. Solar heaters
Use of solar energy is often considered mainly appropriate for local hot water supply in summer sea-sons. The heat energy generation capacity of solar energy is estimated at the level of 32 TWh*hours/day. However, in climate conditions of Ukraine, solar energy may be used for residential heating and for year-round district heating systems. Similar technical solutions have been already introduced in many countries, located further north from Ukraine. Assuming 3.9 m2 per president and annual gen-eration of 400 kWh*hours per 1 m2 of solar collectors, the capacity of solar heaters may reach almost 75 TWh*hours/year.
Rates of introduction of solar collectors for the period up to 2030 were taken from Energy Strategy (ver-sion of 2002) — the Strategy stipulates the rate of 2 TWh*hours/year) with some acceleration in the pe-riod from 2030 to 2050. One may expect that, by 2050, solar collectors would generate 23 TWh*hours/year of heat energy or only 30% of the technically feasible capacity.
5.4. Photovoltaics
From the technical point of view, there are fairly favourable conditions for application of photovolta-ics in Ukraine. Ukraine inherited main silicon production facilities (about 80%) of the former USSR. Ukraine controls 8% of the global silicon production capacity, but it is poorly utilised now. The techni-cal capacity of photovoltaic energy generation is estimated at the level of 16 TWh*hours/year, or about 3.3 m2 of photovoltaic panels per resident with annual generation of 100 kWh*hours/m2/year. In the case of use of modern and energy efficient appliances, the above generation capacity might meet main household demands. The technically feasible capacity would allow to generate 2 TWh*hours/year by photovoltaic panels in 2030, in 2050 this figure may raise to 9 TWh*hours/year.
5.5. Geothermal energy
Ukraine has a substantial geothermal capacity. The most promising regions include Trans-Carpathia, Crimea, Prikaprattya, Kharkiv, Poltava, Donetsk, Lugansk and Chernigiv oblasts, as well as some other regions. The Ministry of Environment officially estimates reserves of geothermal water at the level of 27.3 million m3/day. In this study, we assume utilisation of geothermal energy at the level of 8 Wh*hours/year in 2030 and at the level of 14 TWh*hours/year in 2050 (i.e. almost the same figure as the all-European level of utilisation today).
5.6. Hydropower
In comparison to other renewables, hydropower is a well known and technologically advanced method of electric energy generation. At the Dnieper, seven high-capacity HEPs and 1 HESP operate with the overall generating capacity of 3907 MWh and annual electric energy generation of 10—12 TWh*hours/year. In 1983, Dniester HES was commissioned at the Dniester river with generating capacity of 702 Wh and with annual generation of electric energy at the level of about 1 TWh*hours/year. In addition,
30
50 minor HEPs are operational, with the overall generating capacity of about 100 MWh and annual generation of electric power of about 0.25 TWh*hours/year.
The technically feasible capacity of hydropower in Ukraine is estimated to reach 81 TWh*hours/year. The overall underutilised economically feasible capacity of major HEPs reaches 17—19 billion kWh*hours, minor HEPs add up to 3.7 billion kWh*hours. Therefore, the overall economically feasible capacity of hydropower reaches about 33 TWh*hours/year.
In Ukraine, there are realistic options to develop the hydropower sector by construction of medium-sized HEPs (20—50 MWh). The majority of European counties have already exhausted such possibili-ties. The range of priority activities incorporate reconstruction of HEPs of the Dnieper cascade — these measures would increase the generation capacity by 300 MWh and increase the electric energy genera-tion by 290 million kWh*hours. Later, the Dniester HEP may be also reconstructed. The range of pri-ority activities might also include construction of a cascade of HEPs at the Tysa river, with the overall generating capacity of 220 MWh.
In 1950s—1960s, in Ukraine, 956 minor HEPs (MHEPs) operated, by late 1980s, only 49 MHEPs op-erated (93 MWh). All these MHEPs have already exceeded their design service life (35—70 years) and need reconstruction. Now, there are more than 170 minor HEPs in two groups (72 operational MHEPs and about 100 idle MHEPs).
In 2030, HEPs might generate 15.1 TWh*hours/year (inc. 3.7 TWh*hours/year, generated by minor HEPs), later, the hydropower generation might increase up to 25 TWh*hours/year in 2050.

31
6. Cogeneration
Cogeneration means combined generation of heat and electric energy. Main benefits of cogeneration include substantial (in 4 times) decrease of fuel consumption, comparatively to separate generation of the same amount of heat and electric energy (see Fig. 6.1).
The overall capacity of construction of a distributed network of cogeneration power plants is assessed to reach 16,000 MWh. At the first stage it is appropriate to utilise 5000 MWh (inc. 3000 MWh in the housing and utilities sector and 2000 MWh in industry.) Implementation of a distributed network of cogeneration plants would ensure:• high energy efficiency and low costs of heat and electric energy;• substantial reduction of environmental releases of greenhouse gases and other pollutants;• energy independence and security of individual facilities and regions;• reduction of energy transmission losses;• ability to operate in reactive and peak load modes;• opportunities to use local fuel and alternative energy sources in the framework of an integrated
highly efficient technological process.
“Renko” R&D Association developed the project of introduction of 5000 MWh of cogeneration ca-pacity. The overall project costs reach UAH 14,187.1 million. The project stipulates construction of gas-turbine, exhaust-fired boilers and gas-piston facilities. The project implementation is planned for 2005—2015. In the course of the project implementation, 5000 MWh of highly efficient generating ca-pacity will be commissioned, that will produce 189,353 GWh*hours of electric energy and 203,769 thou-sand Gcal. The average payback period is estimated to reach 3.6 years. The majority of boilers will be modernised with a broad application of modern energy and resource efficient equipment. Losses of natural gas will be reduced by 6—8 billion m3/year, comparatively to separate generation of heat and electric energy. Reduction of fuel losses in the housing and utilities sector will reduce emissions of greenhouse gases by 12%/year, or 14.9 million tons of СО
2 equivalent.
“Zorya-Mashproekt” Plant (Mykolaiv) produces gas-turbine engines in the range from 2.5 to 25 MWh. Almost 100% of these engines are exported to Russia, Belarus, China, Canada, the USA and other countries. In Ukraine, with the exception of about 20 gas compressors, engines of “Zorya-Mashproekt” Plant are not used. The situation should be improved by involvement of the plant into design of supercharged boil-ers. Now, “Zorya-Mashproekt” Plant implements a pilot test of a gas-turbine unit with capacity of 110 MWh. These units should be introduced in Ukraine for effi-cient burning of natural gas with electric energy generation effi-ciency up to 60%.
����������
����������������������������������������
����������������������������� �������
�������
�����������������
���������
����������������������������
������������� ������������������������������������������������ � ����������������������������������������������������

32
7. Reduction of heat and electric energy losses
7.1. Reduction of heat losses in the housing and utilities sector
Generation and transportation
According to statistical data, from the overall annual consumption of natural gas in Ukraine (about 85 bil-lion m3), residential consumers, utilities and budgetary facilities consume about 34 billion m3. In 5—6 recent years, energy consumption of the housing and utilities sector increased almost by 7%, while industry reduced its gas consumption by 7.4%. Unit consumption of fuel for generation of heat energy reaches 185—190 kg EF/Gcal, while in other countries relevant figures are lower — 140—150 kg EF.
In the sphere of heat energy generation, energy losses at some inefficient boilers reach 30—35%, while the most modern municipal boilers lose 10—12%. The average losses of 20—25% of the energy input actually result in the fact that heat carriers of standard temperature carry only 45—50% of the energy input of boiler installations. If energy losses in heat generation would be reduced to the standard level (not more than 8%) annual fuel savings might reach up to 3 million tons EF. The housing and utilities sector of Ukraine incorporates about 15 thousand industrial and municipal boilers, and the majority of them have substantial energy conservation reserves.
If we consider length and quality of municipal heating networks, we should assess them as unsatisfac-tory. From the overall 23.44 thousand km of heating networks, 32% (or 7.5 thousand km) are either damaged or badly need repairs. The share of pre-insulated heating pipes is very low and does not exceed 10% in major cities. The option of heating pipes in chutes with slag wool insulation is inefficient, these pipes have a short service life due to insulation damage by groundwater (as a result, more than 50% of the insulation material detach from the pipe). Depending on pipelines length, heat losses vary from 8% to 25%. A transition to new types of insulation and other construction solutions would allow to save up to 7—9% of fuel.
Residential consumers (or actually buildings) may get from 45—47% (the best case) to 20% (the worst case) of energy input into heating and hot water supply. Unfortunately enough, consumers bear the largest share of associated costs (25—30%). One can easily estimate that, in the best possible case, only 15—25% of heat energy are utilised. In the worst case, the heating efficiency actually approximates to zero and users utilise only 30% of energy, that was invested into the process of gas extraction and trans-portation.
In order to estimate necessary investments for implementation of measures to reduce losses of energy generation and transportation, let us assume that at least a half of boilers should be modernised and 7.5 thousand km of heating pipes should be mandatory replaced. Such measures incorporate replace-ment of old boilers by modern ones, installation of more efficient burners and replacement of old heat-ing pipes by modern pre-insulated pipes.
According to indicators of the project of reconstruction of municipal boilers in the AR Crimea, average costs of reconstruction of 1 boiler unit reach about UAH 292 thousand, while replacement of 1 km of old heating pipes adds UAH 483 thousand (information of “Biomass” R&D Centre). At such prices, the overall costs of modernisation/reconstruction of municipal boilers and heating networks of Ukraine would reach UAH 2192 million and UAH 3623 million, respectively, or UAH 5814 million in total. Modernisation of boilers would save 5—10% of gas consumption (depending on specific measures im-plemented), while application of pre-insulated pipes would allow save 7—9%. If we use average figures we will estimate that implementation of energy saving technologies in municipal heating in Ukraine would allow to save about 5.27 billion m3/year of natural gas (see Table 7.1).

33
Table 7.1.Energy conservation measures in municipal heating in Ukraine and anticipated effects of their implementation
Measures App. number of boilers to be modern-
ised
App. length of heating pipes to be replaced
(km)
Reduction of fuel consump-tion (million
tons EF/year)
Reduction of consumption
of natural gas (billion
m3/year)
Reduction of СО
2 emis-
sions (million tons/year)
Investments (UAH million)
Modernisation/recon-struction of boilers
7500 2.9 2.55 5.0 2192
Replacement of old pipes by pre-insulated ones
7500 3.1 2.72 5.33 3623
TOTAL 6.0 5.27 10.33 5814
Consumption
The sphere of consumption of heat and electric energy also offers major energy conservation oppor-tunities. Technical measures for resource conservation in the housing sector may be subdivided into 3 groups:1. Resource consumption metering.2. Resource regulation.3. Measures to reduce inefficient losses of resources.
Correspondingly, the following energy efficiency measures may be implemented in the housing and utilities sector:• application of modern efficient system of resource consumption metering;• introduction of automatic systems for regulation of energy consumption;• application of energy efficient appliances and lighting devices;• introduction of modern power electronics systems and equipment;• construction/reconstruction of housing in compliance with rational energy use requirements.
Measures of resource consumption metering and regulation allow to ensure normal living conditions and to estimate precise amounts of resources and associated costs — as a result, one will be able to identify inappropriate consumption and reduce it. The examples below demonstrate rather efficient measures to reduce inappropriate consumption, however, the list is not exclusive:• External insulation of walls and archways.• Restoration of damaged panel joints and waterproofing of walls.• Insulation of constructive elements of attics, technical floors and basements.• Insulation of heating pipes and hot water supply pipes.• Cleaning (washing) of heating appliances and pipes to remove internal sediments and restore their initial performance.• Installation of reflectors. A large share of IR radiation of a heater heats the wall, where the heater is is installed. A reflector at the wall allows to return a large part of heat energy to a flat.• Installation of heat-reflecting films and low-emission windows allows to reflect IR radiation (emitted by heating appliances and residents, as well as sunlight, reflected from walls and furniture). As a result, heat losses through windows may be substantially reduced.• Insulation and sealing of doors and windows.• Reconstruction of external entrance doors.• Replacement of old balcony doors and windows by modern window blocks allows to reduce heat losses substantively and excessive infiltration.
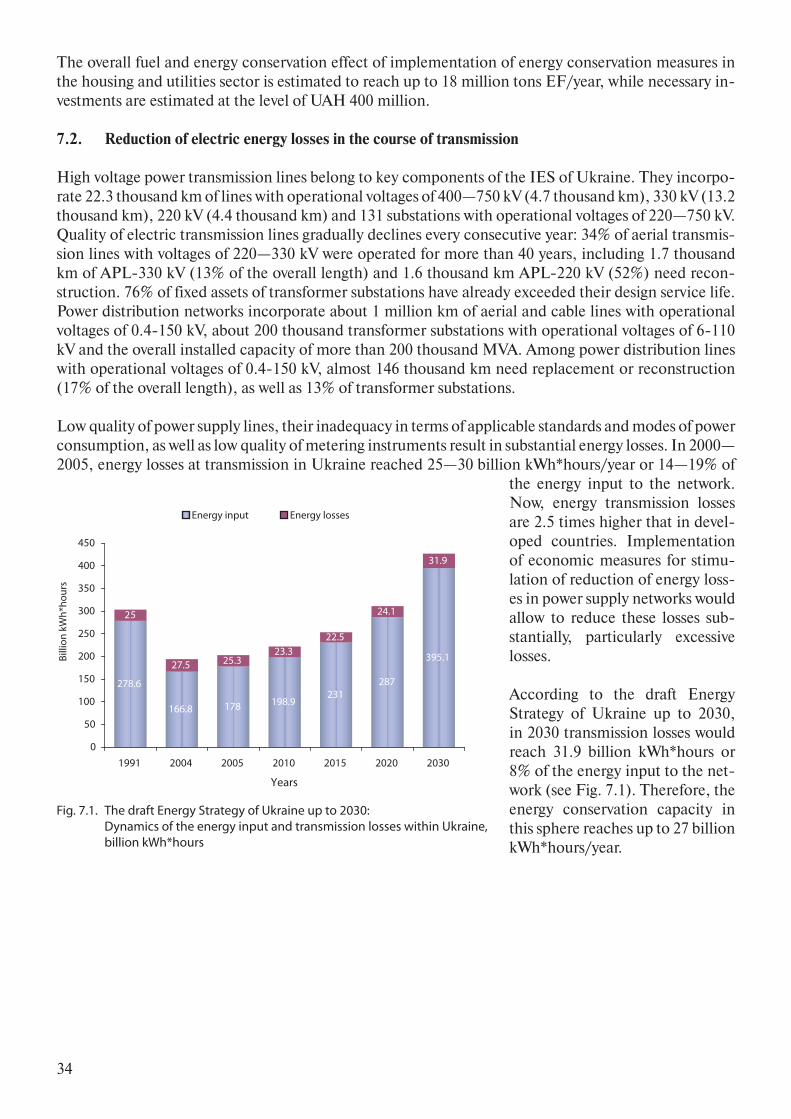
34
The overall fuel and energy conservation effect of implementation of energy conservation measures in the housing and utilities sector is estimated to reach up to 18 million tons EF/year, while necessary in-vestments are estimated at the level of UAH 400 million.
7.2. Reduction of electric energy losses in the course of transmission
High voltage power transmission lines belong to key components of the IES of Ukraine. They incorpo-rate 22.3 thousand km of lines with operational voltages of 400—750 kV (4.7 thousand km), 330 kV (13.2 thousand km), 220 kV (4.4 thousand km) and 131 substations with operational voltages of 220—750 kV. Quality of electric transmission lines gradually declines every consecutive year: 34% of aerial transmis-sion lines with voltages of 220—330 kV were operated for more than 40 years, including 1.7 thousand km of APL-330 kV (13% of the overall length) and 1.6 thousand km APL-220 kV (52%) need recon-struction. 76% of fixed assets of transformer substations have already exceeded their design service life. Power distribution networks incorporate about 1 million km of aerial and cable lines with operational voltages of 0.4-150 kV, about 200 thousand transformer substations with operational voltages of 6-110 kV and the overall installed capacity of more than 200 thousand MVA. Among power distribution lines with operational voltages of 0.4-150 kV, almost 146 thousand km need replacement or reconstruction (17% of the overall length), as well as 13% of transformer substations.
Low quality of power supply lines, their inadequacy in terms of applicable standards and modes of power consumption, as well as low quality of metering instruments result in substantial energy losses. In 2000—2005, energy losses at transmission in Ukraine reached 25—30 billion kWh*hours/year or 14—19% of
the energy input to the network. Now, energy transmission losses are 2.5 times higher that in devel-oped countries. Implementation of economic measures for stimu-lation of reduction of energy loss-es in power supply networks would allow to reduce these losses sub-stantially, particularly excessive losses.
According to the draft Energy Strategy of Ukraine up to 2030, in 2030 transmission losses would reach 31.9 billion kWh*hours or 8% of the energy input to the net-work (see Fig. 7.1). Therefore, the energy conservation capacity in this sphere reaches up to 27 billion kWh*hours/year.
�����
����� ��� ��������
���
�����
��
���� ��������
����
����
����
�
��
���
���
���
���
���
���
���
���
���� ���� ���� ���� ���� ���� ����
�����
������������ �������������
�������
�������
���
������������������������������������������������������������� ���������������������������������������������������������������������� �����������������

35
8. Utilisation of coalbed methane
Ukraine has substantial and almost unexplored resources of coalbed methane. A large-scale extraction and utilisation of coalbed methane would allow to make a serious contribution into meeting energy needs of Ukraine. In addition to the above considerations, extraction of coalbed methane in Ukraine should improve safety of coal mining operations. Coal mines of Ukraine belong to the most dangerous in the world in terms of methane releases. About 95% of all coal mining facilities of Ukraine belong to underground mines. The coal industry makes the highest contribution to methane emissions of the country — 1.5—2 billion m3/year. Now, estimated reserves of coalbed methane in Ukraine reach about 12 trillion m3, while industrial grade reserves reach about 4 trillion m3.
So far, only 42 coal mines of Ukraine operate degasification systems and about a half of them utilise methane in boilers. Methane levels in degasification pipes reach 25—60%. As an example of coalbed methane utilisation for heat and electric energy generation we may refer to Zasiadko Coal Mine, that operates a large cogeneration installation at the base of GE Jenbacher engines (Austria) with installed capacity of 65 MWhе + 65 MWhт. Introduction of degasification systems might allow to resume mining operations at some decommissioned mines (the problem is fairy relevant for contemporary Ukraine).
1 MWh of installed capacity of gas-fuelled engines requires 3 million m3 of methane/year. Unit invest-ment costs (equipment) reach about €600—800 thousand/MWhе. Assuming average investment costs and the maximal estimated share of utilisation-accessible methane (about 40% of total releases of 2 billion m3/year), we can estimate that utilisation of the available reserves might provide generating ca-pacity of 320 MWhе at necessary investments of about UAH 1344 million (see Table 8.1). The capacity of 320 MWhе would provide 2.68 TWh*hours/year of electric energy.
The Energy Strategy stipulates utilisation of coalbed methane at the level of 5.8 million tons EF/year. The figure seems overestimated. Implementation of methane utilisation technologies is comparatively expensive. Only methane from degasification systems may be used for energy generation. Only a few mines operate such systems and their installation requires major costs. Gas-fuelled engines are also ex-pensive. So far, only two producers manufacture engines that burn coalbed methane — GE Jenbacher (Austria) and Caterpillar (US). Therefore in this study, we assume the share of coalbed methane utilisa-tion at the level of 40% and we consider this estimate as a maximum (at least up to 2030).
Table 8.1. Utilisation of coalbed methane for generation of electric energyMeasures Installed ca-
pacity, MWhе
Service life, (hours/year)
Conservation of fuel and en-ergy resources (million tons
EF/year)
Replacement of natural gas (billion m3/
year)
Reduction of СО
2 emissions
(million tons/year)
Investment costs (UAH
million)
Electric energy generation by a gas-fuelled engine
320 8360 0.93 0.8 12.44 1344
As an example, we may refer to the USA, where shares of coalbed methane in the energy balance gradu-ally increase. In the USA, utilisation of coalbed methane was initiated about 20 years ago. In 1992, they extracted 5 billion m3 or coalbed methane, while in 1998, the figure increased almost in 7 times (the overall consumption of natural gas in the USA reaches about 600 billion m3).

36
9. Reconstruction of the gas transportation system
The gas transportation system of Ukraine incorporates 37.6 thousand km of different gas mains, 73 com-pressor facilities (110 compressor installations with 703 gas compressor units with the overall capacity of 5.4 thousand MWh), 1607 gas distribution facilities, 13 underground storages with the overall usable capacity of more than 32.0 billion m3 and associated infrastructure facilities.
Losses in the gas distribution system of Ukraine include both normal and abnormal losses. In 2004, these losses reached 1.9 billion m3 (inc. 1.1 billion m3 of normal losses and 0.8 billion m3 of abnornal losses) or 2.8% of the gas consumption in Ukraine. Losses of natural gas in the gas transportation system of Ukraine (registered losses) in 2004 reached 1.06 billion m3, or 0.5% of the gas input to the system. In connection with development of gas supply services (increasing length of gas mains, higher numbers of gas consumers, etc.), deterioration of gas mains and gas transportation equipment, gas losses in distri-bution networks are expected to increase and reach about 2% of gas consumption by 2030. Gas losses in the gas transportation system are expected to reach 0.3% of the transported volume by 2030.
Now, about 29% of gas pipes have already exceeded their service life and almost 60% of them were operational for 10 to 33 years. Almost a third of 703 gas compressor units already exceeded or almost exceeded their overhaul period and need reconstruction. The system of natural gas supply with op-erational pressure of 1.2 MPa has a high wear out rate, moreover, components of the system operate in difficult conditions of complex engineering infrastructure of urban/rural settlements. For example, 11.6 thousand km of gas distribution pipelines (or about 7%) and 4.9 thousand of gas distribution facili-ties (or about 14%) have already exceeded their service life terms.
Accounting for terms of operation of gas mains and their quality, there are plans to complete recon-struction of all gas compressor stations by 2015, in order to maintain reliable and efficient functioning of the system. In 2030, modernisation and technical upgrade of the gas transportation system will be completed (with application of modern and efficient technologies that will be available at that time).
The Energy Strategy stipulates allocation of UAH 92.4 billion for modernisation of the gas transporta-tion system of Ukraine (inc. gas mains and compressor facilities) by 2030. These measures would allow to save up to 3 billion m3 of natural gas/year.

37
10. Utilisation of discharge heat of boilers
Reduction of temperature of flue gases of boilers (to 50—70° С), with water condensation, allows to utilise discharge heat of flue gases. The heat energy may be used for heating of blast air, water of hot water supply systems or technological water of boiler installations. Introduction of heat utilisation is recommended for boilers with heat capacity of 0.25—4 MWh and allows to increase the fuel utilisa-tion factor by 5—15%. In addition, these measures allow to reduce level of nitrogen oxides in flue gases (up to 50%).
Table 10.1. Heat utilisation for gas-fuelled boilersMeasures App. number of
boilers for imple-mentation
Conservation of fuel and energy
resources (million tons EF/year)
Reduction of natural gas con-sumption (billion
m3/year)
Reduction of СО2
emissions (million tons/year)
Investment costs (UAH million)
Installation of heat utilisation equipment in boilers
7500 2.9 2.55 5.0 750

38
11. Utilisation of natural gas pressure
Potential energy of excessive pressure of natural gas at gas distribution facilities may be utilised for gen-eration of electric energy. To this end, it is necessary to introduce turbo-expander generators in the gas transportation network of Ukraine. Theoretical resources of potential energy of natural gas, that are lost now at gas throttling operations, reach about 5 TWh*hours/year, while technically feasible resources are estimated at the level of 2 TWh*hours and economically feasible reach up to 1 billion GWh)hours/year.
“Naftogaz Ukrainy” and “Ukrtransgaz” developed a feasibility study for implementation of TEPPs up to 2010 with the overall generating capacity of 128 MWhе, that would generate up to 1 TWh*hours/year of electric energy. The list of 30 gas distribution facilities was prepared — in the future, turbo-expander generators may be installed there, allowing to generate annually up to 0.405 TWh*hours of electric energy.

39
12. Utilisation of industrial gases
Heat energy of industrial gases may be also utilised for generation of heat and electric energy. For ex-ample, blast furnace gas may be used. To intensify the blast furnace process and improve its efficiency, higher pressures of top gases may be used, excessive potential energy of these gases may be utilised in compressionless turbines for generation of electric energy. The overall resources of excessive pressure of blast furnace gases are assessed as equivalent of 1.5 billion kWh*hours/year (0.18 million tons EF.); technically feasible resources at efficiency of utilisation turbines of ~75% and throughput at the level of 70—80% of nominal gas releases are assessed as equivalent of 858.4 million kWh*hours/year of electric energy (0.11 million tons EF). The overall estimated capacity for replacement of natural gas by utilisa-tion of industrial gases up to 2030 reaches 2 billion m3/year.

40
13. Development of traditional energy resources
The forecast of development of traditional energy sources, proposed in the daft Energy Strategy of Ukraine up to 2030, seems rather well justified in connection of coal and oil. The general trend suggests growing use of these energy resources. In the course of development of the forecast, the following fac-tors and information were taken into account:• analysis of statistical reporting;• spheres of development of economic sectors and individual industries, including the fuel and en-
ergy complex;• structural and quantitative information on energy conservation;• parameters that influence consumption of energy resources (technical levels of production, envi-
ronmental costs, costs, associated with improvement of labour and living conditions, etc.).
Coal
Estimated coal reserves in Ukraine reach 117.5 billion tons, including 56.7 billion tons of explored coal reserves (inc. 39.3 billion tons of ener-gy-grade coal). Available coal reserves of operational coal mines reach 8.7 billion tons, including 6.5 billion tons of industrial coal (3.5 billion tons or 54% of energy-grade coal). Trends of development of met-allurgy, power industry, other industries and the social sphere suggest a fixed demand for cok-ing coal and rapidly growing demand for energy-grade coal. In order to ensure a substantial increase of coal production, 67 reserved sites may be used (coal reserves of 13.1 billion tons and potential mining capacity of 124.9 million tons of coal/year). In the future, tailings in tailing ponds may be considered as a major reserve (100 million tons).
According to forecasts of the Energy Strategy, coal consumption is expected to increase almost twice: from 65.9 million tons in 2005 to 130.3 million tons in 2030 (see Fig. 13.1.).
Oil
In 2005, Ukraine’s demand in oil and oil processing products reached about 28 million tons, including more than 4 million tons that were supplied by oil extraction facilities of Ukraine, while the rest (23.7 million tons) were imported from Russia and Kazakhstan. Accounting for con-temporary and expected levels of oil consumption in leading European countries, approximation of the
����
����
����
�����
�����
���� ���� ���� ���� ����
����������� ������������������������������������������������� � ����������������������������������������������������
����
����
����
����
����
���� ���� ���� ���� ����
������������ ������������������������������������������������� � ���������������������������������������

41
economy of Ukraine and living standards to European standards, gradual improvement of oil process-ing technologies at Ukrainian refineries, we may expect that oil demand in our country will reach 1 ton per capita. Therefore, we may expect that in 2010—2015 oil demand will increase to 37—41 million tons/year, to 45.3 million tons in 2020 and to 50 million tons in 2030. According to the Energy Strategy, internal oil consumption would increase by a third: from 18.0 million tons in 2005 to 23.8 million tons in 2030 (see Fig. 13.2).
Natural gas
Taking into account expect-ed dynamics of efficiency of geological exploration and exploration drilling works, the Energy Strategy pro-vided a preliminary assess-ment of potential growth of explored gas reserves for the forecasting period. It was as-sumed that exploratory drill-ing works will reach the level, stipulated by the National Program “Oil and Gas of Ukraine up to 2010”, or 415 thousand m/year (almost 2.5 times higher that real gas exploration works in 2004). Estimates suggest that at these conditions, in the period from 2005 to 2030, explored gas reserves might increase by 1022.7 billion m3 (the optimistic scenario) or by 670 bil-lion m3 (the pessimistic scenario). In the short to medium term future, the following factors will affect gas extraction levels:• improvement of efficiency of hydrocarbons’ extraction from deposits in operation;• accelerated extraction of gas from new deposits.
The draft Energy Strategy of Ukraine up to 2030 stipulates reduction of consumption of natural gas in Ukraine by almost 36%: from 76.8 billion m3 in 2005 to 49.5 billion m3 in 2030 (see Fig. 13.3).
This Concept stipulates another scenario of natural gas consumption in dynamics: from 74.5 billion m3 in 2005 (statistical data) to 82 billion m3 in 2030, i.e. with a relatively modest growth of 7.5 billion m3/year for a rather long period of time (see Fig. 13.4). The later scenario relied on the fact that, accounting for all potential technical, envi-ronmental and political risks, use of natural gas as a fuel is more ap-propriate that use of nuclear pow-er. Consumption of natural gas at the level, stipulated by the “non-nuclear” concept, event at con-temporary high prices, in general, results in much lower costs than costs necessary for development of nuclear power (construction of new reactor units, development of the nuclear fuel cycle, growing amounts of INF, waste processing and final disposal etc.). It is also worth to remind that natural gas is the most environmentally sound fuel among traditional energy resources.
��������
����
��������
���� ���� ���� ���� ����
����������� ������������������������������������������������� � �����������������������������������������������
��
���� ��
����
����
���� ���� ���� ���� ���� ����
������������ ��������������������������������������������������������� � �����������������������������������������������������������

42
14. The Non-nuclear Scenario of Development of the Power Industry of Ukraine up to 2030.
The proposed “non-nuclear” scenario of development of the power industry of Ukraine up to 2030 dif-fers in principle from the scenario of the Energy Strategy. The “non-nuclear” scenario stipulates rejec-tion of plans to commission 22 new reactor units, moreover, it stipulates rejection of the extension of service life of already operational ones. In addition, in contrast to the Strategy, the “non-nuclear” sce-nario forecasts some growth of natural gas consumption in Ukraine up to 2030. The gas consumption is relatively low, at the level of 7.5 billion m3/year. The non-nuclear path particularly relies on a broad utilisation of capacity of alternative and renewable energy sources. Among all A&Rs, biomass energy and windpower are expected to make the largest contribution. While the Strategy stipulates the share of biomass energy in the overall consumption of PERs at the level of mere 9.2 million tons of conventional fuel or 3.2% by 2030, the Concept stipulates a contribution of 21.5 million tons of conventional fuel or 7.5%. In addition to straw, wood waste and biogas (see section “Bioenergy” for details), potential types of biomass fuel incorporate also some other components such as corn cobs and cornstalls, sunflower stems and husk, liquid biomass fuel (bio-diesel oil, bio-ethanol), fuel trees (willows, poplars, sword grass). The contribution of windpower in the Concept is also assessed one order of magnitude higher than in the Strategy — 8.7 million tons of conventional fuel/year (or 3% of total PERs consumption) vs. 0.7 million tons of conventional fuel (0.25%).
Two PERs consumption structures that reflect different scenarios of development of the power industry of Ukraine up to 2030, are shown at Figures 14.1 and 14.2. The overall amount of PERs demand in 2030 in the both cases is assumed to reach the level of forecasts of the Energy Strategy — 285.7 million tons of conventional fuel (i.e. excluding energy conservation capacity). Consumption of traditional fuels (oil and coal) is also assumed to reach the Strategy’s forecasts. According to the Energy Strategy, in 2030, the demand in PERs will be met mainly by coal (35.4%) and nuclear power (25.3% — electric energy); followed by natural gas (19.9%) and oil (11.9%).
According to the schedule of construction and com-missioning of new reac-tor units of the Energy Strategy, in 2030, 16 new reactor units are expected to operate: inc. 10 already operational ones (8 units with extended service life) and 6 reactor units at the stage of construction.
In the alternative con-cept, in 2030, the nuclear
power sector will contribute 2.1 million tons of conventional fuel, due to two operational reactor units (2GWh. each), that will not exceed their standard service life (RNPP-4 and KhNPP-2). In terms of energy equivalents, consumption of natural gas is close to consumption of coal (33.3% and 35.4% of the overall PERs demand, respectively), followed by A&Rs as the third major contributor — 16.3%. Biomass energy and windpower are expected to dominate among alternative and renewable energy sources. Overall, renewables are expected to meet 11.7% of the energy demand (33.54 million tons of conventional fuel) — these figures correspond to trends in European and other developed countries.A comparative breakdown of costs, necessary for implementation of “nuclear” and “non-nuclear” scenarios of development of the power industry of Ukraine, is shown in Table 14.1. As can be seen,
�����������
����������� ����
������� ��������
�����������
��������� ���
���������������
�
��
��
��
��
���
���
���� ��� ��� ���� �������������� ���� ����� ��������������
��������
�������
����
�����������
������
�����
�������
����������� �������������������������������������������������������������������������� � �������������������������������������������������������������������������������������������������

43
the alternative concept stipulates much higher financing for develop-ment of A&Rs, while the Strategy stipulates alloca-tion of even larger funds for development of nu-clear power. Generally, costs of the both concepts are fairly similar, how-ever, we believe that the Strategy failed to account for real costs of construc-tion of new reactor units, decommissioning of old
reactor units, management of RW and INF (separation, conditioning, packaging, transportation and final disposal, accounting for already accumulated radioactive waste with different activity levels).
However, it is already obvious that it is more important and appropriate to invest into development of a safe power industry with a minimal share of nuclear power, instead of investing into expansion of nu-clear generating capacity.
Table 14.1. Financing of development of the power industry of Ukraine in the period from 2005 to 2030.
Allocations by sectors The Energy Strategy, UAH billion
The Alternative Concept, UAH billion
Heat power industry 183.4 183.4
Hydropower 19.7 19.7
Development of power distribu-tion networks
82.8 82.8
Nuclear power 198.3* 50*
Development of A&Rs 7.1 117.6
Nuclear fuel cycle 21.7 —
Coal industry 221.7 221.7
Oil and gas complex 282.3 332.3**
Total 1017.0 1007.5
** Comparatively to the Energy Strategy, additional UAH 50 billion are stipulated for development of the gas complex.* The figure does not account for real costs of processing and storage of radioactive waste and irradiated nuclear fuel (inc. temporary and long-term storage). In the Concept, these costs are much lower due to reduction of generation of new radioactive waste. Besides that, the Strategy does not account for a range of technological costs, associated with the increase of generation of electric energy and electric heating of municipal and industrial facilities.
������������
�����������
�����������
����������� ���
������
���������
���������
���
����
����
����
����
�����
�����
���� ��� ��� ���� ���� ���� �����
��������
�������
����
�����������
������
�����
�������
������������ �������������������������������������������������������������������������� � ��������������������������������������������������������������������������� � ���������������������������������������������������������������

44
Conclusions
Analysis of capacity and opportunities for application of energy conservation technologies, alternative and renewable energy sources suggests that there is a real alternative to the nuclear option of development of the power industry of Ukraine!
The need to expand NPPs capacity by commissioning 22 new reactor units is not sufficiently justi-fied, it is primarily based on substantially overestimated forecasts of the overall consumption of PERs in 2030, made by authors of the Energy Strategy. Besides that, they failed to account for all necessary costs, necessary for secure operations of the nuclear power sector, underestimated levels of consump-tion of natural gas and ignored a substantial capacity of renewable energy sources.
The Strategy stipulates reduction of consumption of fissile fuels for generation of heat energy by 17.1 million tons of conventional fuel/year. However, such a reduction may be completely achieved, with a tangible margin of safety, due to application of energy efficient technologies and A&Rs. If we consider preferential use of electric energy for heating at night time, one may ask what we expect to do with NPPs-generated electric energy at day time. A large scale import of electric energy from Ukraine seems to be the most probable scenario. Therefore, if they plan to construct 11 new reactor units just to cover the heating energy gap — 17.1 million tons of conventional fuel — there are safer and environ-mentally sound options, allowing to do it. However, if business opportunities for export of electric en-ergy abroad represent the real underlying purpose of the NPPs construction plans, we may ask whether such a business is necessary for Ukraine at all.
We believe, that materials of the Energy Strategy do not convince one that there are no alternatives to the nuclear scenario of development of the power industry of Ukraine. Besides that, such decisions of national significance cannot be made without broad public discussions, and, maybe, a national referen-dum on these issues.
45
Recommendations
We recommend the authors of the Energy Strategy of Ukraine up to 2030”:1) To admit that approval of the draft Energy Strategy by the Cabinet of Ministers of Ukraine was
a misjudgement and to continue development of the strategy.2) To implement a dedicated study of actual energy losses in different economic sectors in order to
assess the overall energy conservation capacity.3) To reassess downward the forecast of consumption of primary energy resources in Ukraine in
2030, accounting for assessments of GDP growth and reduction of the GDP’s energy intensity.4) To reassess predicted shares of renewables in the overall consumption of fuel and energy resources
in 2030, accounting for higher use of bio-energy and wind power.5) To reject the option of commissioning of any new reactor units, instead of the expansion of nu-
clear power capacity, all operational reactor units should be decommissioned as planned.6) To make transparent cost estimates for processing and storage of nuclear waste, irradiated nuclear
fuel and other costs of the nuclear power complex, unforeseen by the Energy Strategy.7) Funds, allocated for construction of new reactor units, should be invested into development of
energy efficient technologies, alternative and renewable energy sources.8) To develop alternative scenarios of development of the power industry of Ukraine, accounting for
provisions of the Concept of Non-nuclear Development of the Power Industry of Ukraine.9) To conduct broad public discussions on the draft Strategy and alternative scenarios.

46