the concept of reliable change & the reliable change index
TRANSCRIPT

RELIABLE CHANGE
&
THE RELIABLE CHANGE INDEX
IN THE CONTEXT OF EVIDENCE-BASED
PRACTICE:
A TUTORIAL REVIEW
Neville M Blampied
NZPsS Conference
Wellington
2 – 4 September, 2016
1

Abstract Background: The concept of Reliable Change in the context of psychological treatment was introduced by Jacobson and colleagues in 1984. Their Reliable Change Index (RCI) specifies the amount of change a client must show on a specific psychometric instrument between measurement occasions for that change to be reliable, i.e., larger than that reasonably expected due to measurement error alone. Only if change is reliable is it then meaningful to consider if it is practically or clinically significant. Evidence of reliable change is, therefore, at the heart of evidence-based practice. Despite this, reliable change and the RCI is rarely considered either in applied/clinical research or practice.
Aims: This talk will review the psychometric foundations of the RCI and relate this to clinical/applied/practical significance.
Main contributions: In addition to showing how the RCI is calculated for any particular psychological measure I will also demonstrate a graphical procedure that practitioners can use to systematically track, client by client, if they are producing reliable change. I will also show how this can be extended to show if the change is clinically significant. Modifications of the RCI for neuropsychological testing to take account of practice effects will also be discussed.
Conclusions: The paper will review the concept of Reliable Change and provide a tutorial in its use and interpretation for researchers and practitioners.
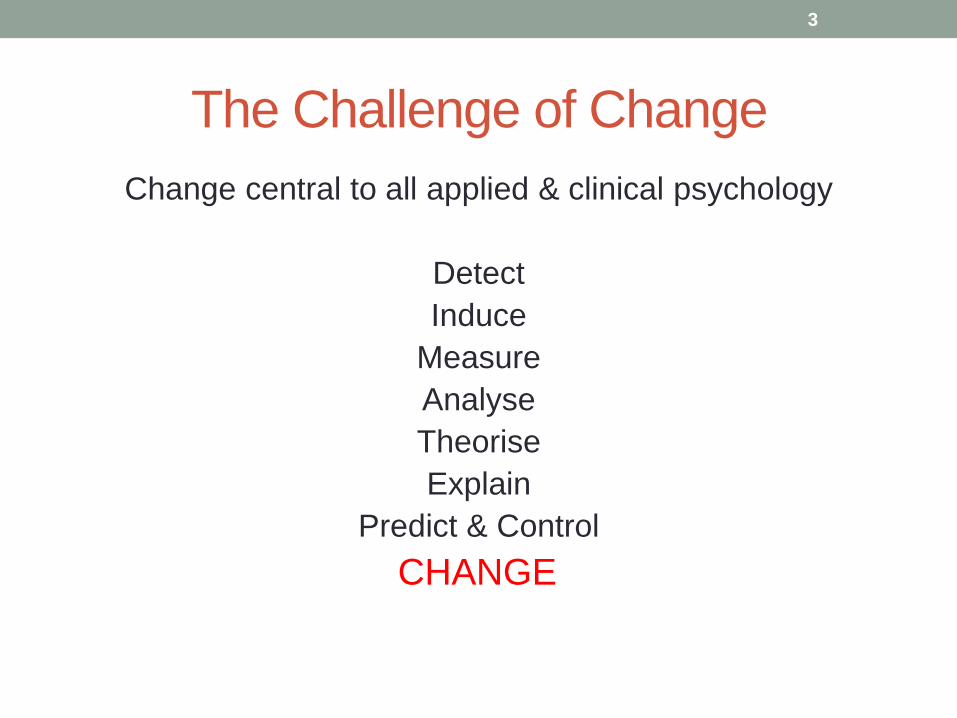
The Challenge of Change
Change central to all applied & clinical psychology
Detect
Induce
Measure
Analyse
Theorise
Explain
Predict & Control
CHANGE
3
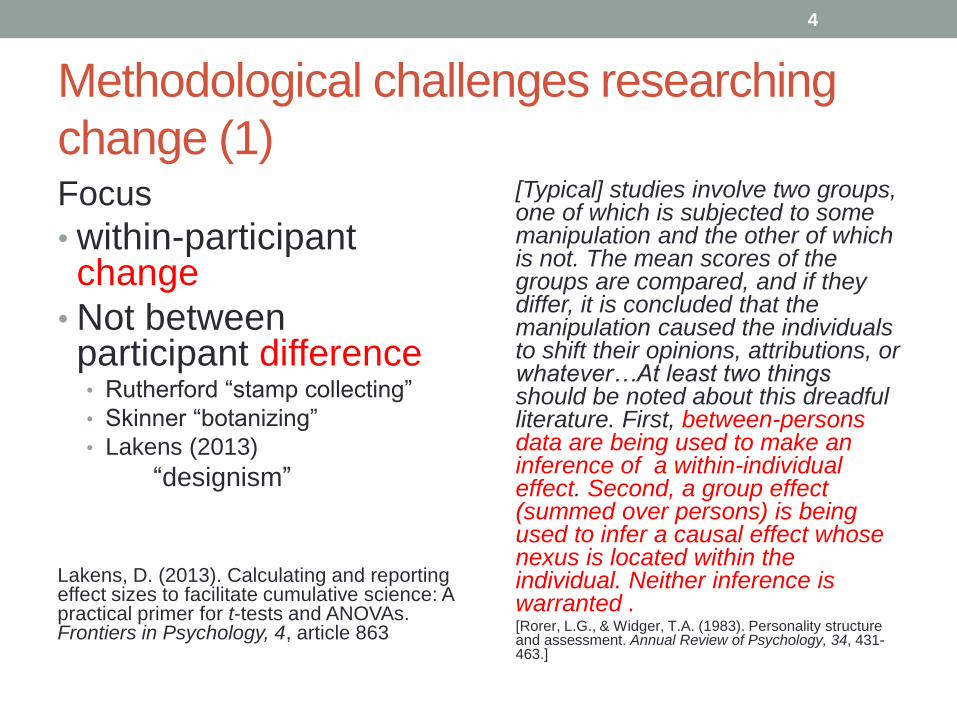
Methodological challenges researching
change (1) Focus
• within-participant change
• Not between participant difference • Rutherford “stamp collecting”
• Skinner “botanizing”
• Lakens (2013)
“designism”
Lakens, D. (2013). Calculating and reporting effect sizes to facilitate cumulative science: A practical primer for t-tests and ANOVAs. Frontiers in Psychology, 4, article 863
[Typical] studies involve two groups, one of which is subjected to some manipulation and the other of which is not. The mean scores of the groups are compared, and if they differ, it is concluded that the manipulation caused the individuals to shift their opinions, attributions, or whatever…At least two things should be noted about this dreadful literature. First, between-persons data are being used to make an inference of a within-individual effect. Second, a group effect (summed over persons) is being used to infer a causal effect whose nexus is located within the individual. Neither inference is warranted .
[Rorer, L.G., & Widger, T.A. (1983). Personality structure and assessment. Annual Review of Psychology, 34, 431-463.]
4

Methodological challenges researching
change (2)
Focus
• On Individuals, not
• Group means
So we need
idiographic
as well as
nomothetic
science
The application of knowledge is
always to the individual case
(Allport, 1942, p 58)
Causality operates on single
instances, not on populations.
(Cohen, 1994, p 1001).
… it is the individual organism
that is the principle unit of
analysis in the science of
psychology. (Barlow & Nock,
2009, p19).
5

Nomothetic vs idiographic research
nomothetic
Concerned with general laws
Concerned with the universal
Abstract
Timeless
Objective/impersonal
Inter-individual research
Legacy of Quetelet/Fisher
idiographic
Concerned with the individual
case in context
Concerned with the particular
Concrete
Historically situated
Subjective/personal
Intra-individual research
Legacy of Bernard/Pavlov/
Skinner
6

This is not a trivial issue
7

The concept of Reliable Change
Why do we need this concept?
Because
• What we study is intrinsically variable
(a natural phenomenon)
• We make errors of measurement in measuring things
(an inevitable part of measurement)
• Change affects observed variability
• Challenge: to separate the variability due to change from
the variability due to measurement error
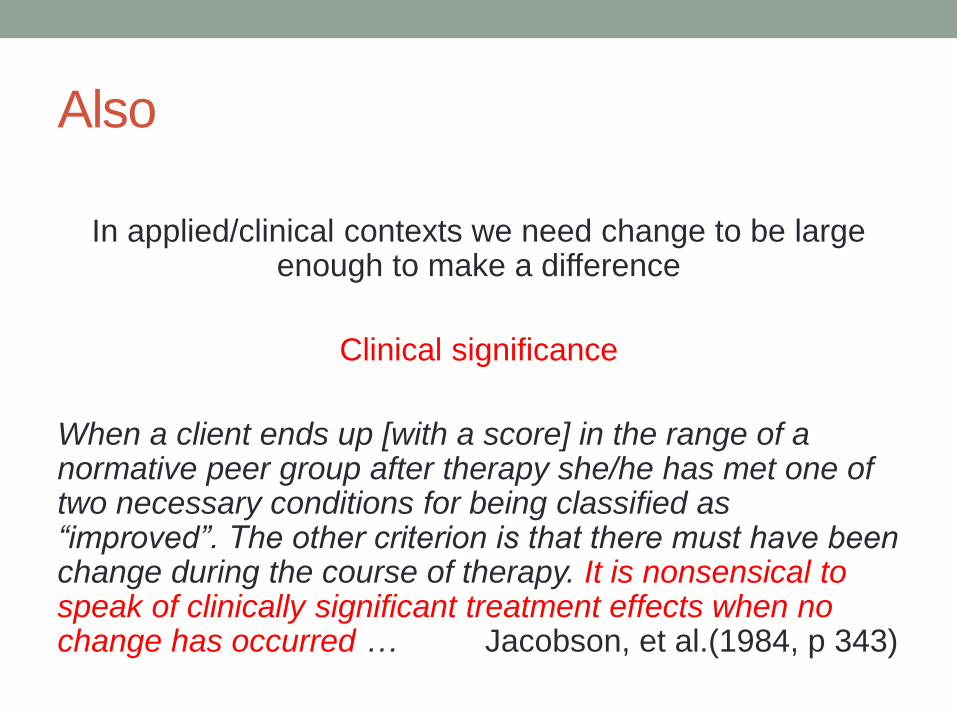
Also
In applied/clinical contexts we need change to be large enough to make a difference
Clinical significance
When a client ends up [with a score] in the range of a normative peer group after therapy she/he has met one of two necessary conditions for being classified as “improved”. The other criterion is that there must have been change during the course of therapy. It is nonsensical to speak of clinically significant treatment effects when no change has occurred … Jacobson, et al.(1984, p 343)
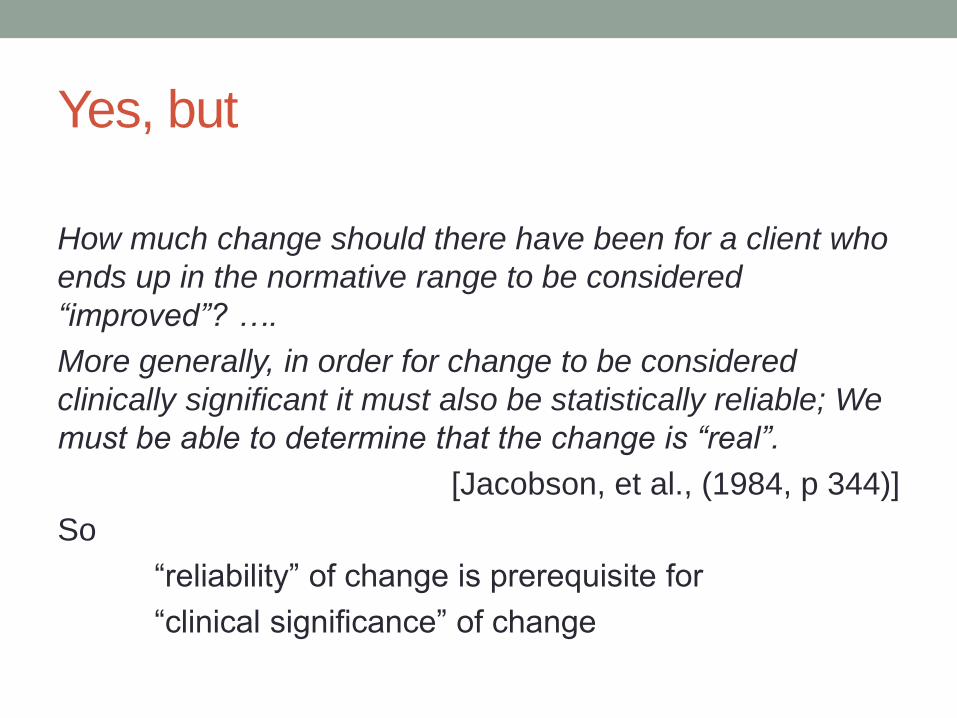
Yes, but
How much change should there have been for a client who
ends up in the normative range to be considered
“improved”? ….
More generally, in order for change to be considered
clinically significant it must also be statistically reliable; We
must be able to determine that the change is “real”.
[Jacobson, et al., (1984, p 344)]
So
“reliability” of change is prerequisite for
“clinical significance” of change

How to determine if change is statistically
reliable/ “real” – Reliable Change
Reliable change
&
The Reliable Change Index
Key reference
Jacobson, N.S., & Truax, P. (1991). Clinical significance: A statistical approach
to defining meaningful change in psychotherapy research. Journal of
Consulting & Clinical Psychology, 59, 12 – 19.
NB: has the correct formulas (Jacobson, et al., 1984 was wrong)

Reliable Change & Measurement Error
Frequency of error
• 17 - 18th C astronomy
• One astronomer
• One telescope
• Observing one object
Errors of observation:
• Many small +/-
• Moderate # intermediate
values +/-
• Few large errors +/-
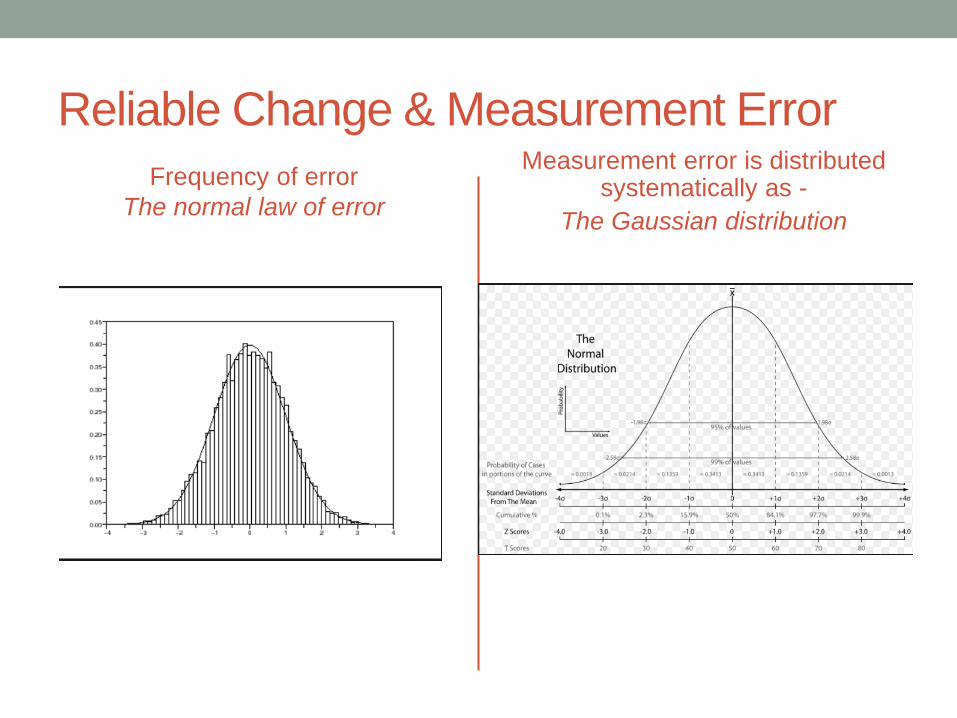
Reliable Change & Measurement Error
Frequency of error
The normal law of error
Measurement error is distributed systematically as -
The Gaussian distribution

Measurement error
• Unless measurement procedure is faulty, or
• Unless measurement instrument is biased
• ERRORS are NORMALLY DISTRIBUTED
• So, all properties of the Normal Curve apply to error
distributions
• Mean = 0
• SD – is called ‘The standard error’ [SEM]of the distribution
• 95% if errors will lie +=/- 1.96 Standard Errors

Logic of RCI
Is the same as for the t-test
Observation = true score +/- error
Ho for any Difference Score (Xtime1 – X time 2)
= no difference (true score 1 = true score 2)
(i.e., no treatment effect)
Therefore, if Difference Score ≠ 0, must be due to error
BUT, if Standardized Difference Score ≤ +/-1.96 this is improbable (p < .05) under Ho
Therefore we reject Ho and accept that there is a treatment effect (true score 1 ≠ true score 2) – in combination with error
15

Reliable Change
Steps & formulae
1. Compute Standard Error of
Measurement
SEM = s√1-rxx
This is the SD of the errors of measurement of any measurement instrument/process
Function of • Intrinsic variability of things being
measured - s
• Reliability of the measure – rxx
• Psychometrically, s is SD of some reference group
• rxx is reliability of instrument – test-retest or Chronbach’s alpha

Reliable Change
1. Compute Standard Error of
Measurement
SEM = s√1-rxx
2. Compute SDIFF
SDIFF = √ 2(SEM2)
A difference score will
compound error from both
measurements so
SDIFF > SEM
SDIFF is SD of the errors of
measurement of the Difference
Scores

Reliable Change
Steps & formulae
1. Compute Standard Error of
Measurement
SEM = s√1-rxx
2. Compute SDIFF
SDIFF = √ 2(SEM2)
3. Compute the difference score
for each individual
Diff = xt1-xt2
4. Compute RC= xt1-xt2/SDIFF
This is the same as computing a z-score
It standardizes the difference – Called Reliable Change – in SD units

RC computation
Steps & formulae
1. Compute Standard Error of Measurement
SEM = s√1-rxx
2. Compute SDIFF
SDIFF = √ 2(SEM2)
3. Compute the difference score for each individual
Diff = x1-x2
4. Compute RC = x1-x2/SDIFF
5. If RC≥1.96 a difference that large is in 5% tail of error distribution
- not likely due to measurement error alone – Change not likely due to measurement error p < .05
Example
1. If variability s = 7.5
Chronbach’s α = .80
SEM = 7.5√1- .8 = 3.35
2. SDIFF = √ 2(3.35*3.35) =
4.74
3. So if
xt1 = 47.75
xt2 = 32.5 Diff = -15
4. -15/4.74 = -3.16
-3.16 > 1.96 – Change is reliable

RC – what you need to know to compute
Info about the measure
• S = SD of reference data-set
• rxx = Test-retest reliability of
measure (Chronbach’s alpha)
Used to compute
1. SEM
2. SDIFF
NB:
RC = individual’s standardized score
RCI is index – absolute value
determines if score is in =/- 5% area
of error distribution
Source
Generally get these from published sources reporting the development and norms of the measure
Use local norms if possible
OR – calculate from you own data (if sample is large enough)

Reliable Change (RC) &
Reliable Change Index (RCI) -
RCI = the absolute value of the difference score required for RC to be reliable (i.e., unlikely, p<.05, due to measurement error alone)
From the example RCI = SDIFF * 1.96 = 9.3
So: 15 > 9.3 - Change is reliable
Eqn 1: RC = Diff/SDIFF Eqn 2: Diff = RCI = RC*SDIFF
NB: Literature is ambiguous about what “RC” & “RCI” refer to
Jacobson & Truax (1991) call RC an ‘index’.
But it is a standardized difference score
RCI is the absolute difference required for a change score to be regarded as reliably > measurement error

Calculating RC/RCI
Example
Specifically for the Depression scale of the DASS-42:
Step 1 Locate an appropriate source of test norms:
Lovibond and Lovibond (1995b) report the SD of their Australian
normative sample as 6.54 and Chronbach’s alpha as .91.
Step 2: by the formulae given in Jacobson & Truax, (1991) Calculate:
SEM = 1.64
SDiff = 2.31
RCI = 2.31 x 1.96 = 4.53.
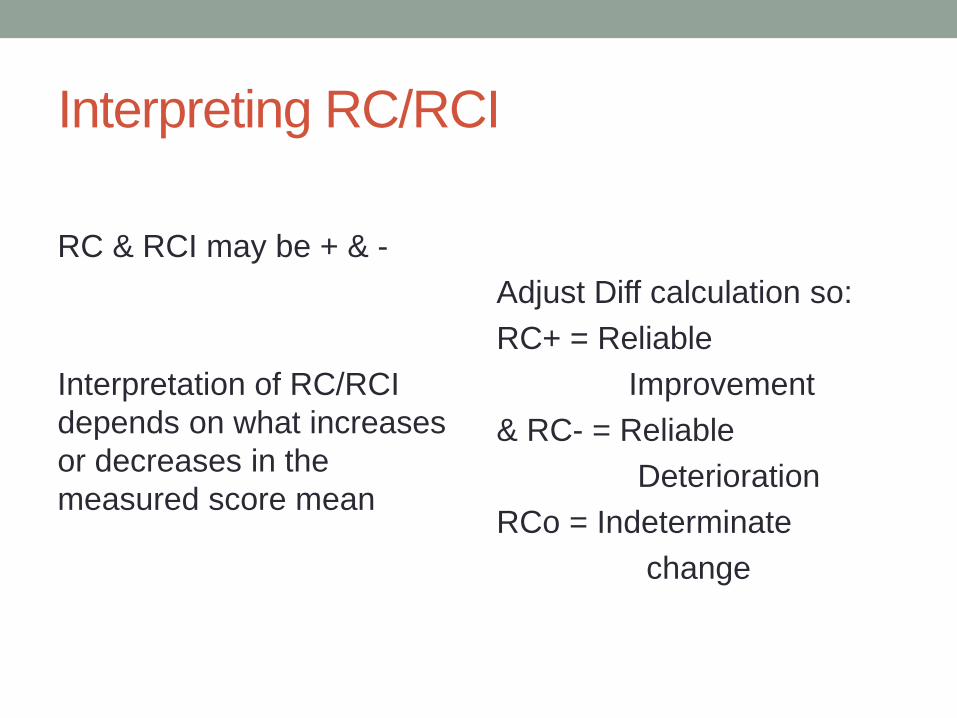
Interpreting RC/RCI
RC & RCI may be + & -
Interpretation of RC/RCI
depends on what increases
or decreases in the
measured score mean
Adjust Diff calculation so:
RC+ = Reliable
Improvement
& RC- = Reliable
Deterioration
RCo = Indeterminate
change

DASS-42: SDiff = 2.31, and RCI = 4.53.
Classifying USING Standardized Score
S# Pre Post Difference RC ?>/-1.96
9 22 2 20 8.66 Yes RC+
7 18 0 18 7.79 Yes RC+
2 17 1 16 6.93 Yes RC+
1 15 2 13 5.63 Yes RC+
5 31 19 12 5.19 Yes RC+
8 23 11 12 5.19 Yes RC+
4 13 2 11 4.76 Yes RC+
3 11 1 10 4.33 Yes RC+
6 18 13 5 2.16 Yes RC+
11 4 4 0 0.00 No RC0
12 13 15 -2 -0.87 No RC0
13 3 5 -2 -0.87 No RC0
14 1 3 -2 -0.87 No RC0
10 19 22 -3 -1.30 No RC0
16 33 40 -7 -3.03 Yes RC-
17 8 16 -8 -3.46 Yes RC-
15 12 26 -14 -6.06 Yes RC-
Classifyng USING RCI
S# Pre Post Difference ?>+/-4.53
9 22 2 20 Yes RC+
7 18 0 18 Yes RC+
2 17 1 16 Yes RC+
1 15 2 13 Yes RC+
5 31 19 12 Yes RC+
8 23 11 12 Yes RC+
4 13 2 11 Yes RC+
3 11 1 10 Yes RC+
6 18 13 5 Yes RC+
11 4 4 0 No RC0
12 13 15 -2 No RC0
13 3 5 -2 No RC0
14 1 3 -2 No RC0
10 19 22 -3 No RC0
16 33 40 -7 Yes RC-
17 8 16 -8 Yes RC-
15 12 26 -14 Yes RC-

Conclusion
RC+ 9/17 = 53%
RC0 5/17 = 29%
RC- 3/17 = 18%
NB: RC+% is an
Effect Size

RCI and Ceiling & Floor Effects
The RCo category will
be affected by ceiling
and floor effects.
May not matter as any
individuals affected will
likely not be in the
clinical range @
baseline
Ceiling effect
Max score – RCI
Floor effect
Min score + RCI
If in this zone at
baseline cannot show
reliable + change

Methodological lessons
• ALWAYS think about Measurement Error
• Measurement error has 2 components • 1. Random error 2. Systematic error
No Control Can reduce
How?
• Systematic measurement procedures
• Train persons doing measurement
• Calibrate your measurement instrument
Includes
• Select valid measure
• Match measure to cognitive abilities
• Age appropriate language etc
• Culturally appropriate measurement
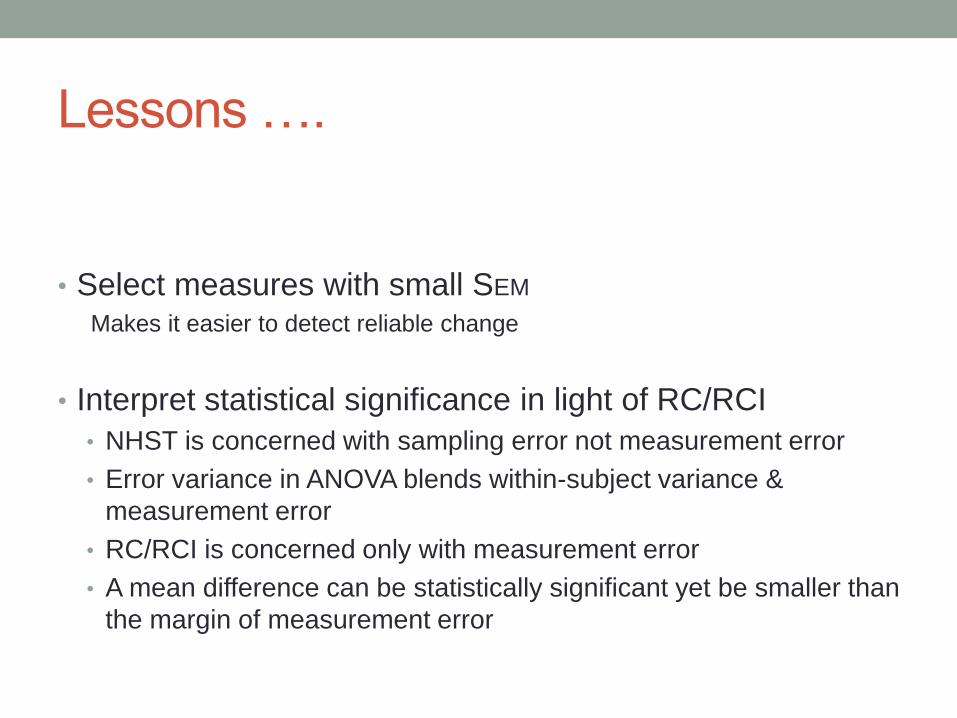
Lessons ….
• Select measures with small SEM
Makes it easier to detect reliable change
• Interpret statistical significance in light of RC/RCI
• NHST is concerned with sampling error not measurement error
• Error variance in ANOVA blends within-subject variance &
measurement error
• RC/RCI is concerned only with measurement error
• A mean difference can be statistically significant yet be smaller than
the margin of measurement error
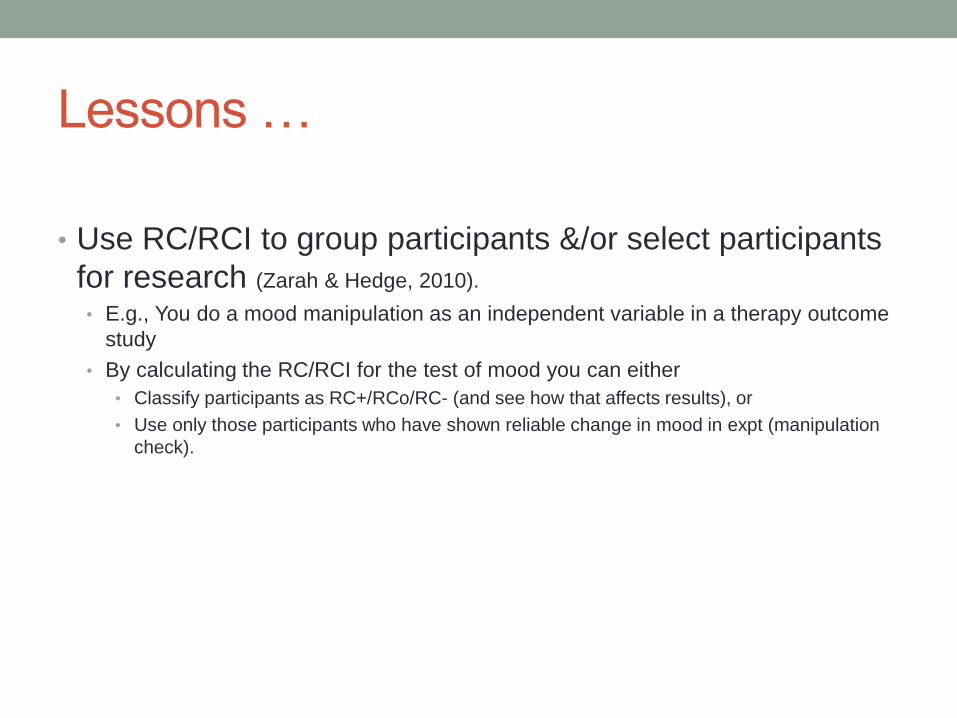
Lessons …
• Use RC/RCI to group participants &/or select participants
for research (Zarah & Hedge, 2010).
• E.g., You do a mood manipulation as an independent variable in a therapy outcome
study
• By calculating the RC/RCI for the test of mood you can either
• Classify participants as RC+/RCo/RC- (and see how that affects results), or
• Use only those participants who have shown reliable change in mood in expt (manipulation
check).

Calculating RC/RCI
Use a simple calculator following the Jacobson & Truax
(1991) formulas
Or: There are Excel calculators on-line: e.g.,
https://www.google.co.nz/#q=reliable+change+index+excel
Warning, this spreadsheet confuses RCI and RC (labels).
Remember RCI is absolute value of difference score
RC is standardized score to compare with 1.96
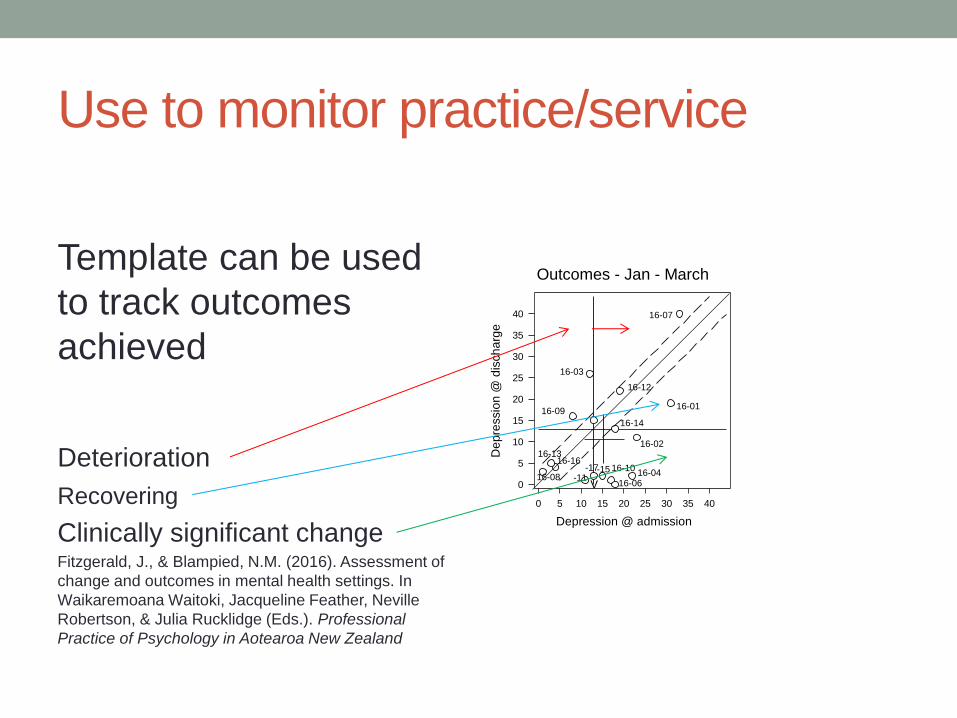
Use to monitor practice/service
Template can be used
to track outcomes
achieved
Deterioration Recovering
Clinically significant change Fitzgerald, J., & Blampied, N.M. (2016). Assessment of
change and outcomes in mental health settings. In
Waikaremoana Waitoki, Jacqueline Feather, Neville
Robertson, & Julia Rucklidge (Eds.). Professional
Practice of Psychology in Aotearoa New Zealand
Depression @ admission
0 5 10 15 20 25 30 35 40D
ep
ressio
n @
dis
ch
arg
e0
5
10
15
20
25
30
35
40
Outcomes - Jan - March
V
16-01
16-02
16-03
16-0416-06
16-07
16-08
16-09
16-10-11
16-12
16-13
16-14
-1516-16
-17

Caveat
Classic RC/RCI developed for clinical measures
(depression, anxiety, etc)
Neuropsychological, cognitive, educational measures etc
have practice effects to consider with repeated testing
RC/RCI formula needs adjusting for practice effect –
RCPE/RCIPE
& neuropsych often uses ±1.645 – covers the 90% of cases; p<.1
See Duff, K. (2012). Evidence-based indicators of neuropsychological change in the individual patient: Relevant concepts and methods. Archives of Clinical Neuropsychology, 27, 248 - 261

References
Jacobson, N.S., & Truax, P. (1991). Clinical significance: A statistical approach to defining
meaningful change in psychotherapy research. Journal of Consulting & Clinical
Psychology, 59, 12 – 19.
Fitzgerald, J., & Blampied, N.M. (2016). Assessment of change and outcomes in mental
health settings. In Waikaremoana Waitoki, Jacqueline Feather, Neville Robertson, & Julia
Rucklidge (Eds.). Professional Practice of Psychology in Aotearoa New Zealand
Wise, E.A. (2004). Methods for analyzing psychotherapy outcomes: A review of clinical
significance, reliable change, and recommendations for future directions. Journal of
Personality Assessment, 82(1), 50-59.