the condition of stem 2016—national - actthe condition of stem 2016 act has been a leader in...
TRANSCRIPT

The Condition of STEM 2016National

The Condition of STEM 2016ACT has been a leader in measuring college and career readiness trends for over 55 years. Each August, ACT releases The Condition of College & Career Readiness, our annual report on the progress of the ACT-tested graduating class relative to college readiness. Nationally, a record 64% of the 2016 graduating class took the ACT® test. The continued increase in the number of ACT test takers enhances the breadth and depth of our data pool, providing a comprehensive picture of the current college readiness levels of the graduating class as well as offering a glimpse of the emerging general and STEM (Science, Technology, Engineering, Math) education pipeline in the United States.
This report reviews the graduating class in the context of STEM-related fields. ACT is uniquely positioned to deliver this report for two key reasons. First is our commitment to science through the inclusion of a science test in our assessments. ACT leadership is unmatched in providing a definitive assessment in the science area. Second is the research-based ACT Interest Inventory, which is completed by ACT-tested students and measures their interest in a wide range of educational and occupational fields.
With answers to the ACT Interest Inventory and responses to the Student Profile Section of the ACT, we can determine interest levels (both expressed and measured) in specific STEM fields. We can then assess college readiness in math and science among STEM-interested students using ACT test scores. Students with an expressed interest are those who chose a major or occupation (out of the 294 possibilities listed) that is classified as a STEM field. Students are designated to have a measured interest when their responses to the ACT Interest Inventory items result in high science and technology interest scores.
Interest Inventory
Validity evidence for this two-factor model of identifying STEM interest was provided in an ACT research study (Crouse, Harmston, & Radunzel, 2016). Figure 1 highlights some of the findings. Those students who were identified as having expressed and measured STEM interest were the most likely to pursue a STEM major, regardless of where they were in their college experience. Those students were also the most likely to graduate with a STEM major. When compared to students with an expressed and measured interest in STEM, students who were identified as having expressed-only or measured-only STEM interest had lower rates of pursuing and graduating with STEM majors while students who had no STEM interest had the lowest rates of all groups. Overall, the results suggest the ACT method for identifying STEM-interested students is valid and can be helpful for predicting whether students will pursue and graduate with STEM-related majors in college.
The ACT Definition of STEM
To create our STEM categories, we used our list of occupations and majors to define four key areas: Science, Computer Science and Mathematics, Medical and Health, and Engineering and Technology. This report will show achievement levels and trend data in each of those areas on a national level. In addition, the actual number and percentage of students interested in specific majors and occupations are provided. As the percentage of high school graduates taking the ACT continues to grow, these data present an excellent opportunity for state officials to document success of STEM initiatives within their state in an attempt to meet the goal of generating interest and more thoroughly preparing students for STEM fields.
OverallFirst-Term STEM Any Term STEM MGraduated With STEM Major
All STEM In 46 59 48Exp. and M 56 70 60Exp. Only 47 60 46Meas. Only 29 40 30No STEM I 14 23 15No STEM 9 16 9 ***Omitting NM/UM
56 70 6047 60 4629 40 30
46
59
48
9
16
9
0
10
20
30
40
50
60
70
80
90
100
First-Term STEM Major Any Term STEM Major Graduated With STEMMajor
Perc
enta
ge
Exp. andMeas.
Exp. Only
Meas.Only
All STEMInterest
No STEM
MS5012 THE CONDITION OF STEM 2016
Key Findingsfrom the National Condition of STEM 2016 Report
• Students with an interest in STEM continue to show higher levels of college readiness than ACT-tested students as a whole.
• Approximately half of ACT-tested US graduates in the class of 2016 have expressed interest in STEM majors and careers. The level of interest has stayed steady over the last five years.
• Average ACT math scores have stayed flat between 2012 and 2016 for students meeting the ACT STEM Benchmark. In contrast, the average ACT science score has gone up among those meeting the ACT STEM Benchmark over the same timeframe. The scores steadily increased from 27.9 to 28.6 since 2012 (see Table 1.6 of the 2016 national ACT profile report at: www.act.org/research/np16).
• Over 1 million ACT-tested students demonstrated an interest in STEM in the 2016 graduating class.
• Only 1,258 students out of the nearly 2.1 million tested students—less than 1% of the total—had an expressed and measured interest in teaching math or science.
• Students demonstrating only one type of STEM interest, either expressed or measured, fall far short in terms of benchmark attainment and preparedness for STEM majors and careers when compared to peers who have both expressed and measured interest.
• Underserved learners have a high interest in STEM, but ACT STEM Benchmark attainment lags far behind their peers, especially for those students with more than one of the underserved characteristics used in this report.
ACT STEM Benchmark
To provide students and educators with more insight into the critical aspects of college readiness, ACT introduced a STEM score on ACT student score reports in fall 2015. This score is derived from the ACT mathematics and science scores and represents students’ overall performance in these subject areas. For the 2016–17 academic year, students, parents, and educators will also note that the ACT College Readiness Benchmark in STEM has been added to the ACT score report. The ACT STEM Benchmark is based on recent research indicating that academic readiness for students pursuing a STEM major may require higher scores than the current ACT College Readiness Benchmarks in math and science (Mattern, Radunzel, & Westrick, 2015).
The ACT STEM Benchmark was developed using the same methodology as each single subject area ACT College Readiness Benchmark. Typical grades in first-year college STEM courses (calculus, general biology, general chemistry, and physics) were combined in a single course success model to determine the ACT STEM score associated with a 50% chance of earning a B or higher and about a 75% chance of earning a C or higher in those courses. The resulting ACT STEM Benchmark is 26. Based on that benchmark, only 20% of students in the 2016 ACT-tested high school graduating class were ready for first-year STEM college courses.
ACT STEM scores are related not only to succeeding in individual math and science courses, but also to achieving longer-term outcomes. Mattern et al. (2015) showed that students pursuing STEM majors who met the ACT STEM Benchmark were more likely to earn a cumulative grade point average of 3.0 or higher, persist in a STEM major, and earn a STEM-related bachelor’s degree than those who failed to meet the benchmark. Additionally, ongoing research suggests that providing STEM readiness information to prospective students may help to facilitate the transition to college by aligning students’ expectations with course demands.
3

National STEM ReportAttainment of College and Career Readiness
Overall STEM Interest• Between 2012 and
2016, the percent of students interested in STEM stayed the same.
Overall STEM Interest
Percent of 2016 ACT-Tested High School Graduates Meeting ACT College Readiness and STEM Benchmarks
67
49 4843
3226
0
20
40
60
80
100
English Reading Mathematics Science All FourSubjects
STEM
Perc
ent
Nation
Nation
Expressed and Measured Interest
Percent of 2016 ACT-Tested High School Graduates Meeting ACT College Readiness and STEM Benchmarks
76
59 5753
4133
0
20
40
60
80
100
English Reading Mathematics Science All FourSubjects
STEM
Perc
ent
Nation
Nation
Expressed Interest Only
Percent of 2016 ACT-Tested High School Graduates Meeting ACT College Readiness and STEM Benchmarks
61
44 4538
2823
0
20
40
60
80
100
English Reading Mathematics Science All FourSubjects
STEM
Perc
ent
Nation
Nation
Measured Interest Only
Percent of 2016 ACT-Tested High School Graduates Meeting ACT College Readiness and STEM Benchmarks
63
4739 37
2619
0
20
40
60
80
100
English Reading Mathematics Science All FourSubjects
STEM
Perc
ent
Nation
Nation
Note: Percents in this report may not sum to 100% due to rounding.
Student STEM Interest Trends: 2012–2016
2012 2013 2014 2015 2016
Percent National 48% 48% 49% 49% 48%
N Count National 804,507 868,194 899,684 939,049 1,009,232
• 1,009,232 graduates have an interest in STEM. • 351,517 graduates have an expressed and measured interest in STEM, which is 35% of the overall interest.
• 472,879 graduates have an expressed interest in STEM, which is 47% of the overall interest.
• 184,836 graduates have a measured interest in STEM, which is 18% of the overall interest.
4 THE CONDITION OF STEM 2016
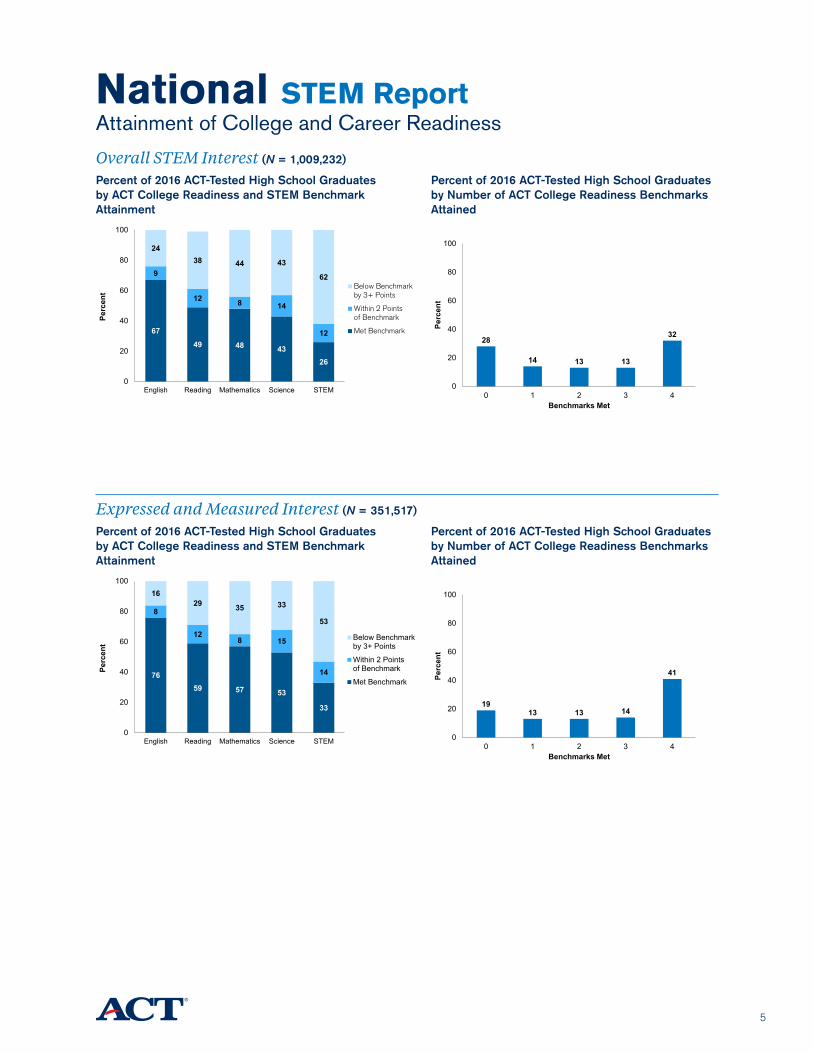
Overall STEM Interest (N = 1,009,232)
Percent of 2016 ACT-Tested High School Graduates by ACT College Readiness and STEM Benchmark Attainment
67
49 48 4326
9
12 8 14
12
2438 44 43
62
0
20
40
60
80
100
English Reading Mathematics Science STEM
Perc
ent
Below Benchmarkby 3+ Points
Within 2 Pointsof Benchmark
Met Benchmark
Percent of 2016 ACT-Tested High School Graduates by Number of ACT College Readiness Benchmarks Attained
28
14 13 13
32
0
20
40
60
80
100
0 1 2 3 4
Perc
ent
Benchmarks Met
Nation
Nation
Expressed and Measured Interest (N = 351,517)
Percent of 2016 ACT-Tested High School Graduates by ACT College Readiness and STEM Benchmark Attainment
7659 57 53
33
8
128 15
14
1629 35 33
53
0
20
40
60
80
100
English Reading Mathematics Science STEM
Perc
ent
Below Benchmarkby 3+ Points
Within 2 Pointsof Benchmark
Met Benchmark
Percent of 2016 ACT-Tested High School Graduates by Number of ACT College Readiness Benchmarks Attained
1913 13 14
41
0
20
40
60
80
100
0 1 2 3 4
Perc
ent
Benchmarks Met
Nation
Nation
National STEM ReportAttainment of College and Career Readiness
5
National STEM ReportAttainment of College and Career Readiness
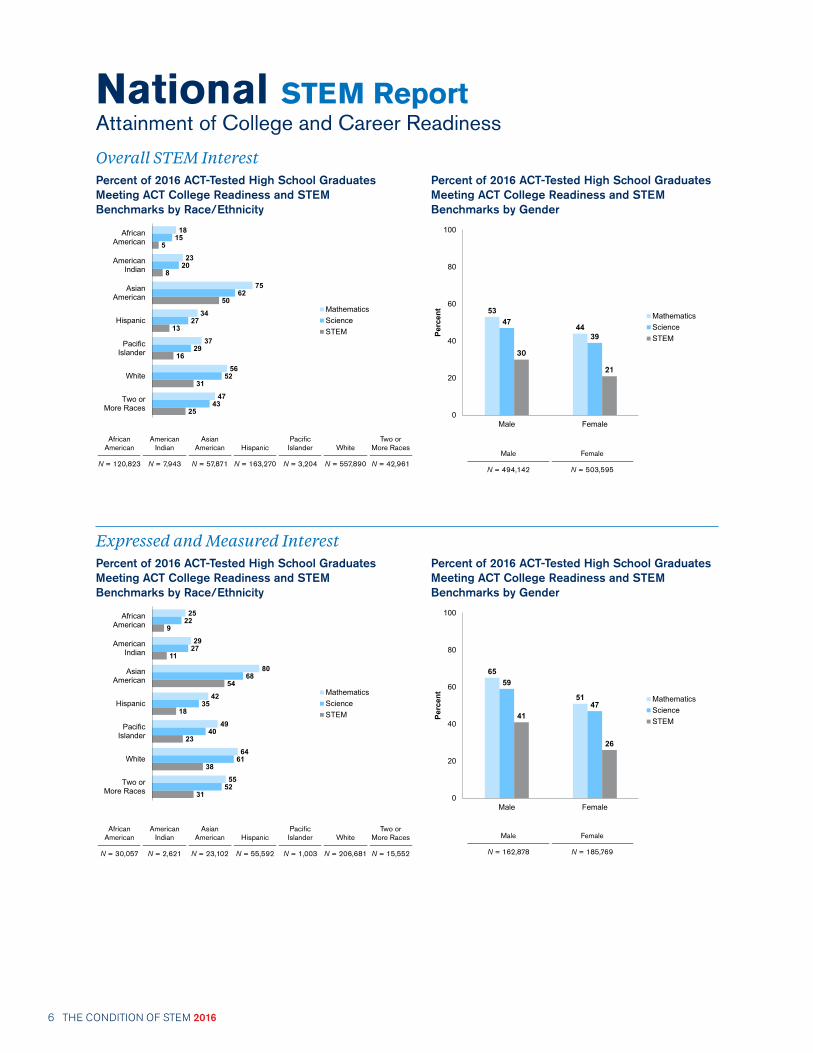
Overall STEM InterestPercent of 2016 ACT-Tested High School Graduates Meeting ACT College Readiness and STEM Benchmarks by Race/Ethnicity
25
31
16
13
50
8
5
43
52
29
27
62
20
15
47
56
37
34
75
23
18
Two orMore Races
White
PacificIslander
Hispanic
AsianAmerican
AmericanIndian
AfricanAmerican
MathematicsScienceSTEM
African American
American Indian
Asian American
Hispanic
Pacific Islander
White
Two or More Races
N = 120,823 N = 7,943 N = 57,871 N = 163,270 N = 3,204 N = 557,890 N = 42,961
Percent of 2016 ACT-Tested High School Graduates Meeting ACT College Readiness and STEM Benchmarks by Gender
53
4447
39
30
21
0
20
40
60
80
100
Male Female
Perc
ent
MathematicsScienceSTEM
Male Female
N = 494,142 N = 503,595
Expressed and Measured InterestPercent of 2016 ACT-Tested High School Graduates Meeting ACT College Readiness and STEM Benchmarks by Race/Ethnicity
31
38
23
18
54
11
9
52
61
40
35
68
27
22
55
64
49
42
80
29
25
Two orMore Races
White
PacificIslander
Hispanic
AsianAmerican
AmericanIndian
AfricanAmerican
MathematicsScienceSTEM
African American
American Indian
Asian American
Hispanic
Pacific Islander
White
Two or More Races
N = 30,057 N = 2,621 N = 23,102 N = 55,592 N = 1,003 N = 206,681 N = 15,552
Percent of 2016 ACT-Tested High School Graduates Meeting ACT College Readiness and STEM Benchmarks by Gender
65
51
59
4741
26
0
20
40
60
80
100
Male Female
Perc
ent
MathematicsScienceSTEM
Male Female
N = 162,878 N = 185,769
6 THE CONDITION OF STEM 2016
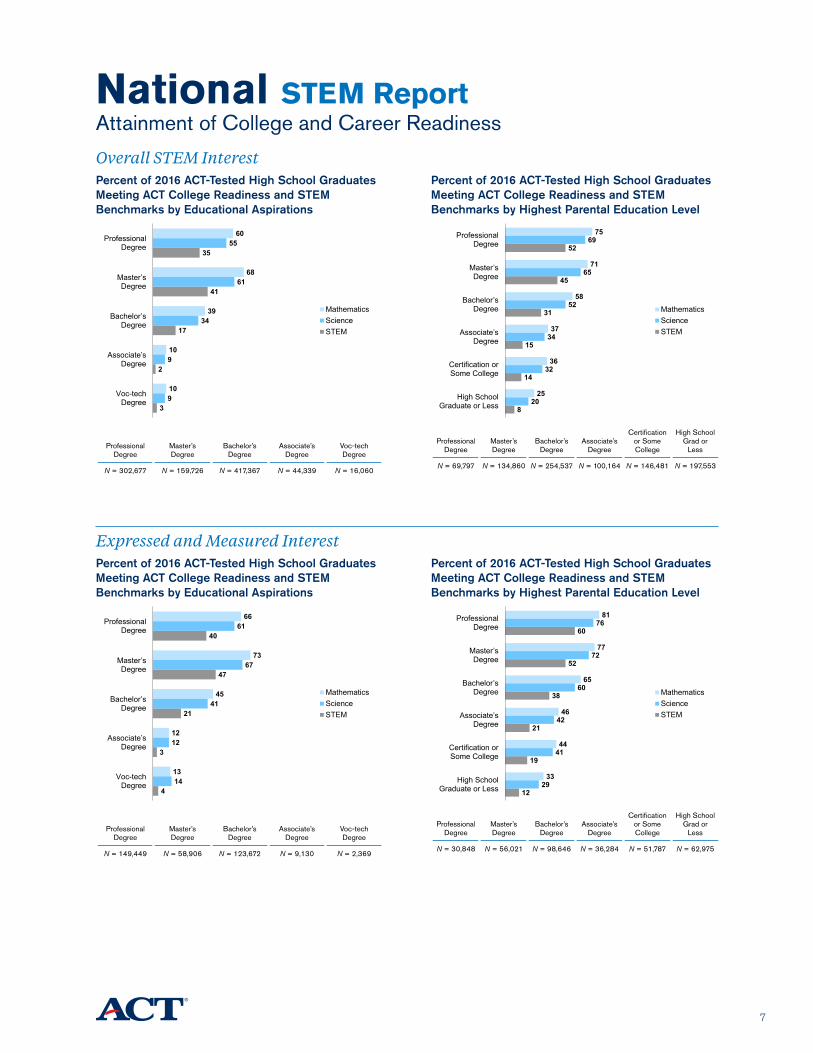
Overall STEM InterestPercent of 2016 ACT-Tested High School Graduates Meeting ACT College Readiness and STEM Benchmarks by Educational Aspirations
3
2
17
41
35
9
9
34
61
55
10
10
39
68
60
Voc-techDegree
Associate’sDegree
Bachelor’sDegree
Master’sDegree
ProfessionalDegree
MathematicsScienceSTEM
Professional Degree
Master’s Degree
Bachelor’s Degree
Associate’s Degree
Voc-tech Degree
N = 302,677 N = 159,726 N = 417,367 N = 44,339 N = 16,060
Percent of 2016 ACT-Tested High School Graduates Meeting ACT College Readiness and STEM Benchmarks by Highest Parental Education Level
8
14
15
31
45
52
20
32
34
52
65
69
25
36
37
58
71
75
High SchoolGraduate or Less
Certification orSome College
Associate’sDegree
Bachelor’sDegree
Master’sDegree
ProfessionalDegree
MathematicsScienceSTEM
Professional
Degree
Master’s Degree
Bachelor’s
Degree
Associate’s
Degree
Certification or Some College
High School Grad or
Less
N = 69,797 N = 134,860 N = 254,537 N = 100,164 N = 146,481 N = 197,553
Expressed and Measured InterestPercent of 2016 ACT-Tested High School Graduates Meeting ACT College Readiness and STEM Benchmarks by Educational Aspirations
4
3
21
47
40
14
12
41
67
61
13
12
45
73
66
Voc-techDegree
Associate’sDegree
Bachelor’sDegree
Master’sDegree
ProfessionalDegree
MathematicsScienceSTEM
Professional Degree
Master’s Degree
Bachelor’s Degree
Associate’s Degree
Voc-tech Degree
N = 149,449 N = 58,906 N = 123,672 N = 9,130 N = 2,369
Percent of 2016 ACT-Tested High School Graduates Meeting ACT College Readiness and STEM Benchmarks by Highest Parental Education Level
12
19
21
38
52
60
29
41
42
60
72
76
33
44
46
65
77
81
High SchoolGraduate or Less
Certification orSome College
Associate’sDegree
Bachelor’sDegree
Master’sDegree
ProfessionalDegree
MathematicsScienceSTEM
Professional
Degree
Master’s Degree
Bachelor’s
Degree
Associate’s
Degree
Certification or Some College
High School Grad or
Less
N = 30,848 N = 56,021 N = 98,646 N = 36,284 N = 51,787 N = 62,975
National STEM ReportAttainment of College and Career Readiness
7

ScienceMajors/Occupations
Overall STEM Interest• Between 2012 and
2016, the percent of students interested in STEM decreased by 1%.
Overall STEM Interest (N = 223,943)
Percent of 2016 ACT-Tested High School Graduates by ACT College Readiness and STEM Benchmark Attainment
7458 53 49
29
8
128 14
13
1830
40 36
57
0
20
40
60
80
100
English Reading Mathematics Science STEM
Perc
ent
Below Benchmarkby 3+ Points
Within 2 Pointsof Benchmark
Met Benchmark
Percent of 2016 ACT-Tested High School Graduates by Number of ACT College Readiness Benchmarks Attained
2113 13 14
38
0
20
40
60
80
100
0 1 2 3 4
Perc
ent
Benchmarks Met
Expressed and Measured Interest (N = 96,656)
Percent of 2016 ACT-Tested High School Graduates by ACT College Readiness and STEM Benchmark Attainment
8064 61 57
36
7
118 14
15
1325 32 29
49
0
20
40
60
80
100
English Reading Mathematics Science STEM
Perc
ent
Below Benchmarkby 3+ Points
Within 2 Pointsof Benchmark
Met Benchmark
Percent of 2016 ACT-Tested High School Graduates by Number of ACT College Readiness Benchmarks Attained
1612 13 15
45
0
20
40
60
80
100
0 1 2 3 4
Perc
ent
Benchmarks Met
Note: Reporting achievement by combinations of student characteristics may give rise to small N counts. As a result, outcomes reported in this section should be interpreted with caution.
NATIONAL STEM REPORT
Student STEM Interest Trends: 2012–2016
2012 2013 2014 2015 2016
Percent National 23% 22% 22% 22% 22%
N Count National 183,857 195,098 200,461 208,520 223,943
8 THE CONDITION OF STEM 2016
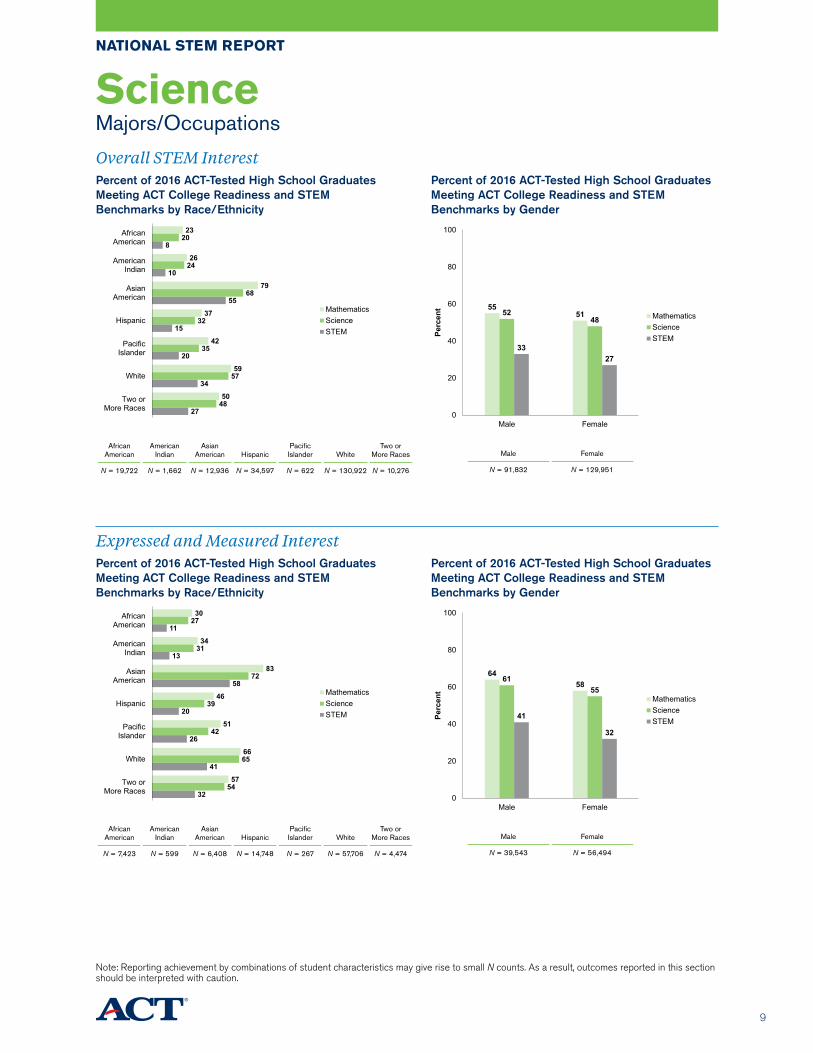
Overall STEM InterestPercent of 2016 ACT-Tested High School Graduates Meeting ACT College Readiness and STEM Benchmarks by Race/Ethnicity
27
34
20
15
55
10
8
48
57
35
32
68
24
20
50
59
42
37
79
26
23
Two orMore Races
White
PacificIslander
Hispanic
AsianAmerican
AmericanIndian
AfricanAmerican
MathematicsScienceSTEM
African American
American Indian
Asian American
Hispanic
Pacific Islander
White
Two or More Races
N = 19,722 N = 1,662 N = 12,936 N = 34,597 N = 622 N = 130,922 N = 10,276
Percent of 2016 ACT-Tested High School Graduates Meeting ACT College Readiness and STEM Benchmarks by Gender
555152
48
3327
0
20
40
60
80
100
Male Female
Perc
ent
MathematicsScienceSTEM
Male Female
N = 91,832 N = 129,951
Expressed and Measured InterestPercent of 2016 ACT-Tested High School Graduates Meeting ACT College Readiness and STEM Benchmarks by Race/Ethnicity
32
41
26
20
58
13
11
54
65
42
39
72
31
27
57
66
51
46
83
34
30
Two orMore Races
White
PacificIslander
Hispanic
AsianAmerican
AmericanIndian
AfricanAmerican
MathematicsScienceSTEM
African American
American Indian
Asian American
Hispanic
Pacific Islander
White
Two or More Races
N = 7,423 N = 599 N = 6,408 N = 14,748 N = 267 N = 57,706 N = 4,474
Percent of 2016 ACT-Tested High School Graduates Meeting ACT College Readiness and STEM Benchmarks by Gender
6458
6155
41
32
0
20
40
60
80
100
Male Female
Perc
ent
MathematicsScienceSTEM
Male Female
N = 39,543 N = 56,494
ScienceMajors/Occupations
NATIONAL STEM REPORT
Note: Reporting achievement by combinations of student characteristics may give rise to small N counts. As a result, outcomes reported in this section should be interpreted with caution.
9
ScienceMajors/Occupations
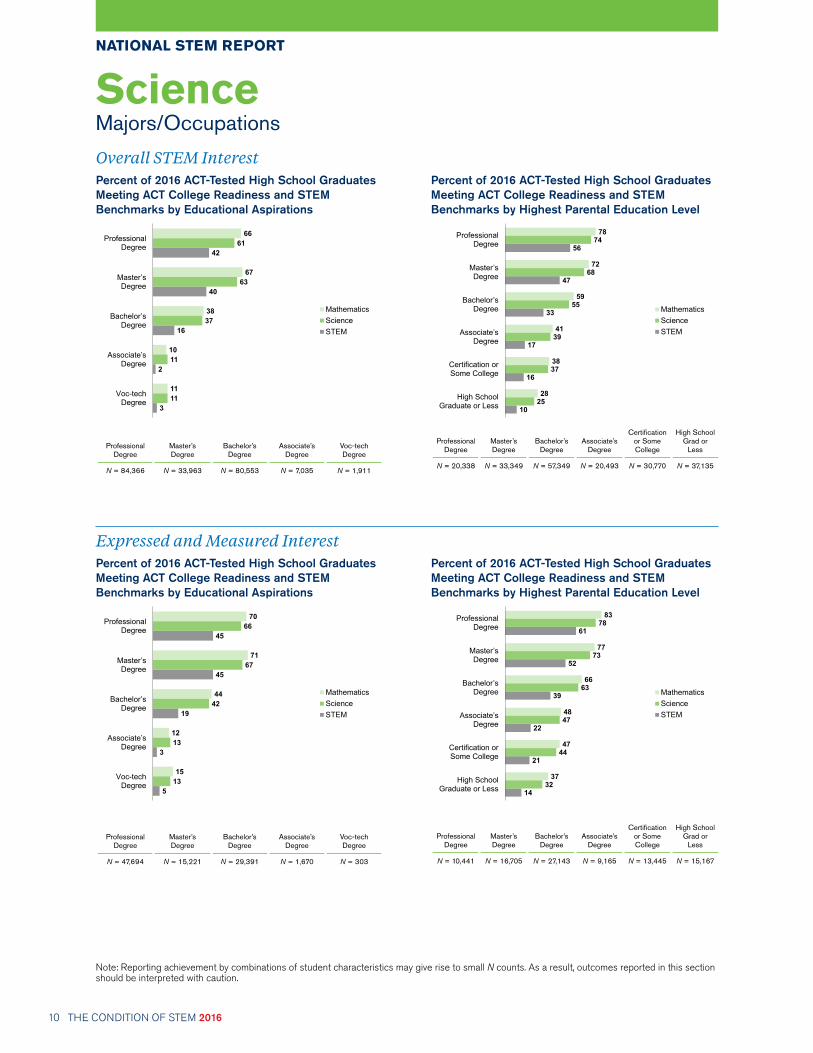
Overall STEM InterestPercent of 2016 ACT-Tested High School Graduates Meeting ACT College Readiness and STEM Benchmarks by Educational Aspirations
3
2
16
40
42
11
11
37
63
61
11
10
38
67
66
Voc-techDegree
Associate’sDegree
Bachelor’sDegree
Master’sDegree
ProfessionalDegree
MathematicsScienceSTEM
Professional Degree
Master’s Degree
Bachelor’s Degree
Associate’s Degree
Voc-tech Degree
N = 84,366 N = 33,963 N = 80,553 N = 7,035 N = 1,911
Percent of 2016 ACT-Tested High School Graduates Meeting ACT College Readiness and STEM Benchmarks by Highest Parental Education Level
10
16
17
33
47
56
25
37
39
55
68
74
28
38
41
59
72
78
High SchoolGraduate or Less
Certification orSome College
Associate’sDegree
Bachelor’sDegree
Master’sDegree
ProfessionalDegree
MathematicsScienceSTEM
Professional
Degree
Master’s Degree
Bachelor’s
Degree
Associate’s
Degree
Certification or Some College
High School Grad or
Less
N = 20,338 N = 33,349 N = 57,349 N = 20,493 N = 30,770 N = 37,135
Expressed and Measured InterestPercent of 2016 ACT-Tested High School Graduates Meeting ACT College Readiness and STEM Benchmarks by Educational Aspirations
5
3
19
45
45
13
13
42
67
66
15
12
44
71
70
Voc-techDegree
Associate’sDegree
Bachelor’sDegree
Master’sDegree
ProfessionalDegree
MathematicsScienceSTEM
Professional Degree
Master’s Degree
Bachelor’s Degree
Associate’s Degree
Voc-tech Degree
N = 47,694 N = 15,221 N = 29,391 N = 1,670 N = 303
Percent of 2016 ACT-Tested High School Graduates Meeting ACT College Readiness and STEM Benchmarks by Highest Parental Education Level
14
21
22
39
52
61
32
44
47
63
73
78
37
47
48
66
77
83
High SchoolGraduate or Less
Certification orSome College
Associate’sDegree
Bachelor’sDegree
Master’sDegree
ProfessionalDegree
MathematicsScienceSTEM
Professional
Degree
Master’s Degree
Bachelor’s
Degree
Associate’s
Degree
Certification or Some College
High School Grad or
Less
N = 10,441 N = 16,705 N = 27,143 N = 9,165 N = 13,445 N = 15,167
NATIONAL STEM REPORT
Note: Reporting achievement by combinations of student characteristics may give rise to small N counts. As a result, outcomes reported in this section should be interpreted with caution.
10 THE CONDITION OF STEM 2016

* The “overall STEM interest” counts and percents do not include the “measured only interest” students, as they did not choose a STEM major or occupation.
ScienceMajors/Occupations
NATIONAL STEM REPORT
Science Majors/Occupations
National N Counts and Percents
Overall STEM Interest* Expressed and Measured
N Count Percent N Count Percent
Agronomy and Crop Science 1,562 1 541 1
Animal Sciences 9,248 6 3,805 4
Astronomy 4,072 2 2,845 3
Atmospheric Sciences and Meteorology 1,687 1 895 1
Biochemistry and Biophysics 19,881 12 13,011 13
Biology, General 38,525 24 24,053 25
Cell/Cellular Biology 8,585 5 5,386 6
Chemistry 12,282 8 7,919 8
Ecology 2,069 1 1,247 1
Environmental Science 2,732 2 1,430 1
Food Sciences and Technology 1,465 1 418 0
Forestry 1,940 1 637 1
Genetics 5,286 3 3,436 4
Geological and Earth Sciences 2,864 2 1,778 2
Horticulture Science 666 0 284 0
Marine/Aquatic Biology 13,652 8 8,404 9
Microbiology and Immunology 4,184 3 2,947 3
Natural Resources Conservation, General 2,290 1 1,000 1
Natural Resources Management 847 1 292 0
Physical Sciences, General 5,991 4 3,471 4
Physics 6,384 4 4,075 4
Science Education 1,261 1 720 1
Wildlife and Wildlands Management 4,758 3 1,699 2
Zoology 11,038 7 6,363 7
Totals 163,269 96,656
11

Computer Science and MathematicsMajors/Occupations
Overall STEM Interest• Between 2012 and
2016, the percent of students interested in STEM increased by 3%.
Overall STEM Interest (N = 117,086)
Percent of 2016 ACT-Tested High School Graduates by ACT College Readiness and STEM Benchmark Attainment
6650 51 45
29
9
11 7 13
12
2539 42 42
59
0
20
40
60
80
100
English Reading Mathematics Science STEM
Perc
ent
Below Benchmarkby 3+ Points
Within 2 Pointsof Benchmark
Met Benchmark
Percent of 2016 ACT-Tested High School Graduates by Number of ACT College Readiness Benchmarks Attained
28
13 12 13
34
0
20
40
60
80
100
0 1 2 3 4
Perc
ent
Benchmarks Met
Expressed and Measured Interest (N = 22,895)
Percent of 2016 ACT-Tested High School Graduates by ACT College Readiness and STEM Benchmark Attainment
7964 65 60
41
7
10 7 13
14
1426 29 27
45
0
20
40
60
80
100
English Reading Mathematics Science STEM
Perc
ent
Below Benchmarkby 3+ Points
Within 2 Pointsof Benchmark
Met Benchmark
Percent of 2016 ACT-Tested High School Graduates by Number of ACT College Readiness Benchmarks Attained
1610 12 14
48
0
20
40
60
80
100
0 1 2 3 4
Perc
ent
Benchmarks Met
Note: Reporting achievement by combinations of student characteristics may give rise to small N counts. As a result, outcomes reported in this section should be interpreted with caution.
NATIONAL STEM REPORT
Student STEM Interest Trends: 2012–2016
2012 2013 2014 2015 2016
Percent National 9% 9% 10% 11% 12%
N Count National 74,959 82,197 89,755 101,144 117,086
12 THE CONDITION OF STEM 2016
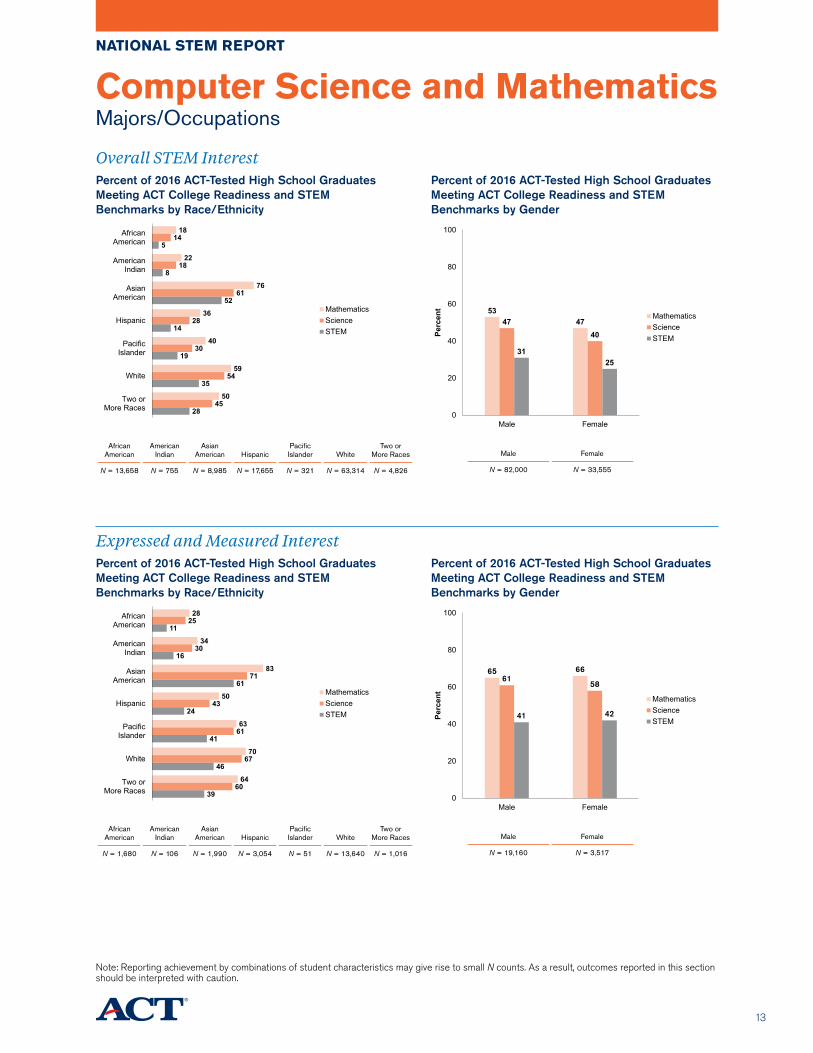
Overall STEM InterestPercent of 2016 ACT-Tested High School Graduates Meeting ACT College Readiness and STEM Benchmarks by Race/Ethnicity
28
35
19
14
52
8
5
45
54
30
28
61
18
14
50
59
40
36
76
22
18
Two orMore Races
White
PacificIslander
Hispanic
AsianAmerican
AmericanIndian
AfricanAmerican
MathematicsScienceSTEM
African American
American Indian
Asian American
Hispanic
Pacific Islander
White
Two or More Races
N = 13,658 N = 755 N = 8,985 N = 17,655 N = 321 N = 63,314 N = 4,826
Percent of 2016 ACT-Tested High School Graduates Meeting ACT College Readiness and STEM Benchmarks by Gender
534747
40
3125
0
20
40
60
80
100
Male Female
Perc
ent
MathematicsScienceSTEM
Male Female
N = 82,000 N = 33,555
Expressed and Measured InterestPercent of 2016 ACT-Tested High School Graduates Meeting ACT College Readiness and STEM Benchmarks by Race/Ethnicity
39
46
41
24
61
16
11
60
67
61
43
71
30
25
64
70
63
50
83
34
28
Two orMore Races
White
PacificIslander
Hispanic
AsianAmerican
AmericanIndian
AfricanAmerican
MathematicsScienceSTEM
African American
American Indian
Asian American
Hispanic
Pacific Islander
White
Two or More Races
N = 1,680 N = 106 N = 1,990 N = 3,054 N = 51 N = 13,640 N = 1,016
Percent of 2016 ACT-Tested High School Graduates Meeting ACT College Readiness and STEM Benchmarks by Gender
65 6661
58
41 42
0
20
40
60
80
100
Male Female
Perc
ent
MathematicsScienceSTEM
Male Female
N = 19,160 N = 3,517
Computer Science and MathematicsMajors/Occupations
NATIONAL STEM REPORT
Note: Reporting achievement by combinations of student characteristics may give rise to small N counts. As a result, outcomes reported in this section should be interpreted with caution.
13
Computer Science and MathematicsMajors/Occupations
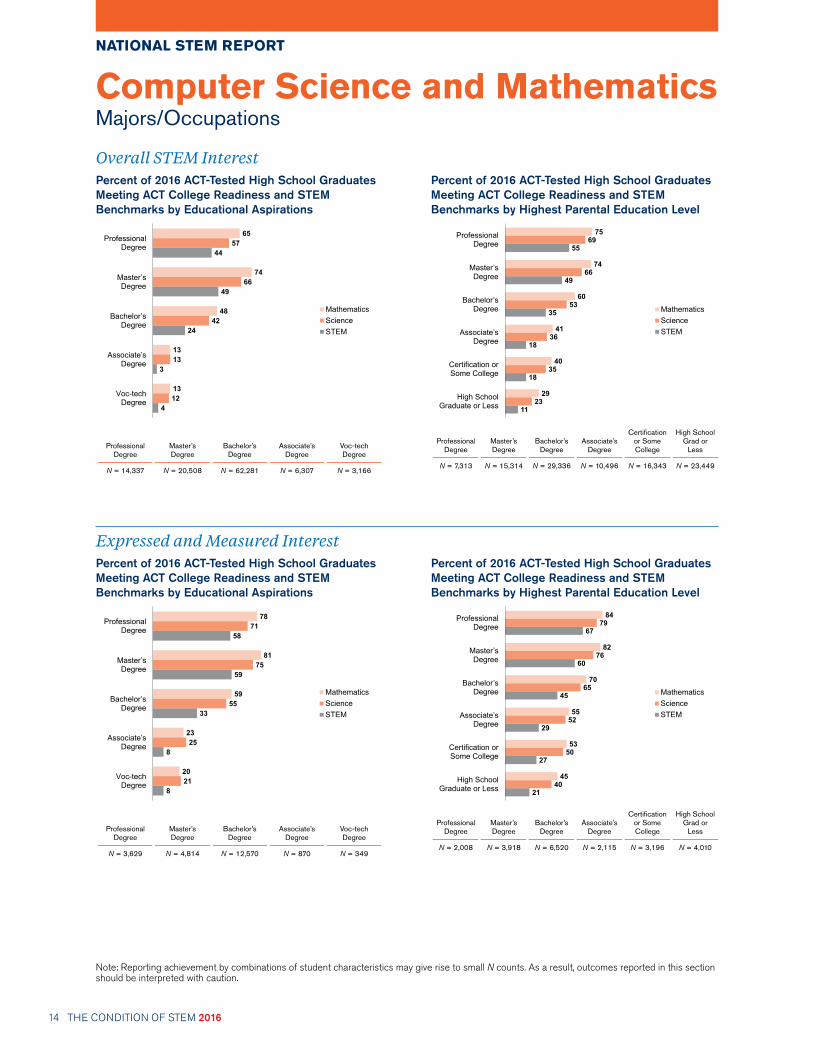
Overall STEM InterestPercent of 2016 ACT-Tested High School Graduates Meeting ACT College Readiness and STEM Benchmarks by Educational Aspirations
4
3
24
49
44
12
13
42
66
57
13
13
48
74
65
Voc-techDegree
Associate’sDegree
Bachelor’sDegree
Master’sDegree
ProfessionalDegree
MathematicsScienceSTEM
Professional Degree
Master’s Degree
Bachelor’s Degree
Associate’s Degree
Voc-tech Degree
N = 14,337 N = 20,508 N = 62,281 N = 6,307 N = 3,166
Percent of 2016 ACT-Tested High School Graduates Meeting ACT College Readiness and STEM Benchmarks by Highest Parental Education Level
11
18
18
35
49
55
23
35
36
53
66
69
29
40
41
60
74
75
High SchoolGraduate or Less
Certification orSome College
Associate’sDegree
Bachelor’sDegree
Master’sDegree
ProfessionalDegree
MathematicsScienceSTEM
Professional
Degree
Master’s Degree
Bachelor’s
Degree
Associate’s
Degree
Certification or Some College
High School Grad or
Less
N = 7,313 N = 15,314 N = 29,336 N = 10,496 N = 16,343 N = 23,449
Expressed and Measured InterestPercent of 2016 ACT-Tested High School Graduates Meeting ACT College Readiness and STEM Benchmarks by Educational Aspirations
8
8
33
59
58
21
25
55
75
71
20
23
59
81
78
Voc-techDegree
Associate’sDegree
Bachelor’sDegree
Master’sDegree
ProfessionalDegree
MathematicsScienceSTEM
Professional Degree
Master’s Degree
Bachelor’s Degree
Associate’s Degree
Voc-tech Degree
N = 3,629 N = 4,814 N = 12,570 N = 870 N = 349
Percent of 2016 ACT-Tested High School Graduates Meeting ACT College Readiness and STEM Benchmarks by Highest Parental Education Level
21
27
29
45
60
67
40
50
52
65
76
79
45
53
55
70
82
84
High SchoolGraduate or Less
Certification orSome College
Associate’sDegree
Bachelor’sDegree
Master’sDegree
ProfessionalDegree
MathematicsScienceSTEM
Professional
Degree
Master’s Degree
Bachelor’s
Degree
Associate’s
Degree
Certification or Some College
High School Grad or
Less
N = 2,008 N = 3,918 N = 6,520 N = 2,115 N = 3,196 N = 4,010
Note: Reporting achievement by combinations of student characteristics may give rise to small N counts. As a result, outcomes reported in this section should be interpreted with caution.
NATIONAL STEM REPORT
14 THE CONDITION OF STEM 2016

* The “overall STEM interest” counts and percents do not include the “measured only interest” students, as they did not choose a STEM major or occupation.
Computer Science and MathematicsMajors/Occupations
NATIONAL STEM REPORT
Computer Science and Mathematics Majors/Occupations
National N Counts and Percents
Overall STEM Interest* Expressed and Measured
N Count Percent N Count Percent
Actuarial Science 1,382 2 169 1
Applied Mathematics 2,485 3 605 3
Business/Management Quantitative Methods, General 7,977 9 764 3
Computer and Information Sciences, General 11,932 14 3,703 16
Computer Network/Telecommunications 3,728 4 935 4
Computer Science and Programming 33,091 38 11,439 50
Computer Software and Media Application 8,336 10 2,062 9
Computer System Administration 1,780 2 434 2
Data Management Technology 684 1 149 1
Information Science 1,045 1 266 1
Management Information Systems 2,004 2 210 1
Mathematics Education 4,102 5 538 2
Mathematics, General 4,200 5 1,021 4
Statistics 1,448 2 215 1
Webpage Design 2,036 2 385 2
Totals 86,230 22,895
15

Medical and HealthMajors/Occupations
Overall STEM Interest• Between 2012 and
2016, the percent of students interested in STEM decreased by 4%.
Overall STEM Interest (N = 411,038)
Percent of 2016 ACT-Tested High School Graduates by ACT College Readiness and STEM Benchmark Attainment
64
45 40 36
18
11
148 16
12
2541
51 48
70
0
20
40
60
80
100
English Reading Mathematics Science STEM
Perc
ent
Below Benchmarkby 3+ Points
Within 2 Pointsof Benchmark
Met Benchmark
Percent of 2016 ACT-Tested High School Graduates by Number of ACT College Readiness Benchmarks Attained
31
16 14 13
26
0
20
40
60
80
100
0 1 2 3 4
Perc
ent
Benchmarks Met
Expressed and Measured Interest (N = 152,395)
Percent of 2016 ACT-Tested High School Graduates by ACT College Readiness and STEM Benchmark Attainment
71
52 47 43
22
10
149 17
13
1934
44 40
64
0
20
40
60
80
100
English Reading Mathematics Science STEM
Perc
ent
Below Benchmarkby 3+ Points
Within 2 Pointsof Benchmark
Met Benchmark
Percent of 2016 ACT-Tested High School Graduates by Number of ACT College Readiness Benchmarks Attained
2416 15 14
31
0
20
40
60
80
100
0 1 2 3 4
Perc
ent
Benchmarks Met
Note: Reporting achievement by combinations of student characteristics may give rise to small N counts. As a result, outcomes reported in this section should be interpreted with caution.
NATIONAL STEM REPORT
Student STEM Interest Trends: 2012–2016
2012 2013 2014 2015 2016
Percent National 45% 44% 43% 42% 41%
N Count National 361,047 383,555 388,653 393,085 411,038
16 THE CONDITION OF STEM 2016

Overall STEM InterestPercent of 2016 ACT-Tested High School Graduates Meeting ACT College Readiness and STEM Benchmarks by Race/Ethnicity
17
23
13
8
42
6
4
36
46
28
22
57
18
12
39
49
34
27
69
19
14
Two orMore Races
White
PacificIslander
Hispanic
AsianAmerican
AmericanIndian
AfricanAmerican
Mathematics
Science
STEM
African American
American Indian
Asian American
Hispanic
Pacific Islander
White
Two or More Races
N = 58,347 N = 3,474 N = 21,108 N = 67,659 N = 1,392 N = 222,085 N = 17,760
Percent of 2016 ACT-Tested High School Graduates Meeting ACT College Readiness and STEM Benchmarks by Gender
49
37
45
3326
15
0
20
40
60
80
100
Male Female
Perc
ent
MathematicsScienceSTEM
Male Female
N = 114,840 N = 291,639
Expressed and Measured InterestPercent of 2016 ACT-Tested High School Graduates Meeting ACT College Readiness and STEM Benchmarks by Race/Ethnicity
21
26
16
11
46
8
6
43
51
36
26
63
24
18
45
53
44
32
74
23
20
Two orMore Races
White
PacificIslander
Hispanic
AsianAmerican
AmericanIndian
AfricanAmerican
MathematicsScienceSTEM
African American
American Indian
Asian American
Hispanic
Pacific Islander
White
Two or More Races
N = 15,130 N = 1,338 N = 9,493 N = 24,901 N = 455 N = 88,133 N = 6,624
Percent of 2016 ACT-Tested High School Graduates Meeting ACT College Readiness and STEM Benchmarks by Gender
58
43
54
40
32
19
0
20
40
60
80
100
Male Female
Per
cent Mathematics
ScienceSTEM
Male Female
N = 40,298 N = 110,716
Medical and HealthMajors/Occupations
NATIONAL STEM REPORT
17
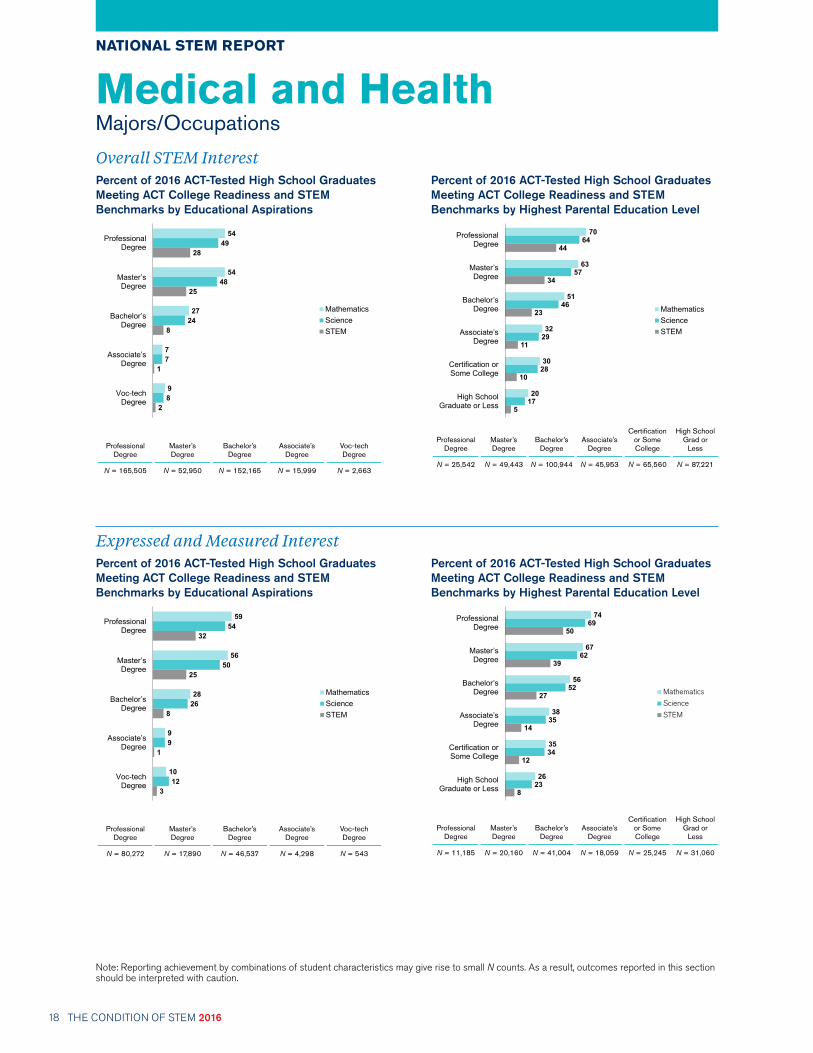
Medical and HealthMajors/Occupations
Overall STEM InterestPercent of 2016 ACT-Tested High School Graduates Meeting ACT College Readiness and STEM Benchmarks by Educational Aspirations
2
1
8
25
28
8
7
24
48
49
9
7
27
54
54
Voc-techDegree
Associate’sDegree
Bachelor’sDegree
Master’sDegree
ProfessionalDegree
MathematicsScienceSTEM
Professional Degree
Master’s Degree
Bachelor’s Degree
Associate’s Degree
Voc-tech Degree
N = 165,505 N = 52,950 N = 152,165 N = 15,999 N = 2,663
Percent of 2016 ACT-Tested High School Graduates Meeting ACT College Readiness and STEM Benchmarks by Highest Parental Education Level
5
10
11
23
34
44
17
28
29
46
57
64
20
30
32
51
63
70
High SchoolGraduate or Less
Certification orSome College
Associate’sDegree
Bachelor’sDegree
Master’sDegree
ProfessionalDegree
MathematicsScienceSTEM
Professional
Degree
Master’s Degree
Bachelor’s
Degree
Associate’s
Degree
Certification or Some College
High School Grad or
Less
N = 25,542 N = 49,443 N = 100,944 N = 45,953 N = 65,560 N = 87,221
Expressed and Measured InterestPercent of 2016 ACT-Tested High School Graduates Meeting ACT College Readiness and STEM Benchmarks by Educational Aspirations
3
1
8
25
32
12
9
26
50
54
10
9
28
56
59
Voc-techDegree
Associate’sDegree
Bachelor’sDegree
Master’sDegree
ProfessionalDegree
MathematicsScienceSTEM
Professional Degree
Master’s Degree
Bachelor’s Degree
Associate’s Degree
Voc-tech Degree
N = 80,272 N = 17,890 N = 46,537 N = 4,298 N = 543
Percent of 2016 ACT-Tested High School Graduates Meeting ACT College Readiness and STEM Benchmarks by Highest Parental Education Level
8
12
14
27
39
50
23
34
35
52
62
69
26
35
38
56
67
74
High SchoolGraduate or Less
Certification orSome College
Associate’sDegree
Bachelor’sDegree
Master’sDegree
ProfessionalDegree
Mathematics
Science
STEM
Professional
Degree
Master’s Degree
Bachelor’s
Degree
Associate’s
Degree
Certification or Some College
High School Grad or
Less
N = 11,185 N = 20,160 N = 41,004 N = 18,059 N = 25,245 N = 31,060
Note: Reporting achievement by combinations of student characteristics may give rise to small N counts. As a result, outcomes reported in this section should be interpreted with caution.
NATIONAL STEM REPORT
18 THE CONDITION OF STEM 2016
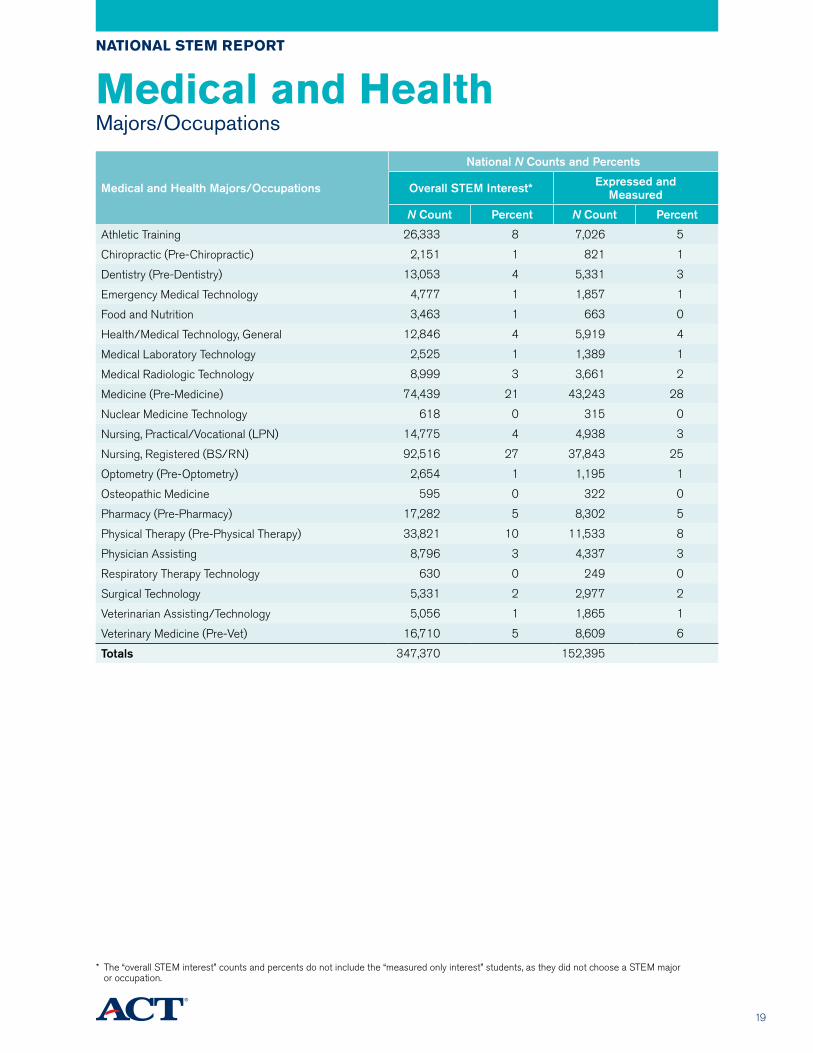
* The “overall STEM interest” counts and percents do not include the “measured only interest” students, as they did not choose a STEM major or occupation.
Medical and HealthMajors/Occupations
NATIONAL STEM REPORT
Medical and Health Majors/Occupations
National N Counts and Percents
Overall STEM Interest* Expressed and Measured
N Count Percent N Count Percent
Athletic Training 26,333 8 7,026 5
Chiropractic (Pre-Chiropractic) 2,151 1 821 1
Dentistry (Pre-Dentistry) 13,053 4 5,331 3
Emergency Medical Technology 4,777 1 1,857 1
Food and Nutrition 3,463 1 663 0
Health/Medical Technology, General 12,846 4 5,919 4
Medical Laboratory Technology 2,525 1 1,389 1
Medical Radiologic Technology 8,999 3 3,661 2
Medicine (Pre-Medicine) 74,439 21 43,243 28
Nuclear Medicine Technology 618 0 315 0
Nursing, Practical/Vocational (LPN) 14,775 4 4,938 3
Nursing, Registered (BS/RN) 92,516 27 37,843 25
Optometry (Pre-Optometry) 2,654 1 1,195 1
Osteopathic Medicine 595 0 322 0
Pharmacy (Pre-Pharmacy) 17,282 5 8,302 5
Physical Therapy (Pre-Physical Therapy) 33,821 10 11,533 8
Physician Assisting 8,796 3 4,337 3
Respiratory Therapy Technology 630 0 249 0
Surgical Technology 5,331 2 2,977 2
Veterinarian Assisting/Technology 5,056 1 1,865 1
Veterinary Medicine (Pre-Vet) 16,710 5 8,609 6
Totals 347,370 152,395
19
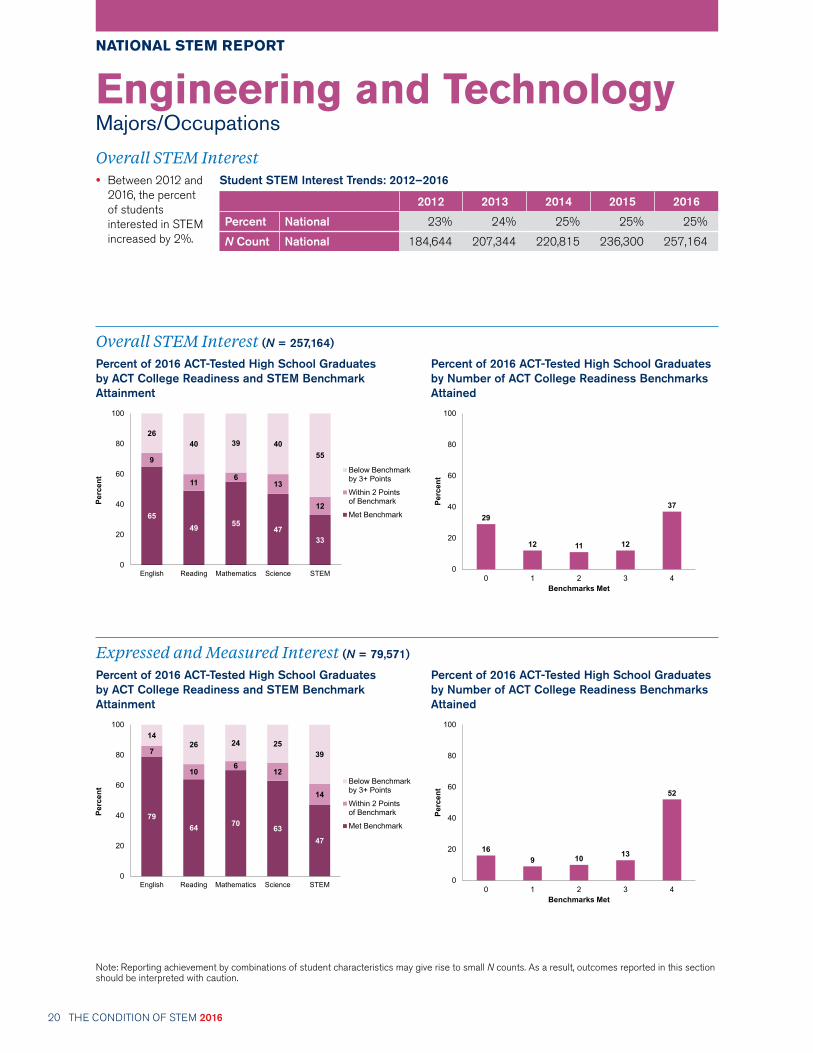
Engineering and TechnologyMajors/Occupations
Overall STEM Interest• Between 2012 and
2016, the percent of students interested in STEM increased by 2%.
Overall STEM Interest (N = 257,164)
6549 55
4733
9
11 613
12
2640 39 40
55
0
20
40
60
80
100
English Reading Mathematics Science STEM
Perc
ent
Below Benchmarkby 3+ Points
Within 2 Pointsof Benchmark
Met Benchmark 29
12 11 12
37
0
20
40
60
80
100
0 1 2 3 4
Perc
ent
Benchmarks Met
Expressed and Measured Interest (N = 79,571)
7964 70 63
47
7
106
12
14
1426 24 25
39
0
20
40
60
80
100
English Reading Mathematics Science STEM
Perc
ent
Below Benchmarkby 3+ Points
Within 2 Pointsof Benchmark
Met Benchmark
169 10 13
52
0
20
40
60
80
100
0 1 2 3 4
Perc
ent
Benchmarks Met
Note: Reporting achievement by combinations of student characteristics may give rise to small N counts. As a result, outcomes reported in this section should be interpreted with caution.
NATIONAL STEM REPORT
Percent of 2016 ACT-Tested High School Graduates by ACT College Readiness and STEM Benchmark Attainment
Percent of 2016 ACT-Tested High School Graduates by Number of ACT College Readiness Benchmarks Attained
Percent of 2016 ACT-Tested High School Graduates by ACT College Readiness and STEM Benchmark Attainment
Percent of 2016 ACT-Tested High School Graduates by Number of ACT College Readiness Benchmarks Attained
Student STEM Interest Trends: 2012–2016
2012 2013 2014 2015 2016
Percent National 23% 24% 25% 25% 25%
N Count National 184,644 207,344 220,815 236,300 257,164
20 THE CONDITION OF STEM 2016
Overall STEM Interest
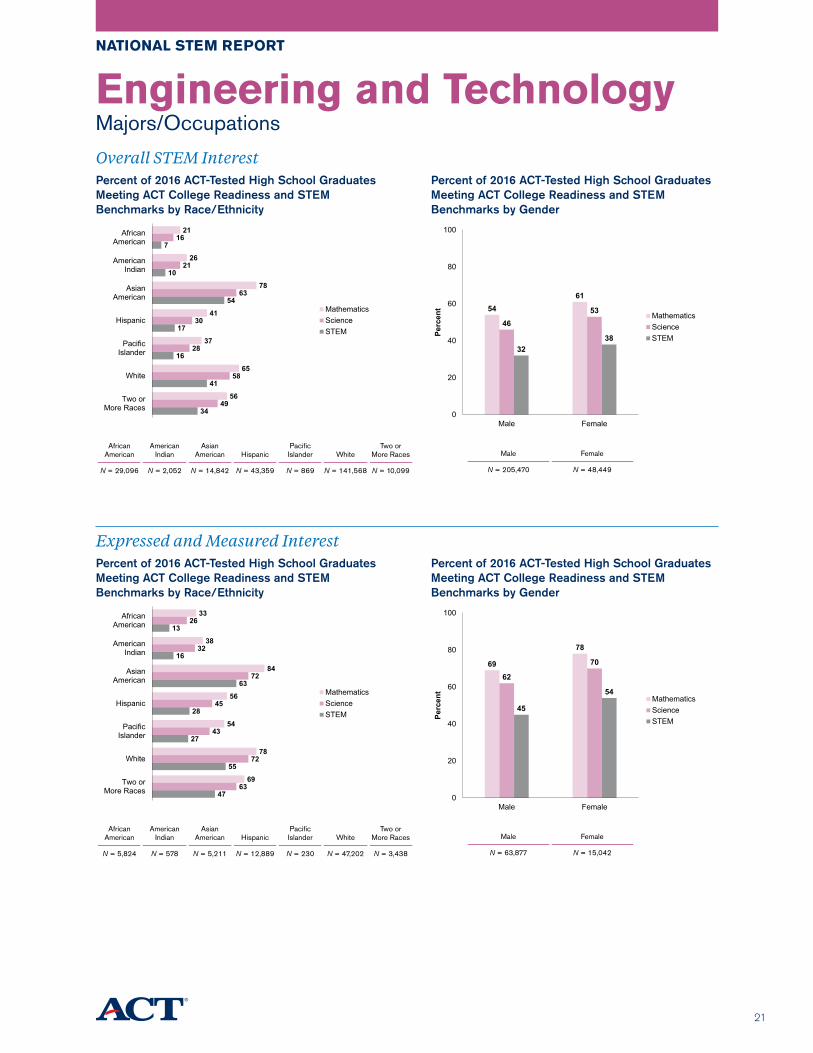
34
41
16
17
54
10
7
49
58
28
30
63
21
16
56
65
37
41
78
26
21
Two orMore Races
White
PacificIslander
Hispanic
AsianAmerican
AmericanIndian
AfricanAmerican
MathematicsScienceSTEM
African American
American Indian
Asian American
Hispanic
Pacific Islander
White
Two or More Races
N = 29,096 N = 2,052 N = 14,842 N = 43,359 N = 869 N = 141,568 N = 10,099
5461
4653
3238
0
20
40
60
80
100
Male Female
Perc
ent
MathematicsScienceSTEM
Male Female
N = 205,470 N = 48,449
Expressed and Measured Interest
47
55
27
28
63
16
13
63
72
43
45
72
32
26
69
78
54
56
84
38
33
Two orMore Races
White
PacificIslander
Hispanic
AsianAmerican
AmericanIndian
AfricanAmerican
MathematicsScienceSTEM
African American
American Indian
Asian American
Hispanic
Pacific Islander
White
Two or More Races
N = 5,824 N = 578 N = 5,211 N = 12,889 N = 230 N = 47,202 N = 3,438
69
78
62
70
45
54
0
20
40
60
80
100
Male Female
Perc
ent
MathematicsScienceSTEM
Male Female
N = 63,877 N = 15,042
Engineering and TechnologyMajors/Occupations
NATIONAL STEM REPORT
Percent of 2016 ACT-Tested High School Graduates Meeting ACT College Readiness and STEM Benchmarks by Race/Ethnicity
Percent of 2016 ACT-Tested High School Graduates Meeting ACT College Readiness and STEM Benchmarks by Gender
Percent of 2016 ACT-Tested High School Graduates Meeting ACT College Readiness and STEM Benchmarks by Race/Ethnicity
Percent of 2016 ACT-Tested High School Graduates Meeting ACT College Readiness and STEM Benchmarks by Gender
21
Engineering and TechnologyMajors/Occupations
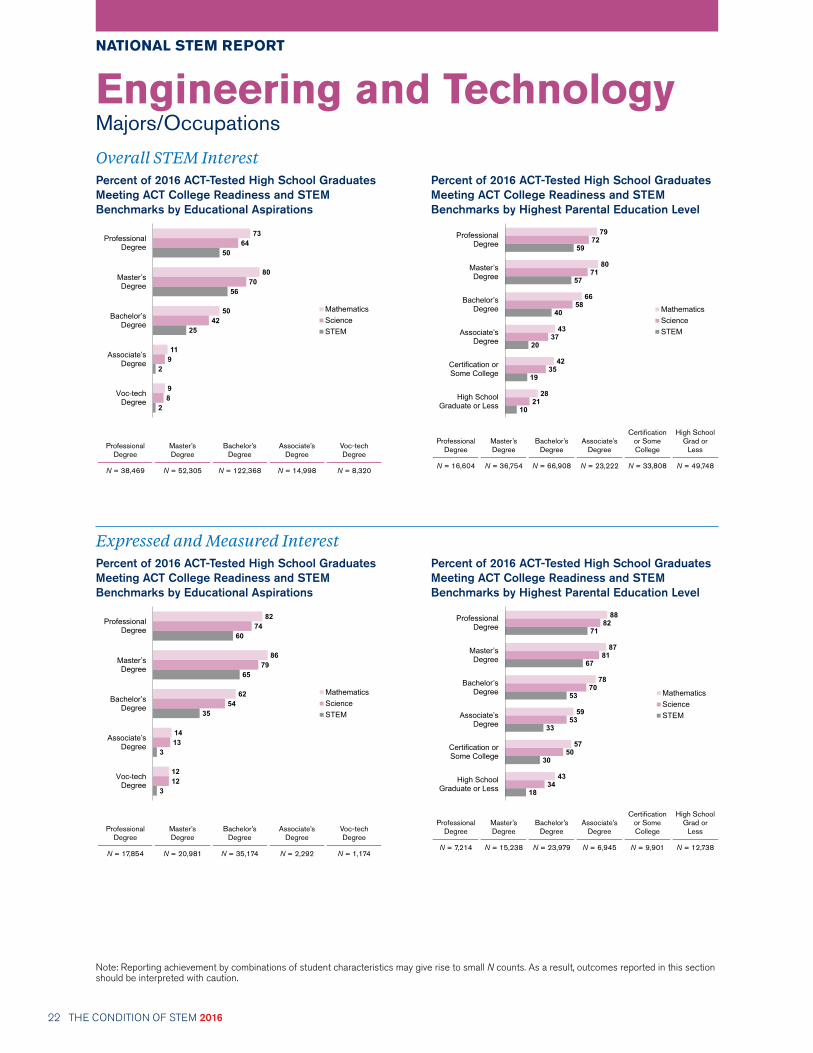
Overall STEM Interest
2
2
25
56
50
8
9
42
70
64
9
11
50
80
73
Voc-techDegree
Associate’sDegree
Bachelor’sDegree
Master’sDegree
ProfessionalDegree
MathematicsScienceSTEM
Professional Degree
Master’s Degree
Bachelor’s Degree
Associate’s Degree
Voc-tech Degree
N = 38,469 N = 52,305 N = 122,368 N = 14,998 N = 8,320
10
19
20
40
57
59
21
35
37
58
71
72
28
42
43
66
80
79
High SchoolGraduate or Less
Certification orSome College
Associate’sDegree
Bachelor’sDegree
Master’sDegree
ProfessionalDegree
MathematicsScienceSTEM
Professional
Degree
Master’s Degree
Bachelor’s
Degree
Associate’s
Degree
Certification or Some College
High School Grad or
Less
N = 16,604 N = 36,754 N = 66,908 N = 23,222 N = 33,808 N = 49,748
Expressed and Measured Interest
3
3
35
65
60
12
13
54
79
74
12
14
62
86
82
Voc-techDegree
Associate’sDegree
Bachelor’sDegree
Master’sDegree
ProfessionalDegree
MathematicsScienceSTEM
Professional Degree
Master’s Degree
Bachelor’s Degree
Associate’s Degree
Voc-tech Degree
N = 17,854 N = 20,981 N = 35,174 N = 2,292 N = 1,174
18
30
33
53
67
71
34
50
53
70
81
82
43
57
59
78
87
88
High SchoolGraduate or Less
Certification orSome College
Associate’sDegree
Bachelor’sDegree
Master’sDegree
ProfessionalDegree
MathematicsScienceSTEM
Professional
Degree
Master’s Degree
Bachelor’s
Degree
Associate’s
Degree
Certification or Some College
High School Grad or
Less
N = 7,214 N = 15,238 N = 23,979 N = 6,945 N = 9,901 N = 12,738
Note: Reporting achievement by combinations of student characteristics may give rise to small N counts. As a result, outcomes reported in this section should be interpreted with caution.
NATIONAL STEM REPORT
Percent of 2016 ACT-Tested High School Graduates Meeting ACT College Readiness and STEM Benchmarks by Educational Aspirations
Percent of 2016 ACT-Tested High School Graduates Meeting ACT College Readiness and STEM Benchmarks by Highest Parental Education Level
Percent of 2016 ACT-Tested High School Graduates Meeting ACT College Readiness and STEM Benchmarks by Educational Aspirations
Percent of 2016 ACT-Tested High School Graduates Meeting ACT College Readiness and STEM Benchmarks by Highest Parental Education Level
22 THE CONDITION OF STEM 2016
* The “overall STEM interest” counts and percents do not include the “measured only interest” students, as they did not choose a STEM major or occupation.
Engineering and TechnologyMajors/Occupations
NATIONAL STEM REPORT
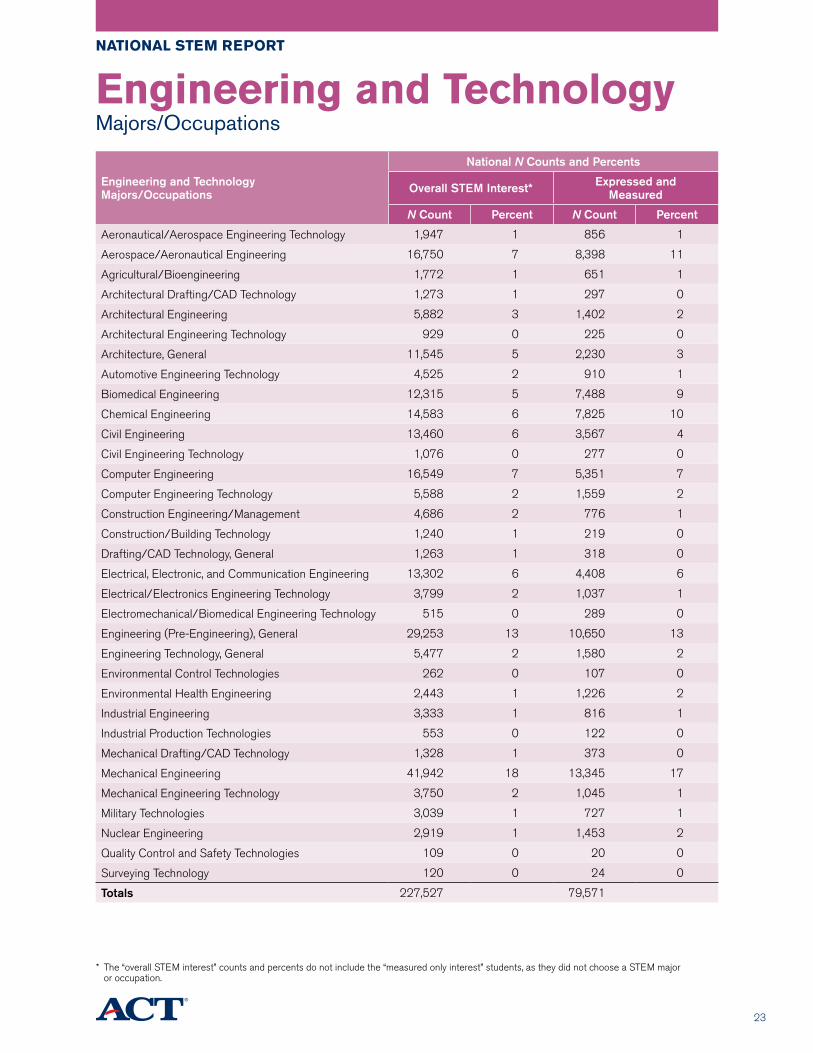
Engineering and Technology Majors/Occupations
National N Counts and Percents
Overall STEM Interest* Expressed and Measured
N Count Percent N Count Percent
Aeronautical/Aerospace Engineering Technology 1,947 1 856 1
Aerospace/Aeronautical Engineering 16,750 7 8,398 11
Agricultural/Bioengineering 1,772 1 651 1
Architectural Drafting/CAD Technology 1,273 1 297 0
Architectural Engineering 5,882 3 1,402 2
Architectural Engineering Technology 929 0 225 0
Architecture, General 11,545 5 2,230 3
Automotive Engineering Technology 4,525 2 910 1
Biomedical Engineering 12,315 5 7,488 9
Chemical Engineering 14,583 6 7,825 10
Civil Engineering 13,460 6 3,567 4
Civil Engineering Technology 1,076 0 277 0
Computer Engineering 16,549 7 5,351 7
Computer Engineering Technology 5,588 2 1,559 2
Construction Engineering/Management 4,686 2 776 1
Construction/Building Technology 1,240 1 219 0
Drafting/CAD Technology, General 1,263 1 318 0
Electrical, Electronic, and Communication Engineering 13,302 6 4,408 6
Electrical/Electronics Engineering Technology 3,799 2 1,037 1
Electromechanical/Biomedical Engineering Technology 515 0 289 0
Engineering (Pre-Engineering), General 29,253 13 10,650 13
Engineering Technology, General 5,477 2 1,580 2
Environmental Control Technologies 262 0 107 0
Environmental Health Engineering 2,443 1 1,226 2
Industrial Engineering 3,333 1 816 1
Industrial Production Technologies 553 0 122 0
Mechanical Drafting/CAD Technology 1,328 1 373 0
Mechanical Engineering 41,942 18 13,345 17
Mechanical Engineering Technology 3,750 2 1,045 1
Military Technologies 3,039 1 727 1
Nuclear Engineering 2,919 1 1,453 2
Quality Control and Safety Technologies 109 0 20 0
Surveying Technology 120 0 24 0
Totals 227,527 79,571
23

Understanding the Underserved LearnerACT Benchmark Attainment
In 2013, ACT expanded its Condition of College & Career Readiness series to include a special report focused on students who indicated an interest in STEM-related fields. For the past three years, the Condition of STEM reports have provided a comprehensive picture of the college readiness levels of those students. To further advance STEM readiness and to honor its commitments to help underserved learners pursue their college and career goals, ACT is providing additional information on the status of underserved ACT-tested graduates in relation to STEM preparation. Historically, access to quality education and career planning opportunities and resources has been hindered for underserved learners. Identifying these students and determining their readiness in math and science could provide them with more opportunities to successfully enter STEM careers and help address the national deficit of skilled STEM workers.
Definition of Underserved Learners
ACT identifies underserved learners using student characteristics that are often related to a lack of access to high-quality educational and career planning opportunities and resources. Specifically, this definition encompasses students who have at least one of the following characteristics.
• Minority: race/ethnicity is African American, American Indian/Alaska Native, Hispanic/Latino, or Native Hawaiian/other Pacific Islander
• Low income: combined parental income is less than or equal to $36,000• First generation in college: highest parental education level is high school diploma or less
This definition, which is consistent with that used in current research activities and state/federal intervention programs, casts a wide net. We have elected to maintain this broad definition as a means of representing most underserved students.
Impact
As shown in the accompanying graphs, the three characteristics used by ACT to define underserved students appear to have a cumulative suppressing effect on college readiness. In other words, the greater the number of characteristics students have, the lower their math, science, and STEM benchmark attainment rates. In isolation, embodiment of at least one underserved characteristic is associated with lower benchmark attainment rates than STEM students nationwide. Students with one underserved characteristic show STEM readiness rates 24 percentage points lower than those with no characteristics. Among students who met two characteristics, STEM readiness rates dropped another 9 percentage points to 6 percent. Among students exhibiting all three underserved characteristics, only 3 percent met the ACT STEM Benchmark.
These findings suggest that in order to best help underserved students succeed in STEM-related subjects and fields, we need to better understand the relationships among the defining characteristics and remove the barriers that they create alone and in combination with each other. Working together to remove these barriers is critical to the future success of these students.
24 THE CONDITION OF STEM 2016
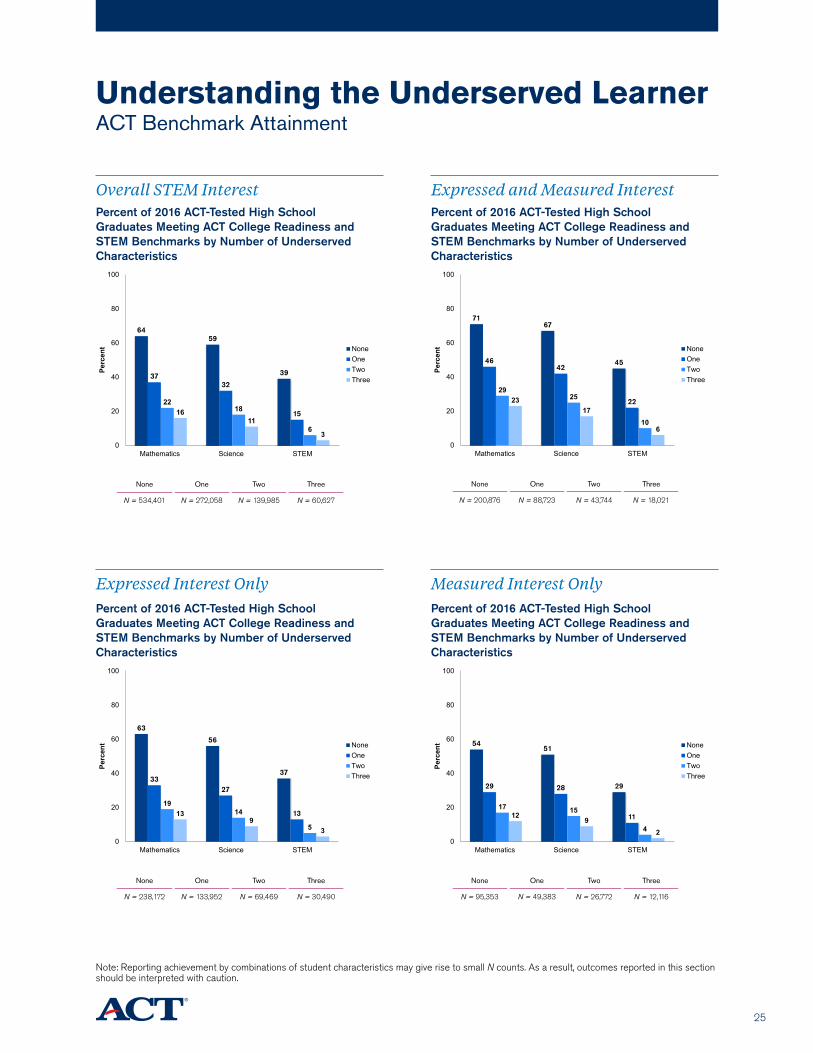
Understanding the Underserved LearnerACT Benchmark Attainment
Percent of 2016 ACT-Tested High School Graduates Meeting ACT College Readiness and STEM Benchmarks by Number of Underserved Characteristics
None One Two Three
N = 534,401 N = 272,058 N = 139,985 N = 60,627
Percent of 2016 ACT-Tested High School Graduates Meeting ACT College Readiness and STEM Benchmarks by Number of Underserved Characteristics
Percent of 2016 ACT-Tested High School Graduates Meeting ACT College Readiness and STEM Benchmarks by Number of Underserved Characteristics
Percent of 2016 ACT-Tested High School Graduates Meeting ACT College Readiness and STEM Benchmarks by Number of Underserved Characteristics
6459
393732
15
2218
6
1611
30
20
40
60
80
100
Mathematics Science STEM
Perc
ent None
OneTwoThree
7167
454642
22
2925
10
2317
6
0
20
40
60
80
100
Mathematics Science STEM
Perc
ent None
OneTwoThree
63
56
3733
27
1319
14
5
139
30
20
40
60
80
100
Mathematics Science STEM
Perc
ent None
OneTwoThree
5451
2929 28
1117 15
4
129
20
20
40
60
80
100
Mathematics Science STEM
Perc
ent None
OneTwoThree
None One Two Three
N = 200,876 N = 88,723 N = 43,744 N = 18,021
None One Two Three
N = 238,172 N = 133,952 N = 69,469 N = 30,490
None One Two Three
N = 95,353 N = 49,383 N = 26,772 N = 12,116
Overall STEM Interest Expressed and Measured Interest
Expressed Interest Only Measured Interest Only
Note: Reporting achievement by combinations of student characteristics may give rise to small N counts. As a result, outcomes reported in this section should be interpreted with caution.
25

STEM Interest and Achievement by State
State
Percent of All
Graduates Tested*
Percent of All ACT-Tested Graduates Interested in STEM
Percent of STEM Students Meeting Benchmarks
English Reading Math Science STEM
Alabama 100 52 56 38 28 29 14
Colorado 100 44 69 49 49 46 29
Illinois 100 41 71 50 51 45 28
Kentucky 100 48 65 45 37 37 18
Louisiana 100 52 64 40 32 33 14
Michigan 100 47 66 46 44 43 23
Minnesota 100 48 67 51 55 48 30
Mississippi 100 51 52 30 24 23 10
Missouri 100 42 66 47 44 41 22
Montana 100 48 63 47 47 41 22
Nevada 100 40 46 33 30 26 13
North Carolina 100 50 52 37 38 31 17
North Dakota 100 47 63 46 46 41 21
South Carolina 100 48 50 35 31 27 13
Tennessee 100 46 65 44 37 37 18
Utah 100 45 65 48 43 42 22
Wisconsin 100 47 68 48 51 46 26
Wyoming 100 49 64 44 41 39 17
Arkansas 96 48 65 44 39 35 17
Hawaii 94 48 53 35 38 30 16
Nebraska 88 48 73 53 51 48 27
Oklahoma 82 50 66 49 38 37 17
Florida 81 46 60 47 40 36 20
South Dakota 76 54 74 56 58 52 29
Kansas 74 49 73 56 55 49 28
Ohio 73 50 73 57 56 52 30
New Mexico 70 57 56 41 35 32 15
Iowa 68 49 79 60 56 55 31
West Virginia 67 58 70 49 37 37 16
Georgia 60 52 67 49 44 40 23
Arizona 58 48 62 46 47 39 23
Alaska 53 44 64 51 49 41 23
26 THE CONDITION OF STEM 2016
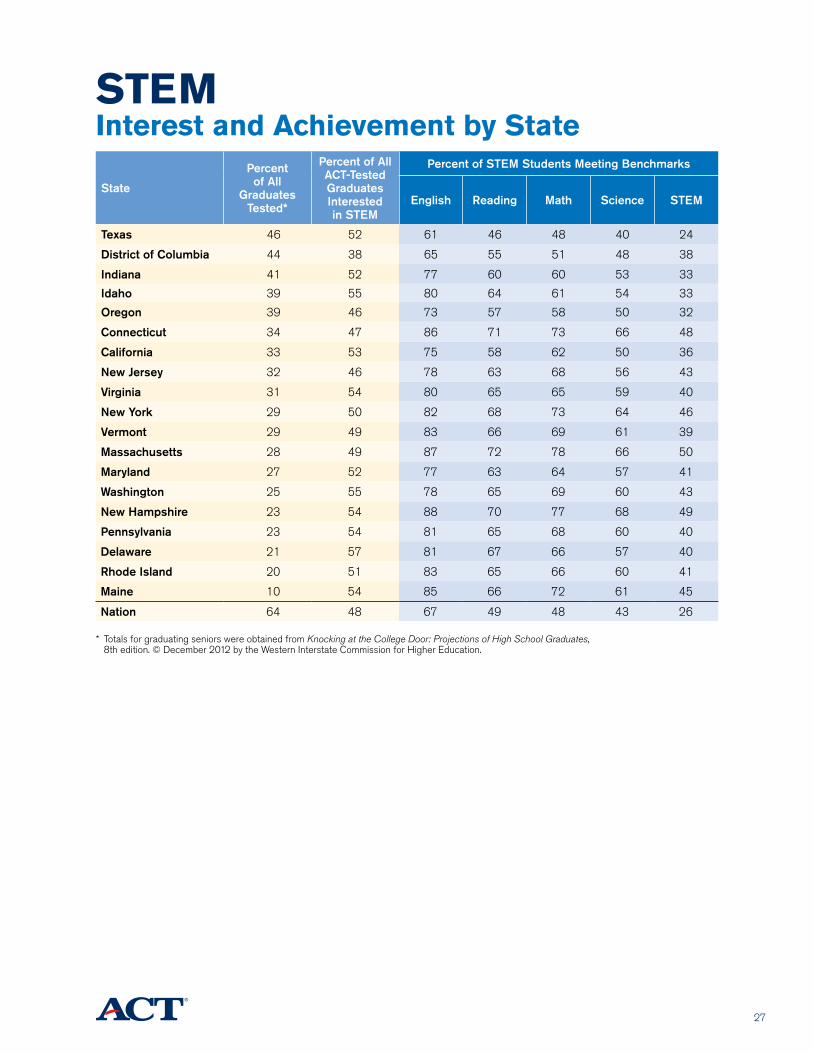
State
Percent of All
Graduates Tested*
Percent of All ACT-Tested Graduates Interested in STEM
Percent of STEM Students Meeting Benchmarks
English Reading Math Science STEM
Texas 46 52 61 46 48 40 24
District of Columbia 44 38 65 55 51 48 38
Indiana 41 52 77 60 60 53 33
Idaho 39 55 80 64 61 54 33
Oregon 39 46 73 57 58 50 32
Connecticut 34 47 86 71 73 66 48
California 33 53 75 58 62 50 36
New Jersey 32 46 78 63 68 56 43
Virginia 31 54 80 65 65 59 40
New York 29 50 82 68 73 64 46
Vermont 29 49 83 66 69 61 39
Massachusetts 28 49 87 72 78 66 50
Maryland 27 52 77 63 64 57 41
Washington 25 55 78 65 69 60 43
New Hampshire 23 54 88 70 77 68 49
Pennsylvania 23 54 81 65 68 60 40
Delaware 21 57 81 67 66 57 40
Rhode Island 20 51 83 65 66 60 41
Maine 10 54 85 66 72 61 45
Nation 64 48 67 49 48 43 26
* Totals for graduating seniors were obtained from Knocking at the College Door: Projections of High School Graduates, 8th edition. © December 2012 by the Western Interstate Commission for Higher Education.
STEM Interest and Achievement by State
27

ACT Research
As a nonprofit educational research organization, ACT is committed to producing research that focuses on key issues in education and workforce development. Our goal is to serve as a data resource. We strive to provide policymakers with the information they need to inform education and workforce development policy and to give educators the tools they need to lead more students toward college and career success. What follows are some recent and groundbreaking ACT research studies related to STEM. To review these studies, go towww.act.org/research/summary.
ACT National Curriculum Survey®
The ACT National Curriculum Survey is a nationwide survey of educational practices and expectations. Conducted every three to five years by ACT, the
survey collects data about what entering college students should know and be able to do to be ready for college-level coursework in English, math, reading, and science.
Broadening the Definition of College and Career Readiness:
A Holistic Approach
By Krista Mattern, Jeremy Burrus, Wayne Camara, Ryan O’Connor, Mary Ann Hansen, James Gambrell,
Alex Casillas, Becky Bobek
ACT Research Report Series 2014 (5)Broadening the Definition of College and Career Readiness: A Holistic Approach The Condition of College & Career Readiness 2016 revealed that only 26% of 2016 ACT-tested high school graduates met all four ACT
College Readiness Benchmarks. A more holistic approach to college and career readiness is in order. This report provides evidence that educators, policymakers, and employers embrace a wide variety of skills critical for success. The research also shows that we can improve prediction of college and career readiness by measuring a broader range of skills.
The Condition of College & Career Readiness 2016Using ACT scores and the ACT College Readiness Benchmarks, The Condition of College & Career Readiness 2016 provides data highlighting the college and career
readiness of the ACT-tested high school class of 2016. This report is updated annually.
The Condition of Future Educators 2015Data from past ACT Condition of STEM reports have shown there are few students interested in math or science education as a profession. This report provides
current educators and policymakers a glimpse inside the pipeline of future educators.
Development of STEM Readiness Benchmarks to Assist Educational and Career Decision MakingThe United States must seek ways to maintain the STEM pipeline withstudents who are likely to succeed
in a STEM major and persist in a STEM field. The purpose of this ACT research was to develop a STEM readiness benchmark to provide prospective students more tailored information on the level of knowledge and skills needed to have a reasonable chance of success in first-year STEM courses.
28 THE CONDITION OF STEM 2016

STEM Resources
ACT has connected with state STEM councils across the country to identify valuable STEM-related resources. These are the top resources suggested by STEM experts.
STEM Premier®
STEM Premier is a virtual platform that connects STEM students with higher education and the workforce. Students can showcase their skills, get ranked and rated, receive guidance, and find STEM scholarships while colleges, technical schools, and corporations can identify, track, and recruit STEM Premier talent.www.stempremier.com
STEMconnector®
STEMconnector is the “one-stop shop” for STEM information. With several products and services, STEMconnector supports its members in the design,
implementation, and measurement of their STEM strategies. Since its launch in 2011, STEMconnector has been the leader in leveraging a network of STEM stakeholders to “make things happen.” STEMconnector’s charge is to identify, inform, and connect entities working in STEM education and careers to assess smart STEM investments and results.www.stemconnector.org
USA Science and Engineering Festival The USA Science and Engineering Festival attracts thousands of K–12 students, parents, teachers, and STEM
professionals in the largest national celebration of STEM. The conference will be held in Spring 2018 in Washington, DC.www.usasciencefestival.org
Twomentor, LLCTwomentor, LLC, is a social impact company focused on talent strategies for retaining a diverse workforce. It works with clients to build mentoring cultures and initiatives, and its people have a passion for elevating girls and women in STEM skills. It has experience working with many Fortune 500 companies and SMBs and offers facilitated and highly engaging half-day and full-day mentor training, flash mentoring interactive sessions, ongoing MentorCulture consulting, and supports an engaged and passionate workforce as an extended part of your team.www.twomentor.com
Learning Blade®
From the creators of ACT KeyTrain®, Learning Blade® is an interactive, web-based STEM curriculum validated by BattelleEd in increasing student interest toward STEM careers for middle schoolers. Students pursue engaging missions about real-world STEM problems in an entertaining, game-based platform while also learning about STEM careers, aligned to academic standards. An easy-to-implement, cost-effective STEM tool, Learning Blade has been adopted statewide in two states and is used in over 25 states. www.learningblade.com
USNews.comThe U.S. News STEM Solutions National Leadership Conference is focused on improving America’s science, technology, engineering, and math skills. As a digital company committed to covering STEM through in-depth reporting, research, and analysis, U.S. News & World Report will bring the sixth annual leadership conference to the Sheraton San Diego Hotel & Marina on May 24–26, 2017. For more information, visit www.usnewsstemsolutions.com. For ongoing STEM news and analysis, visit www.usnews.com/STEM.
29

ACT-Defined STEM Majors and Occupations by Area
Science Majors/Occupations
Agronomy and Crop Science
Animal Sciences
Astronomy
Atmospheric Sciences and Meteorology
Biochemistry and Biophysics
Biology, General
Cell/Cellular Biology
Chemistry
Ecology
Environmental Science
Food Sciences and Technology
Forestry
Genetics
Geological and Earth Sciences
Horticulture Science
Marine/Aquatic Biology
Microbiology and Immunology
Natural Resources Conservation, General
Natural Resources Management
Physical Sciences, General
Physics
Science Education
Wildlife and Wildlands Management
Zoology
Computer Science and Mathematics Majors/Occupations
Actuarial Science
Applied Mathematics
Business/Management Quantitative Methods, General
Computer and Information Sciences, General
Computer Network/Telecommunications
Computer Science and Programming
Computer Software and Media Application
Computer System Administration
Data Management Technology
Information Science
Management Information Systems
Mathematics Education
Mathematics, General
Statistics
Webpage Design
Medical and Health Majors/Occupations
Athletic Training
Chiropractic (Pre-Chiropractic)
Dentistry (Pre-Dentistry)
Emergency Medical Technology
Food and Nutrition
Health/Medical Technology, General
Medical Laboratory Technology
Medical Radiologic Technology
Medicine (Pre-Medicine)
Nuclear Medicine Technology
Nursing, Practical/Vocational (LPN)
Nursing, Registered (BS/RN)
Optometry (Pre-Optometry)
Osteopathic Medicine
Pharmacy (Pre-Pharmacy)
Physical Therapy (Pre-Physical Therapy)
Physician Assisting
Respiratory Therapy Technology
Surgical Technology
Veterinarian Assisting/Technology
Veterinary Medicine (Pre-Vet)
Engineering and Technology Majors/Occupations
Aeronautical/Aerospace Engineering Technology
Aerospace/Aeronautical Engineering
Agricultural/Bioengineering
Architectural Drafting/CAD Technology
Architectural Engineering
Architectural Engineering Technology
Architecture, General
Automotive Engineering Technology
Biomedical Engineering
Chemical Engineering
Civil Engineering
Civil Engineering Technology
Computer Engineering
Computer Engineering Technology
Construction Engineering/Management
Construction/Building Technology
Drafting/CAD Technology, General
Electrical, Electronic, and Communication Engineering
Electrical/Electronics Engineering Technology
Electromechanical/Biomedical Engineering Technology
Engineering (Pre-Engineering), General
Engineering Technology, General
Environmental Control Technologies
Environmental Health Engineering
Industrial Engineering
Industrial Production Technologies
Mechanical Drafting/CAD Technology
Mechanical Engineering
Mechanical Engineering Technology
Military Technologies
Nuclear Engineering
Quality Control and Safety Technologies
Surveying Technology
30 THE CONDITION OF STEM 2016
National STEM Report
Notes1. When individuals register for the ACT, they are asked to choose a college major they plan to enter as well as
an occupational choice from a list of 294 major and occupational titles. Of these 294 titles, 93 have been identified as STEM related. Assignment of ACT titles to STEM titles was conducted by an expert panel of ACT staff members with knowledge of labor market trends and postsecondary academic programs. Panel decisions were informed by three sources of information: (1) STEM-designated occupations from the US Bureau of Labor Statistics (BLS), (2) STEM-designated degree programs from US Immigration and Customs Enforcement (ICE), and (3) ACT Interest Inventory score profiles for students planning to enter the major/occupation. ACT titles were assigned to STEM when both the corresponding BLS and ICE titles were included in STEM or when the corresponding BLS title was included in STEM and the profile of measured interests of students planning to enter this occupation peaked on the Science and Technology scale. These two guidelines accounted for 89 of the 93 ACT titles assigned to STEM. The remaining four titles were assigned to STEM based on the judged intensiveness of their math and science coursework (major) or work tasks (occupation). ACT titles in the Social Sciences were excluded from this STEM list because many STEM taxonomies do not include majors and occupations in this field.
2. Students were assigned to one of three STEM cohorts: Expressed and Measured, Expressed Only, or Measured Only. These cohorts were based on the pairing of Expressed and Measured STEM interest types, where:• Students with expressed STEM interest planned on a STEM major or occupation following high school.• Students with measured STEM interest had a highest ACT Interest Inventory score in Science or had a
highest ACT Interest Inventory score in Technology and a second-highest score in Science.Within each STEM cohort, students were also assigned to one of four STEM areas: Science, Computer Science and Mathematics, Medical and Health, or Engineering and Technology. STEM areas for students in the Expressed and Measured Interest cohort and the Expressed Interest Only cohort were based on the STEM area of students’ planned major. If planned major was not STEM, then the STEM area of their planned occupation was used. For students in the Measured Interest Only cohort, STEM area was based on the correlation of ACT Interest Inventory scores and the interest profile of the planned major. Using a national sample of 2-year students in their second year and 4-year students in their third year who have a declared major and a grade point average of at least 2.0 (N=62,494), each major’s profile was estimated as the mean ACT Interest Inventory scores for students in that major.
3. Mattern, K., Radunzel, J., & Westrick P. (2015). Development of STEM readiness benchmarks to assist career and educational decision making. (ACT Research Report 2015-3). Iowa City, IA: ACT, Inc.
4. Crouse, J., Harmston, M., & Radunzel, J. (2016). Validity evidence for STEM interest identification. (ACT Research Technical Brief). Iowa City, IA: ACT, Inc.
ACT’s Commitment to STEMEveryone must work together to get more students prepared to succeed in STEM careers. This is a critical step if the United States is to remain a world leader. ACT is committed to research and assessment practices that make enhanced STEM opportunities for students a reality. Although gains have been made in STEM readiness, the data show that far too many STEM-interested students are still not well prepared to succeed in the type of rigorous college math and science coursework required of STEM majors. ACT research indicates that students who meet or surpass the ACT STEM Benchmark are much more likely than those who don’t to persevere in college and earn a STEM degree within six years.ACT recently developed the ACT Aspire® assessment system, focused on grades 3–10. ACT Aspire covers the same subjects as the ACT: English, reading, math, science, and writing. To complement the information in the STEM report, an ACT Aspire STEM score has been developed. This score gives educators and STEM leaders an early and ongoing view of the STEM pipeline within their states. ACT WorkKeys® and the ACT National Career Readiness Certificate™ are additional assessment tools available to students, individuals, and companies to assist in determining work readiness for STEM-related jobs.
© 2016 by ACT, Inc. All rights reserved. The ACT® test is a registered trademark of ACT, Inc., in the USA and other countries. The ACT National Curriculum Survey®, ACT Aspire®, ACT KeyTrain®, and ACT WorkKeys® are registered trademarks of ACT, Inc. The ACT National Career Readiness Certificate™ is a trademark of ACT, Inc.
31

ACT is an independent, nonprofit organization that provides assessment, research, information, and program management services in the broad areas of education and workforce development. Each year, we serve millions of people in high schools, colleges, professional associations, businesses, and government agencies, nationally and internationally. Though designed to meet a wide array of needs, all ACT programs and services have one guiding purpose—helping people achieve education and workplace success.
This report can be found at www.act.org/stemcondition
*070804160* Rev 2