the conservation united states reserve program · 2014-01-09 · the conservation reserve program...
TRANSCRIPT
The Conservation Reserve Program
45th Signup August 2013
County by County Summary
United States
Department of
Agriculture
U.S Department of Agriculture
Farm Service Agency
Conservation and Environmental Program Division
1400 Independence Ave., SW,
Room 4711-S, Stop 0513
Washington, DC 20250-0513
Phone: 202-720-6221
Fax: 202-720-4619
www.fsa.usda.gov

REPORT ACKNOWLEDGEMENTS
Report direction and guidance came from Matthew Ponish and Katina Hanson. The report was
prepared by the USDA Farm Service Agency’s Conservation and Environmental Programs Division
(CEPD) with contributions from Beverly Preston, John Carter, Jean Agapoff, Kathie Moh, and Lana
Nesbit. Alex Barbarika and Cathie Feather from the USDA Economic and Policy Analysis Staff (EPAS)
also provided significant contributions to this report.
INFORMATION
Additional information about the USDA Farm Service Agency’s Conservation and Environmental
Programs Division can be accessed at www.fsa.usda.gov.
The U.S. Department of Agriculture (USDA) prohibits discrimination against its customers, employees,
and applicants for employment on the bases of race, color, national origin, age, disability, sex, gender
identity, religion, reprisal, and where applicable, political beliefs, marital status, familial or parental
status, sexual orientation, or all or part of an individual's income is derived from any public assistance
program, or protected genetic information in employment or in any program or activity conducted or
funded by the Department. (Not all prohibited bases will apply to all programs and/or employment
activities.) Persons with disabilities who require alternative means for communication of program
information (Braille, large print, audiotape, etc.) should contact USDA’s TARGET Center at (202) 720-
2600 (voice and TDD).
If you wish to file a Civil Rights program complaint of discrimination, complete the USDA Program Discrimination Complaint Form (PDF), at any USDA office, or call (866) 632-9992 to request the form,
or go online at http://www.ascr.usda.gov/complaint_filing_cust.html. You may also write a letter
containing all of the information requested in the form. Send your completed complaint form or letter
to us by mail at U.S. Department of Agriculture, Director, Office of Adjudication, 1400 Independence
Avenue, S.W., Washington, D.C. 20250-9410, by fax (202) 690-7442 or email
PHOTO CREDITS
Front Cover Photos: Center, Hardwood Forest, Forest Service; Top left, Spicebush Swallowtail Butterfly, US
Fish & Wildlife Service; Right, Mule Deer, USDA; Lower left, Prairie Chicken, USDA.
Photos made available by Janet Connelly and Julie Polt from USDA Farm Service Agency

Conservation Reserve Program Overview
The USDA Conservation Reserve Program (CRP) is a voluntary conservation program available to
agricultural producers to assist them to enhance environmentally sensitive lands. Producers enrolled in
the CRP plant long-term, resource-conserving covers such as introduced or native grasses or trees to
improve the quality of water, control soil erosion, and enhance wildlife habitat.
In return, USDA’s FSA provides participants with rental payments and cost-share assistance for 10 to 15
years.
The 45th CRP Signup
On February 13, 2013, USDA Secretary, Tom Vilsack, announced that a CRP general signup would begin
on May 20, 2013, and continue through June 14, 2013. Vilsack also announced the restart of sign-up for
continuous CRP from May 13 through September 30, 2013. For land to be eligible for general signup, it
must be:
■ Cropland that has been planted or considered planted to an agricultural commodity 4 of the 6 years
between 2002 and 2007; and
■ Physically and legally capable of being planted in a normal manner to an agricultural commodity. Note: Alfalfa or other multiyear grasses and legumes grown in a rotation not to exceed 12 years also
may be eligible.
Also, cropland must:
■ Have a weighted average Erodibility Index of eight or greater;
■ Be expiring CRP; or
■ Be located in a national or state conservation priority area.
The Erodibility Index (EI) divides potential erosion by the maximum average soil loss in which long-term
productivity may be adversely affected.
Rental and Cost Share Payments CRP rental rates are based on local dryland cash rental rates. Producers may offer land at these rates
or may offer a lower rental rate to increase the likelihood that their offer will be acceptable.
CRP cost share assistance is available to eligible participants in an amount not to exceed 50 percent of
the eligible costs of establishing the approved practice.
General Signup Offers are evaluated and ranked using an Environmental Benefits Index (EBI) based on the environmental
benefits expected to accrue if the land is enrolled in the CRP.
Use of the EBI ensures that the most environmentally sensitive lands relative to cost are selected and
that all offers are considered fairly.
The six EBI factors are:
■ N1, Wildlife Habitat Cover Benefits;
■ N2, Water Quality Benefits From Reduced Erosion, Runoff and Leaching;
■ N3, On-Farm Benefits of Reduced Erosion;
■ N4, Enduring Benefits;
■ N5, Air Quality Benefits; and
■ N6, Cost.

i
TABLE OF CONTENTS
Alabama…………………………………………………………………………………... 1 Alaska…………………………………………………………………………………….. 7 Arizona…………………………………………………………………………………..... 9 Arkansas…………………………………………………………………………………. 11 California………………………………………………………………………………... 17 Colorado…………………………………………………………………………………. 23 Connecticut……………………………………………………………………………… 29 Delaware………………………………………………………………………………… 31 Florida…………………………………………………………………………………… 36 Georgia…………………………………………………………………………………... 42 Hawaii…………………………………………………………………………………… 49 Idaho……………………………………………………………………………………...51 Illinois…………………………………………………………………………………… 56 Indiana……………………………………………………………………………………65 Iowa………………………………………………………………………………………74 Kansas…………………………………………………………………………………… 83 Kentucky………………………………………………………………………………… 92 Louisiana………………………………………………………………………………… 99 Maine……………………………………………………………………………………105 Maryland……………………………………………………………………………….. 110 Massachusetts…………………………………………………………………………...115 Michigan……………………………………………………………………………….. 117 Minnesota………………………………………………………………………………. 123 Mississippi……………………………………………………………………………... 132 Missouri………………………………………………………………………………... 141 Montana………………………………………………………………………………... 151 Nebraska……………………………………………………………………………….. 157 Nevada…………………………………………………………………………………. 166 New Hampshire………………………………………………………………………... 168 New Jersey……………………………………………………………………………... 170 New Mexico……………………………………………………………………………. 172 New York………………………………………………………………………………. 177 North Carolina…………………………………………………………………………. 183 North Dakota…………………………………………………………………………… 189 Ohio……………………………………………………………………………………..195 Oklahoma………………………………………………………………………………. 204 Oregon…………………………………………………………………………………..210 Pennsylvania…………………………………………………………………………… 215 Puerto Rico……………………………………………………………………………...221 Rhode Island…………………………………………………………………………… 223

ii
TABLE OF CONTENTS South Carolina…………………………………………………………………………. 225 South Dakota…………………………………………………………………………… 230 Tennessee………………………………………………………………………………. 236 Texas…………………………………………………………………………………… 242 Utah…………………………………………………………………………………….. 254 Vermont………………………………………………………………………………... 259 Virginia………………………………………………………………………………… 261 Washington…………………………………………………………………………….. 268 West Virginia…………………………………………………………………………... 273 Wisconsin………………………………………………………………………………. 276 Wyoming………………………………………………………………………………..282
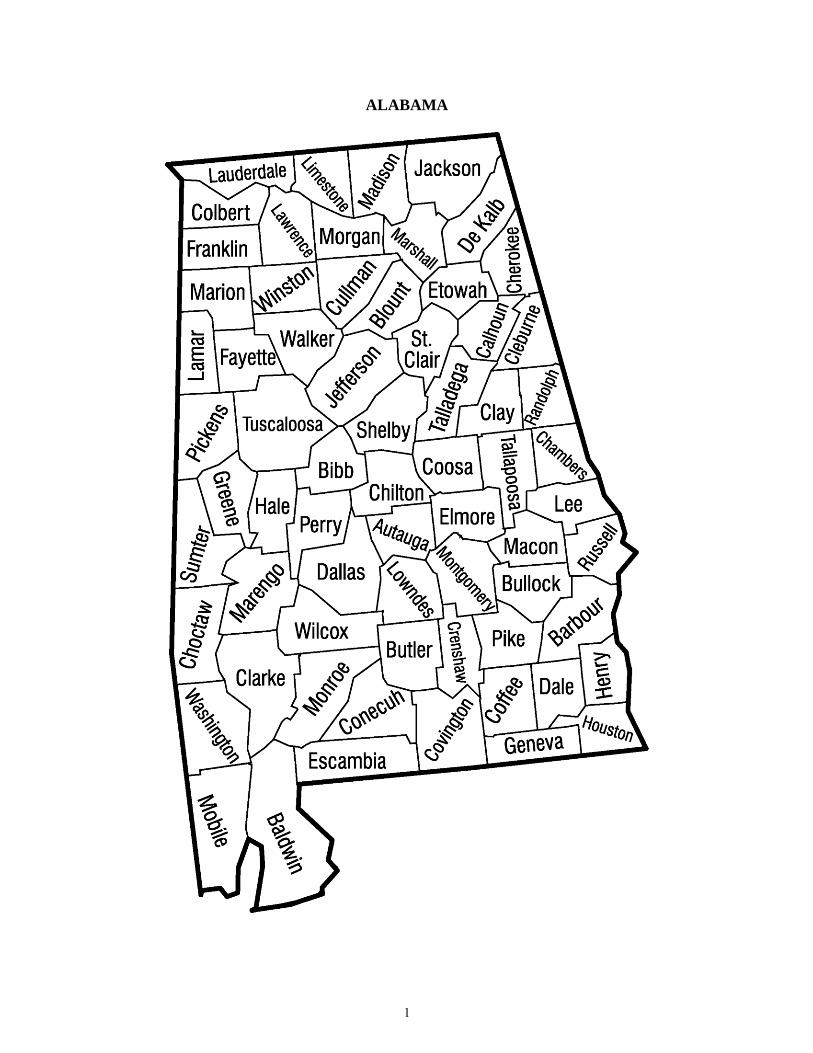
ALABAMA
1
County Name Offers Received
Acceptable Offers
Offered Acres
Acceptable Acres
EnrollmentOct. 2013
before continuous
1/
Acreage Expiring Sept. 30,
2013
Enrollment as of
June 2013
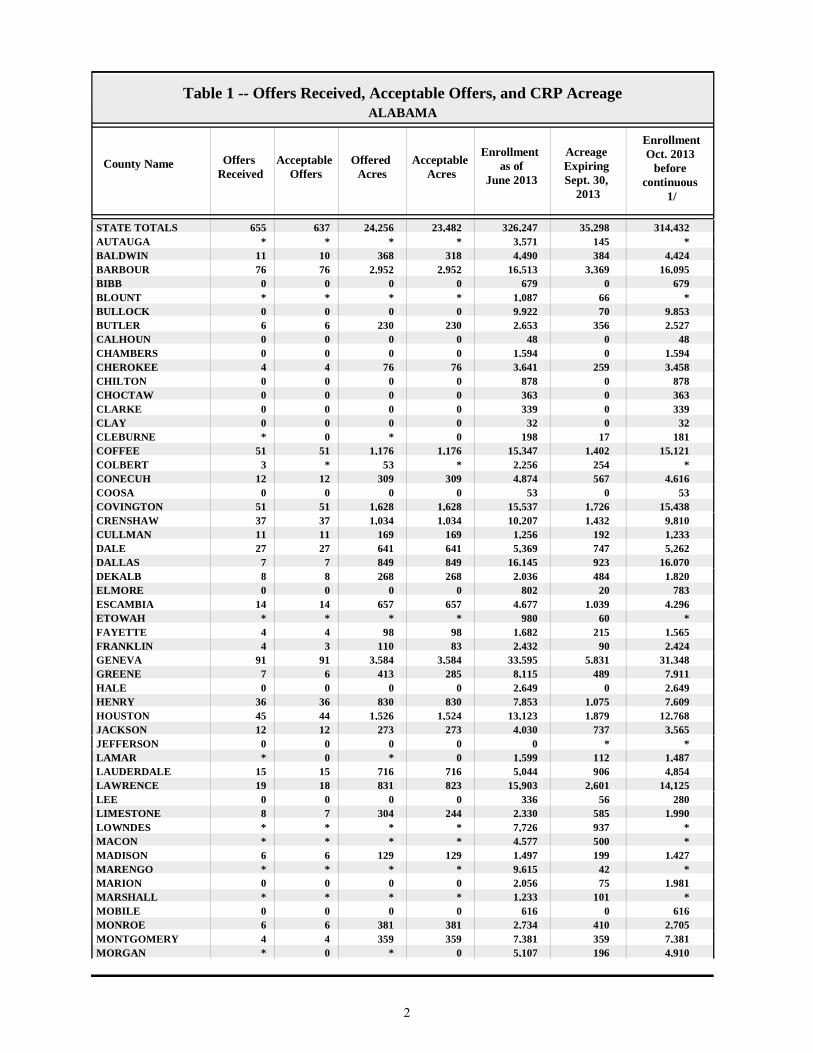
Table 1 -- Offers Received, Acceptable Offers, and CRP AcreageALABAMA
STATE TOTALS 655 637 24,256 23,482 314,43235,298326,247AUTAUGA * * * * * 1453,571BALDWIN 11 10 368 318 4,4243844,490BARBOUR 76 76 2,952 2,952 16,0953,36916,513BIBB 0 0 0 0 6790679BLOUNT * * * * * 661,087BULLOCK 0 0 0 0 9,853709,922BUTLER 6 6 230 230 2,5273562,653CALHOUN 0 0 0 0 48048CHAMBERS 0 0 0 0 1,59401,594CHEROKEE 4 4 76 76 3,4582593,641CHILTON 0 0 0 0 8780878CHOCTAW 0 0 0 0 3630363CLARKE 0 0 0 0 3390339CLAY 0 0 0 0 32032CLEBURNE * 0 * 0 18117198COFFEE 51 51 1,176 1,176 15,1211,40215,347COLBERT 3 * 53 * * 2542,256CONECUH 12 12 309 309 4,6165674,874COOSA 0 0 0 0 53053COVINGTON 51 51 1,628 1,628 15,4381,72615,537CRENSHAW 37 37 1,034 1,034 9,8101,43210,207CULLMAN 11 11 169 169 1,2331921,256DALE 27 27 641 641 5,2627475,369DALLAS 7 7 849 849 16,07092316,145DEKALB 8 8 268 268 1,8204842,036ELMORE 0 0 0 0 78320802ESCAMBIA 14 14 657 657 4,2961,0394,677ETOWAH * * * * * 60980FAYETTE 4 4 98 98 1,5652151,682FRANKLIN 4 3 110 83 2,424902,432GENEVA 91 91 3,584 3,584 31,3485,83133,595GREENE 7 6 413 285 7,9114898,115HALE 0 0 0 0 2,64902,649HENRY 36 36 830 830 7,6091,0757,853HOUSTON 45 44 1,526 1,524 12,7681,87913,123JACKSON 12 12 273 273 3,5657374,030JEFFERSON 0 0 0 0 * * 0LAMAR * 0 * 0 1,4871121,599LAUDERDALE 15 15 716 716 4,8549065,044LAWRENCE 19 18 831 823 14,1252,60115,903LEE 0 0 0 0 28056336LIMESTONE 8 7 304 244 1,9905852,330LOWNDES * * * * * 9377,726MACON * * * * * 5004,577MADISON 6 6 129 129 1,4271991,497MARENGO * * * * * 429,615MARION 0 0 0 0 1,981752,056MARSHALL * * * * * 1011,233MOBILE 0 0 0 0 6160616MONROE 6 6 381 381 2,7054102,734MONTGOMERY 4 4 359 359 7,3813597,381MORGAN * 0 * 0 4,9101965,107
2

County Name Offers Received
Acceptable Offers
Offered Acres
Acceptable Acres
EnrollmentOct. 2013
before continuous
1/
Acreage Expiring Sept. 30,
2013
Enrollment as of
June 2013
Table 1 -- Offers Received, Acceptable Offers, and CRP AcreageALABAMA
PERRY 3 * 112 * * 19111,484PICKENS 9 9 591 591 4,9668405,215PIKE 38 37 1,693 1,673 11,5981,79911,724RANDOLPH 0 0 0 0 33123354RUSSELL * * * * * 3875,503ST CLAIR * * * * * 110567SHELBY 0 0 0 0 505SUMTER * * * * * 69115,876TALLADEGA 0 0 0 0 9290929TALLAPOOSA 0 0 0 0 4590459TUSCALOOSA 6 5 164 142 718213789WALKER 0 0 0 0 2940294WASHINGTON 0 0 0 0 45424477WILCOX * * * * * 1135,623WINSTON 0 0 0 0 1650165
1 / Not including continuous signup enrollment between July and September 2013.
* Data withheld to avoid disclosure of individual operations.
3

County NameExpiring
Sept. 2013 (Acres)
New Lands (Acres) 1/
Average Rental
Payment ($/Acre)
Total Rental
Payment ($/year)
Average EBI Score
without Cost
Average EBI Score with Cost
Table 2 -- Description of Signup 45 Acceptable AcresALABAMA
STATE TOTALS 22,400 1,082 $54.50 $1,279,767 205 303AUTAUGA * * * * * * BALDWIN 318 0 $87.64 $27,878 236 317BARBOUR 2,952 0 $46.26 $136,548 223 321BLOUNT * * * * * * BUTLER 230 0 $46.04 $10,598 217 316CHEROKEE 76 0 $63.34 $4,801 182 284COFFEE 1,176 0 $64.18 $75,490 229 317COLBERT * * * * * * CONECUH 309 0 $57.59 $17,800 191 283COVINGTON 1,535 93 $56.08 $91,280 223 316CRENSHAW 1,035 0 $39.14 $40,489 204 311CULLMAN 164 6 $37.29 $6,317 201 305DALE 641 0 $54.62 $34,995 243 343DALLAS 849 0 $34.49 $29,267 138 246DEKALB 268 0 $54.09 $14,496 167 263ESCAMBIA 657 0 $92.18 $60,591 209 282ETOWAH * * * * * * FAYETTE 98 0 $40.88 $4,014 176 293FRANKLIN 63 19 $49.37 $4,078 154 255GENEVA 3,584 0 $54.96 $197,000 224 320GREENE 140 144 $42.04 $11,962 172 279HENRY 740 91 $53.09 $44,093 218 317HOUSTON 1,197 327 $54.84 $83,574 208 302JACKSON 265 8 $52.13 $14,211 188 284LAUDERDALE 716 0 $67.26 $48,150 203 304LAWRENCE 757 66 $99.22 $81,651 150 240LIMESTONE 244 0 $75.24 $18,388 182 287LOWNDES * * * * * * MACON * * * * * * MADISON 129 0 $61.03 $7,867 171 276MARENGO * * * * * * MARSHALL * * * * * * MONROE 381 0 $87.93 $33,484 210 301MONTGOMERY 359 0 $26.48 $9,511 193 305PERRY * * * * * * PICKENS 591 0 $48.60 $28,728 165 262PIKE 1,619 54 $46.40 $77,608 226 327RUSSELL * * * * * * ST CLAIR * * * * * * SUMTER * * * * * * TUSCALOOSA 142 0 $52.30 $7,447 151 247WILCOX * * * * * *
* Data withheld to avoid disclosure of individual operations.
1/ Includes land that may have been in CRP in the past.
4

County Name
EI>=8 (Acres)
National Priority
Area
State Priority
Area (Acres)
Rare and Declining Habitat (Acres)
Permanent Wildlife Habitat (Acres)
Pollinator Habitat Offers
Table 3 -- Description of Signup 45 Acceptable AcresALABAMA
Average Erodibility Index (EI)
Pollinator Habitat (Acres)
STATE TOTALS 22,300 19,988 5,405 0 85 019 0AUTAUGA * * * * * * * * BALDWIN 312 318 0 0 0 017 0BARBOUR 2,855 2,952 181 0 0 023 0BLOUNT * * * * * * * * BUTLER 230 230 0 0 0 021 0CHEROKEE 76 76 13 0 0 024 0COFFEE 1,176 1,170 21 0 0 017 0COLBERT * * * * * * * * CONECUH 309 289 0 0 0 015 0COVINGTON 1,628 1,628 511 0 0 015 0CRENSHAW 885 1,035 42 0 0 017 0CULLMAN 169 169 169 0 0 025 0DALE 641 641 641 0 0 016 0DALLAS 849 849 849 0 0 033 0DEKALB 268 0 0 0 0 025 0ESCAMBIA 592 657 0 0 0 014 0ETOWAH * * * * * * * * FAYETTE 98 98 0 0 3 023 0FRANKLIN 83 0 0 0 0 029 0GENEVA 2,852 3,584 31 0 0 013 0GREENE 285 0 231 0 19 019 0HENRY 831 831 0 0 0 019 0HOUSTON 1,480 1,524 1,524 0 0 014 0JACKSON 273 0 57 0 0 023 0LAUDERDALE 716 0 716 0 5 023 0LAWRENCE 801 0 50 0 4 015 0LIMESTONE 244 0 94 0 0 023 0LOWNDES * * * * * * * * MACON * * * * * * * * MADISON 82 0 69 0 0 015 0MARENGO * * * * * * * * MARSHALL * * * * * * * * MONROE 381 381 0 0 0 014 0MONTGOMERY 359 359 142 0 0 021 0PERRY * * * * * * * * PICKENS 591 0 0 0 4 018 0PIKE 1,673 1,673 0 0 0 024 0RUSSELL * * * * * * * * ST CLAIR * * * * * * * * SUMTER * * * * * * * * TUSCALOOSA 142 142 0 0 0 016 0WILCOX * * * * * * * *
* Data withheld to avoid disclosure of individual operations.Note: Acceptable acres may be listed in multiple categories.
5

County NameIntroduced
GrassNative Grass Total
GrassHardwood
TreesSoftwood
TreesTotal Trees
Table 4 -- Description of Signup 45 Acceptable Acres 1/ALABAMA
STATE TOTALS 1,689 10 1,699 3,525 18,019 21,544AUTAUGA * * * * * * BALDWIN 4 0 4 0 309 309BARBOUR 0 0 0 16 2,936 2,952BLOUNT * * * * * * BUTLER 0 0 0 0 230 230CHEROKEE 0 0 0 0 76 76COFFEE 37 0 37 16 1,121 1,137COLBERT * * * * * * CONECUH 0 0 0 0 309 309COVINGTON 0 0 0 0 1,628 1,628CRENSHAW 0 0 0 29 997 1,025CULLMAN 19 0 19 0 150 150DALE 0 0 0 243 397 641DALLAS 484 0 484 0 353 353DEKALB 59 0 59 0 203 203ESCAMBIA 0 0 0 58 595 653ETOWAH * * * * * * FAYETTE 0 0 0 0 90 90FRANKLIN 19 0 19 0 62 62GENEVA 0 0 0 2,443 1,141 3,584GREENE 125 0 125 0 132 132HENRY 0 0 0 210 617 828HOUSTON 0 0 0 194 1,330 1,524JACKSON 90 0 90 0 183 183LAUDERDALE 95 10 105 117 483 599LAWRENCE 285 0 285 5 527 532LIMESTONE 124 0 124 7 108 115LOWNDES * * * * * * MACON * * * * * * MADISON 33 0 33 49 48 96MARENGO * * * * * * MARSHALL * * * * * * MONROE 0 0 0 0 381 381MONTGOMERY 0 0 0 0 351 351PERRY * * * * * * PICKENS 0 0 0 41 536 577PIKE 44 0 44 27 1,578 1,605RUSSELL * * * * * * ST CLAIR * * * * * * SUMTER * * * * * * TUSCALOOSA 0 0 0 0 140 140WILCOX * * * * * *
* Data withheld to avoid disclosure of individual operations.1/ Not including practices: permanent wildlife habitat, wildlife food plots, rare and declining habitat, and pollinator habitat.
6

ALASKA
7

County Name Offers Received
Acceptable Offers
Offered Acres
Acceptable Acres
EnrollmentOct. 2013
before continuous
1/
Acreage Expiring Sept. 30,
2013
Enrollment as of
June 2013
Table 1 -- Offers Received, Acceptable Offers, and CRP AcreageALASKA
STATE TOTALS 0 0 0 0 17,9425017,992FAIRBANKS 0 0 0 0 * * 0DELTA 0 0 0 0 17,031017,031HOMER 0 0 0 0 52850578PALMER 0 0 0 0 3840384
1 / Not including continuous signup enrollment between July and September 2013.
* Data withheld to avoid disclosure of individual operations.
8

ARIZONA
9
County Name Offers Received
Acceptable Offers
Offered Acres
Acceptable Acres
EnrollmentOct. 2013
before continuous
1/
Acreage Expiring Sept. 30,
2013
Enrollment as of
June 2013
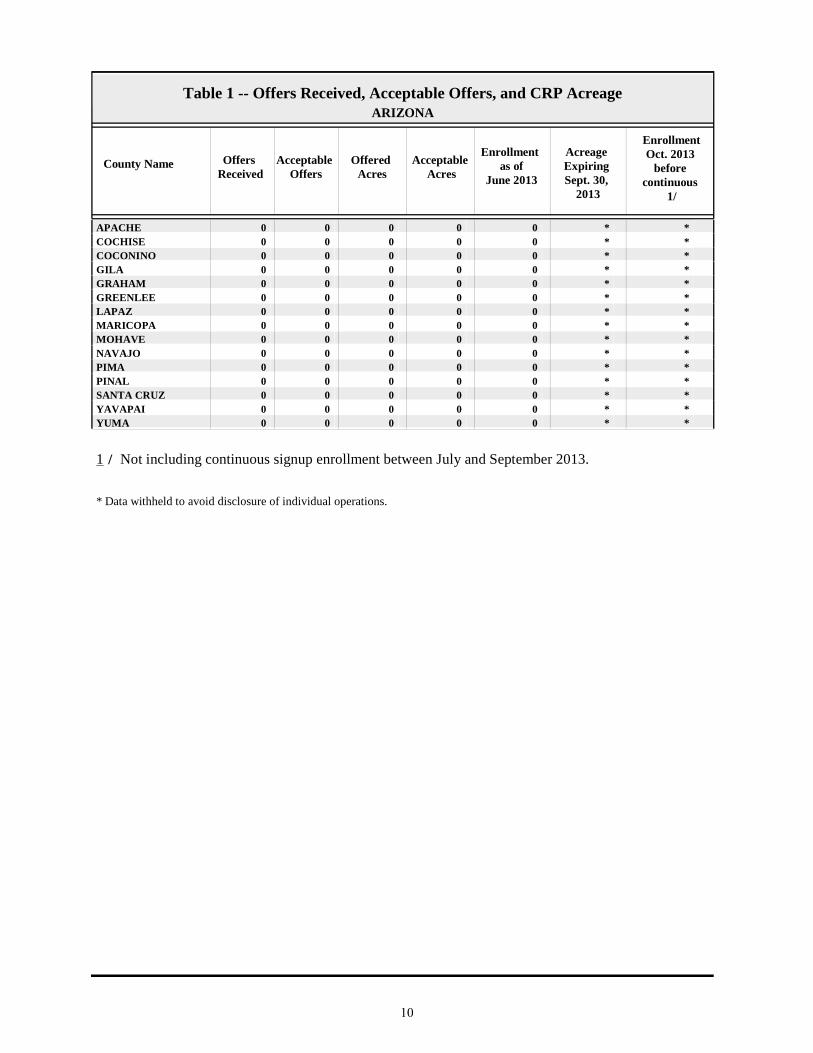
Table 1 -- Offers Received, Acceptable Offers, and CRP AcreageARIZONA
APACHE 0 0 0 0 * * 0COCHISE 0 0 0 0 * * 0COCONINO 0 0 0 0 * * 0GILA 0 0 0 0 * * 0GRAHAM 0 0 0 0 * * 0GREENLEE 0 0 0 0 * * 0LAPAZ 0 0 0 0 * * 0MARICOPA 0 0 0 0 * * 0MOHAVE 0 0 0 0 * * 0NAVAJO 0 0 0 0 * * 0PIMA 0 0 0 0 * * 0PINAL 0 0 0 0 * * 0SANTA CRUZ 0 0 0 0 * * 0YAVAPAI 0 0 0 0 * * 0YUMA 0 0 0 0 * * 0
1 / Not including continuous signup enrollment between July and September 2013.
* Data withheld to avoid disclosure of individual operations.
10

ARKANSAS
11

County Name Offers Received
Acceptable Offers
Offered Acres
Acceptable Acres
EnrollmentOct. 2013
before continuous
1/
Acreage Expiring Sept. 30,
2013
Enrollment as of
June 2013
Table 1 -- Offers Received, Acceptable Offers, and CRP AcreageARKANSAS
STATE TOTALS 163 148 7,748 7,105 231,44115,024239,361ARKANSAS 13 6 460 242 12,59157812,926ASHLEY 7 7 388 388 8,0676038,282BAXTER 0 0 0 0 66066BENTON * * * * * 3650BOONE * * * * * 557557BRADLEY 0 0 0 0 1200120CALHOUN 0 0 0 0 2560256CARROLL 0 0 0 0 83083CHICOT 9 9 683 683 16,10269316,112CLARK * 0 * 0 1,2631811,443CLAY 20 19 567 561 5,3531,1785,969CLEBURNE 0 0 0 0 12761189CLEVELAND 0 0 0 0 5180518COLUMBIA 0 0 0 0 * * 0CONWAY 0 0 0 0 84433877CRAIGHEAD * * * * * 1931,845CRAWFORD 0 0 0 0 7220722CRITTENDEN 0 0 0 0 8,0111978,209CROSS 7 7 310 310 11,52170011,911DALLAS 0 0 0 0 2750275DESHA 4 4 37 37 7,9844418,389DREW 5 5 278 278 6,3901416,253FAULKNER 0 0 0 0 1,539491,588FRANKLIN 0 0 0 0 3820382FULTON 0 0 0 0 16016GARLAND 0 0 0 0 909GRANT 0 0 0 0 * * 0GREENE 12 12 415 415 2,6958513,131HEMPSTEAD * * * * * 3511,515HOT SPRING 0 0 0 0 16016HOWARD 0 0 0 0 * * 0INDEPENDENCE * * * * * 424,816IZARD 0 0 0 0 202JACKSON 0 0 0 0 12,896012,896JEFFERSON * * * * * 29521,274JOHNSON 0 0 0 0 41041LAFAYETTE 0 0 0 0 29029LAWRENCE 0 0 0 0 2,78002,780LEE 0 0 0 0 2,4302662,696LINCOLN 0 0 0 0 8,8323319,163LITTLE RIVER 0 0 0 0 17945223LOGAN 0 0 0 0 77077LONOKE 13 13 980 980 12,2691,28812,577MADISON 0 0 0 0 22082302MARION 0 0 0 0 * * 0MILLER 0 0 0 0 2,419652,484MISSISSIPPI 0 0 0 0 1,30001,300MONROE 0 0 0 0 3,9763294,304MONTGOMERY 0 0 0 0 43043NEVADA * * * * * 161742NEWTON 0 0 0 0 * * 0OUACHITA 0 0 0 0 2490249
12

County Name Offers Received
Acceptable Offers
Offered Acres
Acceptable Acres
EnrollmentOct. 2013
before continuous
1/
Acreage Expiring Sept. 30,
2013
Enrollment as of
June 2013
Table 1 -- Offers Received, Acceptable Offers, and CRP AcreageARKANSAS
PERRY 0 0 0 0 1,15801,158PHILLIPS 3 3 83 83 3,3612053,483PIKE 0 0 0 0 * * 0POINSETT 3 * 68 * * 1064,065POLK 0 0 0 0 * * 0POPE 0 0 0 0 1,983502,033PRAIRIE 32 32 1,696 1,696 16,1593,03317,497PULASKI * * * * * 784,278RANDOLPH 0 0 0 0 4000400ST FRANCIS 5 * 228 * * 4805,029SALINE 0 0 0 0 101SCOTT 0 0 0 0 3230323SEARCY 0 0 0 0 61061SEBASTIAN 0 0 0 0 40040SEVIER 0 0 0 0 2300230SHARP 0 0 0 0 1280128STONE 0 0 0 0 23023UNION 0 0 0 0 * * 0VAN BUREN 0 0 0 0 * * 0WASHINGTON 0 0 0 0 1110111WHITE 8 6 408 345 20,66367320,991WOODRUFF 7 7 180 180 6,2116536,684YELL 0 0 0 0 5,11405,114
1 / Not including continuous signup enrollment between July and September 2013.
* Data withheld to avoid disclosure of individual operations.
13
County NameExpiring
Sept. 2013 (Acres)
New Lands (Acres) 1/
Average Rental
Payment ($/Acre)
Total Rental
Payment ($/year)
Average EBI Score
without Cost
Average EBI Score with Cost
Table 2 -- Description of Signup 45 Acceptable AcresARKANSAS
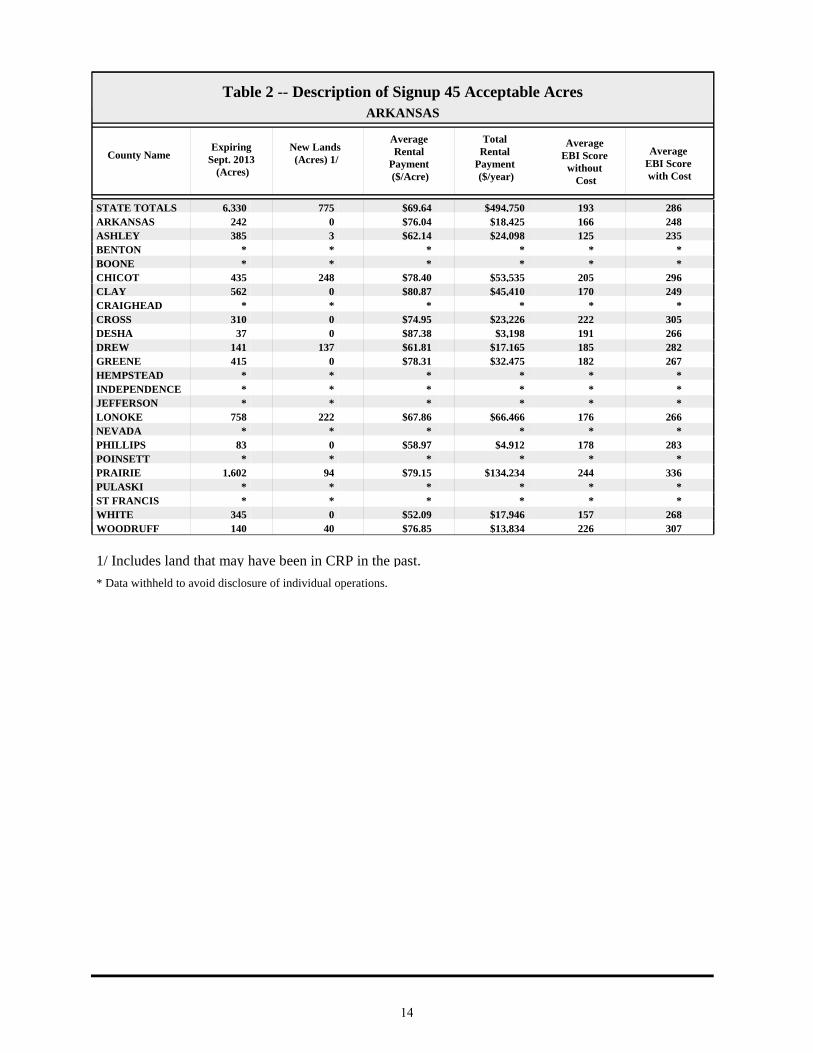
STATE TOTALS 6,330 775 $69.64 $494,750 193 286ARKANSAS 242 0 $76.04 $18,425 166 248ASHLEY 385 3 $62.14 $24,098 125 235BENTON * * * * * * BOONE * * * * * * CHICOT 435 248 $78.40 $53,535 205 296CLAY 562 0 $80.87 $45,410 170 249CRAIGHEAD * * * * * * CROSS 310 0 $74.95 $23,226 222 305DESHA 37 0 $87.38 $3,198 191 266DREW 141 137 $61.81 $17,165 185 282GREENE 415 0 $78.31 $32,475 182 267HEMPSTEAD * * * * * * INDEPENDENCE * * * * * * JEFFERSON * * * * * * LONOKE 758 222 $67.86 $66,466 176 266NEVADA * * * * * * PHILLIPS 83 0 $58.97 $4,912 178 283POINSETT * * * * * * PRAIRIE 1,602 94 $79.15 $134,234 244 336PULASKI * * * * * * ST FRANCIS * * * * * * WHITE 345 0 $52.09 $17,946 157 268WOODRUFF 140 40 $76.85 $13,834 226 307
* Data withheld to avoid disclosure of individual operations.
1/ Includes land that may have been in CRP in the past.
14

County Name
EI>=8 (Acres)
National Priority
Area
State Priority
Area (Acres)
Rare and Declining Habitat (Acres)
Permanent Wildlife Habitat (Acres)
Pollinator Habitat Offers
Table 3 -- Description of Signup 45 Acceptable AcresARKANSAS
Average Erodibility Index (EI)
Pollinator Habitat (Acres)
STATE TOTALS 5,531 0 5,160 0 329 018 0ARKANSAS 242 0 0 0 0 018 0ASHLEY 14 0 388 0 7 03 0BENTON * * * * * * * * BOONE * * * * * * * * CHICOT 576 0 683 0 0 011 0CLAY 562 0 0 0 20 035 0CRAIGHEAD * * * * * * * * CROSS 301 0 310 0 20 035 0DESHA 25 0 37 0 12 07 0DREW 56 0 278 0 4 07 0GREENE 415 0 0 0 110 021 0HEMPSTEAD * * * * * * * * INDEPENDENCE * * * * * * * * JEFFERSON * * * * * * * * LONOKE 567 0 980 0 153 011 0NEVADA * * * * * * * * PHILLIPS 83 0 0 0 0 029 0POINSETT * * * * * * * * PRAIRIE 1,641 0 1,696 0 2 021 0PULASKI * * * * * * * * ST FRANCIS * * * * * * * * WHITE 106 0 345 0 0 06 0WOODRUFF 140 0 180 0 0 010 0
* Data withheld to avoid disclosure of individual operations.Note: Acceptable acres may be listed in multiple categories.
15

County NameIntroduced
GrassNative Grass Total
GrassHardwood
TreesSoftwood
TreesTotal Trees
Table 4 -- Description of Signup 45 Acceptable Acres 1/ARKANSAS
STATE TOTALS 1,391 1,238 2,630 1,521 2,579 4,100ARKANSAS 172 10 182 56 0 56ASHLEY 0 0 0 26 355 380BENTON * * * * * * BOONE * * * * * * CHICOT 0 349 349 115 219 334CLAY 496 0 496 0 45 45CRAIGHEAD * * * * * * CROSS 0 115 115 174 0 174DESHA 0 0 0 0 25 25DREW 0 0 0 162 112 274GREENE 305 0 305 0 0 0HEMPSTEAD * * * * * * INDEPENDENCE * * * * * * JEFFERSON * * * * * * LONOKE 0 350 350 37 440 476NEVADA * * * * * * PHILLIPS 54 0 54 0 29 29POINSETT * * * * * * PRAIRIE 72 242 314 673 676 1,349PULASKI * * * * * * ST FRANCIS * * * * * * WHITE 0 96 96 0 239 239WOODRUFF 0 0 0 147 33 180
* Data withheld to avoid disclosure of individual operations.1/ Not including practices: permanent wildlife habitat, wildlife food plots, rare and declining habitat, and pollinator habitat.
16

CALIFORNIA
17

County Name Offers Received
Acceptable Offers
Offered Acres
Acceptable Acres
EnrollmentOct. 2013
before continuous
1/
Acreage Expiring Sept. 30,
2013
Enrollment as of
June 2013
Table 1 -- Offers Received, Acceptable Offers, and CRP AcreageCALIFORNIA
STATE TOTALS 12 11 3,482 3,360 86,5867,86391,088ALAMEDA 0 0 0 0 * * 0ALPINE 0 0 0 0 * * 0AMADOR 0 0 0 0 * * 0BUTTE 0 0 0 0 * * 0CALAVERAS 0 0 0 0 * * 0COLUSA * 0 * 0 1,0929802,072CONTRA COSTA 0 0 0 0 * * 0DEL NORTE 0 0 0 0 * * 0EL DORADO 0 0 0 0 * * 0FRESNO 0 0 0 0 * * 0GLENN 0 0 0 0 999111,009HUMBOLDT 0 0 0 0 39039IMPERIAL 0 0 0 0 * * 0INYO 0 0 0 0 * * 0KERN 0 0 0 0 5,36605,366KINGS 0 0 0 0 * * 0LAKE 0 0 0 0 * * 0LASSEN 0 0 0 0 01818LOS ANGELES 0 0 0 0 3380338MADERA 0 0 0 0 * * 0MARIN 0 0 0 0 * * 0MARIPOSA 0 0 0 0 * * 0MENDOCINO 0 0 0 0 * * 0MERCED 0 0 0 0 5594,2804,839MODOC 0 0 0 0 * * 0MONO 0 0 0 0 * * 0MONTEREY 4 4 1,210 1,210 11,0291009,919NAPA 0 0 0 0 * * 0NEVADA 0 0 0 0 * * 0ORANGE 0 0 0 0 * * 0PLACER 0 0 0 0 * * 0PLUMAS 0 0 0 0 13013RIVERSIDE 0 0 0 0 * * 0SACRAMENTO 0 0 0 0 98098SAN BENITO 0 0 0 0 * * 0SAN BERNARDINO 0 0 0 0 * * 0SAN DIEGO 0 0 0 0 * * 0SAN FRANCISCO 0 0 0 0 * * 0SAN JOAQUIN 0 0 0 0 * * 0SAN LUIS OBISPO * * * * * 48742,216SAN MATEO 0 0 0 0 * * 0SANTA BARBARA 0 0 0 0 * * 0SANTA CLARA 0 0 0 0 * * 0SANTA CRUZ 0 0 0 0 * * 0SHASTA 0 0 0 0 * * 0SIERRA 0 0 0 0 * * 0SISKIYOU 5 5 1,561 1,561 12,37012310,931SOLANO 0 0 0 0 1,1131,2342,347SONOMA 0 0 0 0 * * 0STANISLAUS 0 0 0 0 5870587SUTTER 0 0 0 0 1,03201,032TEHAMA 0 0 0 0 1570157
18
County Name Offers Received
Acceptable Offers
Offered Acres
Acceptable Acres
EnrollmentOct. 2013
before continuous
1/
Acreage Expiring Sept. 30,
2013
Enrollment as of
June 2013
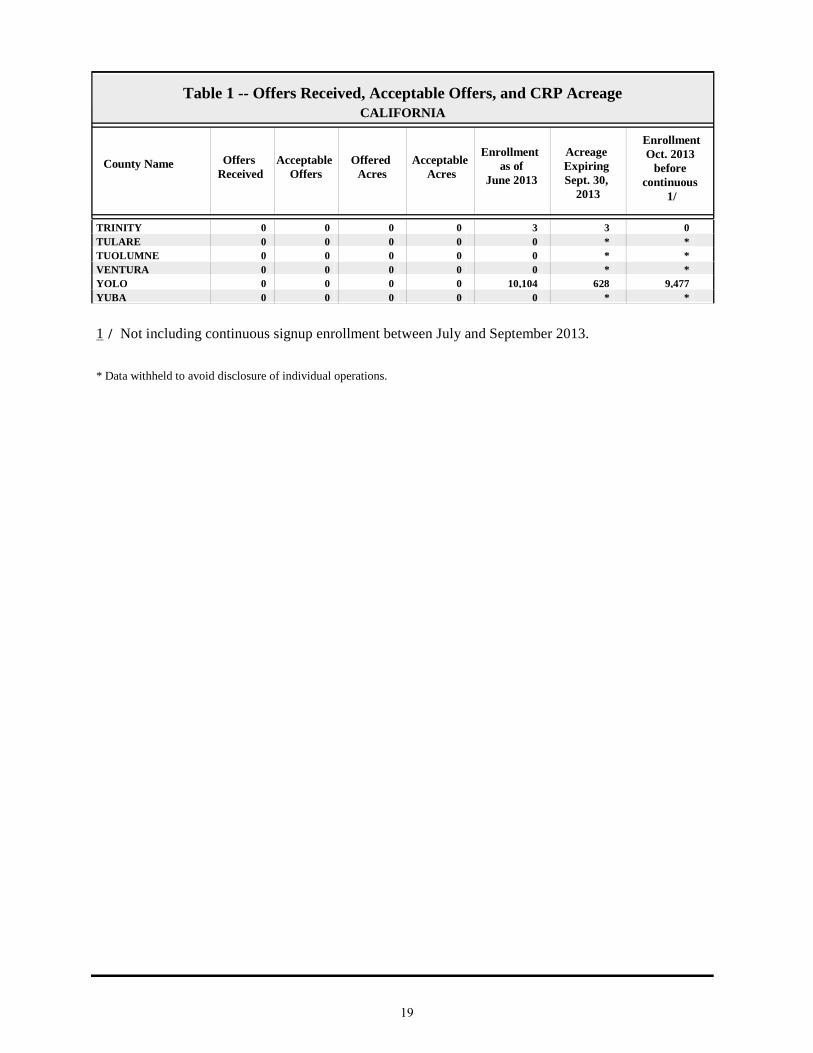
Table 1 -- Offers Received, Acceptable Offers, and CRP AcreageCALIFORNIA
TRINITY 0 0 0 0 033TULARE 0 0 0 0 * * 0TUOLUMNE 0 0 0 0 * * 0VENTURA 0 0 0 0 * * 0YOLO 0 0 0 0 9,47762810,104YUBA 0 0 0 0 * * 0
1 / Not including continuous signup enrollment between July and September 2013.
* Data withheld to avoid disclosure of individual operations.
19
County NameExpiring
Sept. 2013 (Acres)
New Lands (Acres) 1/
Average Rental
Payment ($/Acre)
Total Rental
Payment ($/year)
Average EBI Score
without Cost
Average EBI Score with Cost
Table 2 -- Description of Signup 45 Acceptable AcresCALIFORNIA
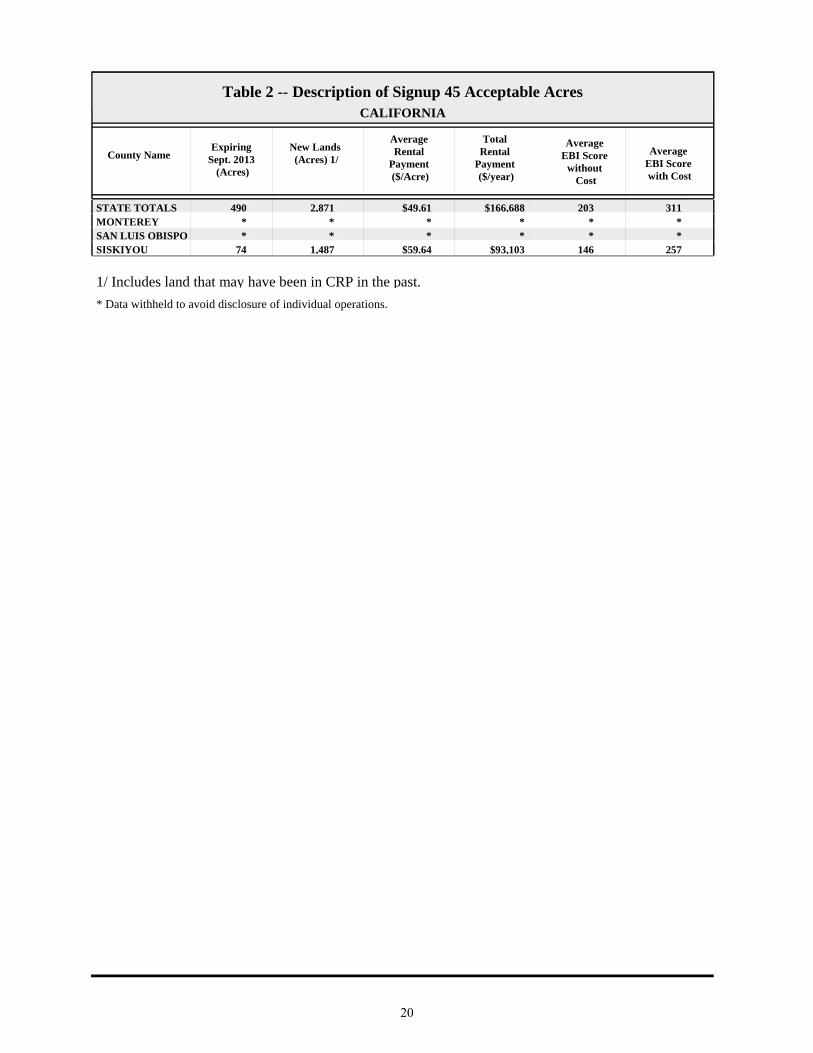
STATE TOTALS 490 2,871 $49.61 $166,688 203 311MONTEREY * * * * * * SAN LUIS OBISPO * * * * * * SISKIYOU 74 1,487 $59.64 $93,103 146 257
* Data withheld to avoid disclosure of individual operations.
1/ Includes land that may have been in CRP in the past.
20

County Name
EI>=8 (Acres)
National Priority
Area
State Priority
Area (Acres)
Rare and Declining Habitat (Acres)
Permanent Wildlife Habitat (Acres)
Pollinator Habitat Offers
Table 3 -- Description of Signup 45 Acceptable AcresCALIFORNIA
Average Erodibility Index (EI)
Pollinator Habitat (Acres)
STATE TOTALS 1,799 0 3,360 0 589 015 0MONTEREY * * * * * * * * SAN LUIS OBISPO * * * * * * * * SISKIYOU 0 0 1,561 0 0 05 0
* Data withheld to avoid disclosure of individual operations.Note: Acceptable acres may be listed in multiple categories.
21

County NameIntroduced
GrassNative Grass Total
GrassHardwood
TreesSoftwood
TreesTotal Trees
Table 4 -- Description of Signup 45 Acceptable Acres 1/CALIFORNIA
STATE TOTALS 2,771 0 2,771 0 0 0MONTEREY * * * * * * SAN LUIS OBISPO * * * * * * SISKIYOU 1,561 0 1,561 0 0 0
* Data withheld to avoid disclosure of individual operations.1/ Not including practices: permanent wildlife habitat, wildlife food plots, rare and declining habitat, and pollinator habitat.
22

COLORADO
23

County Name Offers Received
Acceptable Offers
Offered Acres
Acceptable Acres
EnrollmentOct. 2013
before continuous
1/
Acreage Expiring Sept. 30,
2013
Enrollment as of
June 2013
Table 1 -- Offers Received, Acceptable Offers, and CRP AcreageCOLORADO
STATE TOTALS 1,125 1,038 183,629 169,503 2,020,813223,4782,074,788ADAMS 25 20 8,061 6,625 40,21512,73546,324ALAMOSA 0 0 0 0 * * 0ARAPAHOE 6 4 1,209 1,030 18,3063,29820,574ARCHULETA 0 0 0 0 * * 0BACA 48 48 8,002 8,002 279,6802,697274,374BENT * * * * * 33733,886BOULDER 0 0 0 0 1707177CHAFFEE 0 0 0 0 * * 0CHEYENNE 43 43 12,695 12,695 123,47712,210122,991CLEAR CREEK 0 0 0 0 * * 0CONEJOS 0 0 0 0 51051COSTILLA 0 0 0 0 13013CROWLEY 0 0 0 0 21,917021,917CUSTER 0 0 0 0 * * 0DELTA 0 0 0 0 * * 0DENVER 0 0 0 0 * * 0DOLORES 15 15 1,311 1,311 18,53275217,973DOUGLAS 0 0 0 0 25025EAGLE 0 0 0 0 * * 0ELBERT 20 17 3,409 3,081 39,2374,21540,371EL PASO 3 3 246 246 14,30162514,681FREMONT 0 0 0 0 * * 0GARFIELD 0 0 0 0 82082GILPIN 0 0 0 0 * * 0GRAND 0 0 0 0 * * 0GUNNISON 0 0 0 0 505HINSDALE 0 0 0 0 * * 0HUERFANO 0 0 0 0 5040504JACKSON 0 0 0 0 808JEFFERSON 0 0 0 0 * * 0KIOWA 17 15 2,591 2,283 178,566843177,127KIT CARSON 85 71 15,600 12,979 128,10320,057135,180LAKE 0 0 0 0 * * 0LA PLATA * * * * * 5111,354LARIMER 0 0 0 0 5270527LAS ANIMAS 10 10 2,089 2,089 19,8391,17418,925LINCOLN 61 52 11,482 9,384 115,76913,053119,438LOGAN 127 110 16,425 13,483 111,80618,666116,989MESA 0 0 0 0 * * 0MINERAL 0 0 0 0 * * 0MOFFAT * * * * * 40425,894MONTEZUMA 7 7 548 548 13,59496314,009MONTROSE 0 0 0 0 26026MORGAN 59 59 8,420 8,420 60,15313,33165,065OTERO 0 0 0 0 2,014402,054OURAY 0 0 0 0 * * 0PARK 0 0 0 0 707PHILLIPS 60 49 4,246 3,836 39,2335,81841,215PITKIN 0 0 0 0 * * 0PROWERS 11 10 1,671 1,518 155,986613155,080PUEBLO 0 0 0 0 36,137036,137RIO BLANCO 0 0 0 0 45045
24
County Name Offers Received
Acceptable Offers
Offered Acres
Acceptable Acres
EnrollmentOct. 2013
before continuous
1/
Acreage Expiring Sept. 30,
2013
Enrollment as of
June 2013
Table 1 -- Offers Received, Acceptable Offers, and CRP AcreageCOLORADO
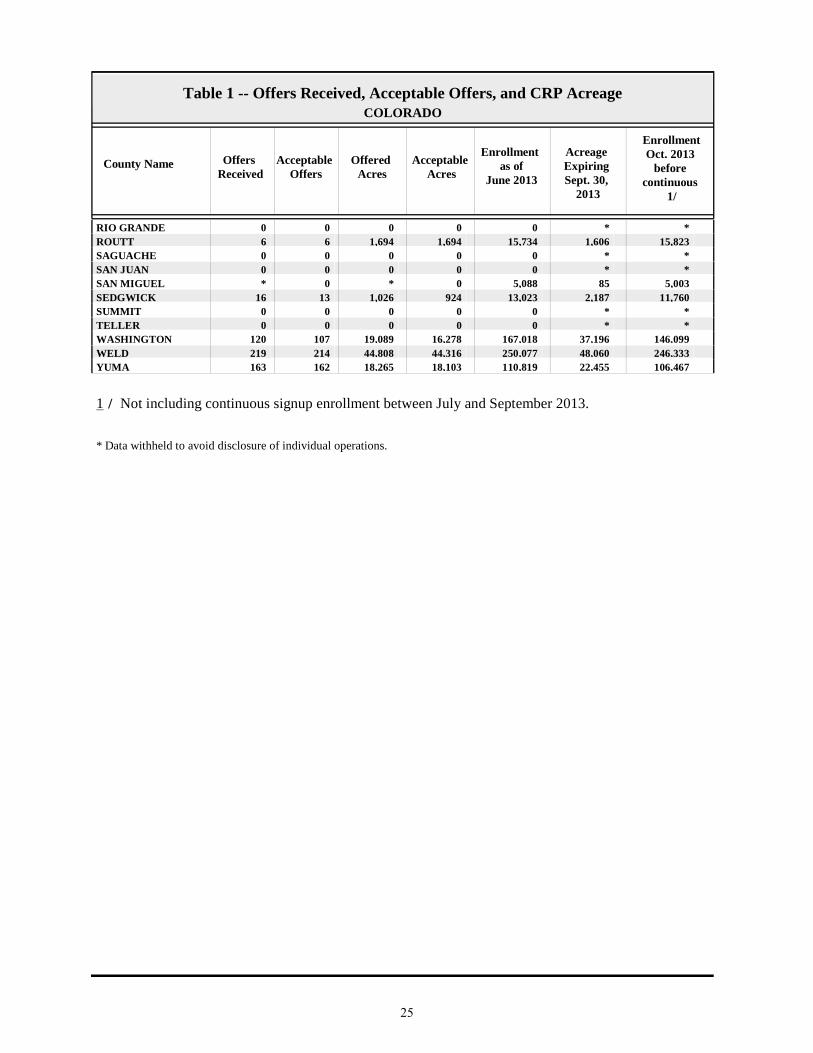
RIO GRANDE 0 0 0 0 * * 0ROUTT 6 6 1,694 1,694 15,8231,60615,734SAGUACHE 0 0 0 0 * * 0SAN JUAN 0 0 0 0 * * 0SAN MIGUEL * 0 * 0 5,003855,088SEDGWICK 16 13 1,026 924 11,7602,18713,023SUMMIT 0 0 0 0 * * 0TELLER 0 0 0 0 * * 0WASHINGTON 120 107 19,089 16,278 146,09937,196167,018WELD 219 214 44,808 44,316 246,33348,060250,077YUMA 163 162 18,265 18,103 106,46722,455110,819
1 / Not including continuous signup enrollment between July and September 2013.
* Data withheld to avoid disclosure of individual operations.
25

County NameExpiring
Sept. 2013 (Acres)
New Lands (Acres) 1/
Average Rental
Payment ($/Acre)
Total Rental
Payment ($/year)
Average EBI Score
without Cost
Average EBI Score with Cost
Table 2 -- Description of Signup 45 Acceptable AcresCOLORADO
STATE TOTALS 141,604 27,899 $35.94 $6,092,421 153 263ADAMS 6,585 41 $25.36 $168,001 141 251ARAPAHOE 745 285 $14.85 $15,287 136 252BACA 2,651 5,352 $32.22 $257,874 150 259BENT * * * * * * CHEYENNE 8,662 4,033 $32.24 $409,287 167 277DOLORES 449 862 $32.38 $42,442 140 247ELBERT 2,815 266 $34.96 $107,703 154 266EL PASO 245 0 $25.25 $6,199 196 325KIOWA 537 1,745 $29.28 $66,849 129 242KIT CARSON 10,655 2,324 $34.02 $441,598 126 239LA PLATA * * * * * * LAS ANIMAS 1,934 155 $30.00 $62,649 168 278LINCOLN 7,752 1,632 $32.58 $305,742 156 263LOGAN 11,897 1,586 $40.36 $544,125 117 233MOFFAT * * * * * * MONTEZUMA 445 103 $41.34 $22,643 121 223MORGAN 8,377 43 $29.69 $249,985 180 292PHILLIPS 3,405 432 $40.68 $156,081 155 260PROWERS 461 1,057 $34.14 $51,841 167 277ROUTT 1,386 309 $29.61 $50,174 151 261SEDGWICK 916 8 $39.15 $36,186 144 253WASHINGTON 15,547 731 $35.73 $581,627 140 248WELD 38,018 6,298 $34.93 $1,548,097 171 280YUMA 17,466 637 $52.37 $947,976 154 257
* Data withheld to avoid disclosure of individual operations.
1/ Includes land that may have been in CRP in the past.
26

County Name
EI>=8 (Acres)
National Priority
Area
State Priority
Area (Acres)
Rare and Declining Habitat (Acres)
Permanent Wildlife Habitat (Acres)
Pollinator Habitat Offers
Table 3 -- Description of Signup 45 Acceptable AcresCOLORADO
Average Erodibility Index (EI)
Pollinator Habitat (Acres)
STATE TOTALS 165,691 0 40,158 0 34,226 12915 2,429ADAMS 6,625 0 0 0 0 413 260ARAPAHOE 1,030 0 0 0 0 017 0BACA 8,002 0 7,978 0 3,378 416 47BENT * * * * * * * * CHEYENNE 12,695 0 12,695 0 9,721 016 0DOLORES 274 0 1,311 0 138 106 113ELBERT 3,081 0 0 0 1,600 117 27EL PASO 246 0 0 0 0 317 25KIOWA 2,283 0 2,283 0 0 013 0KIT CARSON 12,979 0 0 0 7,569 012 0LA PLATA * * * * * * * * LAS ANIMAS 2,089 0 2,089 0 0 013 0LINCOLN 9,384 0 9,384 0 3,061 112 15LOGAN 11,667 0 0 0 2,311 3111 531MOFFAT * * * * * * * * MONTEZUMA 0 0 548 0 444 16 15MORGAN 8,420 0 0 0 409 018 0PHILLIPS 3,836 0 0 0 18 016 0PROWERS 1,518 0 1,518 0 1,057 012 0ROUTT 1,386 0 1,694 0 0 012 0SEDGWICK 873 0 0 0 0 014 0WASHINGTON 16,278 0 0 0 3,792 4013 784WELD 44,316 0 0 0 543 1117 297YUMA 18,103 0 0 0 185 2315 315
* Data withheld to avoid disclosure of individual operations.Note: Acceptable acres may be listed in multiple categories.
27

County NameIntroduced
GrassNative Grass Total
GrassHardwood
TreesSoftwood
TreesTotal Trees
Table 4 -- Description of Signup 45 Acceptable Acres 1/COLORADO
STATE TOTALS 10,248 122,586 132,834 0 0 0ADAMS 0 6,364 6,364 0 0 0ARAPAHOE 0 1,030 1,030 0 0 0BACA 0 4,577 4,577 0 0 0BENT * * * * * * CHEYENNE 0 2,975 2,975 0 0 0DOLORES 0 1,059 1,059 0 0 0ELBERT 0 1,454 1,454 0 0 0EL PASO 0 220 220 0 0 0KIOWA 0 2,283 2,283 0 0 0KIT CARSON 245 5,166 5,411 0 0 0LA PLATA * * * * * * LAS ANIMAS 0 2,089 2,089 0 0 0LINCOLN 652 5,655 6,307 0 0 0LOGAN 1,699 8,942 10,641 0 0 0MOFFAT * * * * * * MONTEZUMA 0 88 88 0 0 0MORGAN 1,206 6,798 8,004 0 0 0PHILLIPS 402 3,416 3,818 0 0 0PROWERS 0 461 461 0 0 0ROUTT 1,413 282 1,694 0 0 0SEDGWICK 7 913 920 0 0 0WASHINGTON 1,042 10,659 11,701 0 0 0WELD 2,194 41,282 43,476 0 0 0YUMA 1,058 16,545 17,603 0 0 0
* Data withheld to avoid disclosure of individual operations.1/ Not including practices: permanent wildlife habitat, wildlife food plots, rare and declining habitat, and pollinator habitat.
28

CONNECTICUT
29

County Name Offers Received
Acceptable Offers
Offered Acres
Acceptable Acres
EnrollmentOct. 2013
before continuous
1/
Acreage Expiring Sept. 30,
2013
Enrollment as of
June 2013
Table 1 -- Offers Received, Acceptable Offers, and CRP AcreageCONNECTICUT
STATE TOTALS 0 0 0 0 581069FAIRFIELD 0 0 0 0 * * 0HARTFORD 0 0 0 0 * * 0LITCHFIELD 0 0 0 0 44044MIDDLESEX 0 0 0 0 * * 0NEW HAVEN 0 0 0 0 404NEW LONDON 0 0 0 0 10414TOLLAND 0 0 0 0 * * 0WINDHAM 0 0 0 0 168
1 / Not including continuous signup enrollment between July and September 2013.
* Data withheld to avoid disclosure of individual operations.
30

DELAWARE
31

County Name Offers Received
Acceptable Offers
Offered Acres
Acceptable Acres
EnrollmentOct. 2013
before continuous
1/
Acreage Expiring Sept. 30,
2013
Enrollment as of
June 2013
Table 1 -- Offers Received, Acceptable Offers, and CRP AcreageDELAWARE
STATE TOTALS 3 3 66 66 6,0753176,326KENT 0 0 0 0 2,5312022,733NEW CASTLE * * * * * 91682SUSSEX * * * * * 242,911
1 / Not including continuous signup enrollment between July and September 2013.
* Data withheld to avoid disclosure of individual operations.
32

County NameExpiring
Sept. 2013 (Acres)
New Lands (Acres) 1/
Average Rental
Payment ($/Acre)
Total Rental
Payment ($/year)
Average EBI Score
without Cost
Average EBI Score with Cost
Table 2 -- Description of Signup 45 Acceptable AcresDELAWARE
STATE TOTALS 39 27 $84.00 $5,569 163 265NEW CASTLE * * * * * * SUSSEX * * * * * *
* Data withheld to avoid disclosure of individual operations.
1/ Includes land that may have been in CRP in the past.
33

County Name
EI>=8 (Acres)
National Priority
Area
State Priority
Area (Acres)
Rare and Declining Habitat (Acres)
Permanent Wildlife Habitat (Acres)
Pollinator Habitat Offers
Table 3 -- Description of Signup 45 Acceptable AcresDELAWARE
Average Erodibility Index (EI)
Pollinator Habitat (Acres)
STATE TOTALS 0 66 0 0 27 05 0NEW CASTLE * * * * * * * * SUSSEX * * * * * * * *
* Data withheld to avoid disclosure of individual operations.Note: Acceptable acres may be listed in multiple categories.
34

County NameIntroduced
GrassNative Grass Total
GrassHardwood
TreesSoftwood
TreesTotal Trees
Table 4 -- Description of Signup 45 Acceptable Acres 1/DELAWARE
STATE TOTALS 15 23 38 0 0 0NEW CASTLE * * * * * * SUSSEX * * * * * *
* Data withheld to avoid disclosure of individual operations.1/ Not including practices: permanent wildlife habitat, wildlife food plots, rare and declining habitat, and pollinator habitat.
35

FLORIDA
36

County Name Offers Received
Acceptable Offers
Offered Acres
Acceptable Acres
EnrollmentOct. 2013
before continuous
1/
Acreage Expiring Sept. 30,
2013
Enrollment as of
June 2013
Table 1 -- Offers Received, Acceptable Offers, and CRP AcreageFLORIDA
STATE TOTALS 116 92 3,884 3,285 43,7556,13546,605ALACHUA 0 0 0 0 * * 0BAKER 0 0 0 0 * * 0BAY 0 0 0 0 * * 0BRADFORD 0 0 0 0 * * 0BREVARD 0 0 0 0 * * 0BROWARD 0 0 0 0 * * 0CALHOUN 0 0 0 0 9970997CHARLOTTE 0 0 0 0 * * 0CITRUS 0 0 0 0 * * 0CLAY 0 0 0 0 * * 0COLLIER 0 0 0 0 * * 0COLUMBIA * * * * * 85195DADE 0 0 0 0 * * 0DESOTO 0 0 0 0 * * 0DIXIE 0 0 0 0 * * 0DUVAL 0 0 0 0 * * 0ESCAMBIA 12 12 348 348 1,7884871,927FLAGLER 0 0 0 0 * * 0FRANKLIN 0 0 0 0 * * 0GADSDEN 0 0 0 0 90353956GILCHRIST 0 0 0 0 * * 0GLADES 0 0 0 0 * * 0GULF 0 0 0 0 62062HAMILTON 0 0 0 0 27210282HARDEE 0 0 0 0 * * 0HENDRY 0 0 0 0 * * 0HERNANDO 0 0 0 0 * * 0HIGHLANDS 0 0 0 0 * * 0HILLSBOROUGH 0 0 0 0 * * 0HOLMES 11 11 300 300 5,8484105,957INDIAN RIVER 0 0 0 0 * * 0JACKSON 25 24 1,061 1,044 10,4492,00411,409JEFFERSON 9 0 242 0 5,6662725,938LAFAYETTE 0 0 0 0 * * 0LAKE 0 0 0 0 * * 0LEE 0 0 0 0 * * 0LEON 0 0 0 0 4710471LEVY 0 0 0 0 * * 0LIBERTY 0 0 0 0 * * 0MADISON 4 4 103 103 2,4773262,700MANATEE 0 0 0 0 * * 0MARION 0 0 0 0 * * 0MARTIN 0 0 0 0 * * 0MONROE 0 0 0 0 * * 0NASSAU 0 0 0 0 * * 0OKALOOSA 7 6 370 348 5,0254025,079OKEECHOBEE 0 0 0 0 * * 0ORANGE 0 0 0 0 * * 0OSCEOLA 0 0 0 0 * * 0PALM BEACH 0 0 0 0 * * 0PASCO 0 0 0 0 * * 0PINELLAS 0 0 0 0 * * 0
37

County Name Offers Received
Acceptable Offers
Offered Acres
Acceptable Acres
EnrollmentOct. 2013
before continuous
1/
Acreage Expiring Sept. 30,
2013
Enrollment as of
June 2013
Table 1 -- Offers Received, Acceptable Offers, and CRP AcreageFLORIDA
POLK 0 0 0 0 * * 0PUTNAM 0 0 0 0 * * 0ST JOHNS 0 0 0 0 * * 0ST LUCIE 0 0 0 0 * * 0SANTA ROSA 29 18 895 591 2,3889242,722SARASOTA 0 0 0 0 * * 0SEMINOLE 0 0 0 0 * * 0SUMTER 0 0 0 0 * * 0SUWANNEE 0 0 0 0 * * 0TAYLOR 0 0 0 0 * * 0UNION 0 0 0 0 * * 0VOLUSIA 0 0 0 0 * * 0WAKULLA 0 0 0 0 * * 0WALTON 8 8 350 350 4,3007114,661WASHINGTON 10 8 130 116 2,9114523,247
1 / Not including continuous signup enrollment between July and September 2013.
* Data withheld to avoid disclosure of individual operations.
38
County NameExpiring
Sept. 2013 (Acres)
New Lands (Acres) 1/
Average Rental
Payment ($/Acre)
Total Rental
Payment ($/year)
Average EBI Score
without Cost
Average EBI Score with Cost
Table 2 -- Description of Signup 45 Acceptable AcresFLORIDA
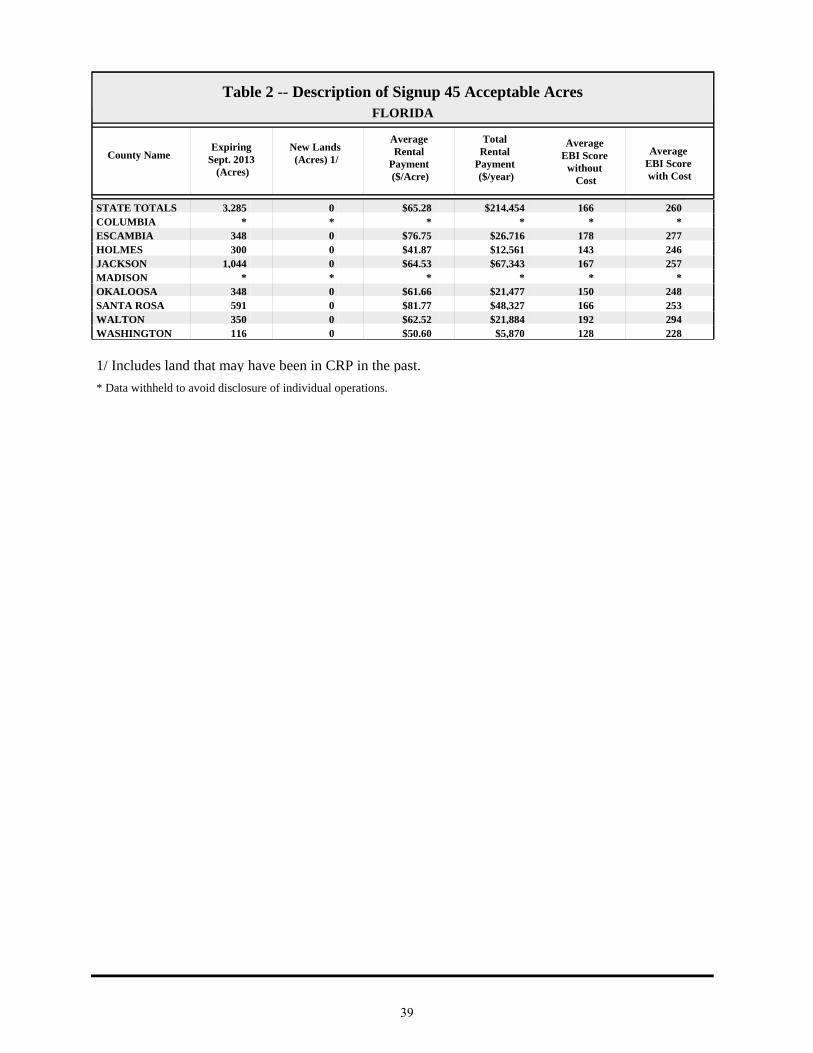
STATE TOTALS 3,285 0 $65.28 $214,454 166 260COLUMBIA * * * * * * ESCAMBIA 348 0 $76.75 $26,716 178 277HOLMES 300 0 $41.87 $12,561 143 246JACKSON 1,044 0 $64.53 $67,343 167 257MADISON * * * * * * OKALOOSA 348 0 $61.66 $21,477 150 248SANTA ROSA 591 0 $81.77 $48,327 166 253WALTON 350 0 $62.52 $21,884 192 294WASHINGTON 116 0 $50.60 $5,870 128 228
* Data withheld to avoid disclosure of individual operations.
1/ Includes land that may have been in CRP in the past.
39

County Name
EI>=8 (Acres)
National Priority
Area
State Priority
Area (Acres)
Rare and Declining Habitat (Acres)
Permanent Wildlife Habitat (Acres)
Pollinator Habitat Offers
Table 3 -- Description of Signup 45 Acceptable AcresFLORIDA
Average Erodibility Index (EI)
Pollinator Habitat (Acres)
STATE TOTALS 2,480 3,285 0 0 0 012 0COLUMBIA * * * * * * * * ESCAMBIA 258 348 0 0 0 015 0HOLMES 284 300 0 0 0 011 0JACKSON 735 1,044 0 0 0 011 0MADISON * * * * * * * * OKALOOSA 348 348 0 0 0 012 0SANTA ROSA 390 591 0 0 0 012 0WALTON 350 350 0 0 0 017 0WASHINGTON 103 116 0 0 0 09 0
* Data withheld to avoid disclosure of individual operations.Note: Acceptable acres may be listed in multiple categories.
40

County NameIntroduced
GrassNative Grass Total
GrassHardwood
TreesSoftwood
TreesTotal Trees
Table 4 -- Description of Signup 45 Acceptable Acres 1/FLORIDA
STATE TOTALS 4 82 86 9 3,189 3,197COLUMBIA * * * * * * ESCAMBIA 2 0 2 0 347 347HOLMES 0 0 0 9 291 300JACKSON 0 0 0 0 1,043 1,043MADISON * * * * * * OKALOOSA 0 82 82 0 266 266SANTA ROSA 0 0 0 0 591 591WALTON 2 0 2 0 348 348WASHINGTON 0 0 0 0 116 116
* Data withheld to avoid disclosure of individual operations.1/ Not including practices: permanent wildlife habitat, wildlife food plots, rare and declining habitat, and pollinator habitat.
41
GEORGIA
42

County Name Offers Received
Acceptable Offers
Offered Acres
Acceptable Acres
EnrollmentOct. 2013
before continuous
1/
Acreage Expiring Sept. 30,
2013
Enrollment as of
June 2013
Table 1 -- Offers Received, Acceptable Offers, and CRP AcreageGEORGIA
STATE TOTALS 318 295 11,899 11,004 305,93015,605310,531APPLING 0 0 0 0 9090909ATKINSON 0 0 0 0 1,57301,573BACON 0 0 0 0 1720172BAKER 0 0 0 0 7840784BALDWIN 0 0 0 0 * * 0BANKS 0 0 0 0 94094BARROW 0 0 0 0 505BARTOW * * * * * 65272BEN HILL 0 0 0 0 3,08223,085BERRIEN 0 0 0 0 2,38502,385BIBB 0 0 0 0 * * 0BLECKLEY 0 0 0 0 9980998BRANTLEY 0 0 0 0 1650165BROOKS 25 17 1,245 776 5,9641,3546,543BRYAN 0 0 0 0 3620362BULLOCH * * * * * 1209,065BURKE * * * * * 364,653BUTTS 0 0 0 0 99099CALHOUN * * * * * 3894,906CAMDEN 0 0 0 0 * * 0CANDLER * * * * * 5293,810CARROLL 0 0 0 0 63063CATOOSA 0 0 0 0 35035CHARLTON 0 0 0 0 * * 0CHATHAM 0 0 0 0 * * 0CHATTAHOOCHEE 0 0 0 0 15015CHATTOOGA 0 0 0 0 3020302CHEROKEE 0 0 0 0 404CLARKE 0 0 0 0 3800380CLAY 8 8 310 310 3,1591693,017CLAYTON 0 0 0 0 * * 0CLINCH 0 0 0 0 14014COBB 0 0 0 0 303COFFEE 3 3 56 56 6,0441186,106COLQUITT 5 4 105 101 5,8051935,897COLUMBIA 0 0 0 0 * * 0COOK * * * * * 421,024COWETA 0 0 0 0 41041CRAWFORD 0 0 0 0 2220222CRISP 7 3 189 70 4,9081955,033DADE 0 0 0 0 1680168DAWSON 0 0 0 0 53053DECATUR 8 8 333 333 4,7842764,727DEKALB 0 0 0 0 * * 0DODGE 0 0 0 0 8,56058,565DOOLY 5 5 503 503 14,40366914,569DOUGHERTY 0 0 0 0 8240824DOUGLAS 0 0 0 0 * * 0EARLY 13 13 334 334 10,75036610,783ECHOLS 0 0 0 0 2670267EFFINGHAM 0 0 0 0 1350135ELBERT * * * * * 94545EMANUEL 9 9 320 320 8,4729599,111EVANS 0 0 0 0 1,8241051,929FANNIN 0 0 0 0 22022
43

County Name Offers Received
Acceptable Offers
Offered Acres
Acceptable Acres
EnrollmentOct. 2013
before continuous
1/
Acreage Expiring Sept. 30,
2013
Enrollment as of
June 2013
Table 1 -- Offers Received, Acceptable Offers, and CRP AcreageGEORGIA
FAYETTE 0 0 0 0 202FLOYD * * * * * 1151,045FORSYTH 0 0 0 0 * * 0FRANKLIN * * * * * 29370FULTON 0 0 0 0 * * 0GILMER 0 0 0 0 * * 0GLASCOCK 0 0 0 0 2220222GLYNN 0 0 0 0 * * 0GORDON 0 0 0 0 8956145GRADY 21 21 863 863 7,0559317,123GREENE 0 0 0 0 79079GWINNETT 0 0 0 0 * * 0HABERSHAM 0 0 0 0 * * 0HALL 0 0 0 0 49049HANCOCK 0 0 0 0 2540254HARALSON 0 0 0 0 37037HARRIS 0 0 0 0 1900190HART * * * * * 561,194HEARD 0 0 0 0 72072HENRY 0 0 0 0 38038HOUSTON 0 0 0 0 1,00501,005IRWIN 3 3 8 8 6,075906,157JACKSON 0 0 0 0 96096JASPER * * * * * 81189JEFF DAVIS 0 0 0 0 7560756JEFFERSON 3 3 112 112 3,2021123,202JENKINS 4 4 250 250 3,8573313,937JOHNSON 0 0 0 0 2,87602,876JONES 0 0 0 0 1530153LAMAR 0 0 0 0 68068LANIER 0 0 0 0 8240824LAURENS 3 3 81 81 13,81811013,848LEE 4 4 217 217 6,4774896,749LIBERTY 0 0 0 0 81081LINCOLN * * * * * 67153LONG 0 0 0 0 * * 0LOWNDES * * * * * 2392,063LUMPKIN 0 0 0 0 * * 0MCDUFFIE 0 0 0 0 2259234MCINTOSH 0 0 0 0 * * 0MACON 3 3 167 167 6,2772106,320MADISON 0 0 0 0 8220822MARION 0 0 0 0 78151832MERIWETHER 0 0 0 0 1,15101,151MILLER 0 0 0 0 1,31501,315MITCHELL 8 8 359 359 5,5293945,564MONROE 0 0 0 0 1510151MONTGOMERY 0 0 0 0 2,6011792,780MORGAN 0 0 0 0 4960496MURRAY 0 0 0 0 1690169MUSCOGEE 0 0 0 0 * * 0NEWTON * * * * * 61146OCONEE * * * * * 82815OGLETHORPE 0 0 0 0 4040404PAULDING 0 0 0 0 101PEACH * * * * * 14493
44

County Name Offers Received
Acceptable Offers
Offered Acres
Acceptable Acres
EnrollmentOct. 2013
before continuous
1/
Acreage Expiring Sept. 30,
2013
Enrollment as of
June 2013
Table 1 -- Offers Received, Acceptable Offers, and CRP AcreageGEORGIA
PICKENS 0 0 0 0 606PIERCE 0 0 0 0 57157628PIKE 0 0 0 0 6030603POLK 0 0 0 0 66410674PULASKI * * * * * 02,274PUTNAM 0 0 0 0 022QUITMAN * * * * * 34994RABUN 0 0 0 0 * * 0RANDOLPH 17 17 583 583 7,4306097,457RICHMOND 0 0 0 0 2420242ROCKDALE 0 0 0 0 * * 0SCHLEY * * * * * 421,964SCREVEN * * * * * 358,038SEMINOLE 5 5 143 143 1,5791621,599SPALDING 0 0 0 0 9211STEPHENS 0 0 0 0 * * 0STEWART 3 3 68 68 2,699172,648SUMTER 24 24 1,590 1,590 15,3241,35415,087TALBOT 0 0 0 0 2780278TALIAFERRO 0 0 0 0 * * 0TATTNALL * * * * * 3974,526TAYLOR * * * * * 151,754TELFAIR 0 0 0 0 3,355273,381TERRELL 59 59 1,981 1,981 16,4631,90516,388THOMAS 16 10 472 276 5,7464905,960TIFT 3 * 44 * * 582,275TOOMBS * * * * * 873,137TOWNS 0 0 0 0 * * 0TREUTLEN 0 0 0 0 1,84001,840TROUP 0 0 0 0 49049TURNER 5 5 69 69 9,0971379,165TWIGGS 0 0 0 0 33012341UNION 0 0 0 0 * * 0UPSON 0 0 0 0 3800380WALKER 0 0 0 0 1990199WALTON * * * * * 521,053WARE * 0 * 0 38817405WARREN 0 0 0 0 63943681WASHINGTON * * * * * 272,788WAYNE 0 0 0 0 6048612WEBSTER 4 4 90 90 3,2131053,228WHEELER 0 0 0 0 2,02702,027WHITE 0 0 0 0 * * 0WHITFIELD 0 0 0 0 1440144WILCOX 0 0 0 0 9,1291619,290WILKES * * * * * 25468WILKINSON 0 0 0 0 4960496WORTH 13 13 258 258 8,9663229,030
1 / Not including continuous signup enrollment between July and September 2013.
* Data withheld to avoid disclosure of individual operations.
45
County NameExpiring
Sept. 2013 (Acres)
New Lands (Acres) 1/
Average Rental
Payment ($/Acre)
Total Rental
Payment ($/year)
Average EBI Score
without Cost
Average EBI Score with Cost
Table 2 -- Description of Signup 45 Acceptable AcresGEORGIA
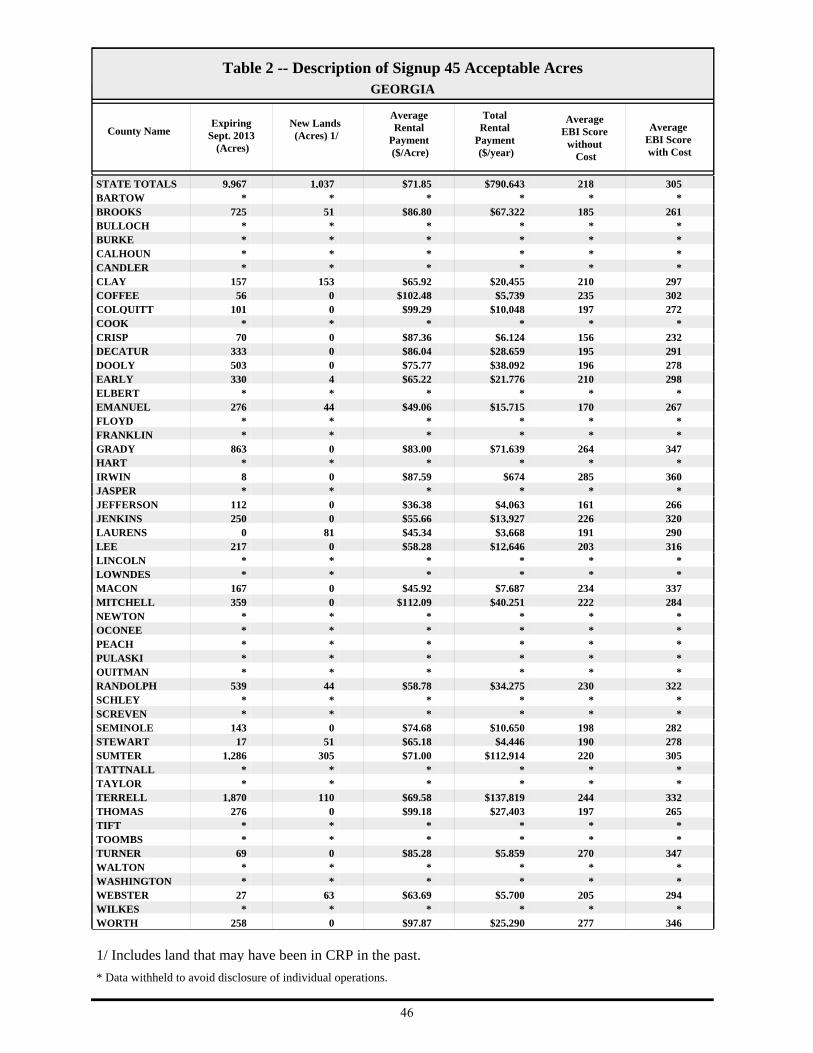
STATE TOTALS 9,967 1,037 $71.85 $790,643 218 305BARTOW * * * * * * BROOKS 725 51 $86.80 $67,322 185 261BULLOCH * * * * * * BURKE * * * * * * CALHOUN * * * * * * CANDLER * * * * * * CLAY 157 153 $65.92 $20,455 210 297COFFEE 56 0 $102.48 $5,739 235 302COLQUITT 101 0 $99.29 $10,048 197 272COOK * * * * * * CRISP 70 0 $87.36 $6,124 156 232DECATUR 333 0 $86.04 $28,659 195 291DOOLY 503 0 $75.77 $38,092 196 278EARLY 330 4 $65.22 $21,776 210 298ELBERT * * * * * * EMANUEL 276 44 $49.06 $15,715 170 267FLOYD * * * * * * FRANKLIN * * * * * * GRADY 863 0 $83.00 $71,639 264 347HART * * * * * * IRWIN 8 0 $87.59 $674 285 360JASPER * * * * * * JEFFERSON 112 0 $36.38 $4,063 161 266JENKINS 250 0 $55.66 $13,927 226 320LAURENS 0 81 $45.34 $3,668 191 290LEE 217 0 $58.28 $12,646 203 316LINCOLN * * * * * * LOWNDES * * * * * * MACON 167 0 $45.92 $7,687 234 337MITCHELL 359 0 $112.09 $40,251 222 284NEWTON * * * * * * OCONEE * * * * * * PEACH * * * * * * PULASKI * * * * * * QUITMAN * * * * * * RANDOLPH 539 44 $58.78 $34,275 230 322SCHLEY * * * * * * SCREVEN * * * * * * SEMINOLE 143 0 $74.68 $10,650 198 282STEWART 17 51 $65.18 $4,446 190 278SUMTER 1,286 305 $71.00 $112,914 220 305TATTNALL * * * * * * TAYLOR * * * * * * TERRELL 1,870 110 $69.58 $137,819 244 332THOMAS 276 0 $99.18 $27,403 197 265TIFT * * * * * * TOOMBS * * * * * * TURNER 69 0 $85.28 $5,859 270 347WALTON * * * * * * WASHINGTON * * * * * * WEBSTER 27 63 $63.69 $5,700 205 294WILKES * * * * * * WORTH 258 0 $97.87 $25,290 277 346
* Data withheld to avoid disclosure of individual operations.
1/ Includes land that may have been in CRP in the past.
46

County Name
EI>=8 (Acres)
National Priority
Area
State Priority
Area (Acres)
Rare and Declining Habitat (Acres)
Permanent Wildlife Habitat (Acres)
Pollinator Habitat Offers
Table 3 -- Description of Signup 45 Acceptable AcresGEORGIA
Average Erodibility Index (EI)
Pollinator Habitat (Acres)
STATE TOTALS 9,119 10,297 428 0 316 013 0BARTOW * * * * * * * * BROOKS 776 776 0 0 0 016 0BULLOCH * * * * * * * * BURKE * * * * * * * * CALHOUN * * * * * * * * CANDLER * * * * * * * * CLAY 124 310 0 0 0 09 0COFFEE 56 56 0 0 0 019 0COLQUITT 101 101 0 0 0 014 0COOK * * * * * * * * CRISP 70 70 0 0 0 011 0DECATUR 317 0 0 0 0 015 0DOOLY 503 503 0 0 232 014 0EARLY 58 334 0 0 0 07 0ELBERT * * * * * * * * EMANUEL 126 320 0 0 0 08 0FLOYD * * * * * * * * FRANKLIN * * * * * * * * GRADY 821 863 0 0 0 020 0HART * * * * * * * * IRWIN 8 8 0 0 0 019 0JASPER * * * * * * * * JEFFERSON 112 112 0 0 0 012 0JENKINS 250 250 0 0 0 010 0LAURENS 81 81 0 0 0 021 0LEE 108 217 0 0 0 07 0LINCOLN * * * * * * * * LOWNDES * * * * * * * * MACON 167 167 0 0 0 012 0MITCHELL 351 359 0 0 0 016 0NEWTON * * * * * * * * OCONEE * * * * * * * * PEACH * * * * * * * * PULASKI * * * * * * * * QUITMAN * * * * * * * * RANDOLPH 441 583 0 0 42 013 0SCHLEY * * * * * * * * SCREVEN * * * * * * * * SEMINOLE 116 143 0 0 0 08 0STEWART 17 68 0 0 0 06 0SUMTER 1,313 1,590 0 0 30 012 0TATTNALL * * * * * * * * TAYLOR * * * * * * * * TERRELL 1,675 1,981 0 0 0 013 0THOMAS 276 276 0 0 0 015 0TIFT * * * * * * * * TOOMBS * * * * * * * * TURNER 69 69 0 0 0 016 0WALTON * * * * * * * * WASHINGTON * * * * * * * * WEBSTER 27 90 0 0 0 06 0WILKES * * * * * * * * WORTH 258 258 0 0 0 015 0
* Data withheld to avoid disclosure of individual operations.Note: Acceptable acres may be listed in multiple categories.
47

County NameIntroduced
GrassNative Grass Total
GrassHardwood
TreesSoftwood
TreesTotal Trees
Table 4 -- Description of Signup 45 Acceptable Acres 1/GEORGIA
STATE TOTALS 16 15 31 1,194 9,406 10,600BARTOW * * * * * * BROOKS 0 0 0 95 659 754BULLOCH * * * * * * BURKE * * * * * * CALHOUN * * * * * * CANDLER * * * * * * CLAY 0 0 0 19 291 310COFFEE 0 0 0 0 56 56COLQUITT 0 0 0 0 99 99COOK * * * * * * CRISP 0 0 0 0 66 66DECATUR 0 0 0 0 324 324DOOLY 0 0 0 0 265 265EARLY 0 0 0 14 320 334ELBERT * * * * * * EMANUEL 0 0 0 320 0 320FLOYD * * * * * * FRANKLIN * * * * * * GRADY 0 0 0 31 832 863HART * * * * * * IRWIN 0 0 0 8 0 8JASPER * * * * * * JEFFERSON 0 0 0 0 112 112JENKINS 0 0 0 198 52 250LAURENS 0 0 0 0 81 81LEE 0 0 0 0 217 217LINCOLN * * * * * * LOWNDES * * * * * * MACON 0 0 0 0 167 167MITCHELL 0 0 0 8 351 359NEWTON * * * * * * OCONEE * * * * * * PEACH * * * * * * PULASKI * * * * * * QUITMAN * * * * * * RANDOLPH 0 0 0 0 541 541SCHLEY * * * * * * SCREVEN * * * * * * SEMINOLE 0 0 0 0 143 143STEWART 0 0 0 0 68 68SUMTER 15 0 15 14 1,525 1,538TATTNALL * * * * * * TAYLOR * * * * * * TERRELL 0 0 0 71 1,910 1,981THOMAS 0 0 0 0 273 273TIFT * * * * * * TOOMBS * * * * * * TURNER 0 0 0 54 15 69WALTON * * * * * * WASHINGTON * * * * * * WEBSTER 0 0 0 0 90 90WILKES * * * * * * WORTH 0 0 0 169 89 258
* Data withheld to avoid disclosure of individual operations.1/ Not including practices: permanent wildlife habitat, wildlife food plots, rare and declining habitat, and pollinator habitat.
48

HA
WA
II
49

County Name Offers Received
Acceptable Offers
Offered Acres
Acceptable Acres
EnrollmentOct. 2013
before continuous
1/
Acreage Expiring Sept. 30,
2013
Enrollment as of
June 2013
Table 1 -- Offers Received, Acceptable Offers, and CRP AcreageHAWAII
STATE TOTALS 0 0 0 0 4980498HAWAII 0 0 0 0 4770477HONOLULU 0 0 0 0 * * 0KAUAI 0 0 0 0 * * 0MAUI 0 0 0 0 21021
1 / Not including continuous signup enrollment between July and September 2013.
* Data withheld to avoid disclosure of individual operations.
50

IDAHO
51

County Name Offers Received
Acceptable Offers
Offered Acres
Acceptable Acres
EnrollmentOct. 2013
before continuous
1/
Acreage Expiring Sept. 30,
2013
Enrollment as of
June 2013
Table 1 -- Offers Received, Acceptable Offers, and CRP AcreageIDAHO
STATE TOTALS 418 394 53,118 50,187 599,09267,092615,998ADA 0 0 0 0 * * 0ADAMS 0 0 0 0 1,617111,627BANNOCK 3 3 510 510 60,03742159,948BEAR LAKE * * * * * 13915,267BENEWAH 22 22 1,716 1,716 7,5182,8338,635BINGHAM 9 9 960 960 27,7311,70428,475BLAINE 0 0 0 0 77980859BOISE 0 0 0 0 13013BONNER 0 0 0 0 3420342BONNEVILLE 56 53 15,475 14,697 60,94819,29165,543BOUNDARY 0 0 0 0 5940594BUTTE 0 0 0 0 9320932CAMAS * * * * * 2154,339CANYON 0 0 0 0 * * 0CARIBOU 10 10 1,183 1,183 42,1841,03842,040CASSIA 14 12 2,467 1,767 57,6261,32057,179CLARK * * * * * 804,875CLEARWATER 5 5 263 263 2,3134742,524CUSTER 0 0 0 0 6570657ELMORE 0 0 0 0 9863211,308FRANKLIN 30 30 2,263 2,263 33,1312,49333,361FREMONT 34 33 5,288 5,256 25,0716,93026,745GEM 0 0 0 0 84084GOODING 0 0 0 0 73073IDAHO 9 8 1,101 1,035 8,2172,2189,401JEFFERSON 5 4 1,270 1,249 4,6594803,890JEROME 0 0 0 0 5920592KOOTENAI 34 34 3,067 3,067 8,5623,2568,751LATAH 91 91 5,227 5,227 28,62912,44335,845LEMHI 0 0 0 0 * * 0LEWIS 11 9 1,084 1,055 5,3512,6506,946LINCOLN 0 0 0 0 4940494MADISON 17 16 1,052 990 17,8152,09318,917MINIDOKA 0 0 0 0 4,59104,591NEZ PERCE 17 16 980 976 7,9022,3269,252ONEIDA 12 12 1,478 1,478 48,2791446,816OWYHEE 0 0 0 0 * * 0PAYETTE * 0 * 0 1240124POWER 16 14 4,564 4,155 95,0981,97092,912SHOSHONE 0 0 0 0 * * 0TETON 12 5 1,875 1,314 13,4851,62213,793TWIN FALLS * * * * * 262,409VALLEY 0 0 0 0 34034WASHINGTON 5 4 625 499 5,6656455,811
1 / Not including continuous signup enrollment between July and September 2013.
* Data withheld to avoid disclosure of individual operations.
52
County NameExpiring
Sept. 2013 (Acres)
New Lands (Acres) 1/
Average Rental
Payment ($/Acre)
Total Rental
Payment ($/year)
Average EBI Score
without Cost
Average EBI Score with Cost
Table 2 -- Description of Signup 45 Acceptable AcresIDAHO
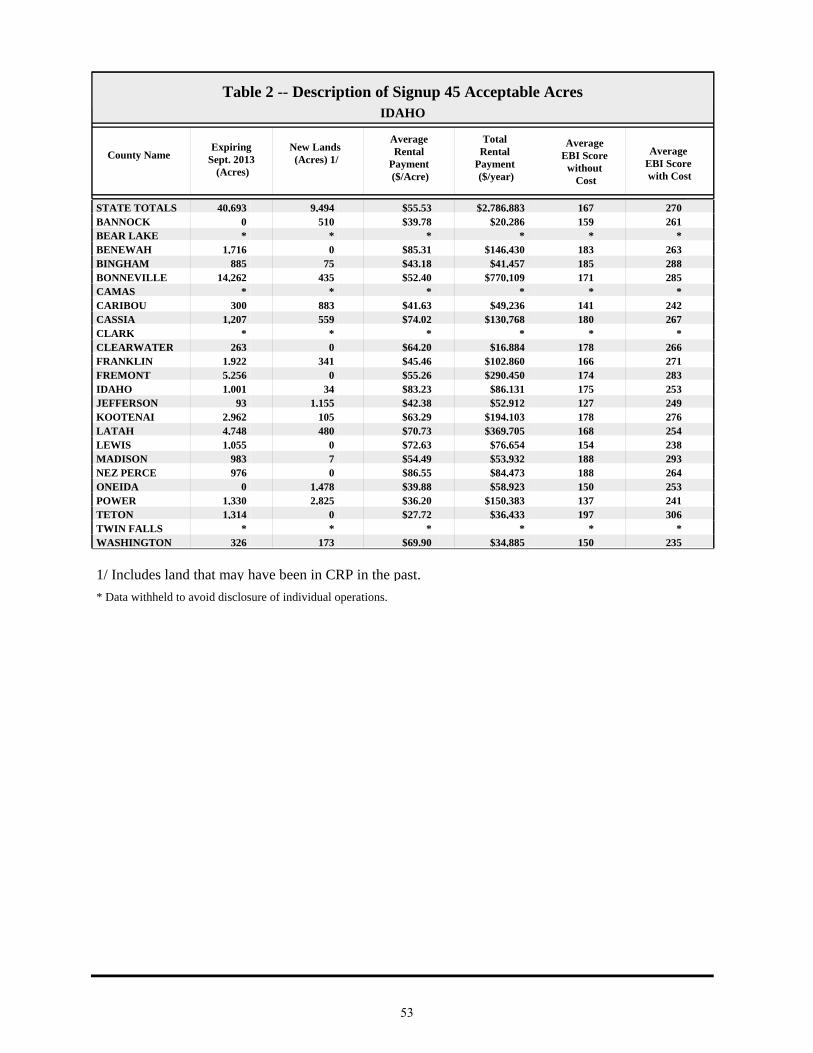
STATE TOTALS 40,693 9,494 $55.53 $2,786,883 167 270BANNOCK 0 510 $39.78 $20,286 159 261BEAR LAKE * * * * * * BENEWAH 1,716 0 $85.31 $146,430 183 263BINGHAM 885 75 $43.18 $41,457 185 288BONNEVILLE 14,262 435 $52.40 $770,109 171 285CAMAS * * * * * * CARIBOU 300 883 $41.63 $49,236 141 242CASSIA 1,207 559 $74.02 $130,768 180 267CLARK * * * * * * CLEARWATER 263 0 $64.20 $16,884 178 266FRANKLIN 1,922 341 $45.46 $102,860 166 271FREMONT 5,256 0 $55.26 $290,450 174 283IDAHO 1,001 34 $83.23 $86,131 175 253JEFFERSON 93 1,155 $42.38 $52,912 127 249KOOTENAI 2,962 105 $63.29 $194,103 178 276LATAH 4,748 480 $70.73 $369,705 168 254LEWIS 1,055 0 $72.63 $76,654 154 238MADISON 983 7 $54.49 $53,932 188 293NEZ PERCE 976 0 $86.55 $84,473 188 264ONEIDA 0 1,478 $39.88 $58,923 150 253POWER 1,330 2,825 $36.20 $150,383 137 241TETON 1,314 0 $27.72 $36,433 197 306TWIN FALLS * * * * * * WASHINGTON 326 173 $69.90 $34,885 150 235
* Data withheld to avoid disclosure of individual operations.
1/ Includes land that may have been in CRP in the past.
53
County Name
EI>=8 (Acres)
National Priority
Area
State Priority
Area (Acres)
Rare and Declining Habitat (Acres)
Permanent Wildlife Habitat (Acres)
Pollinator Habitat Offers
Table 3 -- Description of Signup 45 Acceptable AcresIDAHO
Average Erodibility Index (EI)
Pollinator Habitat (Acres)
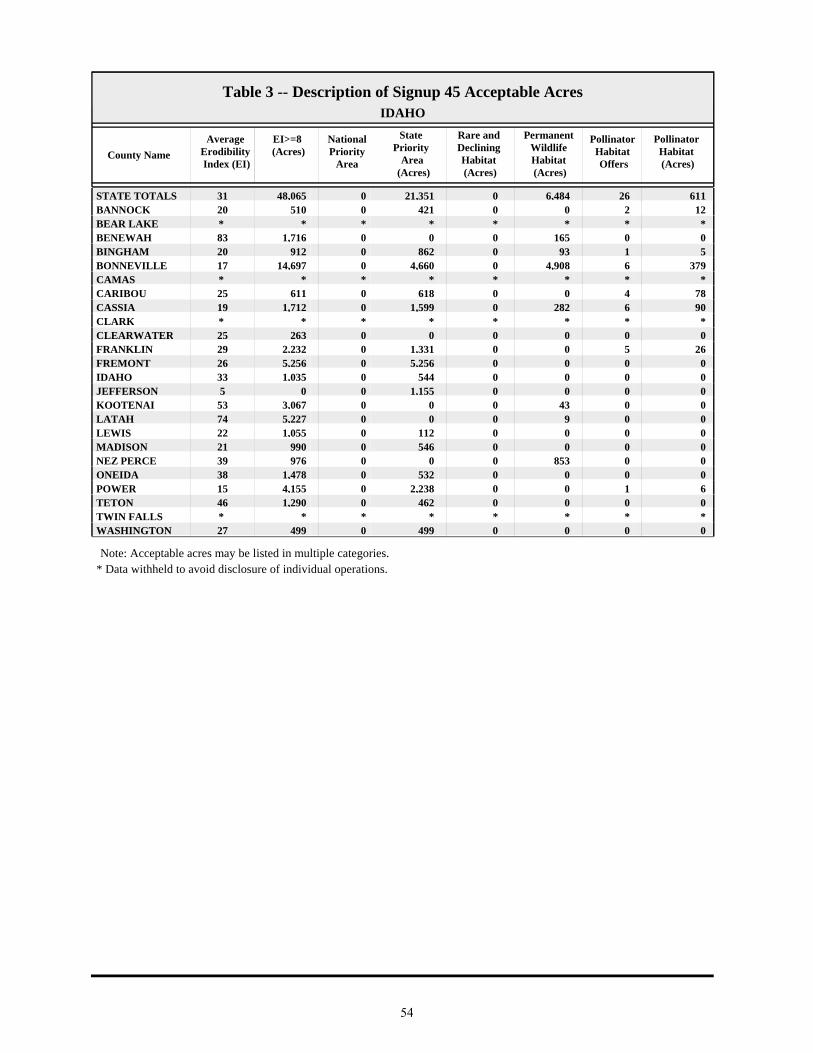
STATE TOTALS 48,065 0 21,351 0 6,484 2631 611BANNOCK 510 0 421 0 0 220 12BEAR LAKE * * * * * * * * BENEWAH 1,716 0 0 0 165 083 0BINGHAM 912 0 862 0 93 120 5BONNEVILLE 14,697 0 4,660 0 4,908 617 379CAMAS * * * * * * * * CARIBOU 611 0 618 0 0 425 78CASSIA 1,712 0 1,599 0 282 619 90CLARK * * * * * * * * CLEARWATER 263 0 0 0 0 025 0FRANKLIN 2,232 0 1,331 0 0 529 26FREMONT 5,256 0 5,256 0 0 026 0IDAHO 1,035 0 544 0 0 033 0JEFFERSON 0 0 1,155 0 0 05 0KOOTENAI 3,067 0 0 0 43 053 0LATAH 5,227 0 0 0 9 074 0LEWIS 1,055 0 112 0 0 022 0MADISON 990 0 546 0 0 021 0NEZ PERCE 976 0 0 0 853 039 0ONEIDA 1,478 0 532 0 0 038 0POWER 4,155 0 2,238 0 0 115 6TETON 1,290 0 462 0 0 046 0TWIN FALLS * * * * * * * * WASHINGTON 499 0 499 0 0 027 0
* Data withheld to avoid disclosure of individual operations.Note: Acceptable acres may be listed in multiple categories.
54

County NameIntroduced
GrassNative Grass Total
GrassHardwood
TreesSoftwood
TreesTotal Trees
Table 4 -- Description of Signup 45 Acceptable Acres 1/IDAHO
STATE TOTALS 37,453 3,662 41,116 0 1,972 1,972BANNOCK 498 0 498 0 0 0BEAR LAKE * * * * * * BENEWAH 1,319 117 1,435 0 116 116BINGHAM 862 0 862 0 0 0BONNEVILLE 8,323 1,081 9,404 0 0 0CAMAS * * * * * * CARIBOU 1,105 0 1,105 0 0 0CASSIA 1,250 145 1,395 0 0 0CLARK * * * * * * CLEARWATER 71 0 71 0 192 192FRANKLIN 2,237 0 2,237 0 0 0FREMONT 4,112 1,145 5,256 0 0 0IDAHO 437 0 437 0 598 598JEFFERSON 1,249 0 1,249 0 0 0KOOTENAI 1,804 868 2,672 0 352 352LATAH 4,514 0 4,514 0 704 704LEWIS 838 217 1,055 0 0 0MADISON 990 0 990 0 0 0NEZ PERCE 23 90 113 0 10 10ONEIDA 1,478 0 1,478 0 0 0POWER 4,149 0 4,149 0 0 0TETON 1,314 0 1,314 0 0 0TWIN FALLS * * * * * * WASHINGTON 499 0 499 0 0 0
* Data withheld to avoid disclosure of individual operations.1/ Not including practices: permanent wildlife habitat, wildlife food plots, rare and declining habitat, and pollinator habitat.
55

ILLINOIS
56

County Name Offers Received
Acceptable Offers
Offered Acres
Acceptable Acres
EnrollmentOct. 2013
before continuous
1/
Acreage Expiring Sept. 30,
2013
Enrollment as of
June 2013
Table 1 -- Offers Received, Acceptable Offers, and CRP AcreageILLINOIS
STATE TOTALS 3,922 3,299 86,838 73,296 881,328186,252994,285ADAMS 119 113 2,925 2,727 16,8964,31218,481ALEXANDER 3 3 80 80 1,8701841,975BOND 31 25 481 341 7,2752,0068,940BOONE * 0 * 0 76966835BROWN 102 99 1,930 1,844 12,4613,05013,668BUREAU 54 49 1,314 1,226 11,7662,13112,671CALHOUN 83 81 1,729 1,710 9,0673,03710,394CARROLL 59 53 1,273 1,045 8,4032,2019,559CASS 81 60 1,561 1,210 11,7054,07014,565CHAMPAIGN * 0 * 0 8,9877609,747CHRISTIAN 3 3 79 79 8,7637279,411CLARK 34 21 374 230 7,4818018,052CLAY 46 31 895 527 14,0023,31016,785CLINTON 15 9 163 99 5,6841,0856,670COLES 21 11 325 224 6,7837187,277COOK 0 0 0 0 * * 0CRAWFORD 24 6 431 57 12,10790112,951CUMBERLAND 41 33 453 371 11,29077411,693DEKALB * * * * * 5474,975DEWITT 6 6 104 104 4,6632444,803DOUGLAS 8 * 97 * * 5024,373DU PAGE 0 0 0 0 * * 0EDGAR 18 7 643 230 4,6641,0785,512EDWARDS 61 57 1,386 1,284 6,8222,5518,089EFFINGHAM 50 28 586 302 12,7661,25213,716FAYETTE 39 35 1,075 988 13,3232,22714,562FORD * * * * * 2786,728FRANKLIN 67 59 2,050 1,667 11,3435,26714,943FULTON 53 50 1,036 903 10,3262,25411,676GALLATIN 7 6 234 199 2,7414983,040GREENE 47 44 1,144 1,009 13,5251,51614,032GRUNDY 3 3 13 13 2,324822,393HAMILTON 148 147 5,051 5,031 26,8376,79628,602HANCOCK 85 74 1,734 1,523 16,9513,69319,121HARDIN 6 6 115 115 2,3041,4943,683HENDERSON 15 10 307 219 3,6835774,041HENRY 78 68 1,932 1,743 15,2844,24917,790IROQUOIS 3 3 53 53 15,2792,89318,119JACKSON 60 50 1,524 1,296 8,7702,0699,543JASPER 51 46 618 533 12,5141,67913,660JEFFERSON 143 135 3,365 3,202 18,9175,57321,289JERSEY 39 37 915 888 5,3121,0505,475JO DAVIESS 86 61 2,290 1,714 14,5804,07816,944JOHNSON 12 12 314 314 15,60292716,215KANE 0 0 0 0 7685161KANKAKEE 6 6 59 59 2,5562472,744KENDALL * * * * * 39480KNOX 46 29 638 430 10,7043,08213,356LAKE 0 0 0 0 8844132LA SALLE 8 5 133 101 7,5758368,310LAWRENCE 17 6 502 107 4,1996694,761LEE 14 11 154 135 4,9034635,231LIVINGSTON 9 7 55 48 11,8641,22813,045LOGAN 9 7 221 133 11,4291,01212,309MCDONOUGH 12 8 210 152 6,2429817,072
57

County Name Offers Received
Acceptable Offers
Offered Acres
Acceptable Acres
EnrollmentOct. 2013
before continuous
1/
Acreage Expiring Sept. 30,
2013
Enrollment as of
June 2013
Table 1 -- Offers Received, Acceptable Offers, and CRP AcreageILLINOIS
MCHENRY 4 3 213 150 1,3175021,670MCLEAN 25 21 310 277 9,8791,51911,121MACON 17 6 354 69 3,4143093,655MACOUPIN 22 19 351 251 13,94393114,623MADISON 15 10 182 108 3,0615413,495MARION 120 87 2,680 2,012 23,0327,49028,510MARSHALL 14 13 255 217 3,1935833,560MASON 90 82 1,466 1,373 15,0363,01716,679MASSAC 16 14 398 388 7,5182,0389,168MENARD 50 47 703 674 7,6681,2378,231MERCER 61 54 1,583 1,340 13,0403,13714,837MONROE 21 20 493 477 2,9321,0763,531MONTGOMERY 35 19 678 272 11,8071,71513,250MORGAN 73 60 931 720 8,5821,5299,392MOULTRIE 9 7 81 64 2,3004322,668OGLE 50 40 1,007 873 8,4412,1429,711PEORIA 32 24 496 307 4,6698535,215PERRY 43 33 1,421 1,272 6,0442,4777,249PIATT 7 * 109 * * 2263,338PIKE 142 128 5,054 4,209 26,5247,27829,593POPE 15 13 816 756 9,9222,40511,572PULASKI 25 22 1,004 800 6,2442,1857,630PUTNAM 3 3 82 82 3,8372033,958RANDOLPH 104 96 1,321 1,248 8,1122,3199,183RICHLAND 41 29 627 441 6,5901,5427,691ROCK ISLAND 18 16 225 218 6,1907006,672ST CLAIR 19 18 260 259 2,6436673,051SALINE 60 52 1,790 1,433 7,3742,8948,835SANGAMON 23 19 255 197 14,29165114,745SCHUYLER 47 46 1,162 1,126 13,7532,43315,060SCOTT 17 17 169 169 6,1354776,443SHELBY 88 81 1,364 1,291 12,9782,02113,708STARK 18 18 451 451 3,7717264,046STEPHENSON 37 33 878 851 11,0561,86012,066TAZEWELL 30 23 264 247 10,4941,36711,613UNION 30 26 764 687 14,9262,12316,363VERMILION 8 * 131 * * 4817,518WABASH 8 5 129 102 2,7964573,151WARREN 5 4 55 45 2,2689673,190WASHINGTON 48 37 716 507 5,0011,8186,312WAYNE 259 211 6,956 5,633 33,50514,95142,823WHITE 91 76 2,443 1,979 12,3064,19614,523WHITESIDE 54 48 1,118 1,097 14,1631,90914,975WILL 3 3 76 76 64385652WILLIAMSON 31 29 1,068 1,044 7,1422,6408,738WINNEBAGO 21 18 547 512 8,2441,2729,005WOODFORD 43 42 625 616 5,6081,6716,663
1 / Not including continuous signup enrollment between July and September 2013.
* Data withheld to avoid disclosure of individual operations.
58

County NameExpiring
Sept. 2013 (Acres)
New Lands (Acres) 1/
Average Rental
Payment ($/Acre)
Total Rental
Payment ($/year)
Average EBI Score
without Cost
Average EBI Score with Cost
Table 2 -- Description of Signup 45 Acceptable AcresILLINOIS
STATE TOTALS 67,018 6,278 $158.40 $11,610,150 209 255ADAMS 2,148 579 $174.64 $476,227 227 257ALEXANDER 54 26 $148.08 $11,831 187 227BOND 261 80 $149.52 $50,973 189 251BROWN 1,431 413 $209.51 $386,252 264 287BUREAU 1,015 211 $225.31 $276,339 253 257CALHOUN 1,640 70 $184.87 $316,105 226 250CARROLL 1,036 9 $220.76 $230,691 246 257CASS 1,016 194 $196.05 $237,245 211 246CHRISTIAN 79 0 $204.00 $16,136 233 267CLARK 230 0 $146.16 $33,676 197 264CLAY 499 28 $118.47 $62,386 181 249CLINTON 69 30 $117.99 $11,658 184 258COLES 223 1 $198.40 $44,481 227 260CRAWFORD 31 26 $146.53 $8,323 209 250CUMBERLAND 368 3 $180.62 $67,029 204 244DEKALB * * * * * * DEWITT 72 32 $216.16 $22,416 215 237DOUGLAS * * * * * * EDGAR 228 1 $201.06 $46,184 181 216EDWARDS 1,285 0 $102.48 $131,630 173 250EFFINGHAM 290 12 $157.65 $47,625 214 262FAYETTE 731 257 $155.82 $153,921 230 268FORD * * * * * * FRANKLIN 1,650 18 $87.79 $146,368 179 263FULTON 800 103 $208.76 $188,617 260 286GALLATIN 199 0 $122.24 $24,363 164 223GREENE 950 60 $227.84 $229,940 228 237GRUNDY 13 0 $214.47 $2,767 261 275HAMILTON 4,685 347 $103.94 $522,932 200 271HANCOCK 1,356 168 $175.41 $267,223 229 264HARDIN 115 0 $107.03 $12,265 183 247HENDERSON 201 18 $177.23 $38,796 218 242HENRY 1,575 169 $215.64 $375,977 250 254IROQUOIS 53 0 $108.94 $5,785 207 293JACKSON 1,275 20 $118.08 $152,986 186 244JASPER 489 44 $145.71 $77,692 210 258JEFFERSON 2,828 375 $111.92 $358,397 179 248JERSEY 680 209 $218.68 $194,279 240 248JO DAVIESS 1,566 148 $203.57 $348,946 208 233JOHNSON 237 77 $86.02 $26,984 191 269KANKAKEE 51 8 $149.54 $8,793 216 263KENDALL * * * * * * KNOX 356 74 $216.20 $92,900 222 235LA SALLE 101 0 $170.24 $17,178 212 259LAWRENCE 107 0 $161.47 $17,293 185 239LEE 132 3 $189.70 $25,552 225 263LIVINGSTON 17 31 $159.67 $7,600 213 266LOGAN 133 0 $204.60 $27,110 221 253MCDONOUGH 152 0 $200.94 $30,462 240 267MCHENRY 150 0 $155.69 $23,322 189 250MCLEAN 277 0 $210.00 $58,108 254 282MACON 69 0 $214.55 $14,783 207 231MACOUPIN 212 39 $178.72 $44,822 251 285MADISON 71 38 $140.78 $15,247 219 278
59

County NameExpiring
Sept. 2013 (Acres)
New Lands (Acres) 1/
Average Rental
Payment ($/Acre)
Total Rental
Payment ($/year)
Average EBI Score
without Cost
Average EBI Score with Cost
Table 2 -- Description of Signup 45 Acceptable AcresILLINOIS
MARION 1,966 46 $139.29 $280,287 185 245MARSHALL 164 53 $200.73 $43,537 231 262MASON 1,357 17 $206.46 $283,553 200 230MASSAC 350 39 $116.60 $45,297 179 246MENARD 637 37 $184.78 $124,520 236 266MERCER 1,299 42 $198.26 $265,765 222 245MONROE 466 11 $160.02 $76,295 214 248MONTGOMERY 258 14 $213.14 $57,975 210 234MORGAN 683 37 $183.27 $131,916 243 279MOULTRIE 64 0 $218.29 $13,905 234 245OGLE 824 49 $216.79 $189,275 231 250PEORIA 228 79 $210.10 $64,480 218 234PERRY 1,256 16 $109.63 $139,442 193 258PIATT * * * * * * PIKE 3,688 521 $185.32 $779,971 227 258POPE 756 0 $100.27 $75,765 175 251PULASKI 759 41 $134.18 $107,303 179 229PUTNAM 82 0 $231.71 $18,954 282 284RANDOLPH 1,201 48 $125.53 $156,702 194 247RICHLAND 428 13 $144.84 $63,918 178 233ROCK ISLAND 199 18 $207.90 $45,219 216 241ST CLAIR 222 37 $143.08 $37,058 246 300SALINE 1,360 72 $95.98 $137,495 195 265SANGAMON 195 2 $216.68 $42,622 253 274SCHUYLER 1,047 78 $201.68 $227,010 251 275SCOTT 135 34 $194.92 $32,961 230 251SHELBY 1,211 80 $203.00 $262,048 247 272STARK 400 52 $222.38 $100,337 231 234STEPHENSON 831 21 $204.72 $174,257 232 256TAZEWELL 235 13 $212.88 $52,603 250 272UNION 541 146 $103.25 $70,899 191 258VERMILION * * * * * * WABASH 102 0 $108.75 $11,071 171 256WARREN 45 0 $231.27 $10,430 215 221WASHINGTON 480 27 $121.57 $61,626 188 244WAYNE 5,477 156 $104.19 $586,869 154 237WHITE 1,749 230 $131.40 $260,012 176 234WHITESIDE 1,001 96 $228.44 $250,573 266 270WILL 66 10 $150.63 $11,448 194 258WILLIAMSON 890 154 $83.70 $87,426 184 269WINNEBAGO 455 57 $168.37 $86,172 227 268WOODFORD 600 17 $216.18 $133,275 273 289
* Data withheld to avoid disclosure of individual operations.
1/ Includes land that may have been in CRP in the past.
60

County Name
EI>=8 (Acres)
National Priority
Area
State Priority
Area (Acres)
Rare and Declining Habitat (Acres)
Permanent Wildlife Habitat (Acres)
Pollinator Habitat Offers
Table 3 -- Description of Signup 45 Acceptable AcresILLINOIS
Average Erodibility Index (EI)
Pollinator Habitat (Acres)
STATE TOTALS 67,552 0 30,024 33 9,092 16422 476ADAMS 2,711 0 2,157 0 570 318 5ALEXANDER 80 0 0 0 0 138 1BOND 341 0 22 0 38 017 0BROWN 1,799 0 1,844 0 13 121 1BUREAU 1,139 0 1,227 0 27 116 1CALHOUN 1,710 0 582 0 146 032 0CARROLL 1,045 0 501 0 217 036 0CASS 448 0 1,210 0 793 011 0CHRISTIAN 79 0 79 0 39 016 0CLARK 141 0 211 0 1 010 0CLAY 527 0 140 0 74 020 0CLINTON 41 0 99 0 51 111 2COLES 224 0 224 0 41 112 1CRAWFORD 48 0 54 0 0 011 0CUMBERLAND 298 0 274 0 2 313 9DEKALB * * * * * * * * DEWITT 104 0 0 0 0 123 1DOUGLAS * * * * * * * * EDGAR 29 0 201 0 0 08 0EDWARDS 1,285 0 0 0 1 118 1EFFINGHAM 270 0 154 0 177 114 2FAYETTE 982 0 955 26 545 714 26FORD * * * * * * * * FRANKLIN 1,639 0 103 0 44 222 8FULTON 904 0 883 0 130 021 0GALLATIN 199 0 0 0 0 016 0GREENE 1,002 0 146 0 258 021 0GRUNDY 9 0 13 0 5 215 2HAMILTON 5,024 0 0 0 0 927 24HANCOCK 1,462 0 848 0 256 127 2HARDIN 96 0 98 0 1 027 0HENDERSON 219 0 0 0 0 031 0HENRY 1,629 0 1,515 0 65 122 7IROQUOIS 11 0 43 0 0 16 4JACKSON 1,296 0 0 0 39 022 0JASPER 467 0 523 0 296 012 0JEFFERSON 3,120 0 1,486 0 7 021 0JERSEY 839 0 280 0 16 024 0JO DAVIESS 1,714 0 105 0 373 040 0JOHNSON 314 0 0 0 0 032 0KANKAKEE 40 0 55 0 8 012 0KENDALL * * * * * * * * KNOX 430 0 25 0 71 024 0LA SALLE 94 0 101 0 61 218 3LAWRENCE 107 0 0 0 56 018 0LEE 89 0 126 0 31 39 4LIVINGSTON 25 0 48 0 12 113 1LOGAN 113 0 133 0 12 018 0MCDONOUGH 152 0 0 0 7 221 3MCHENRY 111 0 39 0 0 07 0MCLEAN 277 0 277 0 1 020 0MACON 69 0 0 0 0 016 0MACOUPIN 237 0 93 0 0 118 2MADISON 108 0 3 0 0 025 0MARION 1,437 0 1,769 0 353 010 0
61
County Name
EI>=8 (Acres)
National Priority
Area
State Priority
Area (Acres)
Rare and Declining Habitat (Acres)
Permanent Wildlife Habitat (Acres)
Pollinator Habitat Offers
Table 3 -- Description of Signup 45 Acceptable AcresILLINOIS
Average Erodibility Index (EI)
Pollinator Habitat (Acres)
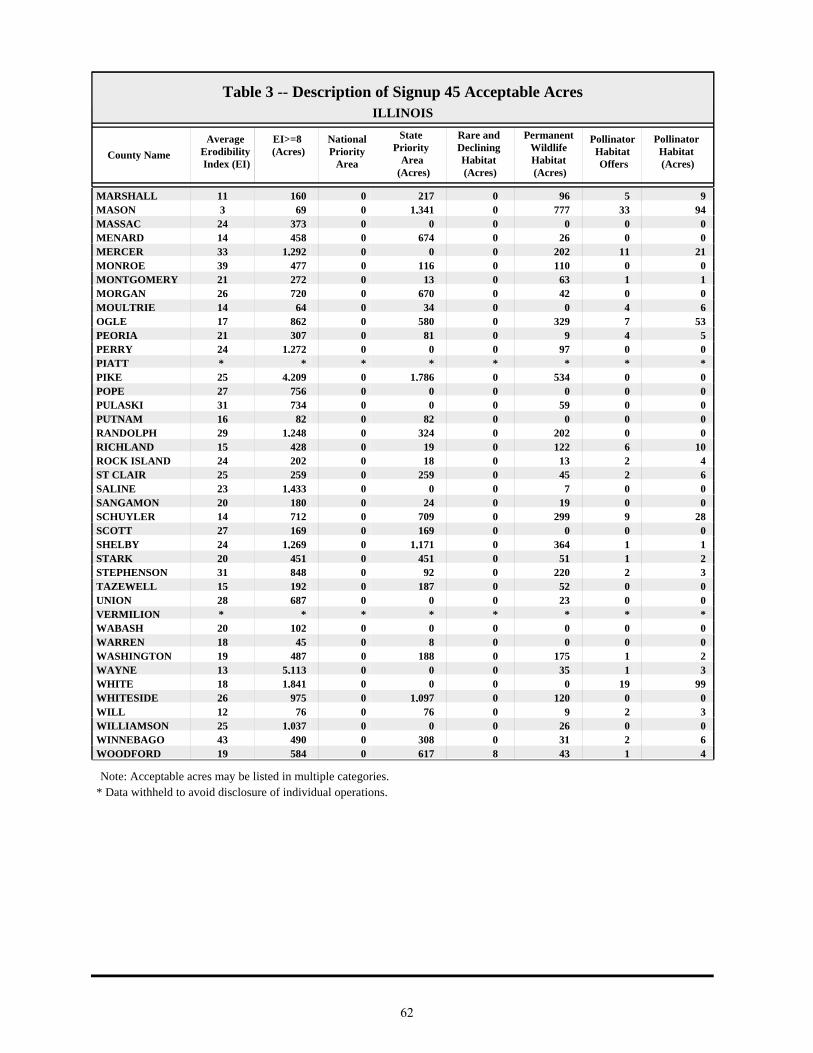
MARSHALL 160 0 217 0 96 511 9MASON 69 0 1,341 0 777 333 94MASSAC 373 0 0 0 0 024 0MENARD 458 0 674 0 26 014 0MERCER 1,292 0 0 0 202 1133 21MONROE 477 0 116 0 110 039 0MONTGOMERY 272 0 13 0 63 121 1MORGAN 720 0 670 0 42 026 0MOULTRIE 64 0 34 0 0 414 6OGLE 862 0 580 0 329 717 53PEORIA 307 0 81 0 9 421 5PERRY 1,272 0 0 0 97 024 0PIATT * * * * * * * * PIKE 4,209 0 1,786 0 534 025 0POPE 756 0 0 0 0 027 0PULASKI 734 0 0 0 59 031 0PUTNAM 82 0 82 0 0 016 0RANDOLPH 1,248 0 324 0 202 029 0RICHLAND 428 0 19 0 122 615 10ROCK ISLAND 202 0 18 0 13 224 4ST CLAIR 259 0 259 0 45 225 6SALINE 1,433 0 0 0 7 023 0SANGAMON 180 0 24 0 19 020 0SCHUYLER 712 0 709 0 299 914 28SCOTT 169 0 169 0 0 027 0SHELBY 1,269 0 1,171 0 364 124 1STARK 451 0 451 0 51 120 2STEPHENSON 848 0 92 0 220 231 3TAZEWELL 192 0 187 0 52 015 0UNION 687 0 0 0 23 028 0VERMILION * * * * * * * * WABASH 102 0 0 0 0 020 0WARREN 45 0 8 0 0 018 0WASHINGTON 487 0 188 0 175 119 2WAYNE 5,113 0 0 0 35 113 3WHITE 1,841 0 0 0 0 1918 99WHITESIDE 975 0 1,097 0 120 026 0WILL 76 0 76 0 9 212 3WILLIAMSON 1,037 0 0 0 26 025 0WINNEBAGO 490 0 308 0 31 243 6WOODFORD 584 0 617 8 43 119 4
* Data withheld to avoid disclosure of individual operations.Note: Acceptable acres may be listed in multiple categories.
62

County NameIntroduced
GrassNative Grass Total
GrassHardwood
TreesSoftwood
TreesTotal Trees
Table 4 -- Description of Signup 45 Acceptable Acres 1/ILLINOIS
STATE TOTALS 46,157 9,480 55,638 6,981 186 7,167ADAMS 1,913 27 1,940 188 0 188ALEXANDER 54 22 76 0 0 0BOND 243 45 288 6 0 6BROWN 1,681 58 1,739 41 0 41BUREAU 965 159 1,124 61 0 61CALHOUN 1,350 98 1,447 34 0 34CARROLL 518 220 738 57 5 62CASS 251 11 262 115 0 115CHRISTIAN 37 3 40 0 0 0CLARK 75 110 185 43 0 43CLAY 349 38 388 64 0 64CLINTON 41 0 41 0 0 0COLES 89 1 90 86 0 86CRAWFORD 3 43 46 9 0 9CUMBERLAND 135 198 332 27 0 27DEKALB * * * * * * DEWITT 27 56 83 16 0 16DOUGLAS * * * * * * EDGAR 16 196 212 17 0 17EDWARDS 1,144 84 1,228 46 0 46EFFINGHAM 16 2 19 92 0 92FAYETTE 204 89 293 70 0 70FORD * * * * * * FRANKLIN 1,539 45 1,585 31 0 31FULTON 589 162 751 8 0 8GALLATIN 198 0 198 0 0 0GREENE 589 92 681 56 0 56GRUNDY 0 0 0 6 0 6HAMILTON 3,578 420 3,998 966 0 966HANCOCK 1,002 15 1,016 218 0 218HARDIN 105 0 105 7 0 7HENDERSON 208 11 219 0 0 0HENRY 1,441 158 1,599 73 0 73IROQUOIS 0 6 6 5 38 43JACKSON 1,020 177 1,196 29 0 29JASPER 139 11 150 82 0 82JEFFERSON 2,726 293 3,018 133 0 133JERSEY 732 76 808 37 0 38JO DAVIESS 971 218 1,189 114 16 130JOHNSON 191 92 283 24 0 24KANKAKEE 7 33 40 11 0 11KENDALL * * * * * * KNOX 194 72 266 79 12 92LA SALLE 19 10 29 8 0 8LAWRENCE 40 0 40 7 0 7LEE 3 69 71 11 15 26LIVINGSTON 0 22 22 10 0 10LOGAN 11 82 92 29 0 29MCDONOUGH 60 10 70 71 0 71MCHENRY 0 39 39 111 0 111MCLEAN 167 38 205 63 0 63MACON 31 16 47 22 0 22MACOUPIN 145 42 188 60 0 60MADISON 57 24 81 24 0 24MARION 807 408 1,215 426 0 426
63

County NameIntroduced
GrassNative Grass Total
GrassHardwood
TreesSoftwood
TreesTotal Trees
Table 4 -- Description of Signup 45 Acceptable Acres 1/ILLINOIS
MARSHALL 110 0 110 0 0 0MASON 70 339 409 61 5 66MASSAC 267 0 267 117 0 117MENARD 348 211 559 89 0 89MERCER 717 298 1,015 86 6 93MONROE 349 13 362 1 0 1MONTGOMERY 47 112 159 43 0 43MORGAN 558 63 621 46 0 46MOULTRIE 35 12 48 0 9 9OGLE 136 160 296 168 13 180PEORIA 205 65 270 17 0 17PERRY 680 468 1,148 15 2 17PIATT * * * * * * PIKE 3,186 313 3,500 153 0 153POPE 697 0 697 48 0 48PULASKI 519 39 558 182 0 182PUTNAM 37 5 42 40 0 40RANDOLPH 859 107 966 79 0 79RICHLAND 278 0 278 27 0 27ROCK ISLAND 136 55 191 8 0 8ST CLAIR 154 23 177 29 0 29SALINE 1,167 103 1,270 144 0 144SANGAMON 109 41 150 26 0 26SCHUYLER 351 17 368 424 0 424SCOTT 126 29 155 13 0 13SHELBY 628 236 864 56 3 59STARK 349 27 376 17 0 17STEPHENSON 31 499 530 60 17 77TAZEWELL 62 72 134 61 0 61UNION 446 0 446 217 0 217VERMILION * * * * * * WABASH 94 0 94 6 0 6WARREN 40 0 40 5 0 5WASHINGTON 271 26 297 17 0 17WAYNE 4,176 680 4,856 718 0 718WHITE 1,555 120 1,675 199 0 199WHITESIDE 290 623 913 51 0 51WILL 0 16 16 0 46 46WILLIAMSON 967 20 987 31 0 31WINNEBAGO 250 217 467 0 0 0WOODFORD 181 329 510 30 0 30
* Data withheld to avoid disclosure of individual operations.1/ Not including practices: permanent wildlife habitat, wildlife food plots, rare and declining habitat, and pollinator habitat.
64

INDIANA
65
County Name Offers Received
Acceptable Offers
Offered Acres
Acceptable Acres
EnrollmentOct. 2013
before continuous
1/
Acreage Expiring Sept. 30,
2013
Enrollment as of
June 2013
Table 1 -- Offers Received, Acceptable Offers, and CRP AcreageINDIANA
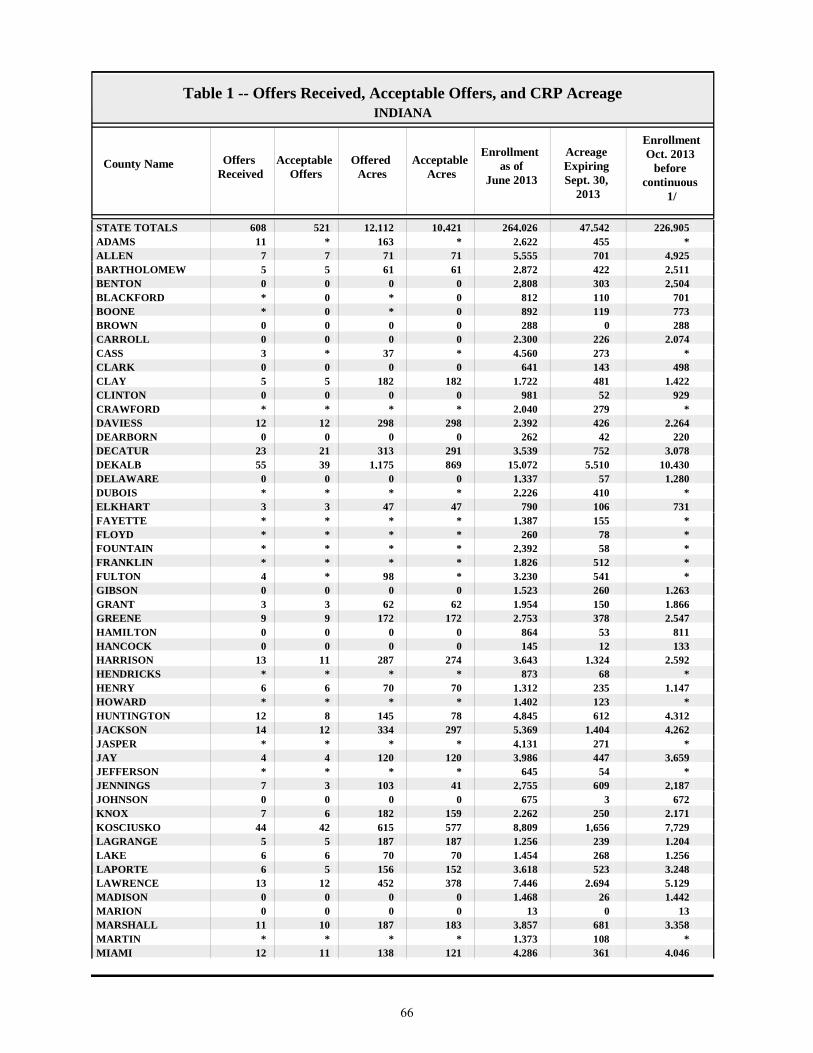
STATE TOTALS 608 521 12,112 10,421 226,90547,542264,026ADAMS 11 * 163 * * 4552,622ALLEN 7 7 71 71 4,9257015,555BARTHOLOMEW 5 5 61 61 2,5114222,872BENTON 0 0 0 0 2,5043032,808BLACKFORD * 0 * 0 701110812BOONE * 0 * 0 773119892BROWN 0 0 0 0 2880288CARROLL 0 0 0 0 2,0742262,300CASS 3 * 37 * * 2734,560CLARK 0 0 0 0 498143641CLAY 5 5 182 182 1,4224811,722CLINTON 0 0 0 0 92952981CRAWFORD * * * * * 2792,040DAVIESS 12 12 298 298 2,2644262,392DEARBORN 0 0 0 0 22042262DECATUR 23 21 313 291 3,0787523,539DEKALB 55 39 1,175 869 10,4305,51015,072DELAWARE 0 0 0 0 1,280571,337DUBOIS * * * * * 4102,226ELKHART 3 3 47 47 731106790FAYETTE * * * * * 1551,387FLOYD * * * * * 78260FOUNTAIN * * * * * 582,392FRANKLIN * * * * * 5121,826FULTON 4 * 98 * * 5413,230GIBSON 0 0 0 0 1,2632601,523GRANT 3 3 62 62 1,8661501,954GREENE 9 9 172 172 2,5473782,753HAMILTON 0 0 0 0 81153864HANCOCK 0 0 0 0 13312145HARRISON 13 11 287 274 2,5921,3243,643HENDRICKS * * * * * 68873HENRY 6 6 70 70 1,1472351,312HOWARD * * * * * 1231,402HUNTINGTON 12 8 145 78 4,3126124,845JACKSON 14 12 334 297 4,2621,4045,369JASPER * * * * * 2714,131JAY 4 4 120 120 3,6594473,986JEFFERSON * * * * * 54645JENNINGS 7 3 103 41 2,1876092,755JOHNSON 0 0 0 0 6723675KNOX 7 6 182 159 2,1712502,262KOSCIUSKO 44 42 615 577 7,7291,6568,809LAGRANGE 5 5 187 187 1,2042391,256LAKE 6 6 70 70 1,2562681,454LAPORTE 6 5 156 152 3,2485233,618LAWRENCE 13 12 452 378 5,1292,6947,446MADISON 0 0 0 0 1,442261,468MARION 0 0 0 0 13013MARSHALL 11 10 187 183 3,3586813,857MARTIN * * * * * 1081,373MIAMI 12 11 138 121 4,0463614,286
66

County Name Offers Received
Acceptable Offers
Offered Acres
Acceptable Acres
EnrollmentOct. 2013
before continuous
1/
Acreage Expiring Sept. 30,
2013
Enrollment as of
June 2013
Table 1 -- Offers Received, Acceptable Offers, and CRP AcreageINDIANA
MONROE * * * * * 1261,711MONTGOMERY * 0 * 0 4,7663755,141MORGAN 0 0 0 0 8417848NEWTON 0 0 0 0 2,0061222,129NOBLE 35 30 470 388 5,1751,6126,399OHIO 0 0 0 0 255782ORANGE 18 15 287 209 3,8171,8205,428OWEN 4 4 156 156 3,1974823,523PARKE 10 10 229 229 3,1394103,320PERRY 9 9 222 222 1,5403721,690PIKE 14 13 319 269 3,4546623,847PORTER 5 4 93 41 1,3778102,146POSEY * * * * * 1021,191PULASKI * * * * * 6897,142PUTNAM 24 24 433 433 5,2947625,623RANDOLPH * * * * * 1231,875RIPLEY 18 17 279 274 3,5665533,846RUSH * * * * * 26905ST JOSEPH * * * * * 2651,860SCOTT 6 6 144 144 1,7363481,941SHELBY 0 0 0 0 43819457SPENCER 12 11 194 187 2,9313603,104STARKE 7 6 83 63 11,6591,87913,475STEUBEN 39 36 839 789 6,8742,0518,135SULLIVAN 9 9 246 246 2,4424652,661SWITZERLAND 0 0 0 0 88434917TIPPECANOE 0 0 0 0 1,130611,191TIPTON 0 0 0 0 9601101,070UNION * * * * * 225954VANDERBURGH 0 0 0 0 73663799VERMILLION * 0 * 0 1,161311,192VIGO * * * * * 80830WABASH 8 3 244 27 4,9671,1946,134WARREN 15 15 536 536 4,0036894,157WARRICK 6 6 113 113 2,4084502,745WASHINGTON 13 12 273 272 4,0652,3656,158WAYNE 8 6 366 240 3,8991,6735,332WELLS 0 0 0 0 2,1062762,382WHITE 0 0 0 0 2,2611482,410WHITLEY 12 8 215 194 3,3196243,749
1 / Not including continuous signup enrollment between July and September 2013.
* Data withheld to avoid disclosure of individual operations.
67

County NameExpiring
Sept. 2013 (Acres)
New Lands (Acres) 1/
Average Rental
Payment ($/Acre)
Total Rental
Payment ($/year)
Average EBI Score
without Cost
Average EBI Score with Cost
Table 2 -- Description of Signup 45 Acceptable AcresINDIANA
STATE TOTALS 9,497 924 $141.83 $1,478,012 206 259ADAMS * * * * * * ALLEN 71 0 $141.78 $10,053 222 286BARTHOLOMEW 61 0 $162.98 $9,958 200 235CASS * * * * * * CLAY 172 10 $166.32 $30,236 239 274CRAWFORD * * * * * * DAVIESS 281 17 $164.66 $49,053 222 255DECATUR 291 0 $139.85 $40,697 177 241DEKALB 827 41 $114.58 $99,538 179 256DUBOIS * * * * * * ELKHART 47 0 $158.04 $7,397 217 257FAYETTE * * * * * * FLOYD * * * * * * FOUNTAIN * * * * * * FRANKLIN * * * * * * FULTON * * * * * * GRANT 62 0 $144.72 $8,987 163 230GREENE 133 39 $152.72 $26,299 241 281HARRISON 204 70 $100.49 $27,493 165 236HENDRICKS * * * * * * HENRY 65 5 $149.55 $10,438 198 247HOWARD * * * * * * HUNTINGTON 78 0 $160.71 $12,568 194 241JACKSON 247 51 $148.80 $44,209 199 240JASPER * * * * * * JAY 120 0 $119.83 $14,392 162 237JEFFERSON * * * * * * JENNINGS 41 0 $113.68 $4,684 172 248KNOX 159 0 $158.12 $25,063 250 305KOSCIUSKO 566 11 $141.41 $81,582 208 269LAGRANGE 187 0 $122.64 $22,933 171 248LAKE 70 0 $150.19 $10,544 226 281LAPORTE 152 0 $185.70 $28,245 211 233LAWRENCE 339 39 $124.78 $47,143 191 245MARSHALL 183 0 $122.59 $22,385 162 240MARTIN * * * * * * MIAMI 121 0 $148.73 $17,966 216 272MONROE * * * * * * NOBLE 369 19 $133.46 $51,742 218 280ORANGE 199 10 $145.60 $30,372 209 251OWEN 156 0 $130.83 $20,409 264 314PARKE 217 12 $148.41 $33,927 282 344PERRY 222 0 $133.68 $29,610 185 240PIKE 132 137 $159.32 $42,842 214 249PORTER 41 0 $127.93 $5,207 183 260POSEY * * * * * * PULASKI * * * * * * PUTNAM 398 35 $187.69 $81,233 244 266RANDOLPH * * * * * * RIPLEY 230 44 $114.75 $31,419 210 281RUSH * * * * * * ST JOSEPH * * * * * * SCOTT 144 0 $137.20 $19,729 203 252SPENCER 130 56 $123.62 $23,055 219 274
68
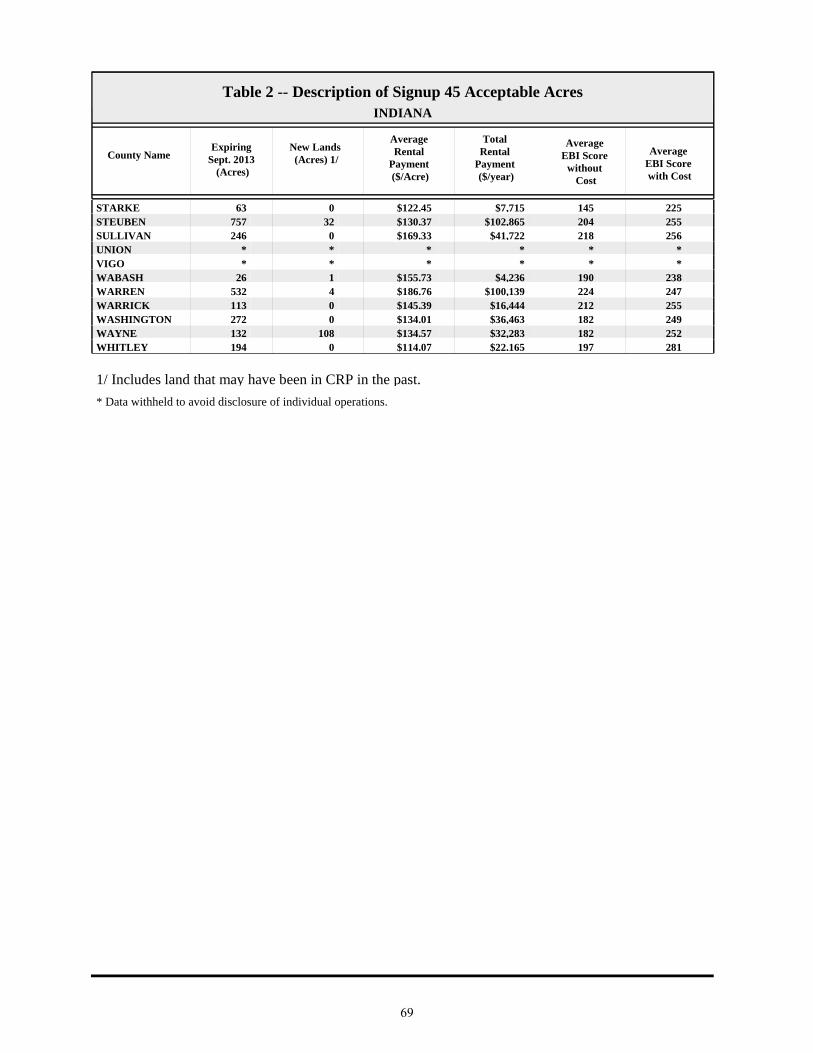
County NameExpiring
Sept. 2013 (Acres)
New Lands (Acres) 1/
Average Rental
Payment ($/Acre)
Total Rental
Payment ($/year)
Average EBI Score
without Cost
Average EBI Score with Cost
Table 2 -- Description of Signup 45 Acceptable AcresINDIANA
STARKE 63 0 $122.45 $7,715 145 225STEUBEN 757 32 $130.37 $102,865 204 255SULLIVAN 246 0 $169.33 $41,722 218 256UNION * * * * * * VIGO * * * * * * WABASH 26 1 $155.73 $4,236 190 238WARREN 532 4 $186.76 $100,139 224 247WARRICK 113 0 $145.39 $16,444 212 255WASHINGTON 272 0 $134.01 $36,463 182 249WAYNE 132 108 $134.57 $32,283 182 252WHITLEY 194 0 $114.07 $22,165 197 281
* Data withheld to avoid disclosure of individual operations.
1/ Includes land that may have been in CRP in the past.
69

County Name
EI>=8 (Acres)
National Priority
Area
State Priority
Area (Acres)
Rare and Declining Habitat (Acres)
Permanent Wildlife Habitat (Acres)
Pollinator Habitat Offers
Table 3 -- Description of Signup 45 Acceptable AcresINDIANA
Average Erodibility Index (EI)
Pollinator Habitat (Acres)
STATE TOTALS 8,087 3,427 2,818 0 987 3420 78ADAMS * * * * * * * * ALLEN 42 71 0 0 3 08 0BARTHOLOMEW 61 0 0 0 14 033 0CASS * * * * * * * * CLAY 106 0 182 0 0 217 8CRAWFORD * * * * * * * * DAVIESS 281 0 298 0 19 038 0DECATUR 291 0 0 0 1 028 0DEKALB 408 869 0 0 27 18 1DUBOIS * * * * * * * * ELKHART 0 47 0 0 0 04 0FAYETTE * * * * * * * * FLOYD * * * * * * * * FOUNTAIN * * * * * * * * FRANKLIN * * * * * * * * FULTON * * * * * * * * GRANT 25 0 0 0 0 06 0GREENE 133 0 172 0 0 220 6HARRISON 274 0 0 0 0 036 0HENDRICKS * * * * * * * * HENRY 56 0 0 0 0 020 0HOWARD * * * * * * * * HUNTINGTON 75 0 0 0 0 016 0JACKSON 297 0 0 0 0 028 0JASPER * * * * * * * * JAY 30 0 0 0 0 08 0JEFFERSON * * * * * * * * JENNINGS 41 0 0 0 0 030 0KNOX 124 0 159 0 111 022 0KOSCIUSKO 179 577 0 0 123 116 23LAGRANGE 28 187 0 0 104 06 0LAKE 62 70 0 0 9 013 0LAPORTE 96 152 0 0 106 010 0LAWRENCE 378 0 0 0 0 119 4MARSHALL 48 0 0 0 7 06 0MARTIN * * * * * * * * MIAMI 121 0 0 0 14 322 6MONROE * * * * * * * * NOBLE 268 388 0 0 52 011 0ORANGE 209 0 0 0 16 620 8OWEN 156 0 156 0 5 039 0PARKE 229 0 229 0 0 018 0PERRY 222 0 0 0 48 039 0PIKE 269 0 269 0 0 141 2PORTER 17 41 0 0 0 010 0POSEY * * * * * * * * PULASKI * * * * * * * * PUTNAM 367 0 433 0 0 016 0RANDOLPH * * * * * * * * RIPLEY 274 0 0 0 27 030 0RUSH * * * * * * * * ST JOSEPH * * * * * * * * SCOTT 144 0 0 0 8 031 0SPENCER 187 0 0 0 52 045 0STARKE 0 0 0 0 0 12 2
70

County Name
EI>=8 (Acres)
National Priority
Area
State Priority
Area (Acres)
Rare and Declining Habitat (Acres)
Permanent Wildlife Habitat (Acres)
Pollinator Habitat Offers
Table 3 -- Description of Signup 45 Acceptable AcresINDIANA
Average Erodibility Index (EI)
Pollinator Habitat (Acres)
STEUBEN 507 789 0 0 85 010 0SULLIVAN 183 198 246 0 0 120 2UNION * * * * * * * * VIGO * * * * * * * * WABASH 27 0 0 0 0 014 0WARREN 529 0 536 0 0 022 0WARRICK 113 0 0 0 8 058 0WASHINGTON 272 0 0 0 0 017 0WAYNE 240 0 0 0 3 113 4WHITLEY 192 0 0 0 146 117 3
* Data withheld to avoid disclosure of individual operations.Note: Acceptable acres may be listed in multiple categories.
71

County NameIntroduced
GrassNative Grass Total
GrassHardwood
TreesSoftwood
TreesTotal Trees
Table 4 -- Description of Signup 45 Acceptable Acres 1/INDIANA
STATE TOTALS 4,502 2,108 6,610 2,615 63 2,677ADAMS * * * * * * ALLEN 12 0 12 56 0 56BARTHOLOMEW 29 18 47 0 0 0CASS * * * * * * CLAY 68 85 153 18 0 18CRAWFORD * * * * * * DAVIESS 154 103 258 15 0 15DECATUR 117 169 286 0 0 0DEKALB 616 3 619 222 0 222DUBOIS * * * * * * ELKHART 0 4 4 42 0 42FAYETTE * * * * * * FLOYD * * * * * * FOUNTAIN * * * * * * FRANKLIN * * * * * * FULTON * * * * * * GRANT 0 0 0 62 0 62GREENE 28 79 107 59 0 59HARRISON 263 6 269 0 0 0HENDRICKS * * * * * * HENRY 35 5 40 30 0 30HOWARD * * * * * * HUNTINGTON 48 0 48 30 0 30JACKSON 197 46 243 51 0 51JASPER * * * * * * JAY 0 13 13 107 0 107JEFFERSON * * * * * * JENNINGS 41 0 41 0 0 0KNOX 0 39 39 8 0 8KOSCIUSKO 168 35 203 222 0 222LAGRANGE 59 9 68 15 0 15LAKE 38 0 38 23 0 23LAPORTE 0 15 15 30 0 30LAWRENCE 224 101 325 49 0 49MARSHALL 0 0 0 119 57 176MARTIN * * * * * * MIAMI 48 2 50 51 0 51MONROE * * * * * * NOBLE 105 95 200 135 0 135ORANGE 57 66 123 61 0 61OWEN 72 79 151 0 0 0PARKE 25 30 54 173 0 173PERRY 156 0 156 17 0 17PIKE 151 92 243 23 0 23PORTER 36 0 36 5 0 5POSEY * * * * * * PULASKI * * * * * * PUTNAM 108 288 396 27 0 27RANDOLPH * * * * * * RIPLEY 10 113 124 119 0 119RUSH * * * * * * ST JOSEPH * * * * * * SCOTT 10 121 131 5 0 5SPENCER 95 6 101 33 0 33STARKE 0 0 0 61 0 61
72
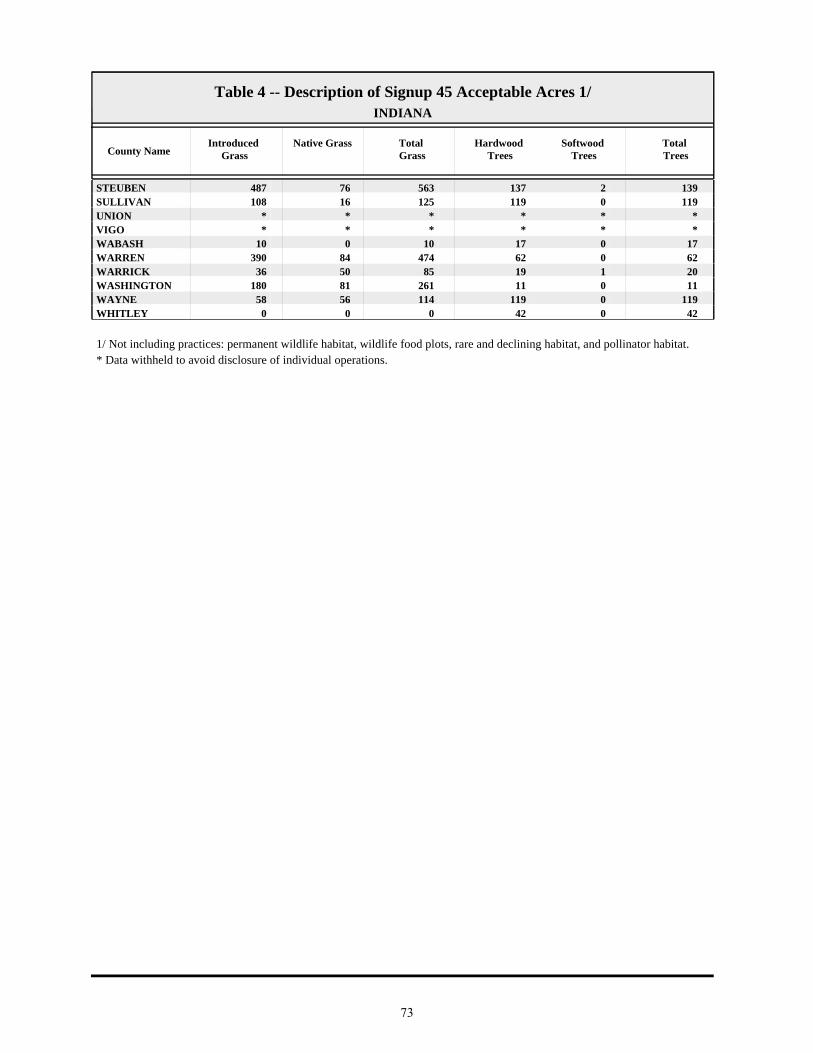
County NameIntroduced
GrassNative Grass Total
GrassHardwood
TreesSoftwood
TreesTotal Trees
Table 4 -- Description of Signup 45 Acceptable Acres 1/INDIANA
STEUBEN 487 76 563 137 2 139SULLIVAN 108 16 125 119 0 119UNION * * * * * * VIGO * * * * * * WABASH 10 0 10 17 0 17WARREN 390 84 474 62 0 62WARRICK 36 50 85 19 1 20WASHINGTON 180 81 261 11 0 11WAYNE 58 56 114 119 0 119WHITLEY 0 0 0 42 0 42
* Data withheld to avoid disclosure of individual operations.1/ Not including practices: permanent wildlife habitat, wildlife food plots, rare and declining habitat, and pollinator habitat.
73

IOW
A
74

County Name Offers Received
Acceptable Offers
Offered Acres
Acceptable Acres
EnrollmentOct. 2013
before continuous
1/
Acreage Expiring Sept. 30,
2013
Enrollment as of
June 2013
Table 1 -- Offers Received, Acceptable Offers, and CRP AcreageIOWA
STATE TOTALS 2,145 1,824 55,051 47,418 1,393,018183,8571,529,457ADAIR 20 20 490 490 17,2812,29019,082ADAMS 7 3 246 138 17,5332,17119,566ALLAMAKEE 11 10 246 226 20,4113,35423,539APPANOOSE 41 41 1,337 1,337 23,4691,48723,619AUDUBON 30 25 646 596 15,6271,56216,592BENTON 6 5 100 96 11,2121,64312,759BLACK HAWK 5 0 128 0 4,6867545,440BOONE 10 9 87 65 10,58171311,229BREMER 9 5 74 49 6,2749137,138BUCHANAN 6 * 103 * * 7846,532BUENA VISTA 12 3 109 37 7,4984067,868BUTLER 18 17 122 117 14,9311,24716,061CALHOUN 5 4 65 32 15,2891,10416,361CARROLL 34 29 279 228 8,7349739,479CASS 24 22 560 500 14,8122,07316,385CEDAR 19 18 266 260 10,3261,36711,432CERRO GORDO 13 13 317 317 9,6926219,996CHEROKEE * * * * * 2223,222CHICKASAW 9 5 64 34 9,7461,28610,998CLARKE 43 35 2,257 1,837 25,9183,29027,371CLAY 12 8 75 51 11,26675911,974CLAYTON 36 35 667 650 35,3215,09939,770CLINTON 16 14 275 251 10,34283710,929CRAWFORD 8 5 245 197 4,6251,5555,983DALLAS 20 18 628 530 8,2751,8979,641DAVIS 38 36 1,815 1,798 29,1323,14830,482DECATUR 25 21 1,695 1,262 30,2442,10231,084DELAWARE 11 11 158 158 11,5132,28513,639DES MOINES 29 22 389 298 8,3265718,599DICKINSON 3 * 25 * * 5696,443DUBUQUE 3 3 76 76 11,6604,26315,847EMMET * 0 * 0 6,2284846,711FAYETTE 6 6 77 77 20,4393,08423,446FLOYD 23 19 192 124 14,9481,46916,293FRANKLIN 32 20 321 189 9,87393210,616FREMONT 4 4 34 34 6,9401,0347,941GREENE 12 8 156 102 9,23290910,039GRUNDY * * * * * 5625,236GUTHRIE 74 73 2,510 2,504 24,2565,37627,128HAMILTON 6 4 64 34 10,38835910,713HANCOCK 12 10 208 181 10,38265710,859HARDIN 21 16 228 175 8,0646268,515HARRISON 4 3 54 45 9,6591,75111,366HENRY 59 51 2,109 1,955 26,3914,07228,508HOWARD 22 13 221 91 14,1693,16917,247HUMBOLDT * * * * * 5437,854IDA 8 8 120 120 4,3687184,966IOWA 11 10 378 367 21,4855,17226,291JACKSON 10 8 269 186 18,1994,66422,678JASPER 20 20 508 508 11,2883,18713,967JEFFERSON 87 77 2,173 1,996 26,2893,65227,945JOHNSON 12 7 143 97 14,3542,88517,142JONES 22 18 490 428 14,2261,65115,448KEOKUK 141 131 3,175 2,993 36,9808,05142,038KOSSUTH 9 8 84 81 14,50346114,884
75

County Name Offers Received
Acceptable Offers
Offered Acres
Acceptable Acres
EnrollmentOct. 2013
before continuous
1/
Acreage Expiring Sept. 30,
2013
Enrollment as of
June 2013
Table 1 -- Offers Received, Acceptable Offers, and CRP AcreageIOWA
LEE 43 38 772 690 15,1863,26517,761LINN 14 9 169 122 8,4681,96910,315LOUISA 43 39 852 814 15,2621,79116,240LUCAS 83 80 2,894 2,791 22,4264,74524,379LYON 4 4 40 40 2,8282293,017MADISON 34 31 1,168 1,082 18,9431,74119,603MAHASKA 21 19 525 472 25,2532,95027,732MARION 76 70 1,199 1,059 23,9532,15325,047MARSHALL 36 34 511 503 9,6941,53510,726MILLS 14 13 245 178 5,4216655,908MITCHELL 10 6 108 47 6,9154737,341MONONA * 0 * 0 4,7387625,500MONROE 57 50 2,058 1,860 24,0492,14624,335MONTGOMERY 3 * 122 * * 1,93011,170MUSCATINE 28 27 633 629 12,1401,87713,387OBRIEN 4 4 61 61 3,4803373,756OSCEOLA 9 5 50 24 5,7821,3057,063PAGE 24 14 787 439 11,2182,98413,763PALO ALTO * * * * * 55716,188PLYMOUTH 15 12 970 914 8,3531,6799,117POCAHONTAS 6 6 44 44 7,9473788,280POLK 8 6 186 159 4,1794714,492E POTTAWATTAMIE * * * * * 1,1896,341W POTTAWATTAMIE * * * * * 3142,415POWESHIEK 26 16 873 530 14,0293,75717,257RINGGOLD 25 21 1,438 972 33,2112,11934,358SAC 14 10 214 191 7,8365578,203SCOTT * * * * * 5234,234SHELBY 9 6 202 97 6,0918696,864SIOUX 7 4 96 71 5,8285616,319STORY 18 15 202 175 7,5077338,065TAMA 21 20 835 752 19,5882,38421,220TAYLOR 16 4 648 136 29,5021,23630,603UNION 22 19 1,095 982 16,2592,83618,112VAN BUREN 76 63 2,486 2,271 25,3154,39927,443WAPELLO 48 33 1,143 664 15,9221,49416,753WARREN 19 13 704 481 18,6624,18122,361WASHINGTON 116 110 3,432 3,203 37,0466,77940,622WAYNE 11 11 327 327 36,8491,19737,718WEBSTER 6 6 77 77 13,51082114,254WINNEBAGO 7 5 55 37 9,3906409,993WINNESHIEK 26 23 461 401 27,0791,77928,457WOODBURY * * * * * 1,69611,297WORTH 4 * 39 * * 4859,895WRIGHT 8 7 37 32 14,13954714,654
1 / Not including continuous signup enrollment between July and September 2013.
* Data withheld to avoid disclosure of individual operations.
76

County NameExpiring
Sept. 2013 (Acres)
New Lands (Acres) 1/
Average Rental
Payment ($/Acre)
Total Rental
Payment ($/year)
Average EBI Score
without Cost
Average EBI Score with Cost
Table 2 -- Description of Signup 45 Acceptable AcresIOWA
STATE TOTALS 39,013 8,405 $193.62 $9,180,906 232 252ADAIR 227 263 $198.64 $97,353 250 263ADAMS 121 17 $235.35 $32,361 245 247ALLAMAKEE 31 195 $224.52 $50,673 264 267APPANOOSE 975 362 $156.58 $209,294 231 269AUDUBON 421 175 $222.41 $132,669 230 236BENTON 96 0 $231.08 $22,160 254 260BOONE 53 12 $209.69 $13,525 220 249BREMER 47 2 $222.54 $10,993 206 221BUCHANAN * * * * * * BUENA VISTA 0 37 $200.23 $7,348 183 215BUTLER 110 7 $217.18 $25,410 245 264CALHOUN 5 26 $216.33 $6,858 227 247CARROLL 208 20 $231.61 $52,853 244 245CASS 443 57 $209.77 $104,862 205 226CEDAR 245 16 $206.85 $53,864 267 285CERRO GORDO 308 9 $209.14 $66,215 231 257CHEROKEE * * * * * * CHICKASAW 34 0 $195.22 $6,696 213 236CLARKE 1,214 623 $197.16 $362,138 244 259CLAY 47 4 $157.71 $8,043 190 243CLAYTON 367 283 $223.53 $145,205 286 289CLINTON 215 36 $208.88 $52,430 250 262CRAWFORD 197 0 $239.98 $47,276 237 237DALLAS 445 86 $222.30 $117,909 219 234DAVIS 1,443 355 $156.05 $280,560 204 242DECATUR 1,049 213 $171.12 $215,990 236 264DELAWARE 78 81 $223.22 $35,358 256 261DES MOINES 229 69 $176.14 $52,488 217 257DICKINSON * * * * * * DUBUQUE 72 4 $239.99 $18,120 258 258FAYETTE 47 30 $175.03 $13,477 252 278FLOYD 114 11 $210.08 $26,133 229 247FRANKLIN 156 32 $227.32 $42,894 250 259FREMONT 34 0 $206.89 $6,993 234 254GREENE 100 2 $205.09 $20,878 220 247GRUNDY * * * * * * GUTHRIE 2,091 414 $211.70 $530,123 237 250HAMILTON 26 8 $218.80 $7,396 204 224HANCOCK 123 58 $205.56 $37,104 224 239HARDIN 137 37 $236.53 $41,298 238 240HARRISON 0 45 $201.05 $8,947 273 286HENRY 1,929 27 $195.90 $382,976 253 269HOWARD 24 67 $203.99 $18,604 228 251HUMBOLDT * * * * * * IDA 120 0 $231.07 $27,728 225 228IOWA 354 13 $206.26 $75,636 251 278JACKSON 186 0 $224.77 $41,807 272 277JASPER 508 0 $214.91 $109,130 268 274JEFFERSON 1,765 231 $188.18 $375,678 225 246JOHNSON 97 0 $207.79 $20,114 249 264JONES 404 24 $226.85 $97,113 244 253KEOKUK 2,758 235 $181.79 $544,173 221 245KOSSUTH 55 26 $205.42 $16,557 225 244LEE 688 2 $168.19 $115,982 235 272
77

County NameExpiring
Sept. 2013 (Acres)
New Lands (Acres) 1/
Average Rental
Payment ($/Acre)
Total Rental
Payment ($/year)
Average EBI Score
without Cost
Average EBI Score with Cost
Table 2 -- Description of Signup 45 Acceptable AcresIOWA
LINN 120 2 $215.25 $26,303 233 249LOUISA 728 86 $205.26 $167,018 235 259LUCAS 2,458 334 $156.36 $436,411 220 257LYON 24 17 $184.26 $7,444 216 248MADISON 854 228 $208.09 $225,128 245 255MAHASKA 472 0 $212.44 $100,187 238 245MARION 714 345 $202.57 $214,486 222 234MARSHALL 448 55 $229.41 $115,464 245 254MILLS 132 45 $224.89 $39,986 263 267MITCHELL 42 5 $221.73 $10,510 251 257MONROE 1,292 568 $179.71 $334,245 225 249MONTGOMERY * * * * * * MUSCATINE 551 79 $200.71 $126,265 242 257OBRIEN 56 5 $203.45 $12,370 196 230OSCEOLA 24 0 $209.78 $5,035 210 236PAGE 270 170 $205.11 $90,103 219 231PALO ALTO * * * * * * PLYMOUTH 826 88 $224.15 $204,966 246 258POCAHONTAS 33 12 $174.53 $7,749 211 257POLK 159 0 $238.13 $37,791 256 258POTTAWATTAMI 46 0 $240.00 $10,968 250 250POWESHIEK 441 89 $187.14 $99,148 205 241RINGGOLD 636 336 $157.56 $153,085 205 240SAC 176 15 $231.19 $44,250 217 222SCOTT * * * * * * SHELBY 26 71 $235.16 $22,764 234 234SIOUX 71 0 $219.41 $15,534 210 228STORY 135 40 $219.79 $38,484 217 235TAMA 720 32 $202.37 $152,103 237 251TAYLOR 5 130 $214.02 $29,022 253 259UNION 880 102 $205.19 $201,579 230 240VAN BUREN 2,151 120 $165.60 $376,089 230 264WAPELLO 400 264 $170.98 $113,464 203 234WARREN 407 75 $199.56 $96,050 225 249WASHINGTON 2,683 520 $208.61 $668,144 222 231WAYNE 128 199 $167.24 $54,753 242 278WEBSTER 69 8 $222.98 $17,192 210 225WINNEBAGO 27 10 $217.94 $8,085 232 249WINNESHIEK 306 95 $232.46 $93,171 293 295WOODBURY * * * * * * WORTH * * * * * * WRIGHT 27 5 $214.30 $6,943 212 233
* Data withheld to avoid disclosure of individual operations.
1/ Includes land that may have been in CRP in the past.
78
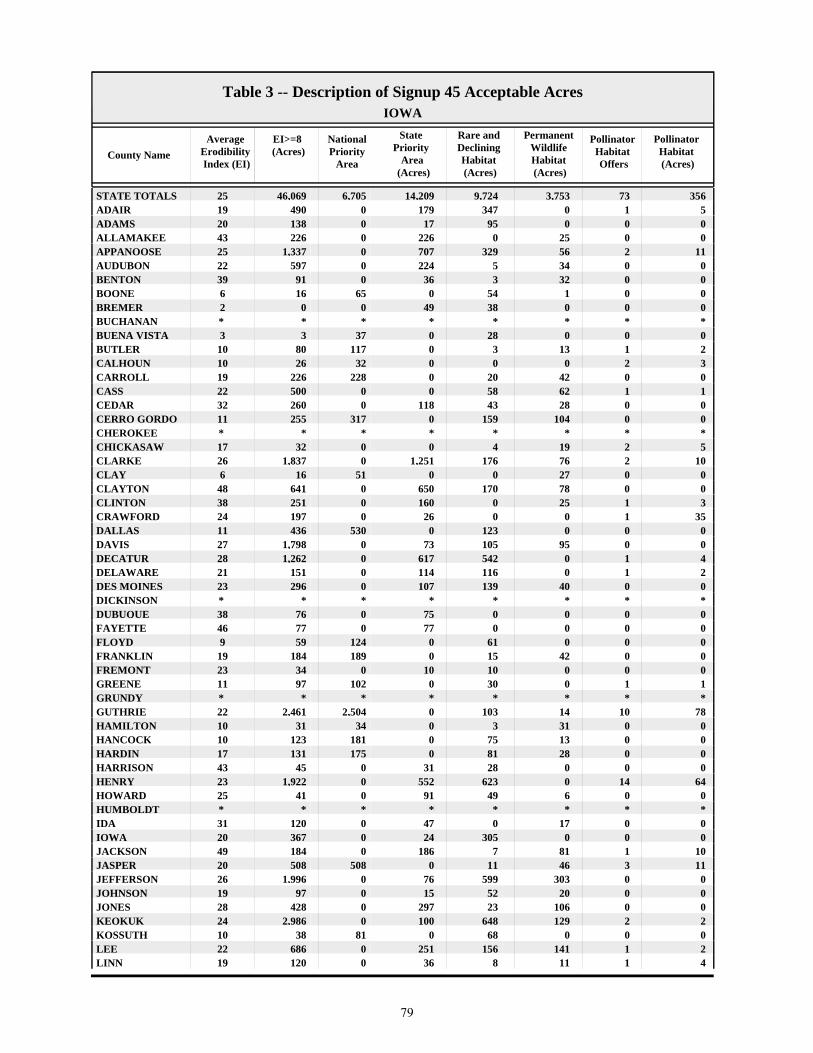
County Name
EI>=8 (Acres)
National Priority
Area
State Priority
Area (Acres)
Rare and Declining Habitat (Acres)
Permanent Wildlife Habitat (Acres)
Pollinator Habitat Offers
Table 3 -- Description of Signup 45 Acceptable AcresIOWA
Average Erodibility Index (EI)
Pollinator Habitat (Acres)
STATE TOTALS 46,069 6,705 14,209 9,724 3,753 7325 356ADAIR 490 0 179 347 0 119 5ADAMS 138 0 17 95 0 020 0ALLAMAKEE 226 0 226 0 25 043 0APPANOOSE 1,337 0 707 329 56 225 11AUDUBON 597 0 224 5 34 022 0BENTON 91 0 36 3 32 039 0BOONE 16 65 0 54 1 06 0BREMER 0 0 49 38 0 02 0BUCHANAN * * * * * * * * BUENA VISTA 3 37 0 28 0 03 0BUTLER 80 117 0 3 13 110 2CALHOUN 26 32 0 0 0 210 3CARROLL 226 228 0 20 42 019 0CASS 500 0 0 58 62 122 1CEDAR 260 0 118 43 28 032 0CERRO GORDO 255 317 0 159 104 011 0CHEROKEE * * * * * * * * CHICKASAW 32 0 0 4 19 217 5CLARKE 1,837 0 1,251 176 76 226 10CLAY 16 51 0 0 27 06 0CLAYTON 641 0 650 170 78 048 0CLINTON 251 0 160 0 25 138 3CRAWFORD 197 0 26 0 0 124 35DALLAS 436 530 0 123 0 011 0DAVIS 1,798 0 73 105 95 027 0DECATUR 1,262 0 617 542 0 128 4DELAWARE 151 0 114 116 0 121 2DES MOINES 296 0 107 139 40 023 0DICKINSON * * * * * * * * DUBUQUE 76 0 75 0 0 038 0FAYETTE 77 0 77 0 0 046 0FLOYD 59 124 0 61 0 09 0FRANKLIN 184 189 0 15 42 019 0FREMONT 34 0 10 10 0 023 0GREENE 97 102 0 30 0 111 1GRUNDY * * * * * * * * GUTHRIE 2,461 2,504 0 103 14 1022 78HAMILTON 31 34 0 3 31 010 0HANCOCK 123 181 0 75 13 010 0HARDIN 131 175 0 81 28 017 0HARRISON 45 0 31 28 0 043 0HENRY 1,922 0 552 623 0 1423 64HOWARD 41 0 91 49 6 025 0HUMBOLDT * * * * * * * * IDA 120 0 47 0 17 031 0IOWA 367 0 24 305 0 020 0JACKSON 184 0 186 7 81 149 10JASPER 508 508 0 11 46 320 11JEFFERSON 1,996 0 76 599 303 026 0JOHNSON 97 0 15 52 20 019 0JONES 428 0 297 23 106 028 0KEOKUK 2,986 0 100 648 129 224 2KOSSUTH 38 81 0 68 0 010 0LEE 686 0 251 156 141 122 2LINN 120 0 36 8 11 119 4
79

County Name
EI>=8 (Acres)
National Priority
Area
State Priority
Area (Acres)
Rare and Declining Habitat (Acres)
Permanent Wildlife Habitat (Acres)
Pollinator Habitat Offers
Table 3 -- Description of Signup 45 Acceptable AcresIOWA
Average Erodibility Index (EI)
Pollinator Habitat (Acres)
LOUISA 643 0 649 248 64 118 1LUCAS 2,773 0 2,186 71 21 024 0LYON 40 0 40 0 0 019 0MADISON 1,082 0 115 799 0 025 0MAHASKA 466 0 48 210 15 021 0MARION 1,059 0 336 74 43 030 0MARSHALL 500 503 0 13 23 222 5MILLS 178 0 107 47 0 149 1MITCHELL 30 47 0 5 0 010 0MONROE 1,860 0 269 417 158 228 4MONTGOMERY * * * * * * * * MUSCATINE 575 0 422 112 223 122 1OBRIEN 8 61 0 5 0 06 0OSCEOLA 12 24 0 9 0 18 1PAGE 439 0 0 46 0 019 0PALO ALTO * * * * * * * * PLYMOUTH 914 0 355 244 6 040 0POCAHONTAS 43 44 0 0 0 012 0POLK 152 159 0 0 6 217 2POTTAWATTAMI 46 0 42 0 24 027 0POWESHIEK 526 0 25 106 43 017 0RINGGOLD 972 0 0 0 112 024 0SAC 171 191 0 33 10 020 0SCOTT * * * * * * * * SHELBY 97 0 68 0 22 019 0SIOUX 71 0 4 5 10 019 0STORY 127 175 0 55 38 010 0TAMA 752 0 196 127 156 137 1TAYLOR 136 0 81 103 0 029 0UNION 982 0 753 67 62 218 27VAN BUREN 2,166 0 1,159 488 671 419 38WAPELLO 664 0 73 99 36 135 1WARREN 481 0 14 93 10 324 6WASHINGTON 3,203 0 141 435 157 127 3WAYNE 327 0 292 1 0 119 10WEBSTER 60 77 0 45 30 08 0WINNEBAGO 2 37 0 7 0 26 2WINNESHIEK 401 0 396 217 36 050 0WOODBURY * * * * * * * * WORTH * * * * * * * * WRIGHT 31 32 0 5 8 012 0
* Data withheld to avoid disclosure of individual operations.Note: Acceptable acres may be listed in multiple categories.
80

County NameIntroduced
GrassNative Grass Total
GrassHardwood
TreesSoftwood
TreesTotal Trees
Table 4 -- Description of Signup 45 Acceptable Acres 1/IOWA
STATE TOTALS 17,584 13,722 31,307 1,803 76 1,879ADAIR 54 69 123 15 0 15ADAMS 43 0 43 0 0 0ALLAMAKEE 194 0 194 6 0 6APPANOOSE 622 292 914 15 0 15AUDUBON 210 341 551 0 0 0BENTON 19 0 19 36 0 36BOONE 0 9 9 0 0 0BREMER 0 0 0 12 0 12BUCHANAN * * * * * * BUENA VISTA 0 9 9 0 0 0BUTLER 16 0 16 81 0 81CALHOUN 0 29 29 0 0 0CARROLL 73 94 167 0 0 0CASS 28 345 373 0 0 0CEDAR 9 133 142 43 0 43CERRO GORDO 44 0 44 10 0 10CHEROKEE * * * * * * CHICKASAW 0 0 0 7 0 7CLARKE 938 627 1,565 0 0 0CLAY 6 18 24 0 0 0CLAYTON 264 78 342 32 8 40CLINTON 27 186 213 10 0 10CRAWFORD 65 89 155 8 0 8DALLAS 113 216 328 65 0 65DAVIS 1,275 316 1,591 7 0 7DECATUR 544 167 711 0 0 0DELAWARE 0 30 30 7 0 7DES MOINES 104 15 119 1 0 1DICKINSON * * * * * * DUBUQUE 27 41 68 0 0 0FAYETTE 64 0 64 14 0 14FLOYD 7 2 9 55 0 55FRANKLIN 50 82 131 0 0 0FREMONT 10 14 23 0 0 0GREENE 12 59 71 0 0 0GRUNDY * * * * * * GUTHRIE 1,371 811 2,182 66 0 66HAMILTON 0 0 0 0 0 0HANCOCK 1 87 89 0 0 0HARDIN 6 57 63 2 0 2HARRISON 3 13 16 0 0 0HENRY 590 546 1,136 111 4 115HOWARD 24 3 26 10 0 10HUMBOLDT * * * * * * IDA 31 72 103 0 0 0IOWA 11 0 11 45 0 45JACKSON 67 9 77 2 0 2JASPER 80 356 436 0 0 0JEFFERSON 404 631 1,034 44 0 44JOHNSON 6 12 18 0 7 7JONES 235 47 282 17 0 17KEOKUK 1,458 700 2,158 56 0 56KOSSUTH 12 0 12 0 0 0LEE 118 206 324 66 0 66LINN 0 9 9 91 0 91
81

County NameIntroduced
GrassNative Grass Total
GrassHardwood
TreesSoftwood
TreesTotal Trees
Table 4 -- Description of Signup 45 Acceptable Acres 1/IOWA
LOUISA 244 137 380 107 0 107LUCAS 1,667 949 2,616 77 0 77LYON 0 40 40 0 0 0MADISON 110 143 253 30 0 30MAHASKA 0 197 197 49 0 49MARION 591 327 918 20 0 20MARSHALL 331 125 456 4 0 4MILLS 16 114 130 0 0 0MITCHELL 0 0 0 42 0 42MONROE 601 579 1,180 60 0 60MONTGOMERY * * * * * * MUSCATINE 85 193 278 10 0 10OBRIEN 8 3 11 0 45 45OSCEOLA 0 13 13 0 0 0PAGE 212 180 392 0 0 0PALO ALTO * * * * * * PLYMOUTH 107 495 601 16 0 16POCAHONTAS 31 14 44 0 0 0POLK 145 5 151 0 0 0POTTAWATTAMI 0 21 21 0 0 0POWESHIEK 306 53 359 22 0 22RINGGOLD 543 264 807 53 0 53SAC 82 43 125 23 0 23SCOTT * * * * * * SHELBY 10 65 75 0 0 0SIOUX 1 55 56 0 0 0STORY 20 49 68 12 0 12TAMA 182 273 455 8 0 8TAYLOR 30 3 32 0 0 0UNION 277 546 823 0 0 0VAN BUREN 333 588 921 136 0 137WAPELLO 427 69 496 30 1 31WARREN 19 348 367 0 0 0WASHINGTON 1,740 803 2,543 48 0 48WAYNE 212 88 300 16 0 16WEBSTER 0 0 0 0 0 0WINNEBAGO 2 0 2 27 0 27WINNESHIEK 0 63 63 79 2 81WOODBURY * * * * * * WORTH * * * * * * WRIGHT 5 11 16 2 2 4
* Data withheld to avoid disclosure of individual operations.1/ Not including practices: permanent wildlife habitat, wildlife food plots, rare and declining habitat, and pollinator habitat.
82

KA
NS
AS
83

County Name Offers Received
Acceptable Offers
Offered Acres
Acceptable Acres
EnrollmentOct. 2013
before continuous
1/
Acreage Expiring Sept. 30,
2013
Enrollment as of
June 2013
Table 1 -- Offers Received, Acceptable Offers, and CRP AcreageKANSAS
STATE TOTALS 2,207 2,017 156,706 146,152 2,297,395213,3452,364,589ALLEN 28 26 1,526 1,408 9,0772,0639,732ANDERSON 13 13 373 373 7,1951,0447,865ATCHISON 15 11 520 430 3,4254263,421BARBER 10 8 802 530 8,9854758,930BARTON 18 17 867 786 20,5001,15520,869BOURBON 24 18 1,120 983 15,9162,08517,019BROWN 15 11 266 192 7,4518728,131BUTLER * * * * * 9565CHASE * * * * * 7733CHAUTAUQUA * * * * * 581,779CHEROKEE 0 0 0 0 1,582211,603CHEYENNE 16 16 1,321 1,321 43,5521,33943,570CLARK 21 21 2,686 2,686 36,4551,91535,684CLAY 33 30 1,360 1,260 15,8172,36316,920CLOUD 19 17 1,252 1,207 7,0802,3628,235COFFEY 18 17 522 513 19,86793020,283COMANCHE 9 9 1,523 1,523 22,6231,33822,438COWLEY 5 5 316 316 3,7173733,774CRAWFORD 10 10 411 411 7,5327477,868DECATUR 9 9 232 232 4,5777135,058DICKINSON 105 86 4,086 3,171 31,0276,91234,767DONIPHAN 20 20 593 593 6,4562,1838,046DOUGLAS 9 8 191 167 4,4902414,564EDWARDS 19 18 1,903 1,883 19,7272,25420,099ELK * * * * * 1762,308ELLIS 20 18 361 356 24,27666124,582ELLSWORTH 16 16 882 882 23,2341,15023,502FINNEY 14 14 1,338 1,338 57,5886,98863,238FORD 79 68 8,859 8,024 47,44713,03652,459FRANKLIN 4 3 122 98 5,4004335,735GEARY 11 9 455 384 2,8524682,936GOVE 7 5 184 163 40,13835640,331GRAHAM 9 9 728 728 47,07431646,662GRANT 39 38 5,136 5,101 45,0974,16544,162GRAY 34 33 3,969 3,847 52,0638,03856,254GREELEY 4 3 473 338 24,4081,05525,124GREENWOOD 5 5 138 138 4,2272424,331HAMILTON 12 12 1,444 1,444 112,493597111,646HARPER 4 4 296 296 21,76824721,718HARVEY 9 4 211 123 3,1274003,405HASKELL 5 5 821 821 15,95585515,989HODGEMAN 94 92 8,914 8,561 61,34013,89766,676JACKSON 18 15 798 642 12,6121,25513,225JEFFERSON 17 16 730 688 6,7989917,102JEWELL 23 16 719 578 10,07792110,421JOHNSON * * * * * 57767KEARNY 18 17 1,348 1,217 51,6501,49951,932KINGMAN 20 19 936 880 28,2441,73229,096KIOWA 97 91 10,574 9,263 43,72214,04648,505LABETTE 5 5 178 178 3,2113073,340LANE 14 12 1,061 783 48,2631,00548,485LEAVENWORTH 5 3 220 170 3,9462854,060LINCOLN 11 11 666 666 14,86832014,522LINN 17 17 843 843 11,4871,48112,125LOGAN 6 4 413 309 28,92176229,374
84
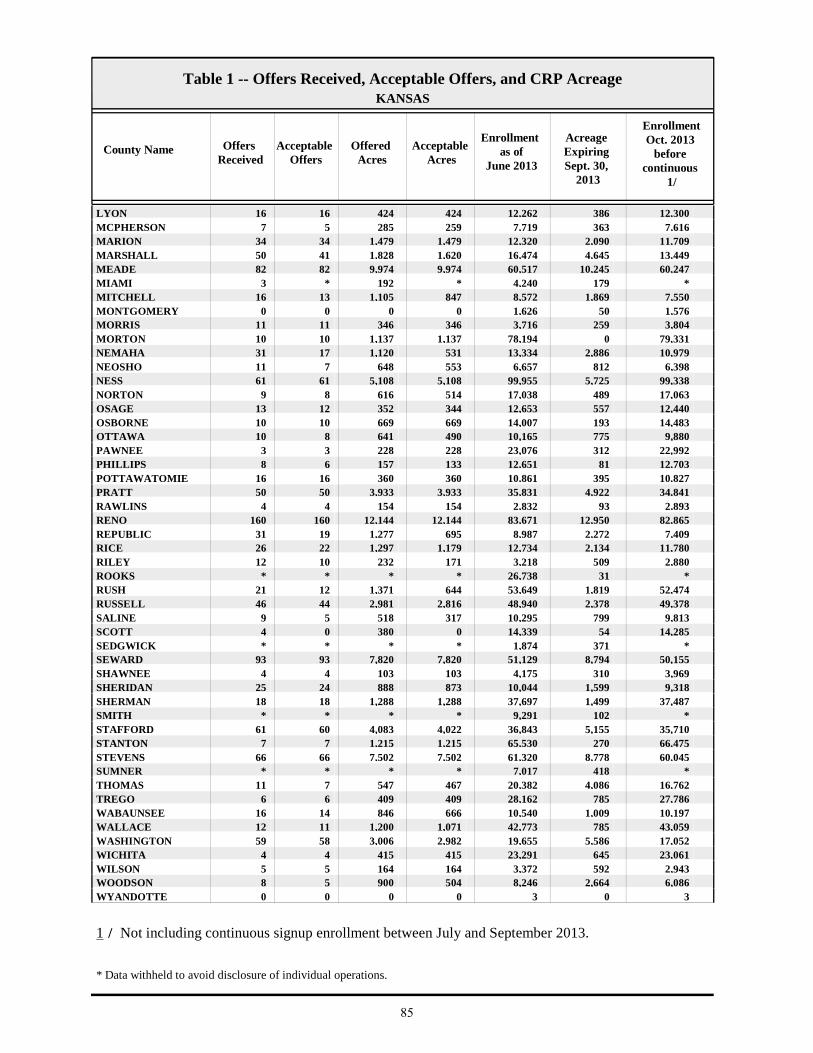
County Name Offers Received
Acceptable Offers
Offered Acres
Acceptable Acres
EnrollmentOct. 2013
before continuous
1/
Acreage Expiring Sept. 30,
2013
Enrollment as of
June 2013
Table 1 -- Offers Received, Acceptable Offers, and CRP AcreageKANSAS
LYON 16 16 424 424 12,30038612,262MCPHERSON 7 5 285 259 7,6163637,719MARION 34 34 1,479 1,479 11,7092,09012,320MARSHALL 50 41 1,828 1,620 13,4494,64516,474MEADE 82 82 9,974 9,974 60,24710,24560,517MIAMI 3 * 192 * * 1794,240MITCHELL 16 13 1,105 847 7,5501,8698,572MONTGOMERY 0 0 0 0 1,576501,626MORRIS 11 11 346 346 3,8042593,716MORTON 10 10 1,137 1,137 79,331078,194NEMAHA 31 17 1,120 531 10,9792,88613,334NEOSHO 11 7 648 553 6,3988126,657NESS 61 61 5,108 5,108 99,3385,72599,955NORTON 9 8 616 514 17,06348917,038OSAGE 13 12 352 344 12,44055712,653OSBORNE 10 10 669 669 14,48319314,007OTTAWA 10 8 641 490 9,88077510,165PAWNEE 3 3 228 228 22,99231223,076PHILLIPS 8 6 157 133 12,7038112,651POTTAWATOMIE 16 16 360 360 10,82739510,861PRATT 50 50 3,933 3,933 34,8414,92235,831RAWLINS 4 4 154 154 2,893932,832RENO 160 160 12,144 12,144 82,86512,95083,671REPUBLIC 31 19 1,277 695 7,4092,2728,987RICE 26 22 1,297 1,179 11,7802,13412,734RILEY 12 10 232 171 2,8805093,218ROOKS * * * * * 3126,738RUSH 21 12 1,371 644 52,4741,81953,649RUSSELL 46 44 2,981 2,816 49,3782,37848,940SALINE 9 5 518 317 9,81379910,295SCOTT 4 0 380 0 14,2855414,339SEDGWICK * * * * * 3711,874SEWARD 93 93 7,820 7,820 50,1558,79451,129SHAWNEE 4 4 103 103 3,9693104,175SHERIDAN 25 24 888 873 9,3181,59910,044SHERMAN 18 18 1,288 1,288 37,4871,49937,697SMITH * * * * * 1029,291STAFFORD 61 60 4,083 4,022 35,7105,15536,843STANTON 7 7 1,215 1,215 66,47527065,530STEVENS 66 66 7,502 7,502 60,0458,77861,320SUMNER * * * * * 4187,017THOMAS 11 7 547 467 16,7624,08620,382TREGO 6 6 409 409 27,78678528,162WABAUNSEE 16 14 846 666 10,1971,00910,540WALLACE 12 11 1,200 1,071 43,05978542,773WASHINGTON 59 58 3,006 2,982 17,0525,58619,655WICHITA 4 4 415 415 23,06164523,291WILSON 5 5 164 164 2,9435923,372WOODSON 8 5 900 504 6,0862,6648,246WYANDOTTE 0 0 0 0 303
1 / Not including continuous signup enrollment between July and September 2013.
* Data withheld to avoid disclosure of individual operations.
85
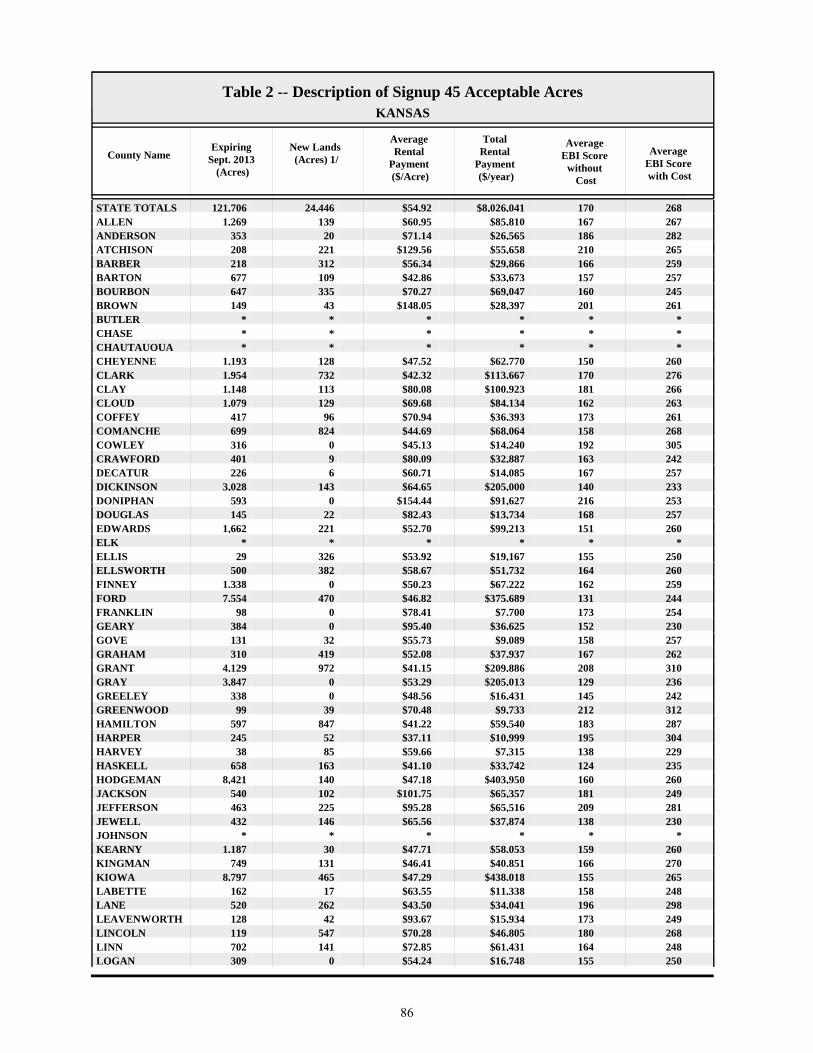
County NameExpiring
Sept. 2013 (Acres)
New Lands (Acres) 1/
Average Rental
Payment ($/Acre)
Total Rental
Payment ($/year)
Average EBI Score
without Cost
Average EBI Score with Cost
Table 2 -- Description of Signup 45 Acceptable AcresKANSAS
STATE TOTALS 121,706 24,446 $54.92 $8,026,041 170 268ALLEN 1,269 139 $60.95 $85,810 167 267ANDERSON 353 20 $71.14 $26,565 186 282ATCHISON 208 221 $129.56 $55,658 210 265BARBER 218 312 $56.34 $29,866 166 259BARTON 677 109 $42.86 $33,673 157 257BOURBON 647 335 $70.27 $69,047 160 245BROWN 149 43 $148.05 $28,397 201 261BUTLER * * * * * * CHASE * * * * * * CHAUTAUQUA * * * * * * CHEYENNE 1,193 128 $47.52 $62,770 150 260CLARK 1,954 732 $42.32 $113,667 170 276CLAY 1,148 113 $80.08 $100,923 181 266CLOUD 1,079 129 $69.68 $84,134 162 263COFFEY 417 96 $70.94 $36,393 173 261COMANCHE 699 824 $44.69 $68,064 158 268COWLEY 316 0 $45.13 $14,240 192 305CRAWFORD 401 9 $80.09 $32,887 163 242DECATUR 226 6 $60.71 $14,085 167 257DICKINSON 3,028 143 $64.65 $205,000 140 233DONIPHAN 593 0 $154.44 $91,627 216 253DOUGLAS 145 22 $82.43 $13,734 168 257EDWARDS 1,662 221 $52.70 $99,213 151 260ELK * * * * * * ELLIS 29 326 $53.92 $19,167 155 250ELLSWORTH 500 382 $58.67 $51,732 164 260FINNEY 1,338 0 $50.23 $67,222 162 259FORD 7,554 470 $46.82 $375,689 131 244FRANKLIN 98 0 $78.41 $7,700 173 254GEARY 384 0 $95.40 $36,625 152 230GOVE 131 32 $55.73 $9,089 158 257GRAHAM 310 419 $52.08 $37,937 167 262GRANT 4,129 972 $41.15 $209,886 208 310GRAY 3,847 0 $53.29 $205,013 129 236GREELEY 338 0 $48.56 $16,431 145 242GREENWOOD 99 39 $70.48 $9,733 212 312HAMILTON 597 847 $41.22 $59,540 183 287HARPER 245 52 $37.11 $10,999 195 304HARVEY 38 85 $59.66 $7,315 138 229HASKELL 658 163 $41.10 $33,742 124 235HODGEMAN 8,421 140 $47.18 $403,950 160 260JACKSON 540 102 $101.75 $65,357 181 249JEFFERSON 463 225 $95.28 $65,516 209 281JEWELL 432 146 $65.56 $37,874 138 230JOHNSON * * * * * * KEARNY 1,187 30 $47.71 $58,053 159 260KINGMAN 749 131 $46.41 $40,851 166 270KIOWA 8,797 465 $47.29 $438,018 155 265LABETTE 162 17 $63.55 $11,338 158 248LANE 520 262 $43.50 $34,041 196 298LEAVENWORTH 128 42 $93.67 $15,934 173 249LINCOLN 119 547 $70.28 $46,805 180 268LINN 702 141 $72.85 $61,431 164 248LOGAN 309 0 $54.24 $16,748 155 250
86

County NameExpiring
Sept. 2013 (Acres)
New Lands (Acres) 1/
Average Rental
Payment ($/Acre)
Total Rental
Payment ($/year)
Average EBI Score
without Cost
Average EBI Score with Cost
Table 2 -- Description of Signup 45 Acceptable AcresKANSAS
LYON 277 147 $68.02 $28,835 203 299MCPHERSON 118 141 $53.27 $13,817 120 215MARION 1,246 234 $53.59 $79,289 196 291MARSHALL 1,452 168 $95.96 $155,425 176 252MEADE 8,788 1,187 $48.48 $483,575 188 288MIAMI * * * * * * MITCHELL 575 272 $70.31 $59,555 170 256MORRIS 202 144 $83.71 $28,972 167 251MORTON 0 1,137 $36.88 $41,914 215 321NEMAHA 504 27 $139.25 $74,011 191 240NEOSHO 426 128 $57.26 $31,682 147 239NESS 4,752 356 $48.23 $246,372 170 267NORTON 109 406 $54.23 $27,889 156 250OSAGE 211 133 $87.98 $30,238 195 270OSBORNE 0 669 $71.20 $47,648 166 250OTTAWA 452 38 $65.98 $32,324 125 234PAWNEE 219 9 $39.39 $8,977 144 246PHILLIPS 0 133 $54.47 $7,255 153 247POTTAWATOMIE 307 53 $90.06 $32,466 160 242PRATT 3,450 483 $49.46 $194,525 155 253RAWLINS 55 99 $50.65 $7,795 140 236RENO 10,748 1,396 $60.55 $735,396 189 280REPUBLIC 676 19 $76.08 $52,845 166 263RICE 1,042 137 $63.88 $75,317 127 231RILEY 137 35 $90.95 $15,570 188 262ROOKS * * * * * * RUSH 450 195 $45.05 $29,023 153 252RUSSELL 1,660 1,156 $61.08 $171,983 171 267SALINE 215 102 $57.82 $18,318 149 241SEDGWICK * * * * * * SEWARD 5,658 2,163 $43.16 $337,564 199 302SHAWNEE 58 45 $94.44 $9,765 150 247SHERIDAN 792 81 $56.49 $49,321 162 256SHERMAN 1,106 182 $44.88 $57,801 151 255SMITH * * * * * * STAFFORD 3,998 24 $60.44 $243,081 158 250STANTON 527 689 $44.77 $54,416 147 247STEVENS 6,272 1,230 $39.26 $294,541 197 300SUMNER * * * * * * THOMAS 467 0 $55.97 $26,115 130 225TREGO 118 291 $51.32 $20,979 154 252WABAUNSEE 547 119 $105.64 $70,313 175 246WALLACE 410 661 $53.15 $56,895 158 259WASHINGTON 2,913 69 $81.05 $241,684 191 272WICHITA 378 36 $54.70 $22,674 182 276WILSON 142 22 $70.47 $11,529 127 219WOODSON 504 0 $61.82 $31,177 142 250
* Data withheld to avoid disclosure of individual operations.
1/ Includes land that may have been in CRP in the past.
87

County Name
EI>=8 (Acres)
National Priority
Area
State Priority
Area (Acres)
Rare and Declining Habitat (Acres)
Permanent Wildlife Habitat (Acres)
Pollinator Habitat Offers
Table 3 -- Description of Signup 45 Acceptable AcresKANSAS
Average Erodibility Index (EI)
Pollinator Habitat (Acres)
STATE TOTALS 107,150 0 82,286 29,229 38,296 3712 256ALLEN 1,122 0 0 1,003 3 711 61ANDERSON 363 0 0 205 0 115 5ATCHISON 430 0 239 64 0 015 0BARBER 530 0 0 0 467 014 0BARTON 554 0 39 0 37 012 0BOURBON 891 0 0 785 0 011 0BROWN 192 0 126 16 0 212 46BUTLER * * * * * * * * CHASE * * * * * * * * CHAUTAUQUA * * * * * * * * CHEYENNE 1,321 0 0 5 0 114 15CLARK 2,585 0 2,211 0 1,866 011 0CLAY 770 0 976 28 983 210 7CLOUD 340 0 585 230 844 09 0COFFEY 513 0 29 241 0 012 0COMANCHE 800 0 1,523 0 908 08 0COWLEY 316 0 0 28 0 120 1CRAWFORD 359 0 0 398 0 09 0DECATUR 109 0 93 176 0 58 20DICKINSON 2,193 0 0 2,328 787 68 22DONIPHAN 593 0 0 47 124 027 0DOUGLAS 167 0 0 22 0 014 0EDWARDS 1,190 0 838 315 270 09 0ELK * * * * * * * * ELLIS 96 0 356 0 297 07 0ELLSWORTH 726 0 647 52 760 09 0FINNEY 1,338 0 323 517 355 012 0FORD 2,298 0 1,566 1,949 6,047 08 0FRANKLIN 98 0 0 95 0 012 0GEARY 384 0 0 222 32 011 0GOVE 40 0 154 33 32 07 0GRAHAM 326 0 728 0 607 08 0GRANT 5,101 0 3,340 1,088 0 017 0GRAY 2,893 0 0 1,792 1,021 010 0GREELEY 338 0 0 338 0 011 0GREENWOOD 138 0 99 39 0 015 0HAMILTON 1,444 0 1,286 0 0 020 0HARPER 296 0 0 160 0 015 0HARVEY 85 0 0 0 0 19 2HASKELL 821 0 154 318 0 011 0HODGEMAN 5,769 0 8,058 0 579 09 0JACKSON 642 0 327 0 0 012 0JEFFERSON 688 0 448 256 19 014 0JEWELL 433 0 0 249 248 19 8JOHNSON * * * * * * * * KEARNY 1,217 0 150 71 0 017 0KINGMAN 677 0 181 340 0 010 0KIOWA 3,897 0 9,263 0 295 18 13LABETTE 136 0 0 69 0 09 0LANE 783 0 764 465 318 010 0LEAVENWORTH 170 0 0 42 0 053 0LINCOLN 231 0 666 183 388 07 0LINN 835 0 0 183 0 013 0LOGAN 309 0 298 0 309 09 0LYON 366 0 424 47 0 012 0
88

County Name
EI>=8 (Acres)
National Priority
Area
State Priority
Area (Acres)
Rare and Declining Habitat (Acres)
Permanent Wildlife Habitat (Acres)
Pollinator Habitat Offers
Table 3 -- Description of Signup 45 Acceptable AcresKANSAS
Average Erodibility Index (EI)
Pollinator Habitat (Acres)
MCPHERSON 259 0 0 0 0 011 0MARION 1,253 0 1,417 30 1,203 011 0MARSHALL 590 0 1,523 277 840 17 5MEADE 8,846 0 8,148 3,949 5,302 012 0MIAMI * * * * * * * * MITCHELL 236 0 796 0 745 18 8MORRIS 254 0 160 8 0 011 0MORTON 1,137 0 980 0 0 024 0NEMAHA 407 0 435 48 33 39 17NEOSHO 553 0 0 102 0 013 0NESS 1,707 0 5,108 716 3,899 08 0NORTON 431 0 369 0 0 09 0OSAGE 344 0 86 40 0 015 0OSBORNE 346 0 559 142 507 08 0OTTAWA 284 0 34 18 0 08 0PAWNEE 228 0 0 0 228 012 0PHILLIPS 133 0 72 0 120 110 2POTTAWATOMIE 341 0 113 37 304 010 0PRATT 3,228 0 725 417 0 010 0RAWLINS 154 0 0 99 0 011 0RENO 8,434 0 10,106 277 0 010 0REPUBLIC 226 0 394 0 619 09 0RICE 683 0 0 233 0 08 0RILEY 160 0 164 16 0 010 0ROOKS * * * * * * * * RUSH 488 0 396 12 219 09 0RUSSELL 954 0 2,816 319 2,330 28 14SALINE 198 0 102 17 275 09 0SEDGWICK * * * * * * * * SEWARD 7,821 0 3,606 3,464 2,981 018 0SHAWNEE 103 0 0 82 0 010 0SHERIDAN 166 0 495 861 0 07 0SHERMAN 1,288 0 97 494 0 012 0SMITH * * * * * * * * STAFFORD 3,812 0 688 100 0 011 0STANTON 1,215 0 491 0 0 016 0STEVENS 7,503 0 2,416 302 0 023 0SUMNER * * * * * * * * THOMAS 467 0 0 467 0 08 0TREGO 77 0 409 0 399 06 0WABAUNSEE 412 0 272 545 0 09 0WALLACE 1,071 0 390 688 378 011 0WASHINGTON 1,672 0 2,982 91 273 19 9WICHITA 415 0 0 415 0 015 0WILSON 164 0 0 0 0 011 0WOODSON 504 0 0 262 0 08 0
* Data withheld to avoid disclosure of individual operations.Note: Acceptable acres may be listed in multiple categories.
89

County NameIntroduced
GrassNative Grass Total
GrassHardwood
TreesSoftwood
TreesTotal Trees
Table 4 -- Description of Signup 45 Acceptable Acres 1/KANSAS
STATE TOTALS 1,245 76,808 78,053 61 0 61ALLEN 0 340 340 0 0 0ANDERSON 31 133 164 0 0 0ATCHISON 75 290 365 0 0 0BARBER 0 63 63 0 0 0BARTON 0 748 748 0 0 0BOURBON 0 190 190 0 0 0BROWN 26 103 129 0 0 0BUTLER * * * * * * CHASE * * * * * * CHAUTAUQUA * * * * * * CHEYENNE 0 1,298 1,298 0 0 0CLARK 0 820 820 0 0 0CLAY 0 228 228 0 0 0CLOUD 0 129 129 0 0 0COFFEY 0 272 272 0 0 0COMANCHE 0 616 616 0 0 0COWLEY 0 288 288 0 0 0CRAWFORD 0 13 13 0 0 0DECATUR 0 36 36 0 0 0DICKINSON 0 6 6 0 0 0DONIPHAN 283 130 413 10 0 10DOUGLAS 19 126 145 0 0 0EDWARDS 0 1,298 1,298 0 0 0ELK * * * * * * ELLIS 9 50 58 0 0 0ELLSWORTH 0 63 63 0 0 0FINNEY 0 466 466 0 0 0FORD 0 29 29 0 0 0FRANKLIN 4 0 4 0 0 0GEARY 0 130 130 0 0 0GOVE 0 98 98 0 0 0GRAHAM 0 116 116 0 0 0GRANT 0 4,013 4,013 0 0 0GRAY 0 1,025 1,025 5 0 5GREELEY 0 0 0 0 0 0GREENWOOD 0 99 99 0 0 0HAMILTON 0 1,444 1,444 0 0 0HARPER 0 136 136 0 0 0HARVEY 0 120 120 0 0 0HASKELL 0 503 503 0 0 0HODGEMAN 0 7,982 7,982 0 0 0JACKSON 0 642 642 0 0 0JEFFERSON 197 215 411 0 0 0JEWELL 0 67 67 0 0 0JOHNSON * * * * * * KEARNY 0 1,146 1,146 0 0 0KINGMAN 0 540 540 0 0 0KIOWA 0 8,935 8,935 0 0 0LABETTE 0 66 66 43 0 43LANE 0 0 0 0 0 0LEAVENWORTH 128 0 128 0 0 0LINCOLN 0 93 93 0 0 0LINN 0 659 659 0 0 0LOGAN 0 0 0 0 0 0LYON 69 308 377 0 0 0
90

County NameIntroduced
GrassNative Grass Total
GrassHardwood
TreesSoftwood
TreesTotal Trees
Table 4 -- Description of Signup 45 Acceptable Acres 1/KANSAS
MCPHERSON 0 259 259 0 0 0MARION 0 230 230 0 0 0MARSHALL 0 494 494 3 0 3MEADE 0 724 724 0 0 0MIAMI * * * * * * MITCHELL 0 85 85 0 0 0MORRIS 0 338 338 0 0 0MORTON 0 1,137 1,137 0 0 0NEMAHA 0 431 431 0 0 0NEOSHO 0 446 446 0 0 0NESS 0 493 493 0 0 0NORTON 0 514 514 0 0 0OSAGE 0 304 304 0 0 0OSBORNE 20 0 20 0 0 0OTTAWA 0 468 468 0 0 0PAWNEE 0 0 0 0 0 0PHILLIPS 0 11 11 0 0 0POTTAWATOMIE 10 10 19 0 0 0PRATT 0 3,516 3,516 0 0 0RAWLINS 0 55 55 0 0 0RENO 0 11,856 11,856 0 0 0REPUBLIC 0 62 62 0 0 0RICE 0 936 936 0 0 0RILEY 0 155 155 0 0 0ROOKS * * * * * * RUSH 0 414 414 0 0 0RUSSELL 0 151 151 0 0 0SALINE 0 22 22 0 0 0SEDGWICK * * * * * * SEWARD 141 1,236 1,376 0 0 0SHAWNEE 0 22 22 0 0 0SHERIDAN 0 12 12 0 0 0SHERMAN 0 794 794 0 0 0SMITH * * * * * * STAFFORD 0 3,871 3,871 0 0 0STANTON 0 1,215 1,215 0 0 0STEVENS 0 7,201 7,201 0 0 0SUMNER * * * * * * THOMAS 0 0 0 0 0 0TREGO 0 0 0 0 0 0WABAUNSEE 77 44 120 0 0 0WALLACE 0 4 4 0 0 0WASHINGTON 159 2,439 2,599 0 0 0WICHITA 0 0 0 0 0 0WILSON 0 164 164 0 0 0WOODSON 0 242 242 0 0 0
* Data withheld to avoid disclosure of individual operations.1/ Not including practices: permanent wildlife habitat, wildlife food plots, rare and declining habitat, and pollinator habitat.
91

KE
NT
UC
KY
92
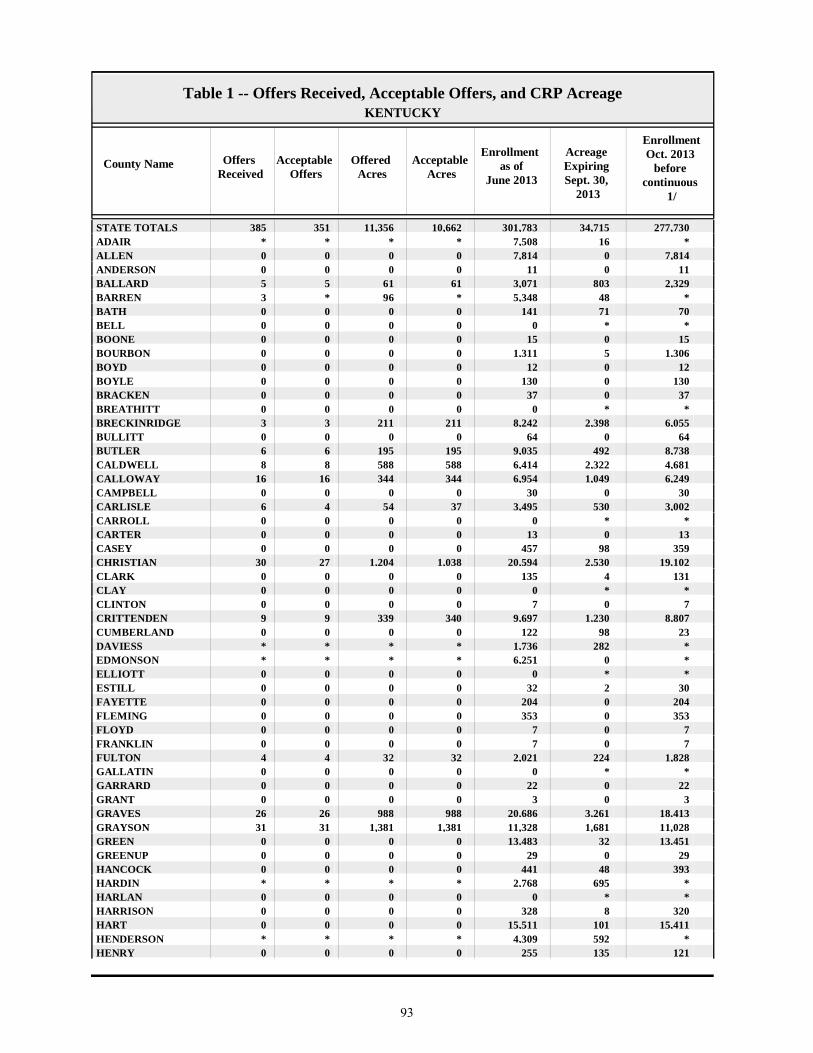
County Name Offers Received
Acceptable Offers
Offered Acres
Acceptable Acres
EnrollmentOct. 2013
before continuous
1/
Acreage Expiring Sept. 30,
2013
Enrollment as of
June 2013
Table 1 -- Offers Received, Acceptable Offers, and CRP AcreageKENTUCKY
STATE TOTALS 385 351 11,356 10,662 277,73034,715301,783ADAIR * * * * * 167,508ALLEN 0 0 0 0 7,81407,814ANDERSON 0 0 0 0 11011BALLARD 5 5 61 61 2,3298033,071BARREN 3 * 96 * * 485,348BATH 0 0 0 0 7071141BELL 0 0 0 0 * * 0BOONE 0 0 0 0 15015BOURBON 0 0 0 0 1,30651,311BOYD 0 0 0 0 12012BOYLE 0 0 0 0 1300130BRACKEN 0 0 0 0 37037BREATHITT 0 0 0 0 * * 0BRECKINRIDGE 3 3 211 211 6,0552,3988,242BULLITT 0 0 0 0 64064BUTLER 6 6 195 195 8,7384929,035CALDWELL 8 8 588 588 4,6812,3226,414CALLOWAY 16 16 344 344 6,2491,0496,954CAMPBELL 0 0 0 0 30030CARLISLE 6 4 54 37 3,0025303,495CARROLL 0 0 0 0 * * 0CARTER 0 0 0 0 13013CASEY 0 0 0 0 35998457CHRISTIAN 30 27 1,204 1,038 19,1022,53020,594CLARK 0 0 0 0 1314135CLAY 0 0 0 0 * * 0CLINTON 0 0 0 0 707CRITTENDEN 9 9 339 340 8,8071,2309,697CUMBERLAND 0 0 0 0 2398122DAVIESS * * * * * 2821,736EDMONSON * * * * * 06,251ELLIOTT 0 0 0 0 * * 0ESTILL 0 0 0 0 30232FAYETTE 0 0 0 0 2040204FLEMING 0 0 0 0 3530353FLOYD 0 0 0 0 707FRANKLIN 0 0 0 0 707FULTON 4 4 32 32 1,8282242,021GALLATIN 0 0 0 0 * * 0GARRARD 0 0 0 0 22022GRANT 0 0 0 0 303GRAVES 26 26 988 988 18,4133,26120,686GRAYSON 31 31 1,381 1,381 11,0281,68111,328GREEN 0 0 0 0 13,4513213,483GREENUP 0 0 0 0 29029HANCOCK 0 0 0 0 39348441HARDIN * * * * * 6952,768HARLAN 0 0 0 0 * * 0HARRISON 0 0 0 0 3208328HART 0 0 0 0 15,41110115,511HENDERSON * * * * * 5924,309HENRY 0 0 0 0 121135255
93

County Name Offers Received
Acceptable Offers
Offered Acres
Acceptable Acres
EnrollmentOct. 2013
before continuous
1/
Acreage Expiring Sept. 30,
2013
Enrollment as of
June 2013
Table 1 -- Offers Received, Acceptable Offers, and CRP AcreageKENTUCKY
HICKMAN 15 14 141 140 3,6601,1034,624HOPKINS 25 25 651 651 7,5772,1609,087JACKSON 0 0 0 0 202JEFFERSON 0 0 0 0 39039JESSAMINE 0 0 0 0 14014JOHNSON 0 0 0 0 * * 0KENTON 0 0 0 0 808KNOTT 0 0 0 0 * * 0KNOX 0 0 0 0 16016LARUE 0 0 0 0 25499353LAUREL 0 0 0 0 * * 0LAWRENCE 0 0 0 0 * * 0LEE 0 0 0 0 707LESLIE 0 0 0 0 * * 0LETCHER 0 0 0 0 * * 0LEWIS 0 0 0 0 35035LINCOLN 0 0 0 0 2680268LIVINGSTON 3 3 55 55 6,6426117,198LOGAN 46 26 1,289 937 18,5521,96019,576LYON * * * * * 114981MCCRACKEN * * * * * 2052,429MCCREARY 0 0 0 0 * * 0MCLEAN 9 9 152 152 2,9763613,185MADISON 0 0 0 0 85085MAGOFFIN 0 0 0 0 202MARION 0 0 0 0 1,1462501,396MARSHALL 34 33 955 931 5,5852,2016,855MARTIN 0 0 0 0 * * 0MASON 0 0 0 0 17137207MEADE 0 0 0 0 1,1623031,465MENIFEE 0 0 0 0 459MERCER 0 0 0 0 1903193METCALFE 0 0 0 0 5,578535,630MONROE * * * * * 12161MONTGOMERY 0 0 0 0 2402243MORGAN 0 0 0 0 * * 0MUHLENBERG 27 27 653 653 8,6601,4459,452NELSON 0 0 0 0 78358841NICHOLAS 0 0 0 0 7731109OHIO 4 4 20 20 1,6811861,846OLDHAM 0 0 0 0 12713140OWEN 0 0 0 0 37037OWSLEY 0 0 0 0 * * 0PENDLETON 0 0 0 0 1520152PERRY 0 0 0 0 * * 0PIKE 0 0 0 0 * * 0POWELL 0 0 0 0 606PULASKI 0 0 0 0 80080ROBERTSON 0 0 0 0 101ROCKCASTLE 0 0 0 0 29635ROWAN 0 0 0 0 * * 0RUSSELL 0 0 0 0 1,29901,299SCOTT 0 0 0 0 38038
94
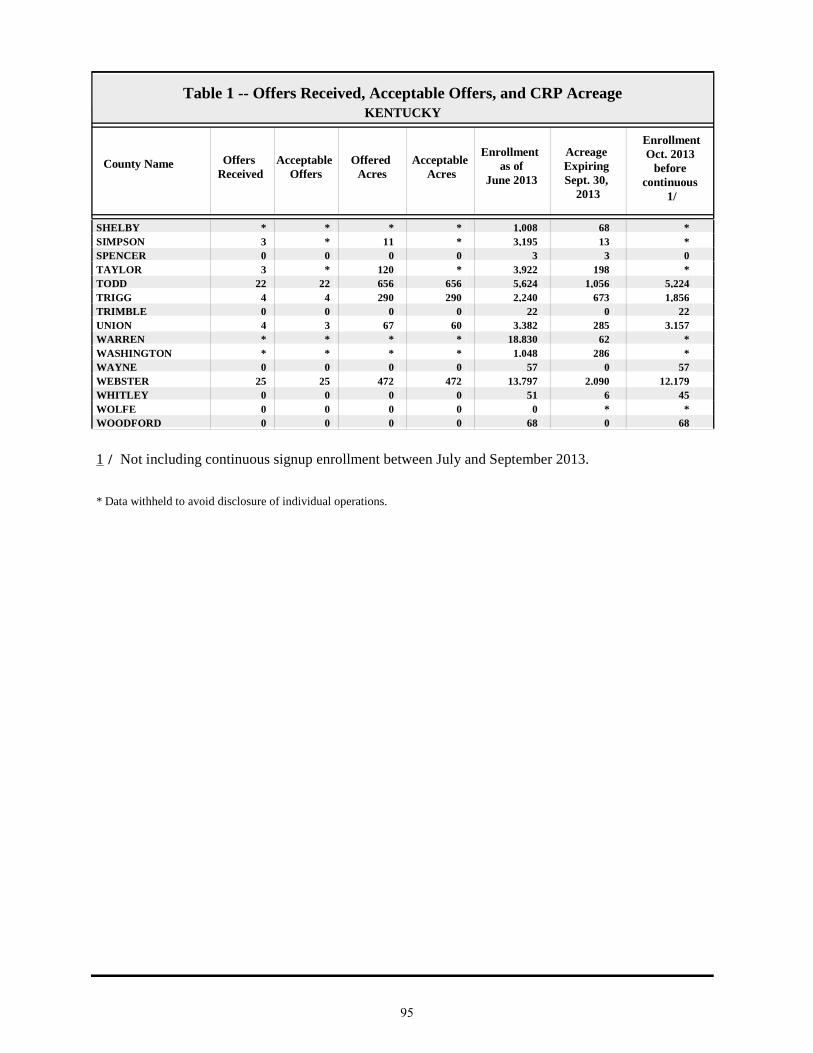
County Name Offers Received
Acceptable Offers
Offered Acres
Acceptable Acres
EnrollmentOct. 2013
before continuous
1/
Acreage Expiring Sept. 30,
2013
Enrollment as of
June 2013
Table 1 -- Offers Received, Acceptable Offers, and CRP AcreageKENTUCKY
SHELBY * * * * * 681,008SIMPSON 3 * 11 * * 133,195SPENCER 0 0 0 0 033TAYLOR 3 * 120 * * 1983,922TODD 22 22 656 656 5,2241,0565,624TRIGG 4 4 290 290 1,8566732,240TRIMBLE 0 0 0 0 22022UNION 4 3 67 60 3,1572853,382WARREN * * * * * 6218,830WASHINGTON * * * * * 2861,048WAYNE 0 0 0 0 57057WEBSTER 25 25 472 472 12,1792,09013,797WHITLEY 0 0 0 0 45651WOLFE 0 0 0 0 * * 0WOODFORD 0 0 0 0 68068
1 / Not including continuous signup enrollment between July and September 2013.
* Data withheld to avoid disclosure of individual operations.
95

County NameExpiring
Sept. 2013 (Acres)
New Lands (Acres) 1/
Average Rental
Payment ($/Acre)
Total Rental
Payment ($/year)
Average EBI Score
without Cost
Average EBI Score with Cost
Table 2 -- Description of Signup 45 Acceptable AcresKENTUCKY
STATE TOTALS 9,507 1,155 $154.21 $1,644,169 249 289ADAIR * * * * * * BALLARD 61 0 $119.21 $7,272 207 264BARREN * * * * * * BRECKINRIDGE 205 6 $114.27 $24,088 200 259BUTLER 142 53 $127.23 $24,746 285 338CALDWELL 507 81 $135.05 $79,450 290 338CALLOWAY 344 0 $112.04 $38,552 215 277CARLISLE 35 2 $122.09 $4,505 269 325CHRISTIAN 1,003 36 $206.09 $214,027 271 281CRITTENDEN 294 45 $171.60 $58,259 254 282DAVIESS * * * * * * EDMONSON * * * * * * FULTON 13 19 $143.74 $4,542 277 321GRAVES 929 59 $136.13 $134,569 205 253GRAYSON 1,162 219 $128.50 $177,462 257 314HARDIN * * * * * * HENDERSON * * * * * * HICKMAN 131 8 $132.47 $18,493 226 275HOPKINS 648 3 $141.02 $91,819 257 302LIVINGSTON 55 0 $75.70 $4,133 196 295LOGAN 776 161 $211.12 $197,837 232 241LYON * * * * * * MCCRACKEN * * * * * * MCLEAN 139 13 $145.44 $22,165 264 309MARSHALL 914 18 $121.61 $113,254 247 303MONROE * * * * * * MUHLENBERG 629 24 $131.75 $86,056 257 308OHIO 5 14 $130.96 $2,580 255 323SHELBY * * * * * * SIMPSON * * * * * * TAYLOR * * * * * * TODD 493 164 $198.37 $130,212 303 317TRIGG 290 0 $178.55 $51,709 186 221UNION 60 0 $213.92 $12,793 223 230WARREN * * * * * * WASHINGTON * * * * * * WEBSTER 473 0 $179.26 $84,701 269 297
* Data withheld to avoid disclosure of individual operations.
1/ Includes land that may have been in CRP in the past.
96

County Name
EI>=8 (Acres)
National Priority
Area
State Priority
Area (Acres)
Rare and Declining Habitat (Acres)
Permanent Wildlife Habitat (Acres)
Pollinator Habitat Offers
Table 3 -- Description of Signup 45 Acceptable AcresKENTUCKY
Average Erodibility Index (EI)
Pollinator Habitat (Acres)
STATE TOTALS 10,378 0 9,916 3,355 9 837 33ADAIR * * * * * * * * BALLARD 61 0 61 0 0 029 0BARREN * * * * * * * * BRECKINRIDGE 211 0 211 0 0 018 0BUTLER 195 0 195 155 0 141 11CALDWELL 588 0 588 424 0 056 0CALLOWAY 342 0 344 0 0 148 2CARLISLE 37 0 37 0 0 079 0CHRISTIAN 1,024 0 1,039 443 0 030 0CRITTENDEN 340 0 307 30 0 050 0DAVIESS * * * * * * * * EDMONSON * * * * * * * * FULTON 32 0 32 0 0 050 0GRAVES 989 0 989 0 0 065 0GRAYSON 1,350 0 1,381 284 0 025 0HARDIN * * * * * * * * HENDERSON * * * * * * * * HICKMAN 110 0 140 0 5 046 0HOPKINS 630 0 651 253 0 028 0LIVINGSTON 45 0 39 0 0 061 0LOGAN 937 0 937 468 0 028 0LYON * * * * * * * * MCCRACKEN * * * * * * * * MCLEAN 115 0 152 98 0 328 7MARSHALL 819 0 931 195 0 036 0MONROE * * * * * * * * MUHLENBERG 653 0 653 168 0 039 0OHIO 20 0 20 14 4 035 0SHELBY * * * * * * * * SIMPSON * * * * * * * * TAYLOR * * * * * * * * TODD 630 0 656 630 0 031 0TRIGG 290 0 0 24 0 034 0UNION 60 0 0 0 0 038 0WARREN * * * * * * * * WASHINGTON * * * * * * * * WEBSTER 473 0 473 0 0 032 0
* Data withheld to avoid disclosure of individual operations.Note: Acceptable acres may be listed in multiple categories.
97
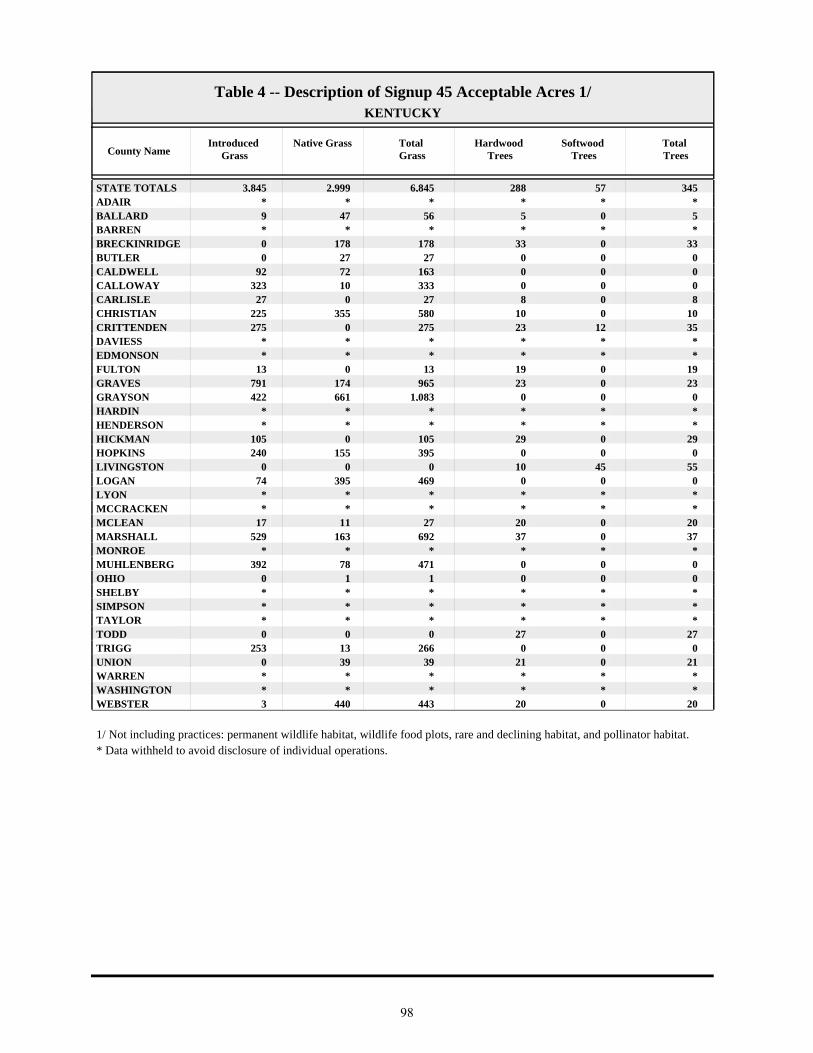
County NameIntroduced
GrassNative Grass Total
GrassHardwood
TreesSoftwood
TreesTotal Trees
Table 4 -- Description of Signup 45 Acceptable Acres 1/KENTUCKY
STATE TOTALS 3,845 2,999 6,845 288 57 345ADAIR * * * * * * BALLARD 9 47 56 5 0 5BARREN * * * * * * BRECKINRIDGE 0 178 178 33 0 33BUTLER 0 27 27 0 0 0CALDWELL 92 72 163 0 0 0CALLOWAY 323 10 333 0 0 0CARLISLE 27 0 27 8 0 8CHRISTIAN 225 355 580 10 0 10CRITTENDEN 275 0 275 23 12 35DAVIESS * * * * * * EDMONSON * * * * * * FULTON 13 0 13 19 0 19GRAVES 791 174 965 23 0 23GRAYSON 422 661 1,083 0 0 0HARDIN * * * * * * HENDERSON * * * * * * HICKMAN 105 0 105 29 0 29HOPKINS 240 155 395 0 0 0LIVINGSTON 0 0 0 10 45 55LOGAN 74 395 469 0 0 0LYON * * * * * * MCCRACKEN * * * * * * MCLEAN 17 11 27 20 0 20MARSHALL 529 163 692 37 0 37MONROE * * * * * * MUHLENBERG 392 78 471 0 0 0OHIO 0 1 1 0 0 0SHELBY * * * * * * SIMPSON * * * * * * TAYLOR * * * * * * TODD 0 0 0 27 0 27TRIGG 253 13 266 0 0 0UNION 0 39 39 21 0 21WARREN * * * * * * WASHINGTON * * * * * * WEBSTER 3 440 443 20 0 20
* Data withheld to avoid disclosure of individual operations.1/ Not including practices: permanent wildlife habitat, wildlife food plots, rare and declining habitat, and pollinator habitat.
98
LO
UIS
IAN
A
99

County Name Offers Received
Acceptable Offers
Offered Acres
Acceptable Acres
EnrollmentOct. 2013
before continuous
1/
Acreage Expiring Sept. 30,
2013
Enrollment as of
June 2013
Table 1 -- Offers Received, Acceptable Offers, and CRP AcreageLOUISIANA
STATE TOTALS 111 101 6,479 5,955 295,85723,632313,533ACADIA 0 0 0 0 701079ALLEN 0 0 0 0 2370237ASCENSION 0 0 0 0 * * 0ASSUMPTION 0 0 0 0 * * 0AVOYELLES 9 9 1,013 1,013 13,9261,66414,577BEAUREGARD 4 * 169 * * 1,8975,870BIENVILLE 0 0 0 0 32032BOSSIER 0 0 0 0 4530453CADDO 0 0 0 0 83107189CALCASIEU 0 0 0 0 * * 0CALDWELL 0 0 0 0 6,4467417,186CAMERON 0 0 0 0 * * 0CATAHOULA * * * * * 1,68926,565CLAIBORNE 0 0 0 0 30030CONCORDIA 0 0 0 0 35,97929936,279DESOTO * * * * * 520992E BATON ROUGE 0 0 0 0 1610161E CARROLL 4 4 126 126 13,8441,35415,071E FELICIANA 6 6 702 702 5,9696415,908EVANGELINE * * * * * 1903,684FRANKLIN 12 12 857 857 27,7761,81228,731GRANT 0 0 0 0 1,09501,095IBERIA 0 0 0 0 11011IBERVILLE 0 0 0 0 71071JACKSON 0 0 0 0 * * 0JEFFERSON 0 0 0 0 * * 0JEFFERSON DAVIS 0 0 0 0 261519780LAFAYETTE 0 0 0 0 * * 0LAFOURCHE 0 0 0 0 * * 0LA SALLE * * * * * 99532LINCOLN 0 0 0 0 08787LIVINGSTON 0 0 0 0 303MADISON * 0 * 0 18,5401,92720,467MOREHOUSE * * * * * 27212,043NATCHITOCHES 3 * 46 * * 40311,578ORLEANS 0 0 0 0 * * 0OUACHITA 0 0 0 0 3,3231853,508PLAQUEMINES 0 0 0 0 * * 0PT COUPEE 0 0 0 0 * * 0RAPIDES 0 0 0 0 3,66603,666RED RIVER * * * * * 1,1309,467RICHLAND 17 17 872 872 28,6601,32029,108SABINE 0 0 0 0 43043ST BERNARD 0 0 0 0 * * 0ST CHARLES 0 0 0 0 * * 0ST HELENA 0 0 0 0 67962741ST JAMES 0 0 0 0 * * 0ST JOHN THE BAPT 0 0 0 0 * * 0ST LANDRY 0 0 0 0 4,91004,910ST MARTIN 0 0 0 0 42042ST MARY 0 0 0 0 * * 0ST TAMMANY 0 0 0 0 * * 0
100

County Name Offers Received
Acceptable Offers
Offered Acres
Acceptable Acres
EnrollmentOct. 2013
before continuous
1/
Acreage Expiring Sept. 30,
2013
Enrollment as of
June 2013
Table 1 -- Offers Received, Acceptable Offers, and CRP AcreageLOUISIANA
TANGIPAHOA 0 0 0 0 1,8262212,047TENSAS 0 0 0 0 19,4601,07820,538TERREBONNE 0 0 0 0 * * 0UNION 0 0 0 0 01111VERMILLION 0 0 0 0 * * 0VERNON * * * * * 31181WASHINGTON * * * * * 58561WEBSTER 0 0 0 0 * * 0W BATON ROUGE 0 0 0 0 505W CARROLL 43 38 1,916 1,565 39,0435,12942,607W FELICIANA * * * * * 1783,143WINN 0 0 0 0 2440244
1 / Not including continuous signup enrollment between July and September 2013.
* Data withheld to avoid disclosure of individual operations.
101

County NameExpiring
Sept. 2013 (Acres)
New Lands (Acres) 1/
Average Rental
Payment ($/Acre)
Total Rental
Payment ($/year)
Average EBI Score
without Cost
Average EBI Score with Cost
Table 2 -- Description of Signup 45 Acceptable AcresLOUISIANA
STATE TOTALS 5,679 277 $59.79 $356,094 164 266AVOYELLES 974 39 $70.69 $71,619 150 243BEAUREGARD * * * * * * CATAHOULA * * * * * * DESOTO * * * * * * E CARROLL 126 0 $114.36 $14,443 217 290E FELICIANA 591 111 $20.35 $14,282 199 313EVANGELINE * * * * * * FRANKLIN 857 0 $87.21 $74,732 207 292LA SALLE * * * * * * MOREHOUSE * * * * * * NATCHITOCHES * * * * * * RED RIVER * * * * * * RICHLAND 872 0 $57.75 $50,364 148 263VERNON * * * * * * WASHINGTON * * * * * * W CARROLL 1,539 26 $55.40 $86,673 144 252W FELICIANA * * * * * *
* Data withheld to avoid disclosure of individual operations.
1/ Includes land that may have been in CRP in the past.
102

County Name
EI>=8 (Acres)
National Priority
Area
State Priority
Area (Acres)
Rare and Declining Habitat (Acres)
Permanent Wildlife Habitat (Acres)
Pollinator Habitat Offers
Table 3 -- Description of Signup 45 Acceptable AcresLOUISIANA
Average Erodibility Index (EI)
Pollinator Habitat (Acres)
STATE TOTALS 4,307 2,248 2,098 0 0 013 0AVOYELLES 203 1,013 494 0 0 07 0BEAUREGARD * * * * * * * * CATAHOULA * * * * * * * * DESOTO * * * * * * * * E CARROLL 0 0 126 0 0 06 0E FELICIANA 702 702 0 0 0 032 0EVANGELINE * * * * * * * * FRANKLIN 657 0 667 0 0 010 0LA SALLE * * * * * * * * MOREHOUSE * * * * * * * * NATCHITOCHES * * * * * * * * RED RIVER * * * * * * * * RICHLAND 756 0 314 0 0 010 0VERNON * * * * * * * * WASHINGTON * * * * * * * * W CARROLL 1,429 0 209 0 0 012 0W FELICIANA * * * * * * * *
* Data withheld to avoid disclosure of individual operations.Note: Acceptable acres may be listed in multiple categories.
103

County NameIntroduced
GrassNative Grass Total
GrassHardwood
TreesSoftwood
TreesTotal Trees
Table 4 -- Description of Signup 45 Acceptable Acres 1/LOUISIANA
STATE TOTALS 159 53 212 1,298 4,404 5,702AVOYELLES 0 0 0 782 232 1,013BEAUREGARD * * * * * * CATAHOULA * * * * * * DESOTO * * * * * * E CARROLL 0 0 0 126 0 126E FELICIANA 159 0 159 0 515 515EVANGELINE * * * * * * FRANKLIN 0 5 5 80 770 850LA SALLE * * * * * * MOREHOUSE * * * * * * NATCHITOCHES * * * * * * RED RIVER * * * * * * RICHLAND 0 0 0 38 835 872VERNON * * * * * * WASHINGTON * * * * * * W CARROLL 0 48 48 86 1,429 1,515W FELICIANA * * * * * *
* Data withheld to avoid disclosure of individual operations.1/ Not including practices: permanent wildlife habitat, wildlife food plots, rare and declining habitat, and pollinator habitat.
104

MAINE
105

County Name Offers Received
Acceptable Offers
Offered Acres
Acceptable Acres
EnrollmentOct. 2013
before continuous
1/
Acreage Expiring Sept. 30,
2013
Enrollment as of
June 2013
Table 1 -- Offers Received, Acceptable Offers, and CRP AcreageMAINE
STATE TOTALS 8 6 194 167 8,9354339,201ANDROSCOGGIN 0 0 0 0 505HOULTON * * * * * 52376AROOSTOOK 0 0 0 0 5,5083355,843FORT KENT 5 4 99 84 2,685272,628CUMBERLAND 0 0 0 0 * * 0FRANKLIN 0 0 0 0 291745HANCOCK 0 0 0 0 * * 0KENNEBEC 0 0 0 0 * * 0KNOX 0 0 0 0 * * 0LINCOLN 0 0 0 0 * * 0OXFORD 0 0 0 0 13316PENOBSCOT * * * * * 0288PISCATAQUIS 0 0 0 0 * * 0SAGADAHOC 0 0 0 0 * * 0SOMERSET 0 0 0 0 * * 0WALDO 0 0 0 0 * * 0WASHINGTON 0 0 0 0 000YORK 0 0 0 0 * * 0
1 / Not including continuous signup enrollment between July and September 2013.
* Data withheld to avoid disclosure of individual operations.
106
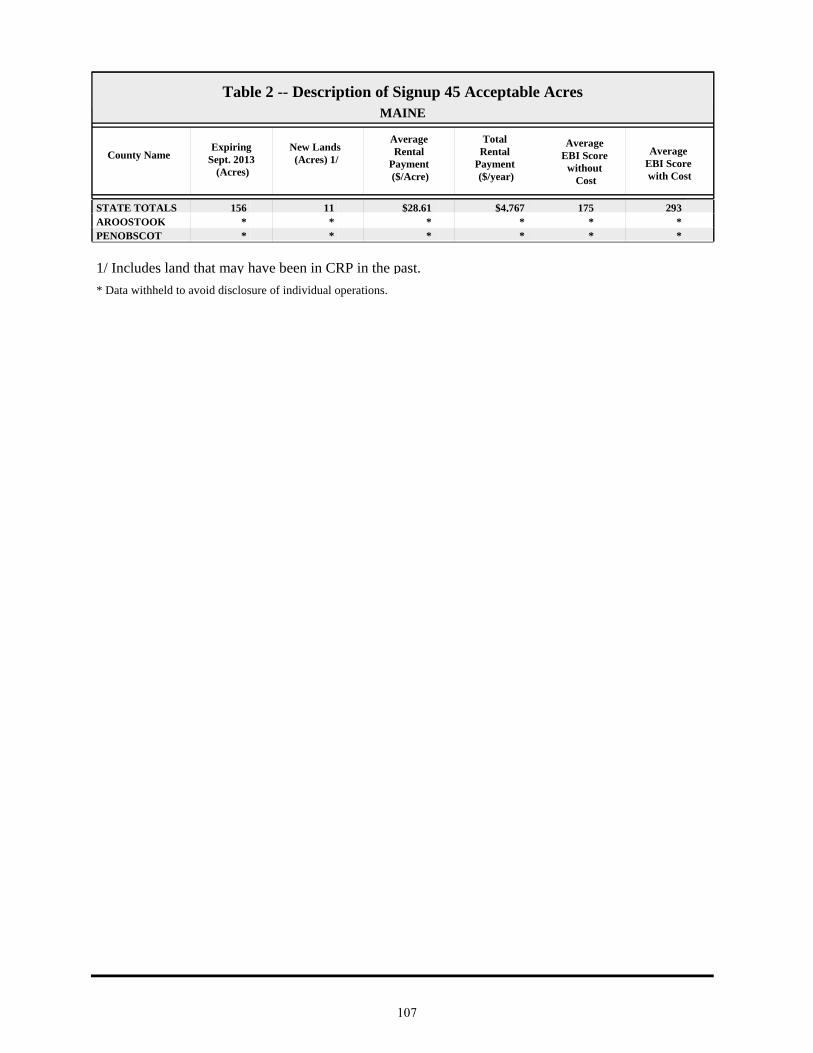
County NameExpiring
Sept. 2013 (Acres)
New Lands (Acres) 1/
Average Rental
Payment ($/Acre)
Total Rental
Payment ($/year)
Average EBI Score
without Cost
Average EBI Score with Cost
Table 2 -- Description of Signup 45 Acceptable AcresMAINE
STATE TOTALS 156 11 $28.61 $4,767 175 293AROOSTOOK * * * * * * PENOBSCOT * * * * * *
* Data withheld to avoid disclosure of individual operations.
1/ Includes land that may have been in CRP in the past.
107

County Name
EI>=8 (Acres)
National Priority
Area
State Priority
Area (Acres)
Rare and Declining Habitat (Acres)
Permanent Wildlife Habitat (Acres)
Pollinator Habitat Offers
Table 3 -- Description of Signup 45 Acceptable AcresMAINE
Average Erodibility Index (EI)
Pollinator Habitat (Acres)
STATE TOTALS 167 0 83 0 0 024 0AROOSTOOK * * * * * * * * PENOBSCOT * * * * * * * *
* Data withheld to avoid disclosure of individual operations.Note: Acceptable acres may be listed in multiple categories.
108

County NameIntroduced
GrassNative Grass Total
GrassHardwood
TreesSoftwood
TreesTotal Trees
Table 4 -- Description of Signup 45 Acceptable Acres 1/MAINE
STATE TOTALS 167 0 167 0 0 0AROOSTOOK * * * * * * PENOBSCOT * * * * * *
* Data withheld to avoid disclosure of individual operations.1/ Not including practices: permanent wildlife habitat, wildlife food plots, rare and declining habitat, and pollinator habitat.
109

MA
RY
LA
ND
110

County Name Offers Received
Acceptable Offers
Offered Acres
Acceptable Acres
EnrollmentOct. 2013
before continuous
1/
Acreage Expiring Sept. 30,
2013
Enrollment as of
June 2013
Table 1 -- Offers Received, Acceptable Offers, and CRP AcreageMARYLAND
STATE TOTALS 18 16 253 248 65,6229,91175,284ALLEGANY 0 0 0 0 72938767ANNE ARUNDEL 0 0 0 0 43043BALTIMORE * * * * * 113539CALVERT 0 0 0 0 1600160CAROLINE 0 0 0 0 3,2148174,031CARROLL * * * * * 6167,966CECIL 0 0 0 0 2,1841402,324CHARLES 0 0 0 0 1,438471,485DORCHESTER 0 0 0 0 7,5651,0288,593FREDERICK 0 0 0 0 4,4637405,204GARRETT 0 0 0 0 1,034361,070HARFORD 0 0 0 0 9002321,132HOWARD 0 0 0 0 336113449KENT 4 4 58 58 4,7007585,400MONTGOMERY 0 0 0 0 1,2061261,332PRINCE GEORGES 0 0 0 0 38234417QUEEN ANNES 9 8 116 113 7,9672,0419,895ST MARYS 0 0 0 0 1,0961081,204SOMERSET 0 0 0 0 3,5198214,340TALBOT * * * * * 1,1065,084WASHINGTON 0 0 0 0 1,7092001,909WICOMICO 0 0 0 0 5,0682145,282WORCESTER 0 0 0 0 6,0775836,660BALTIMORE CITY 0 0 0 0 * * 0
1 / Not including continuous signup enrollment between July and September 2013.
* Data withheld to avoid disclosure of individual operations.
111

County NameExpiring
Sept. 2013 (Acres)
New Lands (Acres) 1/
Average Rental
Payment ($/Acre)
Total Rental
Payment ($/year)
Average EBI Score
without Cost
Average EBI Score with Cost
Table 2 -- Description of Signup 45 Acceptable AcresMARYLAND
STATE TOTALS 186 62 $112.94 $28,031 183 252BALTIMORE * * * * * * CARROLL * * * * * * KENT 16 43 $138.54 $8,091 193 245QUEEN ANNES 113 0 $107.72 $12,194 176 251TALBOT * * * * * *
* Data withheld to avoid disclosure of individual operations.
1/ Includes land that may have been in CRP in the past.
112

County Name
EI>=8 (Acres)
National Priority
Area
State Priority
Area (Acres)
Rare and Declining Habitat (Acres)
Permanent Wildlife Habitat (Acres)
Pollinator Habitat Offers
Table 3 -- Description of Signup 45 Acceptable AcresMARYLAND
Average Erodibility Index (EI)
Pollinator Habitat (Acres)
STATE TOTALS 70 248 0 0 47 09 0BALTIMORE * * * * * * * * CARROLL * * * * * * * * KENT 10 58 0 0 0 06 0QUEEN ANNES 19 113 0 0 31 04 0TALBOT * * * * * * * *
* Data withheld to avoid disclosure of individual operations.Note: Acceptable acres may be listed in multiple categories.
113

County NameIntroduced
GrassNative Grass Total
GrassHardwood
TreesSoftwood
TreesTotal Trees
Table 4 -- Description of Signup 45 Acceptable Acres 1/MARYLAND
STATE TOTALS 41 135 176 14 6 20BALTIMORE * * * * * * CARROLL * * * * * * KENT 6 38 44 12 0 12QUEEN ANNES 0 77 77 2 0 2TALBOT * * * * * *
* Data withheld to avoid disclosure of individual operations.1/ Not including practices: permanent wildlife habitat, wildlife food plots, rare and declining habitat, and pollinator habitat.
114

MA
SS
AC
HU
SE
TT
S
115

County Name Offers Received
Acceptable Offers
Offered Acres
Acceptable Acres
EnrollmentOct. 2013
before continuous
1/
Acreage Expiring Sept. 30,
2013
Enrollment as of
June 2013
Table 1 -- Offers Received, Acceptable Offers, and CRP AcreageMASSACHUSETTS
STATE TOTALS 0 0 0 0 10010BARNSTABLE 0 0 0 0 * * 0BERKSHIRE 0 0 0 0 * * 0BRISTOL 0 0 0 0 * * 0DUKES 0 0 0 0 * * 0ESSEX 0 0 0 0 * * 0FRANKLIN 0 0 0 0 10010HAMPDEN 0 0 0 0 * * 0HAMPSHIRE 0 0 0 0 * * 0MIDDLESEX 0 0 0 0 * * 0NANTUCKET 0 0 0 0 * * 0NORFOLK 0 0 0 0 * * 0PLYMOUTH 0 0 0 0 * * 0SUFFOLK 0 0 0 0 * * 0WORCESTER 0 0 0 0 * * 0
1 / Not including continuous signup enrollment between July and September 2013.
* Data withheld to avoid disclosure of individual operations.
116

MICHIGAN
117

County Name Offers Received
Acceptable Offers
Offered Acres
Acceptable Acres
EnrollmentOct. 2013
before continuous
1/
Acreage Expiring Sept. 30,
2013
Enrollment as of
June 2013
Table 1 -- Offers Received, Acceptable Offers, and CRP AcreageMICHIGAN
STATE TOTALS 548 419 14,329 10,961 176,61943,375209,033ALCONA 0 0 0 0 404ALGER 0 0 0 0 * * 0ALLEGAN 6 * 128 * * 3612,050ALPENA 0 0 0 0 481058ANTRIM 0 0 0 0 286694ARENAC 12 * 142 * * 2116,937BARAGA 0 0 0 0 303BARRY 32 20 732 431 5,8232,1717,564BAY 4 4 96 96 4,6192704,792BENZIE 0 0 0 0 14014BERRIEN 13 12 251 236 1,3403991,503BRANCH 32 30 752 708 6,3412,9318,564CALHOUN 19 14 687 398 3,8011,6725,074CASS 24 19 364 338 2,4356522,749CHARLEVOIX 0 0 0 0 06868CHEBOYGAN 0 0 0 0 10010CHIPPEWA * * * * * 5330CLARE * * * * * 1251,157CLINTON 35 34 718 711 4,1761,5254,990CRAWFORD 0 0 0 0 * * 0DELTA 0 0 0 0 * * 0DICKINSON 0 0 0 0 415EATON 15 15 316 316 3,7531,5294,966EMMET 0 0 0 0 14014GENESEE * * * * * 53701GLADWIN 5 3 190 126 2,7172592,850GOGEBIC 0 0 0 0 * * 0GRAND TRAVERSE 3 3 76 76 17494192GRATIOT 15 11 465 275 7,5219348,181HILLSDALE 62 57 1,367 1,223 14,2915,51418,582HOUGHTON 0 0 0 0 145HURON 24 17 763 571 14,0381,91915,385INGHAM * 0 * 0 1,0111041,116IONIA 42 42 1,126 1,126 3,9122,5655,352IOSCO * * * * * 9880IRON 0 0 0 0 * * 0ISABELLA 13 12 296 290 4,2271,8945,831JACKSON 9 8 171 151 1,4186041,871KALAMAZOO 4 4 106 106 762149805KALKASKA 0 0 0 0 15015KENT 6 4 165 108 654370917KEWEENAW 0 0 0 0 * * 0LAKE 0 0 0 0 51051LAPEER 6 * 357 * * 4981,319LEELANAU 0 0 0 0 404LENAWEE 35 26 960 703 23,6935,39928,389LIVINGSTON 0 0 0 0 2250225LUCE 0 0 0 0 * * 0MACKINAC * * * * * 04MACOMB 0 0 0 0 * * 0MANISTEE 0 0 0 0 13013MARQUETTE 0 0 0 0 404
118

County Name Offers Received
Acceptable Offers
Offered Acres
Acceptable Acres
EnrollmentOct. 2013
before continuous
1/
Acreage Expiring Sept. 30,
2013
Enrollment as of
June 2013
Table 1 -- Offers Received, Acceptable Offers, and CRP AcreageMICHIGAN
MASON 0 0 0 0 44982532MECOSTA 9 7 211 161 1,2296261,693MENOMINEE 0 0 0 0 17219MIDLAND 3 * 26 * * 2444,251MISSAUKEE * 0 * 0 12915143MONROE * * * * * 1522,854MONTCALM 15 10 380 296 2,7071,2403,652MONTMORENCY 0 0 0 0 * * 0MUSKEGON 3 * 26 * * 74425NEWAYGO 3 * 20 * * 136496OAKLAND 0 0 0 0 22022OCEANA 0 0 0 0 4658472OGEMAW * * * * * 0772ONTONAGON 0 0 0 0 7714OSCEOLA 6 5 146 122 766347992OSCODA 0 0 0 0 48048OTSEGO 0 0 0 0 * * 0OTTAWA 3 3 156 156 692349886PRESQUE ISLE * * * * * 0367ROSCOMMON 0 0 0 0 * * 0SAGINAW * * * * * 17012,283ST CLAIR 0 0 0 0 1630163ST JOSEPH 6 4 200 162 2,8186243,281SANILAC 15 9 789 660 7,8173,35410,511SCHOOLCRAFT 0 0 0 0 * * 0SHIAWASSEE 7 6 223 217 3,3413943,518TUSCOLA 40 12 1,308 441 12,2332,02313,815VAN BUREN 7 6 338 336 2,1667662,596WASHTENAW 3 * 75 * * 3621,453WAYNE 0 0 0 0 * * 0WEXFORD 0 0 0 0 10732139
1 / Not including continuous signup enrollment between July and September 2013.
* Data withheld to avoid disclosure of individual operations.
119

County NameExpiring
Sept. 2013 (Acres)
New Lands (Acres) 1/
Average Rental
Payment ($/Acre)
Total Rental
Payment ($/year)
Average EBI Score
without Cost
Average EBI Score with Cost
Table 2 -- Description of Signup 45 Acceptable AcresMICHIGAN
STATE TOTALS 10,210 751 $111.05 $1,217,120 176 248ALLEGAN * * * * * * ARENAC * * * * * * BARRY 431 0 $106.07 $45,686 172 242BAY 96 0 $122.49 $11,796 167 245BERRIEN 236 0 $85.20 $20,090 154 251BRANCH 672 36 $101.32 $71,725 174 258CALHOUN 398 0 $114.22 $45,483 174 236CASS 233 105 $115.22 $38,966 171 239CHIPPEWA * * * * * * CLARE * * * * * * CLINTON 661 50 $121.94 $86,689 174 239EATON 316 0 $110.54 $34,919 188 262GENESEE * * * * * * GLADWIN 126 0 $83.24 $10,480 209 303GRAND TRAVERS 76 0 $36.09 $2,728 117 228GRATIOT 211 64 $117.93 $32,408 176 253HILLSDALE 1,217 6 $117.01 $143,133 181 243HURON 571 0 $152.16 $86,944 178 228IONIA 1,125 1 $146.46 $164,918 191 241IOSCO * * * * * * ISABELLA 290 0 $62.78 $18,188 194 296JACKSON 151 0 $70.55 $10,660 162 264KALAMAZOO 106 0 $90.36 $9,542 165 249KENT 96 11 $104.93 $11,312 142 224LAPEER * * * * * * LENAWEE 643 60 $128.47 $90,265 233 285MACKINAC * * * * * * MECOSTA 161 0 $61.25 $9,886 161 251MIDLAND * * * * * * MONROE * * * * * * MONTCALM 170 126 $62.41 $18,443 138 245MUSKEGON * * * * * * NEWAYGO * * * * * * OGEMAW * * * * * * OSCEOLA 91 31 $40.38 $4,927 133 260OTTAWA 140 16 $124.55 $19,406 188 245PRESQUE ISLE * * * * * * SAGINAW * * * * * * ST JOSEPH 154 8 $124.32 $20,090 189 243SANILAC 620 40 $84.58 $55,847 132 230SHIAWASSEE 118 99 $90.30 $19,623 167 241TUSCOLA 432 9 $148.43 $65,519 181 240VAN BUREN 336 0 $96.64 $32,470 162 254WASHTENAW * * * * * *
* Data withheld to avoid disclosure of individual operations.
1/ Includes land that may have been in CRP in the past.
120

County Name
EI>=8 (Acres)
National Priority
Area
State Priority
Area (Acres)
Rare and Declining Habitat (Acres)
Permanent Wildlife Habitat (Acres)
Pollinator Habitat Offers
Table 3 -- Description of Signup 45 Acceptable AcresMICHIGAN
Average Erodibility Index (EI)
Pollinator Habitat (Acres)
STATE TOTALS 2,882 10,961 0 0 821 116 115ALLEGAN * * * * * * * * ARENAC * * * * * * * * BARRY 225 431 0 0 53 18 8BAY 0 96 0 0 0 02 0BERRIEN 99 236 0 0 0 17 6BRANCH 0 708 0 0 28 13 2CALHOUN 44 398 0 0 11 05 0CASS 67 338 0 0 51 16 1CHIPPEWA * * * * * * * * CLARE * * * * * * * * CLINTON 64 711 0 0 83 04 0EATON 40 316 0 0 40 06 0GENESEE * * * * * * * * GLADWIN 126 126 0 0 0 012 0GRAND TRAVERS 76 76 0 0 0 09 0GRATIOT 19 275 0 0 28 03 0HILLSDALE 240 1,223 0 0 194 06 0HURON 0 571 0 0 16 02 0IONIA 475 1,126 0 0 34 36 24IOSCO * * * * * * * * ISABELLA 31 290 0 0 11 07 0JACKSON 49 151 0 0 14 06 0KALAMAZOO 23 106 0 0 0 03 0KENT 30 108 0 0 11 05 0LAPEER * * * * * * * * LENAWEE 656 703 0 0 40 019 0MACKINAC * * * * * * * * MECOSTA 0 161 0 0 0 03 0MIDLAND * * * * * * * * MONROE * * * * * * * * MONTCALM 89 296 0 0 5 07 0MUSKEGON * * * * * * * * NEWAYGO * * * * * * * * OGEMAW * * * * * * * * OSCEOLA 122 122 0 0 0 014 0OTTAWA 99 156 0 0 0 08 0PRESQUE ISLE * * * * * * * * SAGINAW * * * * * * * * ST JOSEPH 0 162 0 0 67 04 0SANILAC 4 660 0 0 56 02 0SHIAWASSEE 0 217 0 0 2 04 0TUSCOLA 32 441 0 0 46 03 0VAN BUREN 121 336 0 0 2 36 65WASHTENAW * * * * * * * *
* Data withheld to avoid disclosure of individual operations.Note: Acceptable acres may be listed in multiple categories.
121

County NameIntroduced
GrassNative Grass Total
GrassHardwood
TreesSoftwood
TreesTotal Trees
Table 4 -- Description of Signup 45 Acceptable Acres 1/MICHIGAN
STATE TOTALS 6,160 2,567 8,727 375 788 1,163ALLEGAN * * * * * * ARENAC * * * * * * BARRY 296 23 320 19 25 44BAY 25 66 91 5 0 5BERRIEN 131 73 204 19 7 26BRANCH 529 111 640 9 18 27CALHOUN 211 137 348 26 10 36CASS 161 111 272 8 7 15CHIPPEWA * * * * * * CLARE * * * * * * CLINTON 327 254 581 0 47 47EATON 87 143 230 17 24 41GENESEE * * * * * * GLADWIN 36 0 36 0 90 90GRAND TRAVERS 76 0 76 0 0 0GRATIOT 105 107 212 19 0 19HILLSDALE 868 90 958 26 23 49HURON 123 309 432 0 111 111IONIA 576 310 886 102 81 183IOSCO * * * * * * ISABELLA 113 48 161 1 108 109JACKSON 0 129 129 0 8 8KALAMAZOO 26 51 77 29 0 29KENT 76 0 76 20 0 20LAPEER * * * * * * LENAWEE 496 79 576 31 56 87MACKINAC * * * * * * MECOSTA 59 41 100 0 56 56MIDLAND * * * * * * MONROE * * * * * * MONTCALM 252 13 265 0 11 11MUSKEGON * * * * * * NEWAYGO * * * * * * OGEMAW * * * * * * OSCEOLA 118 0 118 0 2 2OTTAWA 136 15 150 0 0 0PRESQUE ISLE * * * * * * SAGINAW * * * * * * ST JOSEPH 16 75 91 0 0 0SANILAC 542 0 542 8 49 56SHIAWASSEE 149 50 199 0 17 17TUSCOLA 226 166 392 0 2 2VAN BUREN 254 11 265 0 0 0WASHTENAW * * * * * *
* Data withheld to avoid disclosure of individual operations.1/ Not including practices: permanent wildlife habitat, wildlife food plots, rare and declining habitat, and pollinator habitat.
122

MINNESOTA
123
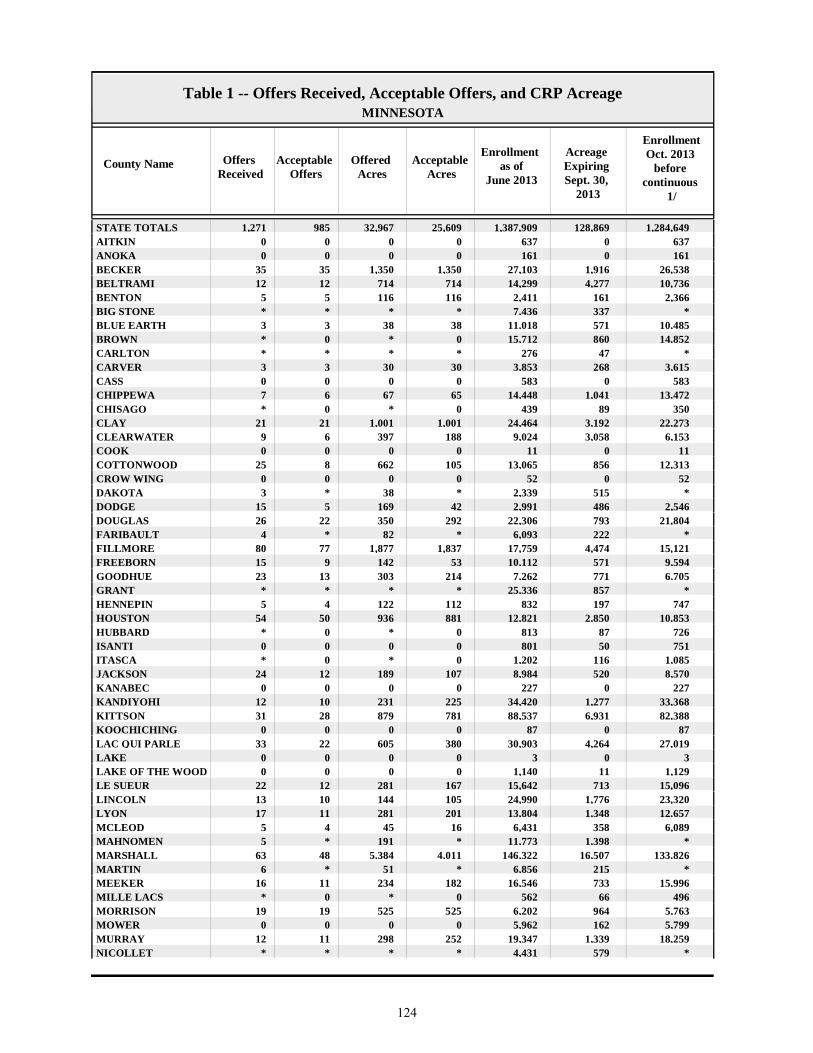
County Name Offers Received
Acceptable Offers
Offered Acres
Acceptable Acres
EnrollmentOct. 2013
before continuous
1/
Acreage Expiring Sept. 30,
2013
Enrollment as of
June 2013
Table 1 -- Offers Received, Acceptable Offers, and CRP AcreageMINNESOTA
STATE TOTALS 1,271 985 32,967 25,609 1,284,649128,8691,387,909AITKIN 0 0 0 0 6370637ANOKA 0 0 0 0 1610161BECKER 35 35 1,350 1,350 26,5381,91627,103BELTRAMI 12 12 714 714 10,7364,27714,299BENTON 5 5 116 116 2,3661612,411BIG STONE * * * * * 3377,436BLUE EARTH 3 3 38 38 10,48557111,018BROWN * 0 * 0 14,85286015,712CARLTON * * * * * 47276CARVER 3 3 30 30 3,6152683,853CASS 0 0 0 0 5830583CHIPPEWA 7 6 67 65 13,4721,04114,448CHISAGO * 0 * 0 35089439CLAY 21 21 1,001 1,001 22,2733,19224,464CLEARWATER 9 6 397 188 6,1533,0589,024COOK 0 0 0 0 11011COTTONWOOD 25 8 662 105 12,31385613,065CROW WING 0 0 0 0 52052DAKOTA 3 * 38 * * 5152,339DODGE 15 5 169 42 2,5464862,991DOUGLAS 26 22 350 292 21,80479322,306FARIBAULT 4 * 82 * * 2226,093FILLMORE 80 77 1,877 1,837 15,1214,47417,759FREEBORN 15 9 142 53 9,59457110,112GOODHUE 23 13 303 214 6,7057717,262GRANT * * * * * 85725,336HENNEPIN 5 4 122 112 747197832HOUSTON 54 50 936 881 10,8532,85012,821HUBBARD * 0 * 0 72687813ISANTI 0 0 0 0 75150801ITASCA * 0 * 0 1,0851161,202JACKSON 24 12 189 107 8,5705208,984KANABEC 0 0 0 0 2270227KANDIYOHI 12 10 231 225 33,3681,27734,420KITTSON 31 28 879 781 82,3886,93188,537KOOCHICHING 0 0 0 0 87087LAC QUI PARLE 33 22 605 380 27,0194,26430,903LAKE 0 0 0 0 303LAKE OF THE WOOD 0 0 0 0 1,129111,140LE SUEUR 22 12 281 167 15,09671315,642LINCOLN 13 10 144 105 23,3201,77624,990LYON 17 11 281 201 12,6571,34813,804MCLEOD 5 4 45 16 6,0893586,431MAHNOMEN 5 * 191 * * 1,39811,773MARSHALL 63 48 5,384 4,011 133,82616,507146,322MARTIN 6 * 51 * * 2156,856MEEKER 16 11 234 182 15,99673316,546MILLE LACS * 0 * 0 49666562MORRISON 19 19 525 525 5,7639646,202MOWER 0 0 0 0 5,7991625,962MURRAY 12 11 298 252 18,2591,33919,347NICOLLET * * * * * 5794,431
124

County Name Offers Received
Acceptable Offers
Offered Acres
Acceptable Acres
EnrollmentOct. 2013
before continuous
1/
Acreage Expiring Sept. 30,
2013
Enrollment as of
June 2013
Table 1 -- Offers Received, Acceptable Offers, and CRP AcreageMINNESOTA
NOBLES 17 14 165 133 8,6036259,095NORMAN 17 8 978 424 24,2332,18125,990OLMSTED 28 18 347 227 5,6431,3936,808E OTTER TAIL 64 53 1,433 1,321 56,9343,38558,999W OTTER TAIL 24 22 512 458 8,7518569,149PENNINGTON 10 3 332 23 41,4657,70449,147PINE 0 0 0 0 2530253PIPESTONE 3 3 178 178 7,2556547,731E POLK 15 10 720 464 47,2564,16750,960W POLK 13 12 648 512 46,8554,83751,180POPE 22 20 629 500 31,0832,07432,656RAMSEY 0 0 0 0 * * 0RED LAKE 3 * 31 * * 4,67228,686REDWOOD 5 4 55 54 15,5801,48417,010RENVILLE 10 6 246 137 13,04896513,877RICE 37 31 550 511 12,45788212,828ROCK 8 6 78 70 2,0871452,162ROSEAU 25 15 1,206 780 115,1046,878121,202N ST LOUIS 0 0 0 0 41041S ST LOUIS 0 0 0 0 47047SCOTT 3 * 120 * * 943,110SHERBURNE * * * * * 2081,490SIBLEY 5 * 34 * * 1793,802STEARNS 64 58 1,344 1,195 25,1673,04727,019STEELE 11 7 155 87 10,12522110,259STEVENS 12 9 294 153 12,3951,08813,331SWIFT 19 15 380 343 27,8002,50329,961TODD 47 47 1,414 1,414 11,0622,63212,280TRAVERSE 0 0 0 0 14,4961,27015,766WABASHA 33 29 725 547 6,2701,9647,687WADENA 11 5 260 66 2,8033223,060WASECA 7 6 65 64 7,8901337,960WASHINGTON * * * * * 33365WATONWAN 15 10 245 177 5,6535245,999WILKIN * * * * * 42211,295WINONA 66 60 974 881 7,4561,6748,248WRIGHT 24 11 395 211 8,3235318,643YELLOW MEDICINE 14 7 318 176 19,8671,29220,983
1 / Not including continuous signup enrollment between July and September 2013.
* Data withheld to avoid disclosure of individual operations.
125
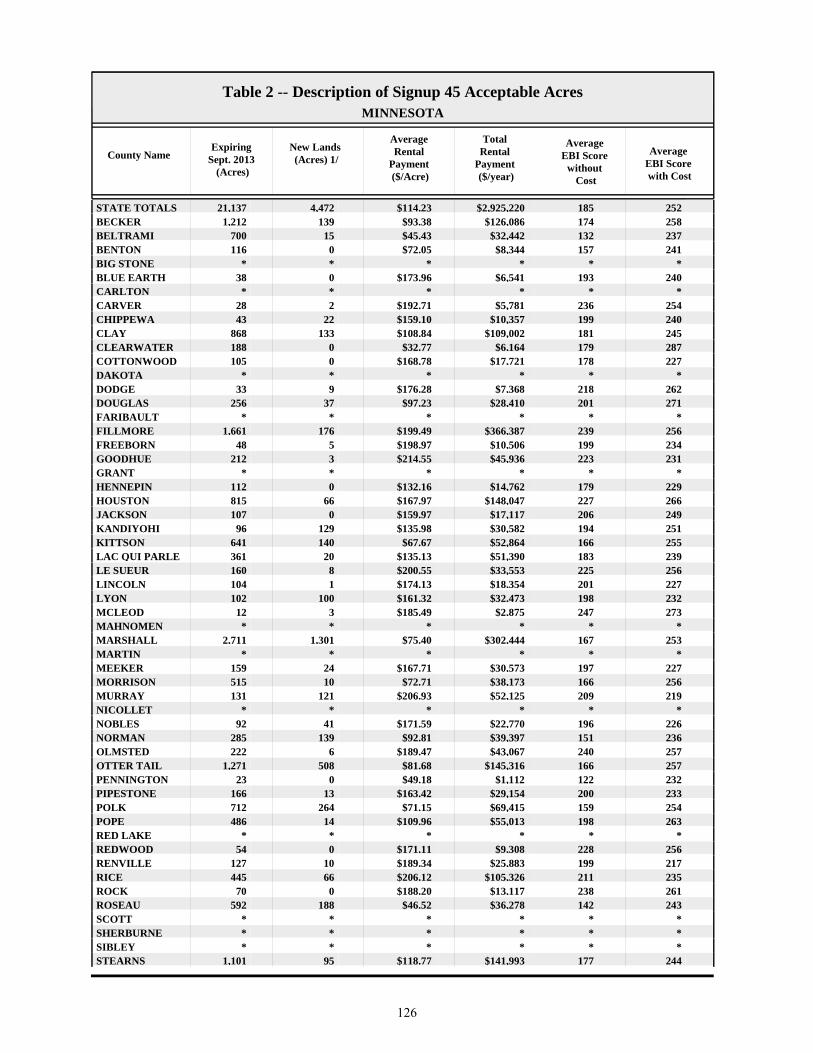
County NameExpiring
Sept. 2013 (Acres)
New Lands (Acres) 1/
Average Rental
Payment ($/Acre)
Total Rental
Payment ($/year)
Average EBI Score
without Cost
Average EBI Score with Cost
Table 2 -- Description of Signup 45 Acceptable AcresMINNESOTA
STATE TOTALS 21,137 4,472 $114.23 $2,925,220 185 252BECKER 1,212 139 $93.38 $126,086 174 258BELTRAMI 700 15 $45.43 $32,442 132 237BENTON 116 0 $72.05 $8,344 157 241BIG STONE * * * * * * BLUE EARTH 38 0 $173.96 $6,541 193 240CARLTON * * * * * * CARVER 28 2 $192.71 $5,781 236 254CHIPPEWA 43 22 $159.10 $10,357 199 240CLAY 868 133 $108.84 $109,002 181 245CLEARWATER 188 0 $32.77 $6,164 179 287COTTONWOOD 105 0 $168.78 $17,721 178 227DAKOTA * * * * * * DODGE 33 9 $176.28 $7,368 218 262DOUGLAS 256 37 $97.23 $28,410 201 271FARIBAULT * * * * * * FILLMORE 1,661 176 $199.49 $366,387 239 256FREEBORN 48 5 $198.97 $10,506 199 234GOODHUE 212 3 $214.55 $45,936 223 231GRANT * * * * * * HENNEPIN 112 0 $132.16 $14,762 179 229HOUSTON 815 66 $167.97 $148,047 227 266JACKSON 107 0 $159.97 $17,117 206 249KANDIYOHI 96 129 $135.98 $30,582 194 251KITTSON 641 140 $67.67 $52,864 166 255LAC QUI PARLE 361 20 $135.13 $51,390 183 239LE SUEUR 160 8 $200.55 $33,553 225 256LINCOLN 104 1 $174.13 $18,354 201 227LYON 102 100 $161.32 $32,473 198 232MCLEOD 12 3 $185.49 $2,875 247 273MAHNOMEN * * * * * * MARSHALL 2,711 1,301 $75.40 $302,444 167 253MARTIN * * * * * * MEEKER 159 24 $167.71 $30,573 197 227MORRISON 515 10 $72.71 $38,173 166 256MURRAY 131 121 $206.93 $52,125 209 219NICOLLET * * * * * * NOBLES 92 41 $171.59 $22,770 196 226NORMAN 285 139 $92.81 $39,397 151 236OLMSTED 222 6 $189.47 $43,067 240 257OTTER TAIL 1,271 508 $81.68 $145,316 166 257PENNINGTON 23 0 $49.18 $1,112 122 232PIPESTONE 166 13 $163.42 $29,154 200 233POLK 712 264 $71.15 $69,415 159 254POPE 486 14 $109.96 $55,013 198 263RED LAKE * * * * * * REDWOOD 54 0 $171.11 $9,308 228 256RENVILLE 127 10 $189.34 $25,883 199 217RICE 445 66 $206.12 $105,326 211 235ROCK 70 0 $188.20 $13,117 238 261ROSEAU 592 188 $46.52 $36,278 142 243SCOTT * * * * * * SHERBURNE * * * * * * SIBLEY * * * * * * STEARNS 1,101 95 $118.77 $141,993 177 244
126

County NameExpiring
Sept. 2013 (Acres)
New Lands (Acres) 1/
Average Rental
Payment ($/Acre)
Total Rental
Payment ($/year)
Average EBI Score
without Cost
Average EBI Score with Cost
Table 2 -- Description of Signup 45 Acceptable AcresMINNESOTA
STEELE 82 5 $201.78 $17,454 220 236STEVENS 133 19 $118.38 $18,053 172 240SWIFT 342 1 $125.58 $43,076 179 239TODD 1,328 86 $56.74 $80,255 164 268WABASHA 470 78 $174.92 $95,718 203 242WADENA 66 0 $29.85 $1,955 128 243WASECA 13 51 $199.71 $12,701 204 227WASHINGTON * * * * * * WATONWAN 171 6 $181.93 $32,238 187 221WILKIN * * * * * * WINONA 799 82 $184.38 $162,491 256 286WRIGHT 200 12 $138.82 $29,332 206 262YELLOW MEDICI 176 0 $123.64 $21,749 186 260
* Data withheld to avoid disclosure of individual operations.
1/ Includes land that may have been in CRP in the past.
127

County Name
EI>=8 (Acres)
National Priority
Area
State Priority
Area (Acres)
Rare and Declining Habitat (Acres)
Permanent Wildlife Habitat (Acres)
Pollinator Habitat Offers
Table 3 -- Description of Signup 45 Acceptable AcresMINNESOTA
Average Erodibility Index (EI)
Pollinator Habitat (Acres)
STATE TOTALS 9,031 19,956 5,224 7,069 4,689 319 125BECKER 53 1,350 0 392 342 05 0BELTRAMI 0 0 714 0 418 03 0BENTON 0 116 0 0 33 02 0BIG STONE * * * * * * * * BLUE EARTH 0 38 0 0 25 06 0CARLTON * * * * * * * * CARVER 19 30 0 19 0 08 0CHIPPEWA 0 65 0 42 0 04 0CLAY 107 1,002 0 168 60 46 27CLEARWATER 82 0 140 0 12 07 0COTTONWOOD 11 105 0 0 16 06 0DAKOTA * * * * * * * * DODGE 42 0 0 0 0 126 1DOUGLAS 2 292 0 129 16 25 4FARIBAULT * * * * * * * * FILLMORE 1,738 0 1,837 138 101 317 9FREEBORN 5 53 0 25 20 25 3GOODHUE 214 0 0 0 13 020 0GRANT * * * * * * * * HENNEPIN 87 112 0 39 0 08 0HOUSTON 879 0 871 0 13 033 0JACKSON 70 107 0 17 19 09 0KANDIYOHI 18 225 0 186 0 15 5KITTSON 704 781 0 125 72 010 0LAC QUI PARLE 18 380 0 271 6 04 0LE SUEUR 23 167 0 79 18 07 0LINCOLN 22 105 0 76 0 06 0LYON 32 201 0 159 0 05 0MCLEOD 16 16 0 9 0 011 0MAHNOMEN * * * * * * * * MARSHALL 1,436 4,011 0 2,220 204 07 0MARTIN * * * * * * * * MEEKER 58 182 0 98 19 07 0MORRISON 11 525 0 147 186 04 0MURRAY 7 252 0 247 0 04 0NICOLLET * * * * * * * * NOBLES 32 133 0 41 0 16 4NORMAN 184 425 0 135 0 16 7OLMSTED 213 0 227 4 6 019 0OTTER TAIL 295 1,779 0 291 542 05 0PENNINGTON 0 23 0 0 0 06 0PIPESTONE 17 178 0 141 0 13 16POLK 27 976 0 175 12 06 0POPE 155 500 0 89 169 06 0RED LAKE * * * * * * * * REDWOOD 0 54 0 11 0 07 0RENVILLE 23 137 0 46 0 07 0RICE 149 475 0 151 13 36 6ROCK 49 70 0 63 0 09 0ROSEAU 425 780 0 0 413 09 0SCOTT * * * * * * * * SHERBURNE * * * * * * * * SIBLEY * * * * * * * * STEARNS 170 1,196 0 153 643 45 16STEELE 5 87 0 84 3 06 0
128
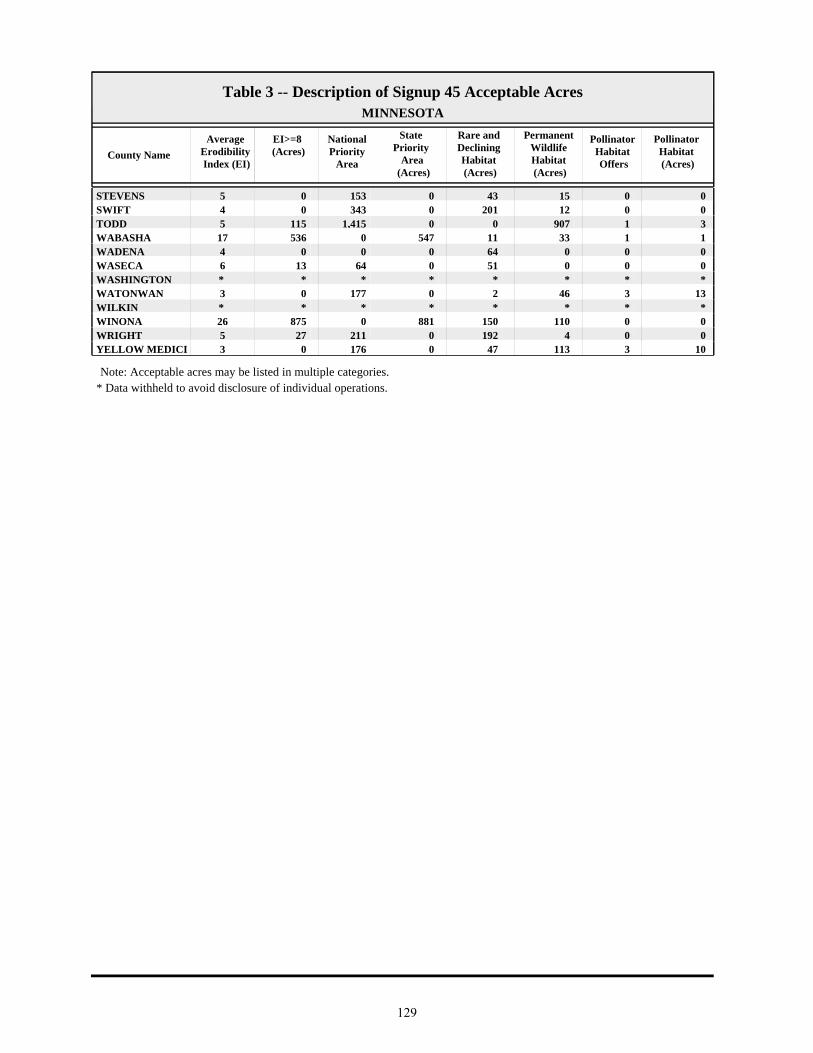
County Name
EI>=8 (Acres)
National Priority
Area
State Priority
Area (Acres)
Rare and Declining Habitat (Acres)
Permanent Wildlife Habitat (Acres)
Pollinator Habitat Offers
Table 3 -- Description of Signup 45 Acceptable AcresMINNESOTA
Average Erodibility Index (EI)
Pollinator Habitat (Acres)
STEVENS 0 153 0 43 15 05 0SWIFT 0 343 0 201 12 04 0TODD 115 1,415 0 0 907 15 3WABASHA 536 0 547 11 33 117 1WADENA 0 0 0 64 0 04 0WASECA 13 64 0 51 0 06 0WASHINGTON * * * * * * * * WATONWAN 0 177 0 2 46 33 13WILKIN * * * * * * * * WINONA 875 0 881 150 110 026 0WRIGHT 27 211 0 192 4 05 0YELLOW MEDICI 0 176 0 47 113 33 10
* Data withheld to avoid disclosure of individual operations.Note: Acceptable acres may be listed in multiple categories.
129

County NameIntroduced
GrassNative Grass Total
GrassHardwood
TreesSoftwood
TreesTotal Trees
Table 4 -- Description of Signup 45 Acceptable Acres 1/MINNESOTA
STATE TOTALS 6,217 4,088 10,305 2,139 984 3,123BECKER 320 63 383 93 109 202BELTRAMI 287 0 287 0 0 0BENTON 12 32 44 37 0 37BIG STONE * * * * * * BLUE EARTH 0 0 0 12 0 12CARLTON * * * * * * CARVER 0 0 0 11 0 11CHIPPEWA 0 20 20 0 0 0CLAY 0 735 735 0 0 0CLEARWATER 0 77 77 94 5 99COTTONWOOD 0 86 86 0 3 3DAKOTA * * * * * * DODGE 13 10 23 18 0 18DOUGLAS 0 15 15 90 38 128FARIBAULT * * * * * * FILLMORE 916 527 1,443 56 62 118FREEBORN 3 2 5 0 0 0GOODHUE 50 26 76 70 55 125GRANT * * * * * * HENNEPIN 2 0 2 67 0 67HOUSTON 571 149 720 94 28 122JACKSON 30 33 63 7 0 7KANDIYOHI 0 0 0 33 0 33KITTSON 558 23 581 2 0 2LAC QUI PARLE 0 98 98 0 0 0LE SUEUR 0 0 0 63 7 70LINCOLN 1 21 22 2 4 6LYON 0 39 39 4 0 4MCLEOD 0 0 0 7 0 7MAHNOMEN * * * * * * MARSHALL 1,256 293 1,549 13 0 13MARTIN * * * * * * MEEKER 0 40 40 23 0 23MORRISON 6 0 6 134 52 186MURRAY 0 1 1 4 0 4NICOLLET * * * * * * NOBLES 0 88 88 0 0 0NORMAN 95 40 135 146 0 146OLMSTED 57 113 170 4 44 47OTTER TAIL 384 115 499 375 58 433PENNINGTON 0 23 23 0 0 0PIPESTONE 0 17 17 0 5 5POLK 244 478 722 63 0 63POPE 10 19 29 158 52 210RED LAKE * * * * * * REDWOOD 0 1 1 42 0 42RENVILLE 0 83 83 6 0 6RICE 127 49 176 161 0 161ROCK 0 0 0 5 0 5ROSEAU 276 0 276 0 80 80SCOTT * * * * * * SHERBURNE * * * * * * SIBLEY * * * * * * STEARNS 80 152 232 98 25 122STEELE 0 0 0 0 0 0
130

County NameIntroduced
GrassNative Grass Total
GrassHardwood
TreesSoftwood
TreesTotal Trees
Table 4 -- Description of Signup 45 Acceptable Acres 1/MINNESOTA
STEVENS 0 81 81 14 0 14SWIFT 0 127 127 0 0 0TODD 48 70 118 61 273 334WABASHA 371 124 495 4 0 4WADENA 0 0 0 0 0 0WASECA 0 0 0 13 0 13WASHINGTON * * * * * * WATONWAN 0 112 112 0 0 0WILKIN * * * * * * WINONA 470 86 556 10 54 64WRIGHT 0 0 0 13 2 15YELLOW MEDICI 0 3 3 0 0 0
* Data withheld to avoid disclosure of individual operations.1/ Not including practices: permanent wildlife habitat, wildlife food plots, rare and declining habitat, and pollinator habitat.
131

MISSISSIPPI
132
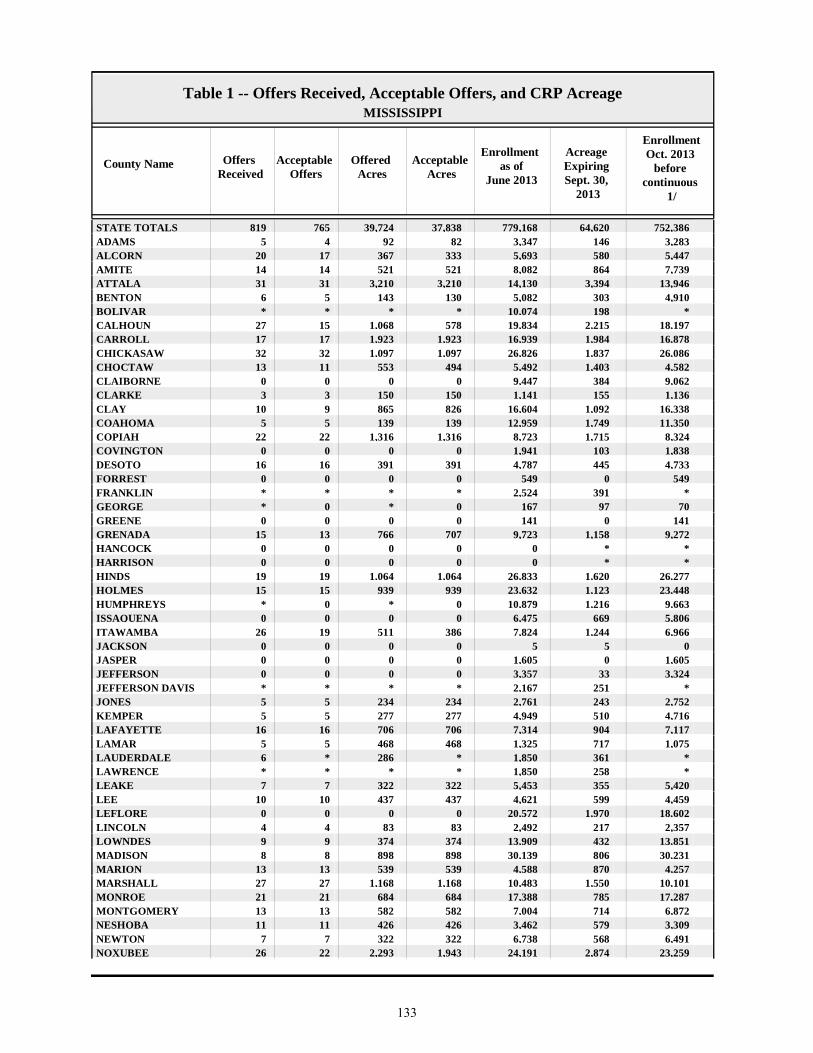
County Name Offers Received
Acceptable Offers
Offered Acres
Acceptable Acres
EnrollmentOct. 2013
before continuous
1/
Acreage Expiring Sept. 30,
2013
Enrollment as of
June 2013
Table 1 -- Offers Received, Acceptable Offers, and CRP AcreageMISSISSIPPI
STATE TOTALS 819 765 39,724 37,838 752,38664,620779,168ADAMS 5 4 92 82 3,2831463,347ALCORN 20 17 367 333 5,4475805,693AMITE 14 14 521 521 7,7398648,082ATTALA 31 31 3,210 3,210 13,9463,39414,130BENTON 6 5 143 130 4,9103035,082BOLIVAR * * * * * 19810,074CALHOUN 27 15 1,068 578 18,1972,21519,834CARROLL 17 17 1,923 1,923 16,8781,98416,939CHICKASAW 32 32 1,097 1,097 26,0861,83726,826CHOCTAW 13 11 553 494 4,5821,4035,492CLAIBORNE 0 0 0 0 9,0623849,447CLARKE 3 3 150 150 1,1361551,141CLAY 10 9 865 826 16,3381,09216,604COAHOMA 5 5 139 139 11,3501,74912,959COPIAH 22 22 1,316 1,316 8,3241,7158,723COVINGTON 0 0 0 0 1,8381031,941DESOTO 16 16 391 391 4,7334454,787FORREST 0 0 0 0 5490549FRANKLIN * * * * * 3912,524GEORGE * 0 * 0 7097167GREENE 0 0 0 0 1410141GRENADA 15 13 766 707 9,2721,1589,723HANCOCK 0 0 0 0 * * 0HARRISON 0 0 0 0 * * 0HINDS 19 19 1,064 1,064 26,2771,62026,833HOLMES 15 15 939 939 23,4481,12323,632HUMPHREYS * 0 * 0 9,6631,21610,879ISSAQUENA 0 0 0 0 5,8066696,475ITAWAMBA 26 19 511 386 6,9661,2447,824JACKSON 0 0 0 0 055JASPER 0 0 0 0 1,60501,605JEFFERSON 0 0 0 0 3,324333,357JEFFERSON DAVIS * * * * * 2512,167JONES 5 5 234 234 2,7522432,761KEMPER 5 5 277 277 4,7165104,949LAFAYETTE 16 16 706 706 7,1179047,314LAMAR 5 5 468 468 1,0757171,325LAUDERDALE 6 * 286 * * 3611,850LAWRENCE * * * * * 2581,850LEAKE 7 7 322 322 5,4203555,453LEE 10 10 437 437 4,4595994,621LEFLORE 0 0 0 0 18,6021,97020,572LINCOLN 4 4 83 83 2,3572172,492LOWNDES 9 9 374 374 13,85143213,909MADISON 8 8 898 898 30,23180630,139MARION 13 13 539 539 4,2578704,588MARSHALL 27 27 1,168 1,168 10,1011,55010,483MONROE 21 21 684 684 17,28778517,388MONTGOMERY 13 13 582 582 6,8727147,004NESHOBA 11 11 426 426 3,3095793,462NEWTON 7 7 322 322 6,4915686,738NOXUBEE 26 22 2,293 1,943 23,2592,87424,191
133

County Name Offers Received
Acceptable Offers
Offered Acres
Acceptable Acres
EnrollmentOct. 2013
before continuous
1/
Acreage Expiring Sept. 30,
2013
Enrollment as of
June 2013
Table 1 -- Offers Received, Acceptable Offers, and CRP AcreageMISSISSIPPI
OKTIBBEHA * * * * * 14412,247PANOLA 24 23 1,703 1,613 42,6061,58142,573PEARL RIVER 8 8 1,157 1,157 5,5181,3085,669PERRY 0 0 0 0 1,001101,011PIKE 12 12 475 475 1,8926132,029PONTOTOC 20 20 476 476 21,8061,26422,594PRENTISS 15 14 264 256 11,28056611,589QUITMAN 9 9 454 454 31,93580632,287RANKIN 23 23 1,739 1,739 8,1852,0208,467SCOTT 4 3 273 238 7,4924277,682SHARKEY 0 0 0 0 13,30831013,618SIMPSON 6 6 233 233 3,6162813,664SMITH 3 3 118 118 1,6111511,644STONE * * * * * 152520SUNFLOWER 6 4 145 69 9,2161699,316TALLAHATCHIE 12 12 661 660 28,37584128,555TATE 23 23 556 556 10,00470610,154TIPPAH 13 12 457 443 9,3991,09310,049TISHOMINGO 16 14 287 255 3,2747883,807TUNICA 0 0 0 0 4,58554,590UNION 16 13 487 439 14,01265214,225WALTHALL 29 29 1,013 1,013 8,2901,4838,760WARREN * * * * * 6629,317WASHINGTON * 0 * 0 5,5083405,848WAYNE 4 4 138 138 55170483WEBSTER 9 9 292 292 7,7621,1958,665WILKINSON 3 3 105 105 5,9031105,908WINSTON * * * * * 1924,753YALOBUSHA 16 16 385 385 7,3704827,467YAZOO 41 41 2,243 2,243 41,3374,51443,607
1 / Not including continuous signup enrollment between July and September 2013.
* Data withheld to avoid disclosure of individual operations.
134

County NameExpiring
Sept. 2013 (Acres)
New Lands (Acres) 1/
Average Rental
Payment ($/Acre)
Total Rental
Payment ($/year)
Average EBI Score
without Cost
Average EBI Score with Cost
Table 2 -- Description of Signup 45 Acceptable AcresMISSISSIPPI
STATE TOTALS 36,284 1,554 $64.09 $2,424,852 191 289ADAMS 82 0 $62.73 $5,132 200 314ALCORN 320 13 $53.94 $17,978 188 285AMITE 521 0 $25.37 $13,217 204 315ATTALA 3,210 0 $65.97 $211,738 177 280BENTON 130 0 $66.04 $8,592 200 287BOLIVAR * * * * * * CALHOUN 578 0 $114.91 $66,429 147 232CARROLL 1,847 75 $89.74 $172,530 230 327CHICKASAW 1,041 56 $81.14 $88,982 200 285CHOCTAW 494 0 $38.57 $19,048 162 271CLARKE 150 0 $17.82 $2,678 200 315CLAY 826 0 $62.15 $51,339 143 255COAHOMA 139 0 $105.11 $14,621 157 235COPIAH 1,294 22 $72.47 $95,368 202 287DESOTO 383 8 $72.33 $28,251 219 303FRANKLIN * * * * * * GRENADA 707 0 $75.10 $53,087 140 246HINDS 1,064 0 $50.30 $53,536 216 319HOLMES 939 0 $98.70 $92,677 204 294ITAWAMBA 372 14 $48.84 $18,854 143 256JEFFERSON DAVI * * * * * * JONES 234 0 $20.53 $4,808 181 294KEMPER 277 0 $33.13 $9,189 149 275LAFAYETTE 707 0 $70.12 $49,538 172 265LAMAR 468 0 $25.38 $11,863 192 303LAUDERDALE * * * * * * LAWRENCE * * * * * * LEAKE 322 0 $43.74 $14,093 156 276LEE 436 1 $55.52 $24,242 209 302LINCOLN 83 0 $32.95 $2,731 207 313LOWNDES 374 0 $60.26 $22,544 165 257MADISON 670 228 $80.32 $72,132 189 292MARION 540 0 $29.77 $16,060 191 299MARSHALL 1,168 0 $56.57 $66,047 227 319MONROE 653 31 $61.26 $41,903 144 257MONTGOMERY 582 0 $74.03 $43,087 182 287NESHOBA 426 0 $33.85 $14,411 175 281NEWTON 322 0 $29.58 $9,510 192 300NOXUBEE 1,943 0 $58.60 $113,836 154 268OKTIBBEHA * * * * * * PANOLA 1,280 333 $80.19 $129,391 209 310PEARL RIVER 1,157 0 $46.52 $53,823 208 306PIKE 475 0 $28.27 $13,438 206 315PONTOTOC 465 12 $52.03 $24,792 174 274PRENTISS 214 42 $65.72 $16,831 182 270QUITMAN 454 0 $86.17 $39,128 150 240RANKIN 1,739 0 $68.93 $119,841 226 316SCOTT 238 0 $40.87 $9,728 152 254SIMPSON 233 0 $34.68 $8,086 189 305SMITH 118 0 $41.85 $4,955 198 299STONE * * * * * * SUNFLOWER 69 0 $93.43 $6,428 191 277TALLAHATCHIE 661 0 $73.96 $48,848 159 249TATE 513 43 $67.00 $37,246 231 320
135

County NameExpiring
Sept. 2013 (Acres)
New Lands (Acres) 1/
Average Rental
Payment ($/Acre)
Total Rental
Payment ($/year)
Average EBI Score
without Cost
Average EBI Score with Cost
Table 2 -- Description of Signup 45 Acceptable AcresMISSISSIPPI
TIPPAH 443 0 $50.90 $22,571 164 262TISHOMINGO 255 0 $45.91 $11,712 157 259UNION 439 0 $57.45 $25,237 181 274WALTHALL 983 30 $24.79 $25,117 201 312WARREN * * * * * * WAYNE 53 85 $38.04 $5,238 155 259WEBSTER 292 0 $65.77 $19,225 120 233WILKINSON 105 0 $65.71 $6,919 202 297WINSTON * * * * * * YALOBUSHA 385 0 $71.34 $27,494 201 296YAZOO 1,683 561 $91.73 $205,781 233 305
* Data withheld to avoid disclosure of individual operations.
1/ Includes land that may have been in CRP in the past.
136

County Name
EI>=8 (Acres)
National Priority
Area
State Priority
Area (Acres)
Rare and Declining Habitat (Acres)
Permanent Wildlife Habitat (Acres)
Pollinator Habitat Offers
Table 3 -- Description of Signup 45 Acceptable AcresMISSISSIPPI
Average Erodibility Index (EI)
Pollinator Habitat (Acres)
STATE TOTALS 29,784 15,155 17,312 0 150 026 0ADAMS 29 82 0 0 6 017 0ALCORN 253 0 300 0 0 023 0AMITE 521 521 0 0 0 032 0ATTALA 1,442 3,210 0 0 44 012 0BENTON 130 0 0 0 0 019 0BOLIVAR * * * * * * * * CALHOUN 237 0 0 0 0 022 0CARROLL 1,923 0 1,923 0 3 042 0CHICKASAW 673 0 1,097 0 0 022 0CHOCTAW 445 0 0 0 0 019 0CLARKE 150 150 0 0 0 031 0CLAY 207 0 826 0 0 08 0COAHOMA 51 0 0 0 14 06 0COPIAH 962 1,316 0 0 0 024 0DESOTO 391 0 391 0 0 055 0FRANKLIN * * * * * * * * GRENADA 133 0 707 0 10 011 0HINDS 1,064 1,064 0 0 0 027 0HOLMES 934 0 811 0 0 040 0ITAWAMBA 212 0 0 0 0 012 0JEFFERSON DAVI * * * * * * * * JONES 234 234 0 0 3 017 0KEMPER 277 247 0 0 0 013 0LAFAYETTE 634 0 0 0 0 017 0LAMAR 468 468 0 0 0 017 0LAUDERDALE * * * * * * * * LAWRENCE * * * * * * * * LEAKE 270 322 0 0 0 013 0LEE 436 0 437 0 0 027 0LINCOLN 83 83 0 0 0 055 0LOWNDES 95 0 374 0 0 09 0MADISON 716 898 0 0 0 013 0MARION 524 433 0 0 0 028 0MARSHALL 1,113 0 1,168 0 44 056 0MONROE 323 0 684 0 0 08 0MONTGOMERY 488 0 0 0 0 035 0NESHOBA 426 0 0 0 0 031 0NEWTON 322 322 0 0 0 028 0NOXUBEE 1,393 0 1,943 0 3 013 0OKTIBBEHA * * * * * * * * PANOLA 1,614 0 1,614 0 0 062 0PEARL RIVER 1,157 1,157 0 0 0 026 0PIKE 475 475 0 0 0 032 0PONTOTOC 341 0 477 0 0 016 0PRENTISS 256 0 256 0 0 018 0QUITMAN 0 0 0 0 0 04 0RANKIN 1,662 1,739 0 0 0 019 0SCOTT 96 238 0 0 0 012 0SIMPSON 175 233 0 0 0 037 0SMITH 118 118 0 0 0 018 0STONE * * * * * * * * SUNFLOWER 69 0 0 0 0 011 0TALLAHATCHIE 302 0 661 0 0 09 0TATE 556 0 556 0 0 041 0TIPPAH 425 0 0 0 0 084 0
137
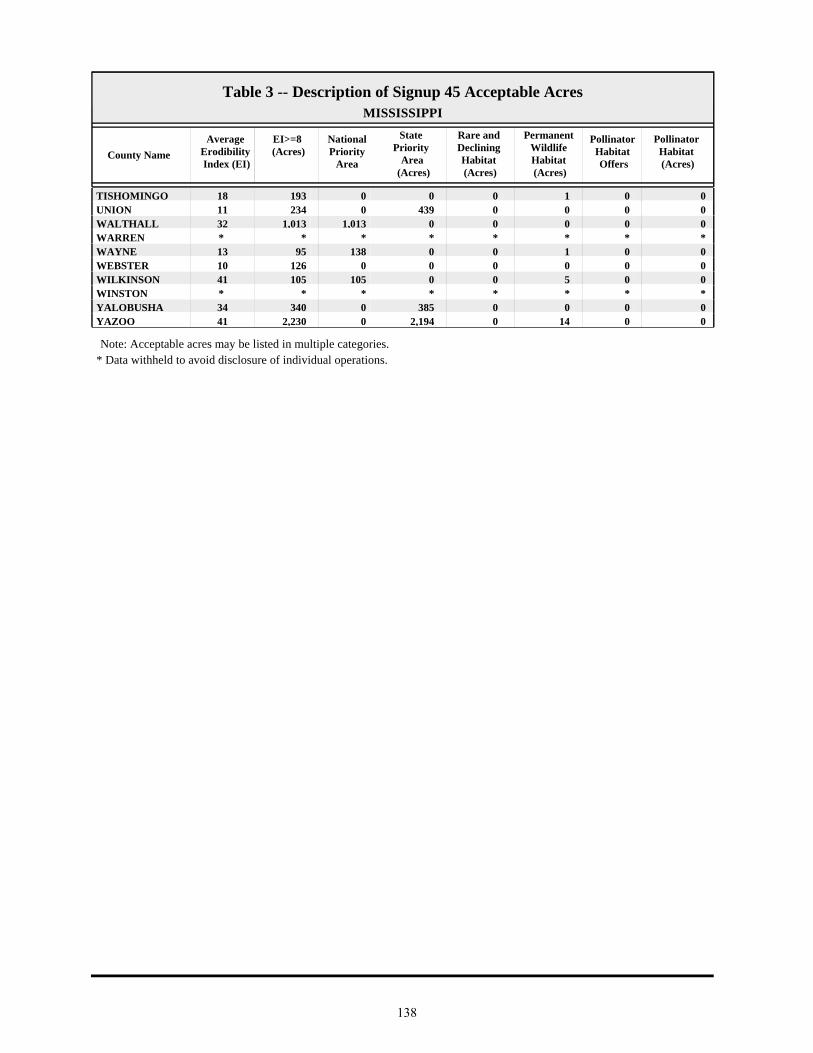
County Name
EI>=8 (Acres)
National Priority
Area
State Priority
Area (Acres)
Rare and Declining Habitat (Acres)
Permanent Wildlife Habitat (Acres)
Pollinator Habitat Offers
Table 3 -- Description of Signup 45 Acceptable AcresMISSISSIPPI
Average Erodibility Index (EI)
Pollinator Habitat (Acres)
TISHOMINGO 193 0 0 0 1 018 0UNION 234 0 439 0 0 011 0WALTHALL 1,013 1,013 0 0 0 032 0WARREN * * * * * * * * WAYNE 95 138 0 0 1 013 0WEBSTER 126 0 0 0 0 010 0WILKINSON 105 105 0 0 5 041 0WINSTON * * * * * * * * YALOBUSHA 340 0 385 0 0 034 0YAZOO 2,230 0 2,194 0 14 041 0
* Data withheld to avoid disclosure of individual operations.Note: Acceptable acres may be listed in multiple categories.
138

County NameIntroduced
GrassNative Grass Total
GrassHardwood
TreesSoftwood
TreesTotal Trees
Table 4 -- Description of Signup 45 Acceptable Acres 1/MISSISSIPPI
STATE TOTALS 3,295 176 3,471 4,100 29,929 34,029ADAMS 0 0 0 47 29 76ALCORN 16 27 43 0 290 290AMITE 0 0 0 0 521 521ATTALA 0 0 0 874 2,275 3,149BENTON 0 0 0 0 130 130BOLIVAR * * * * * * CALHOUN 0 0 0 0 578 578CARROLL 0 0 0 0 1,920 1,920CHICKASAW 185 0 185 165 745 910CHOCTAW 0 2 2 0 491 491CLARKE 0 0 0 0 143 143CLAY 133 0 133 619 74 693COAHOMA 0 0 0 120 0 120COPIAH 0 0 0 0 1,316 1,316DESOTO 46 0 46 8 336 344FRANKLIN * * * * * * GRENADA 43 0 43 157 487 643HINDS 55 0 55 26 956 982HOLMES 206 0 206 128 605 733ITAWAMBA 17 0 17 40 330 369JEFFERSON DAVI * * * * * * JONES 0 0 0 0 231 231KEMPER 0 0 0 0 277 277LAFAYETTE 145 0 145 0 557 557LAMAR 0 0 0 0 468 468LAUDERDALE * * * * * * LAWRENCE * * * * * * LEAKE 30 0 30 0 292 292LEE 61 0 61 0 376 376LINCOLN 0 0 0 0 79 79LOWNDES 116 92 207 52 105 157MADISON 0 0 0 173 720 893MARION 0 0 0 0 540 540MARSHALL 165 0 165 0 958 958MONROE 5 0 5 111 568 679MONTGOMERY 0 0 0 134 447 582NESHOBA 1 0 1 0 424 424NEWTON 0 1 1 0 318 318NOXUBEE 252 0 252 146 1,527 1,673OKTIBBEHA * * * * * * PANOLA 856 0 856 39 714 752PEARL RIVER 0 51 51 10 1,088 1,098PIKE 0 0 0 0 475 475PONTOTOC 62 0 62 0 414 414PRENTISS 51 0 51 0 205 205QUITMAN 0 0 0 454 0 454RANKIN 0 0 0 0 1,735 1,735SCOTT 0 0 0 0 238 238SIMPSON 0 0 0 0 231 231SMITH 0 0 0 0 118 118STONE * * * * * * SUNFLOWER 2 0 2 67 0 67TALLAHATCHIE 41 0 41 141 476 616TATE 138 0 138 0 410 410TIPPAH 58 0 58 19 367 385
139

County NameIntroduced
GrassNative Grass Total
GrassHardwood
TreesSoftwood
TreesTotal Trees
Table 4 -- Description of Signup 45 Acceptable Acres 1/MISSISSIPPI
TISHOMINGO 0 3 3 33 218 251UNION 2 0 2 33 405 437WALTHALL 0 0 0 0 1,010 1,010WARREN * * * * * * WAYNE 0 0 0 0 137 137WEBSTER 0 0 0 0 292 292WILKINSON 1 0 1 0 94 94WINSTON * * * * * * YALOBUSHA 7 0 7 55 322 377YAZOO 600 0 600 398 1,203 1,601
* Data withheld to avoid disclosure of individual operations.1/ Not including practices: permanent wildlife habitat, wildlife food plots, rare and declining habitat, and pollinator habitat.
140

MISSOURI
141

County Name Offers Received
Acceptable Offers
Offered Acres
Acceptable Acres
EnrollmentOct. 2013
before continuous
1/
Acreage Expiring Sept. 30,
2013
Enrollment as of
June 2013
Table 1 -- Offers Received, Acceptable Offers, and CRP AcreageMISSOURI
STATE TOTALS 2,048 1,961 82,933 80,323 1,025,236183,5411,128,454ADAIR 27 27 1,496 1,496 20,2823,33422,121ANDREW * * * * * 2,26312,902ATCHISON * 0 * 0 4,1511,1325,284AUDRAIN 24 18 743 650 8,2891,1658,804BARRY 0 0 0 0 1080108BARTON 12 11 418 402 14,5311,76015,889BATES 16 16 595 595 8,5551,5559,514BENTON 0 0 0 0 768194963BOLLINGER 9 9 194 194 2,0044222,232BOONE 9 9 357 357 3,9068704,419BUCHANAN 12 12 262 262 4,8421,8526,432BUTLER 0 0 0 0 38470453CALDWELL 54 54 2,061 2,061 33,0384,54735,524CALLAWAY 33 30 1,493 1,443 9,7412,17910,477CAMDEN 0 0 0 0 34034CAPE GIRARDEAU 27 26 631 604 9,5561,84510,797CARROLL 151 151 7,266 7,266 44,62311,00148,358CARTER 0 0 0 0 1030103CASS 14 14 343 343 9,1324089,197CEDAR 3 * 184 * * 4071,467CHARITON 65 64 2,420 2,418 24,1734,83126,586CHRISTIAN 0 0 0 0 461157CLARK 54 53 1,918 1,895 16,7212,94817,774CLAY 5 5 102 102 1,4902231,612CLINTON 4 4 110 110 10,5111,16911,570COLE 5 5 117 117 1,0992201,202COOPER 25 25 975 975 8,2771,6568,958CRAWFORD 0 0 0 0 3750375DADE 6 6 297 297 2,8946463,244DALLAS 0 0 0 0 11946164DAVIESS 82 82 3,900 3,900 46,8886,38649,374DEKALB 14 13 471 441 21,9687,19928,726DENT 0 0 0 0 13433167DOUGLAS 0 0 0 0 47546521DUNKLIN 4 4 103 103 1,0462761,219FRANKLIN 9 5 248 196 2,7254542,982GASCONADE * * * * * 1561,699GENTRY 19 19 635 635 35,8861,91937,170GREENE 0 0 0 0 63063GRUNDY 83 83 4,167 4,167 30,5156,73033,078HARRISON 28 27 741 732 57,6982,81859,784HENRY 9 6 757 570 7,4042,1428,976HICKORY 0 0 0 0 3780378HOLT 5 5 126 126 5,1391,0916,104HOWARD 14 10 226 196 11,3331,83212,969HOWELL 0 0 0 0 3410341IRON 0 0 0 0 12012JACKSON 0 0 0 0 16038198JASPER 3 3 64 64 5,4696656,071JEFFERSON 0 0 0 0 16268231JOHNSON 14 13 443 428 6,4551,6767,704KNOX 125 118 5,019 4,773 24,0407,08626,353
142

County Name Offers Received
Acceptable Offers
Offered Acres
Acceptable Acres
EnrollmentOct. 2013
before continuous
1/
Acreage Expiring Sept. 30,
2013
Enrollment as of
June 2013
Table 1 -- Offers Received, Acceptable Offers, and CRP AcreageMISSOURI
LACLEDE 0 0 0 0 1380138LAFAYETTE 5 5 55 55 4,9044355,285LAWRENCE * * * * * 722,736LEWIS 74 71 2,497 2,457 12,5374,05214,133LINCOLN 50 48 1,475 1,439 4,8433,4786,882LINN 90 89 4,409 4,369 43,6318,64447,907LIVINGSTON 79 78 3,730 3,721 25,2367,40128,916MCDONALD 0 0 0 0 9217108MACON 70 68 3,424 3,345 35,1477,05338,856MADISON 0 0 0 0 8344126MARIES 0 0 0 0 7235727MARION 15 15 567 567 6,6352,5648,632MERCER 11 11 198 198 23,53841323,754MILLER 0 0 0 0 37845MISSISSIPPI 0 0 0 0 2,533882,621MONITEAU 6 6 97 97 6,0379316,871MONROE 76 74 2,385 2,356 25,7394,52027,902MONTGOMERY 18 17 723 667 4,0341,2604,627MORGAN 0 0 0 0 81813831NEW MADRID 0 0 0 0 2,42002,420NEWTON 0 0 0 0 806132939NODAWAY 34 32 1,415 1,412 32,0099,10739,704OREGON 0 0 0 0 2130213OSAGE * * * * * 1041,302OZARK 0 0 0 0 44044PEMISCOT 0 0 0 0 9010901PERRY 31 31 865 865 4,7921,4175,344PETTIS 14 13 511 506 9,2391,0999,832PHELPS 0 0 0 0 24825273PIKE 25 22 1,065 966 8,7731,6169,423PLATTE 3 3 103 103 1,9157152,527POLK * 0 * 0 720148867PULASKI 0 0 0 0 28028PUTNAM 37 37 1,675 1,675 20,4953,24322,064RALLS 56 55 2,468 2,395 14,8253,27315,703RANDOLPH 23 23 1,009 1,009 18,8595,33923,189RAY 49 48 1,957 1,954 19,5343,54021,120REYNOLDS 0 0 0 0 1430143RIPLEY * * * * * 681,130ST CHARLES * * * * * 126820ST CLAIR * * * * * 3583,774ST FRANCOIS 0 0 0 0 4850485ST LOUIS 0 0 0 0 05151STE GENEVIEVE 15 11 273 234 3,5226623,950SALINE 41 23 1,163 686 10,9162,32812,558SCHUYLER 14 14 1,268 1,268 12,3091,67512,717SCOTLAND 47 47 1,677 1,677 29,6432,49230,458SCOTT 8 8 258 258 5,1655015,408SHANNON 0 0 0 0 292453SHELBY 38 36 1,610 1,330 11,8772,06812,616STODDARD 63 61 2,648 2,569 12,9164,70415,051STONE 0 0 0 0 1170117SULLIVAN 34 34 1,492 1,492 42,9242,46643,899
143

County Name Offers Received
Acceptable Offers
Offered Acres
Acceptable Acres
EnrollmentOct. 2013
before continuous
1/
Acreage Expiring Sept. 30,
2013
Enrollment as of
June 2013
Table 1 -- Offers Received, Acceptable Offers, and CRP AcreageMISSOURI
TANEY 0 0 0 0 1610161TEXAS 0 0 0 0 495144640VERNON 26 23 1,566 1,363 18,8163,85721,311WARREN 4 4 97 97 1,9134232,240WASHINGTON 0 0 0 0 808WAYNE 0 0 0 0 38751438WEBSTER 0 0 0 0 375087WORTH 16 16 873 873 20,1033,36422,593WRIGHT 0 0 0 0 19019ST LOUIS CITY 0 0 0 0 * * 0
1 / Not including continuous signup enrollment between July and September 2013.
* Data withheld to avoid disclosure of individual operations.
144

County NameExpiring
Sept. 2013 (Acres)
New Lands (Acres) 1/
Average Rental
Payment ($/Acre)
Total Rental
Payment ($/year)
Average EBI Score
without Cost
Average EBI Score with Cost
Table 2 -- Description of Signup 45 Acceptable AcresMISSOURI
STATE TOTALS 70,946 9,377 $123.59 $9,927,283 203 259ADAIR 1,432 64 $108.92 $162,916 199 262ANDREW * * * * * * AUDRAIN 650 0 $126.79 $82,377 175 231BARTON 397 4 $67.56 $27,133 174 261BATES 546 50 $82.37 $49,051 193 274BOLLINGER 183 11 $75.06 $14,547 168 259BOONE 292 64 $120.77 $43,091 177 245BUCHANAN 262 0 $111.24 $29,190 187 250CALDWELL 1,403 658 $140.37 $289,294 203 249CALLAWAY 1,323 121 $122.55 $176,852 184 240CAPE GIRARDEA 549 56 $104.31 $63,024 193 260CARROLL 6,898 368 $135.88 $987,350 206 255CASS 290 53 $82.37 $28,260 229 307CEDAR * * * * * * CHARITON 2,395 23 $99.46 $240,491 209 277CLARK 1,622 273 $129.45 $245,365 185 239CLAY 84 18 $115.80 $11,765 202 262CLINTON 84 26 $126.98 $13,955 181 234COLE 117 0 $78.54 $9,158 198 278COOPER 806 169 $107.79 $105,132 162 231DADE 297 0 $62.97 $18,702 193 293DAVIESS 3,649 251 $140.16 $546,575 230 275DEKALB 428 13 $130.89 $57,721 236 287DUNKLIN 93 10 $111.51 $11,497 156 234FRANKLIN 149 47 $78.63 $15,403 171 251GASCONADE * * * * * * GENTRY 32 603 $150.36 $95,555 250 290GRUNDY 3,953 214 $125.23 $521,813 206 260HARRISON 168 565 $153.99 $112,785 235 272HENRY 570 0 $74.72 $42,583 159 248HOLT 114 12 $183.76 $23,062 221 241HOWARD 142 54 $132.14 $25,912 193 249JASPER 64 0 $67.58 $4,305 145 248JOHNSON 274 153 $91.04 $38,930 176 252KNOX 4,149 624 $140.98 $672,911 216 261LAFAYETTE 55 0 $143.92 $7,872 187 235LAWRENCE * * * * * * LEWIS 1,940 517 $142.79 $350,793 186 235LINCOLN 1,340 99 $120.50 $173,442 189 251LINN 3,938 431 $111.95 $489,064 207 269LIVINGSTON 3,401 321 $123.71 $460,359 207 263MACON 3,257 88 $114.73 $383,756 206 267MARION 374 194 $131.39 $74,526 187 255MERCER 67 131 $143.46 $28,391 232 276MONITEAU 55 42 $84.90 $8,219 163 240MONROE 2,183 173 $128.58 $302,964 214 269MONTGOMERY 648 20 $101.86 $67,993 185 259NODAWAY 1,279 133 $151.39 $213,743 222 263OSAGE * * * * * * PERRY 864 2 $105.63 $91,384 186 256PETTIS 475 31 $92.98 $47,027 186 260PIKE 784 182 $112.44 $108,637 175 240PLATTE 103 0 $121.26 $12,478 195 250PUTNAM 1,545 131 $97.85 $163,898 204 274
145

County NameExpiring
Sept. 2013 (Acres)
New Lands (Acres) 1/
Average Rental
Payment ($/Acre)
Total Rental
Payment ($/year)
Average EBI Score
without Cost
Average EBI Score with Cost
Table 2 -- Description of Signup 45 Acceptable AcresMISSOURI
RALLS 1,905 490 $138.66 $332,080 192 243RANDOLPH 1,007 3 $117.27 $118,361 212 272RAY 1,854 100 $137.28 $268,309 183 231RIPLEY * * * * * * ST CHARLES * * * * * * ST CLAIR * * * * * * STE GENEVIEVE 234 0 $104.68 $24,484 179 245SALINE 570 116 $140.08 $96,154 187 235SCHUYLER 1,265 3 $109.08 $138,260 227 291SCOTLAND 1,391 286 $121.64 $203,950 220 276SCOTT 228 30 $142.41 $36,728 216 261SHELBY 997 333 $161.12 $214,258 218 252STODDARD 2,112 457 $99.93 $256,702 186 255SULLIVAN 1,398 94 $107.42 $160,244 204 268VERNON 1,067 296 $108.40 $147,737 197 262WARREN 93 4 $100.12 $9,722 195 263WORTH 705 169 $152.65 $133,277 212 250
* Data withheld to avoid disclosure of individual operations.
1/ Includes land that may have been in CRP in the past.
146

County Name
EI>=8 (Acres)
National Priority
Area
State Priority
Area (Acres)
Rare and Declining Habitat (Acres)
Permanent Wildlife Habitat (Acres)
Pollinator Habitat Offers
Table 3 -- Description of Signup 45 Acceptable AcresMISSOURI
Average Erodibility Index (EI)
Pollinator Habitat (Acres)
STATE TOTALS 78,779 0 55,283 2,623 741 11425 559ADAIR 1,472 0 1,284 0 0 150 4ANDREW * * * * * * * * AUDRAIN 624 0 0 20 0 417 19BARTON 259 0 402 11 0 111 8BATES 415 0 596 58 0 011 0BOLLINGER 194 0 0 0 0 026 0BOONE 357 0 0 0 0 018 0BUCHANAN 262 0 0 0 0 043 0CALDWELL 2,061 0 2,061 4 0 125 1CALLAWAY 1,443 0 0 5 0 222 14CAPE GIRARDEA 604 0 0 0 0 228 7CARROLL 7,153 0 7,266 6 0 324 13CASS 343 0 343 107 0 121 1CEDAR * * * * * * * * CHARITON 2,418 0 2,418 0 0 326 9CLARK 1,896 0 0 0 0 032 0CLAY 102 0 0 0 0 134 2CLINTON 110 0 109 0 0 020 0COLE 117 0 0 63 0 020 0COOPER 960 0 0 17 6 424 21DADE 236 0 0 218 0 213 3DAVIESS 3,871 0 3,900 863 33 022 0DEKALB 441 0 441 178 0 022 0DUNKLIN 34 0 0 0 4 211 8FRANKLIN 196 0 0 0 0 025 0GASCONADE * * * * * * * * GENTRY 636 0 636 0 0 027 0GRUNDY 4,159 0 4,167 38 56 127 2HARRISON 727 0 732 0 0 223 3HENRY 560 0 0 391 0 012 0HOLT 126 0 0 0 0 051 0HOWARD 184 0 0 0 0 018 0JASPER 64 0 0 40 0 09 0JOHNSON 428 0 0 36 0 420 15KNOX 4,746 0 4,773 5 150 024 0LAFAYETTE 55 0 0 9 0 119 1LAWRENCE * * * * * * * * LEWIS 2,457 0 0 0 0 228 13LINCOLN 1,439 0 0 0 0 724 27LINN 4,342 0 4,369 0 99 127 8LIVINGSTON 3,721 0 3,721 0 76 128 1MACON 3,068 0 3,345 0 4 128 25MARION 567 0 0 0 0 618 24MERCER 194 0 198 0 0 030 0MONITEAU 97 0 0 0 15 018 0MONROE 2,140 0 2,356 20 160 321 14MONTGOMERY 668 0 0 40 0 1319 51NODAWAY 1,412 0 1,412 38 40 021 0OSAGE * * * * * * * * PERRY 865 0 0 0 1 129 2PETTIS 506 0 0 0 0 015 0PIKE 966 0 0 0 0 322 9PLATTE 103 0 0 0 0 026 0PUTNAM 1,675 0 1,675 0 72 131 14RALLS 2,395 0 0 45 0 2620 115
147

County Name
EI>=8 (Acres)
National Priority
Area
State Priority
Area (Acres)
Rare and Declining Habitat (Acres)
Permanent Wildlife Habitat (Acres)
Pollinator Habitat Offers
Table 3 -- Description of Signup 45 Acceptable AcresMISSOURI
Average Erodibility Index (EI)
Pollinator Habitat (Acres)
RANDOLPH 1,004 0 1,009 139 0 421 24RAY 1,955 0 0 0 0 427 20RIPLEY * * * * * * * * ST CHARLES * * * * * * * * ST CLAIR * * * * * * * * STE GENEVIEVE 234 0 0 0 0 024 0SALINE 686 0 0 46 7 022 0SCHUYLER 1,262 0 1,268 0 0 132 64SCOTLAND 1,677 0 1,677 163 0 023 0SCOTT 258 0 0 0 0 141 4SHELBY 1,299 0 1,330 56 0 022 0STODDARD 2,569 0 0 0 13 132 3SULLIVAN 1,488 0 1,492 0 0 125 4VERNON 1,109 0 1,363 0 6 111 4WARREN 97 0 0 0 0 024 0WORTH 873 0 873 9 0 030 0
* Data withheld to avoid disclosure of individual operations.Note: Acceptable acres may be listed in multiple categories.
148
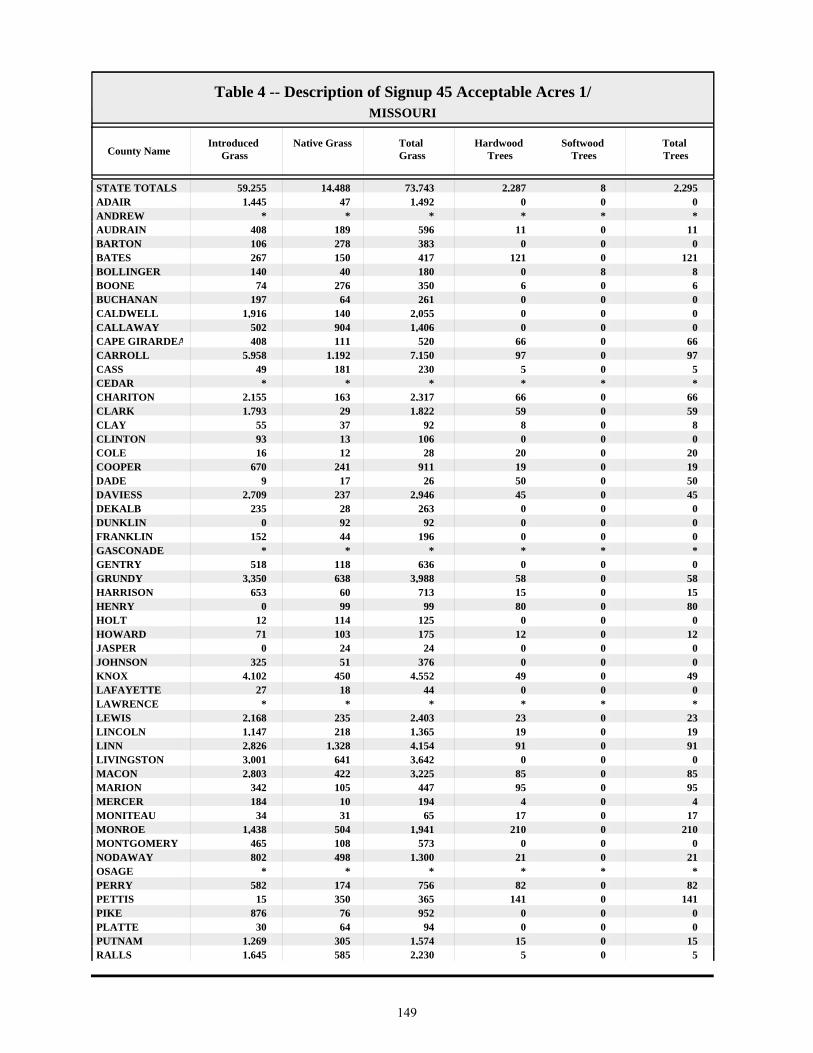
County NameIntroduced
GrassNative Grass Total
GrassHardwood
TreesSoftwood
TreesTotal Trees
Table 4 -- Description of Signup 45 Acceptable Acres 1/MISSOURI
STATE TOTALS 59,255 14,488 73,743 2,287 8 2,295ADAIR 1,445 47 1,492 0 0 0ANDREW * * * * * * AUDRAIN 408 189 596 11 0 11BARTON 106 278 383 0 0 0BATES 267 150 417 121 0 121BOLLINGER 140 40 180 0 8 8BOONE 74 276 350 6 0 6BUCHANAN 197 64 261 0 0 0CALDWELL 1,916 140 2,055 0 0 0CALLAWAY 502 904 1,406 0 0 0CAPE GIRARDEA 408 111 520 66 0 66CARROLL 5,958 1,192 7,150 97 0 97CASS 49 181 230 5 0 5CEDAR * * * * * * CHARITON 2,155 163 2,317 66 0 66CLARK 1,793 29 1,822 59 0 59CLAY 55 37 92 8 0 8CLINTON 93 13 106 0 0 0COLE 16 12 28 20 0 20COOPER 670 241 911 19 0 19DADE 9 17 26 50 0 50DAVIESS 2,709 237 2,946 45 0 45DEKALB 235 28 263 0 0 0DUNKLIN 0 92 92 0 0 0FRANKLIN 152 44 196 0 0 0GASCONADE * * * * * * GENTRY 518 118 636 0 0 0GRUNDY 3,350 638 3,988 58 0 58HARRISON 653 60 713 15 0 15HENRY 0 99 99 80 0 80HOLT 12 114 125 0 0 0HOWARD 71 103 175 12 0 12JASPER 0 24 24 0 0 0JOHNSON 325 51 376 0 0 0KNOX 4,102 450 4,552 49 0 49LAFAYETTE 27 18 44 0 0 0LAWRENCE * * * * * * LEWIS 2,168 235 2,403 23 0 23LINCOLN 1,147 218 1,365 19 0 19LINN 2,826 1,328 4,154 91 0 91LIVINGSTON 3,001 641 3,642 0 0 0MACON 2,803 422 3,225 85 0 85MARION 342 105 447 95 0 95MERCER 184 10 194 4 0 4MONITEAU 34 31 65 17 0 17MONROE 1,438 504 1,941 210 0 210MONTGOMERY 465 108 573 0 0 0NODAWAY 802 498 1,300 21 0 21OSAGE * * * * * * PERRY 582 174 756 82 0 82PETTIS 15 350 365 141 0 141PIKE 876 76 952 0 0 0PLATTE 30 64 94 0 0 0PUTNAM 1,269 305 1,574 15 0 15RALLS 1,645 585 2,230 5 0 5
149

County NameIntroduced
GrassNative Grass Total
GrassHardwood
TreesSoftwood
TreesTotal Trees
Table 4 -- Description of Signup 45 Acceptable Acres 1/MISSOURI
RANDOLPH 665 151 816 26 0 26RAY 1,755 176 1,931 0 0 0RIPLEY * * * * * * ST CHARLES * * * * * * ST CLAIR * * * * * * STE GENEVIEVE 174 55 229 0 0 0SALINE 242 345 587 36 0 36SCHUYLER 1,120 4 1,124 80 0 80SCOTLAND 1,144 273 1,417 97 0 97SCOTT 62 139 201 45 0 45SHELBY 1,131 143 1,274 0 0 0STODDARD 1,958 500 2,458 84 0 84SULLIVAN 1,243 236 1,479 9 0 9VERNON 570 540 1,110 238 0 238WARREN 55 35 91 0 0 0WORTH 847 14 861 0 0 0
* Data withheld to avoid disclosure of individual operations.1/ Not including practices: permanent wildlife habitat, wildlife food plots, rare and declining habitat, and pollinator habitat.
150

MO
NT
AN
A
151

County Name Offers Received
Acceptable Offers
Offered Acres
Acceptable Acres
EnrollmentOct. 2013
before continuous
1/
Acreage Expiring Sept. 30,
2013
Enrollment as of
June 2013
Table 1 -- Offers Received, Acceptable Offers, and CRP AcreageMONTANA
STATE TOTALS 967 747 185,506 145,576 1,776,940365,4521,996,816BEAVERHEAD 0 0 0 0 1270127BIG HORN 7 6 1,698 1,638 12,8052,57013,737BLAINE 49 37 11,254 9,103 65,72225,17381,791BROADWATER 7 3 1,170 615 8,6692,22010,274CARBON 4 4 138 138 6,4654816,808CARTER 3 * 663 * * 07,493CASCADE 45 38 6,113 4,510 49,63311,67156,794CHOUTEAU 43 40 7,788 6,770 148,80230,692172,724CUSTER * * * * * 1273,501DANIELS 39 37 6,048 5,850 116,6097,952118,710DAWSON 19 14 4,039 3,073 42,3194,26543,511DEER LODGE 0 0 0 0 * * 0FALLON 8 * 1,729 * * 60512,382FERGUS 13 7 2,599 1,927 24,4145,76228,249FLATHEAD * * * * * 89202GALLATIN 0 0 0 0 1,41701,417GARFIELD 5 4 1,900 1,640 25,7262,03026,116GLACIER 12 9 1,780 1,508 50,2115,94454,647GOLDEN VALLEY 15 11 5,415 4,284 32,7062,65131,074GRANITE 0 0 0 0 1170117HILL 86 74 23,976 19,957 167,46355,272202,778JEFFERSON 3 0 605 0 4,9561,7006,657JUDITH BASIN 7 0 1,544 0 8,8455,49214,337LAKE 0 0 0 0 14410154LEWIS AND CLARK * * * * * 5991,931LIBERTY 32 14 5,025 1,876 73,81019,93791,872LINCOLN 0 0 0 0 * * 0MCCONE 27 18 4,998 3,904 73,5335,56775,195MADISON 0 0 0 0 4,28804,288MEAGHER * 0 * 0 5580558MINERAL 0 0 0 0 * * 0MISSOULA 0 0 0 0 33033MUSSELSHELL 4 * 334 * * 2,33525,781PARK * * * * * 9578,824PETROLEUM 5 5 864 864 5,9951,5506,681PHILLIPS 55 52 16,180 15,818 70,49028,16382,835PONDERA 36 29 3,014 2,505 51,99711,33960,831POWDER RIVER 0 0 0 0 784143927POWELL 0 0 0 0 602585PRAIRIE 7 6 817 758 18,8293,49321,564RAVALLI 0 0 0 0 1390139RICHLAND 84 79 14,486 13,834 82,09915,73083,995ROOSEVELT 112 63 17,322 9,974 93,50926,327109,862ROSEBUD 5 3 1,655 1,082 28,7933,09030,801SANDERS 0 0 0 0 343102445SHERIDAN 51 35 5,615 3,081 48,92517,48663,330SILVER BOW 0 0 0 0 * * 0STILLWATER 8 6 2,273 1,873 34,2592,63535,021SWEET GRASS * 0 * 0 8991791,078TETON 25 25 2,565 2,565 81,8287,55486,818TOOLE 50 47 11,395 11,076 109,82221,533120,279TREASURE * 0 * 0 * * 0
152

County Name Offers Received
Acceptable Offers
Offered Acres
Acceptable Acres
EnrollmentOct. 2013
before continuous
1/
Acreage Expiring Sept. 30,
2013
Enrollment as of
June 2013
Table 1 -- Offers Received, Acceptable Offers, and CRP AcreageMONTANA
VALLEY 74 55 14,543 10,789 98,11023,555110,876WHEATLAND 5 5 1,533 1,533 25,2795,53229,277WIBAUX 3 * 557 * * 1319,330YELLOWSTONE 9 9 1,013 1,013 38,7862,78640,559YELLOWSTONE NAT 0 0 0 0 * * 0
1 / Not including continuous signup enrollment between July and September 2013.
* Data withheld to avoid disclosure of individual operations.
153

County NameExpiring
Sept. 2013 (Acres)
New Lands (Acres) 1/
Average Rental
Payment ($/Acre)
Total Rental
Payment ($/year)
Average EBI Score
without Cost
Average EBI Score with Cost
Table 2 -- Description of Signup 45 Acceptable AcresMONTANA
STATE TOTALS 101,563 44,013 $32.00 $4,658,171 132 243BIG HORN 1,638 0 $30.75 $50,358 137 250BLAINE 6,452 2,651 $29.50 $268,525 120 232BROADWATER 292 323 $30.70 $18,870 128 243CARBON 89 50 $23.21 $3,210 92 227CARTER * * * * * * CASCADE 1,647 2,863 $41.69 $188,028 155 257CHOUTEAU 6,016 754 $35.15 $237,962 128 234CUSTER * * * * * * DANIELS 2,344 3,507 $34.78 $203,503 152 264DAWSON 1,996 1,077 $34.65 $106,485 105 222FALLON * * * * * * FERGUS 851 1,077 $26.52 $51,109 138 248FLATHEAD * * * * * * GARFIELD 0 1,640 $30.36 $49,790 118 234GLACIER 1,508 0 $29.31 $44,214 148 256GOLDEN VALLEY 1,127 3,156 $28.48 $121,996 143 258HILL 18,613 1,344 $31.07 $620,078 127 238LEWIS AND CLA * * * * * * LIBERTY 1,761 115 $33.09 $62,058 128 235MCCONE 2,323 1,582 $29.74 $116,136 137 249MUSSELSHELL * * * * * * PARK * * * * * * PETROLEUM 844 20 $23.15 $20,010 153 266PHILLIPS 9,987 5,831 $30.52 $482,791 116 228PONDERA 2,245 261 $38.66 $96,837 139 246PRAIRIE 444 314 $30.00 $22,739 115 240RICHLAND 9,818 4,017 $33.85 $468,360 127 242ROOSEVELT 5,403 4,571 $34.70 $346,115 131 238ROSEBUD 835 247 $30.74 $33,246 96 226SHERIDAN 1,645 1,436 $34.22 $105,459 128 236STILLWATER 1,715 158 $29.73 $55,669 130 238TETON 2,094 471 $41.86 $107,390 174 275TOOLE 10,029 1,047 $29.54 $327,147 146 255VALLEY 7,825 2,965 $29.56 $318,913 138 251WHEATLAND 825 709 $25.27 $38,745 127 247WIBAUX * * * * * * YELLOWSTONE 546 467 $33.23 $33,643 125 241
* Data withheld to avoid disclosure of individual operations.
1/ Includes land that may have been in CRP in the past.
154

County Name
EI>=8 (Acres)
National Priority
Area
State Priority
Area (Acres)
Rare and Declining Habitat (Acres)
Permanent Wildlife Habitat (Acres)
Pollinator Habitat Offers
Table 3 -- Description of Signup 45 Acceptable AcresMONTANA
Average Erodibility Index (EI)
Pollinator Habitat (Acres)
STATE TOTALS 139,210 119,452 12,231 3,992 1,216 3312 790BIG HORN 1,638 0 0 0 0 217 15BLAINE 9,103 9,103 0 0 0 010 0BROADWATER 615 0 0 0 0 017 0CARBON 138 0 0 0 0 013 0CARTER * * * * * * * * CASCADE 4,510 4,510 0 0 0 416 87CHOUTEAU 6,770 6,770 0 416 0 210 6CUSTER * * * * * * * * DANIELS 5,851 5,851 0 0 0 014 0DAWSON 3,073 0 700 0 0 014 0FALLON * * * * * * * * FERGUS 1,927 0 1,927 0 151 014 0FLATHEAD * * * * * * * * GARFIELD 1,640 0 1,023 0 0 111 55GLACIER 1,508 1,508 0 0 821 116 10GOLDEN VALLEY 4,284 0 424 0 0 027 0HILL 19,957 19,957 0 10 34 210 114LEWIS AND CLA * * * * * * * * LIBERTY 1,876 1,876 0 0 0 013 0MCCONE 3,904 0 3,904 0 28 112 27MUSSELSHELL * * * * * * * * PARK * * * * * * * * PETROLEUM 864 0 844 0 0 021 0PHILLIPS 15,196 15,818 0 1,858 0 09 0PONDERA 2,505 2,505 0 0 58 015 0PRAIRIE 758 0 341 0 0 014 0RICHLAND 8,774 13,835 0 0 0 09 0ROOSEVELT 9,763 9,974 0 0 0 112 19ROSEBUD 1,082 0 0 0 0 014 0SHERIDAN 2,609 3,081 0 40 124 411 27STILLWATER 1,873 0 1,873 0 0 012 0TETON 2,565 2,565 0 0 0 114 22TOOLE 11,076 11,076 0 1,669 0 1312 379VALLEY 10,789 10,789 375 0 0 015 0WHEATLAND 1,533 0 0 0 0 115 30WIBAUX * * * * * * * * YELLOWSTONE 1,013 0 0 0 0 026 0
* Data withheld to avoid disclosure of individual operations.Note: Acceptable acres may be listed in multiple categories.
155

County NameIntroduced
GrassNative Grass Total
GrassHardwood
TreesSoftwood
TreesTotal Trees
Table 4 -- Description of Signup 45 Acceptable Acres 1/MONTANA
STATE TOTALS 99,636 39,873 139,509 0 0 0BIG HORN 0 1,622 1,622 0 0 0BLAINE 7,484 1,620 9,103 0 0 0BROADWATER 615 0 615 0 0 0CARBON 138 0 138 0 0 0CARTER * * * * * * CASCADE 3,701 707 4,407 0 0 0CHOUTEAU 1,640 4,698 6,338 0 0 0CUSTER * * * * * * DANIELS 3,695 2,156 5,851 0 0 0DAWSON 2,654 419 3,073 0 0 0FALLON * * * * * * FERGUS 1,591 185 1,776 0 0 0FLATHEAD * * * * * * GARFIELD 968 617 1,585 0 0 0GLACIER 676 0 676 0 0 0GOLDEN VALLEY 4,280 0 4,280 0 0 0HILL 15,093 4,692 19,785 0 0 0LEWIS AND CLA * * * * * * LIBERTY 1,265 611 1,876 0 0 0MCCONE 2,956 893 3,848 0 0 0MUSSELSHELL * * * * * * PARK * * * * * * PETROLEUM 695 169 864 0 0 0PHILLIPS 7,372 6,588 13,960 0 0 0PONDERA 1,576 867 2,443 0 0 0PRAIRIE 758 0 758 0 0 0RICHLAND 9,595 4,240 13,835 0 0 0ROOSEVELT 7,103 2,852 9,955 0 0 0ROSEBUD 247 835 1,082 0 0 0SHERIDAN 2,163 722 2,885 0 0 0STILLWATER 1,873 0 1,873 0 0 0TETON 2,384 154 2,538 0 0 0TOOLE 8,822 206 9,029 0 0 0VALLEY 6,559 4,225 10,783 0 0 0WHEATLAND 1,377 127 1,504 0 0 0WIBAUX * * * * * * YELLOWSTONE 1,013 0 1,013 0 0 0
* Data withheld to avoid disclosure of individual operations.1/ Not including practices: permanent wildlife habitat, wildlife food plots, rare and declining habitat, and pollinator habitat.
156

NE
BR
AS
KA
157

County Name Offers Received
Acceptable Offers
Offered Acres
Acceptable Acres
EnrollmentOct. 2013
before continuous
1/
Acreage Expiring Sept. 30,
2013
Enrollment as of
June 2013
Table 1 -- Offers Received, Acceptable Offers, and CRP AcreageNEBRASKA
STATE TOTALS 1,035 828 45,838 39,908 836,65395,759892,505ADAMS 7 * 56 * * 2371,113ANTELOPE 28 19 442 181 10,2241,90311,946ARTHUR 0 0 0 0 * * 0BANNER 6 6 1,060 1,060 37,277036,217BLAINE 0 0 0 0 2180218BOONE 7 7 1,067 1,067 7,5541,5158,002BOX BUTTE 5 5 310 310 19,53018919,409BOYD 3 3 126 126 1,6613081,842BROWN * 0 * 0 1,5351231,658BUFFALO * * * * * 2343,646BURT 8 6 157 115 7,8621,0228,769BUTLER 16 14 791 740 11,0492,28812,596CASS 7 * 148 * * 6423,543CEDAR 14 11 422 353 7,1916067,443CHASE 79 67 2,548 2,232 20,7193,46721,954CHERRY 0 0 0 0 7690769CHEYENNE 22 22 2,224 2,224 66,32490165,000CLAY * * * * * 751,154COLFAX * 0 * 0 2,8396023,441CUMING 15 0 301 0 4,0787424,820CUSTER 5 4 95 90 3,7851353,831DAKOTA 0 0 0 0 3,1442463,389DAWES 5 * 324 * * 1264,483DAWSON * * * * * 1312,405DEUEL * * * * * 5412,920DIXON 8 4 479 348 9,8851,98411,522DODGE 4 4 70 70 2,3472922,568DOUGLAS 4 * 50 * * 134619DUNDY 24 22 1,552 1,264 14,8152,98316,534FILLMORE 0 0 0 0 7292831,012FRANKLIN 7 5 241 127 7,6265558,054FRONTIER * * * * * 264,867FURNAS 12 10 424 286 13,10779913,621GAGE 84 83 1,646 1,629 33,6624,10836,141GARDEN 5 4 259 238 8,6673578,786GARFIELD 0 0 0 0 1,289431,332GOSPER 3 3 84 84 2,7221122,750GRANT 0 0 0 0 * * 0GREELEY 4 4 297 297 3,0783573,137HALL 3 * 139 * * 142330HAMILTON 0 0 0 0 56948618HARLAN 9 6 222 157 4,1955804,618HAYES 11 11 916 916 22,18085222,115HITCHCOCK 8 8 298 298 14,78211914,603HOLT * * * * * 87211,422HOOKER 0 0 0 0 143281423HOWARD 7 7 200 200 3,6917044,195JEFFERSON 20 19 561 560 11,5531,32212,315JOHNSON 30 9 654 169 17,2402,35019,421KEARNEY * * * * * 176400KEITH 20 18 1,052 818 10,9981,52811,709KEYA PAHA 0 0 0 0 4300430
158
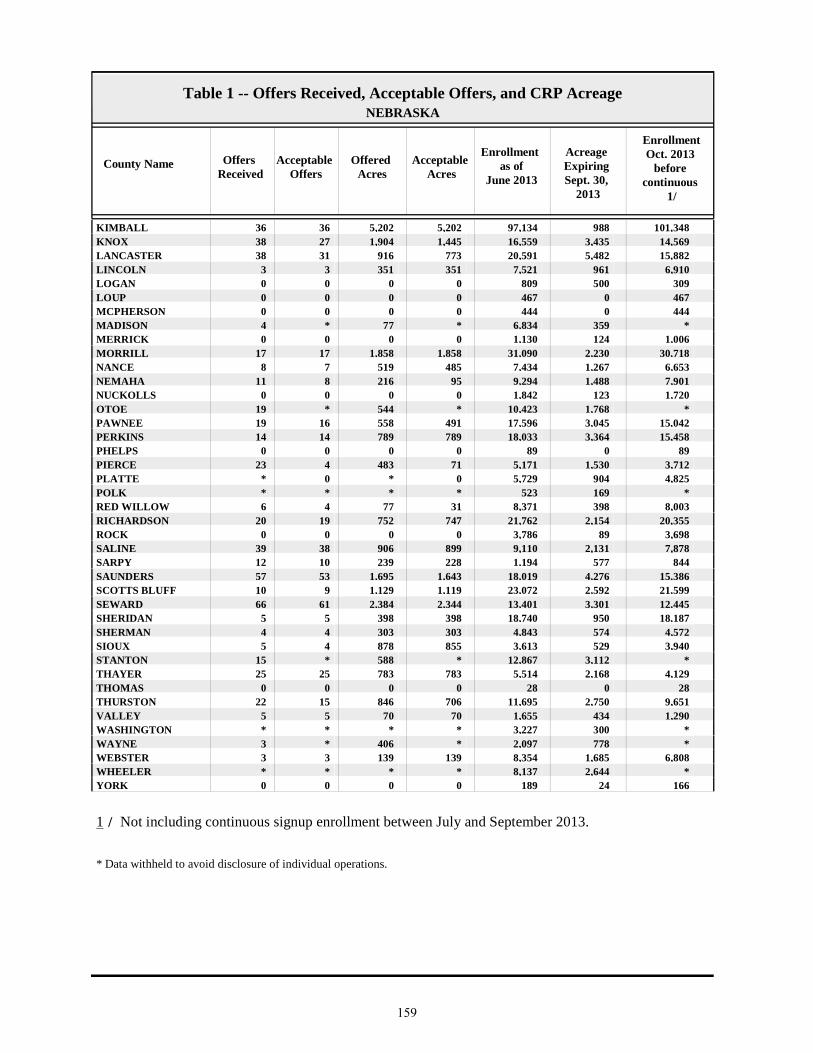
County Name Offers Received
Acceptable Offers
Offered Acres
Acceptable Acres
EnrollmentOct. 2013
before continuous
1/
Acreage Expiring Sept. 30,
2013
Enrollment as of
June 2013
Table 1 -- Offers Received, Acceptable Offers, and CRP AcreageNEBRASKA
KIMBALL 36 36 5,202 5,202 101,34898897,134KNOX 38 27 1,904 1,445 14,5693,43516,559LANCASTER 38 31 916 773 15,8825,48220,591LINCOLN 3 3 351 351 6,9109617,521LOGAN 0 0 0 0 309500809LOUP 0 0 0 0 4670467MCPHERSON 0 0 0 0 4440444MADISON 4 * 77 * * 3596,834MERRICK 0 0 0 0 1,0061241,130MORRILL 17 17 1,858 1,858 30,7182,23031,090NANCE 8 7 519 485 6,6531,2677,434NEMAHA 11 8 216 95 7,9011,4889,294NUCKOLLS 0 0 0 0 1,7201231,842OTOE 19 * 544 * * 1,76810,423PAWNEE 19 16 558 491 15,0423,04517,596PERKINS 14 14 789 789 15,4583,36418,033PHELPS 0 0 0 0 89089PIERCE 23 4 483 71 3,7121,5305,171PLATTE * 0 * 0 4,8259045,729POLK * * * * * 169523RED WILLOW 6 4 77 31 8,0033988,371RICHARDSON 20 19 752 747 20,3552,15421,762ROCK 0 0 0 0 3,698893,786SALINE 39 38 906 899 7,8782,1319,110SARPY 12 10 239 228 8445771,194SAUNDERS 57 53 1,695 1,643 15,3864,27618,019SCOTTS BLUFF 10 9 1,129 1,119 21,5992,59223,072SEWARD 66 61 2,384 2,344 12,4453,30113,401SHERIDAN 5 5 398 398 18,18795018,740SHERMAN 4 4 303 303 4,5725744,843SIOUX 5 4 878 855 3,9405293,613STANTON 15 * 588 * * 3,11212,867THAYER 25 25 783 783 4,1292,1685,514THOMAS 0 0 0 0 28028THURSTON 22 15 846 706 9,6512,75011,695VALLEY 5 5 70 70 1,2904341,655WASHINGTON * * * * * 3003,227WAYNE 3 * 406 * * 7782,097WEBSTER 3 3 139 139 6,8081,6858,354WHEELER * * * * * 2,6448,137YORK 0 0 0 0 16624189
1 / Not including continuous signup enrollment between July and September 2013.
* Data withheld to avoid disclosure of individual operations.
159

County NameExpiring
Sept. 2013 (Acres)
New Lands (Acres) 1/
Average Rental
Payment ($/Acre)
Total Rental
Payment ($/year)
Average EBI Score
without Cost
Average EBI Score with Cost
Table 2 -- Description of Signup 45 Acceptable AcresNEBRASKA
STATE TOTALS 26,973 12,936 $94.20 $3,759,273 204 276ADAMS * * * * * * ANTELOPE 72 110 $133.88 $24,286 187 242BANNER 0 1,060 $35.67 $37,813 180 285BOONE 1,067 0 $122.01 $130,204 170 230BOX BUTTE 0 310 $46.49 $14,397 148 247BOYD 126 0 $94.67 $11,957 157 228BUFFALO * * * * * * BURT 90 25 $194.69 $22,330 219 234BUTLER 623 117 $163.11 $120,782 249 282CASS * * * * * * CEDAR 284 70 $206.21 $72,894 259 267CHASE 1,966 265 $50.42 $112,517 150 248CHEYENNE 806 1,419 $36.23 $80,594 180 285CLAY * * * * * * CUSTER 0 90 $70.43 $6,311 156 241DAWES * * * * * * DAWSON * * * * * * DEUEL * * * * * * DIXON 348 0 $237.33 $82,589 256 256DODGE 70 0 $183.92 $12,948 207 234DOUGLAS * * * * * * DUNDY 1,017 247 $42.00 $53,100 172 278FRANKLIN 24 102 $89.62 $11,337 208 282FRONTIER * * * * * * FURNAS 176 110 $66.83 $19,107 152 239GAGE 1,615 14 $127.14 $207,087 253 306GARDEN 238 0 $34.09 $8,109 153 259GOSPER 84 0 $69.71 $5,876 187 273GREELEY 0 297 $120.17 $35,691 220 277HALL * * * * * * HARLAN 157 0 $90.83 $14,278 163 237HAYES 820 96 $50.24 $46,035 202 298HITCHCOCK 104 194 $50.87 $15,144 211 307HOLT * * * * * * HOWARD 62 139 $103.03 $20,638 194 260JEFFERSON 504 57 $128.92 $72,208 218 270JOHNSON 169 0 $117.10 $19,789 172 232KEARNEY * * * * * * KEITH 628 190 $45.40 $37,121 146 252KIMBALL 381 4,821 $34.27 $178,281 248 354KNOX 1,185 260 $196.99 $284,715 250 263LANCASTER 769 3 $160.19 $123,782 208 242LINCOLN 351 0 $49.66 $17,407 172 269MADISON * * * * * * MORRILL 1,839 19 $50.10 $93,102 209 307NANCE 311 175 $117.23 $56,913 210 268NEMAHA 85 10 $171.41 $16,352 236 266OTOE * * * * * * PAWNEE 273 219 $118.55 $58,243 163 225PERKINS 357 432 $40.18 $31,697 184 287PIERCE 65 6 $184.32 $13,161 213 233POLK * * * * * * RED WILLOW 31 0 $62.69 $1,962 142 234RICHARDSON 707 41 $179.99 $134,474 199 226
160
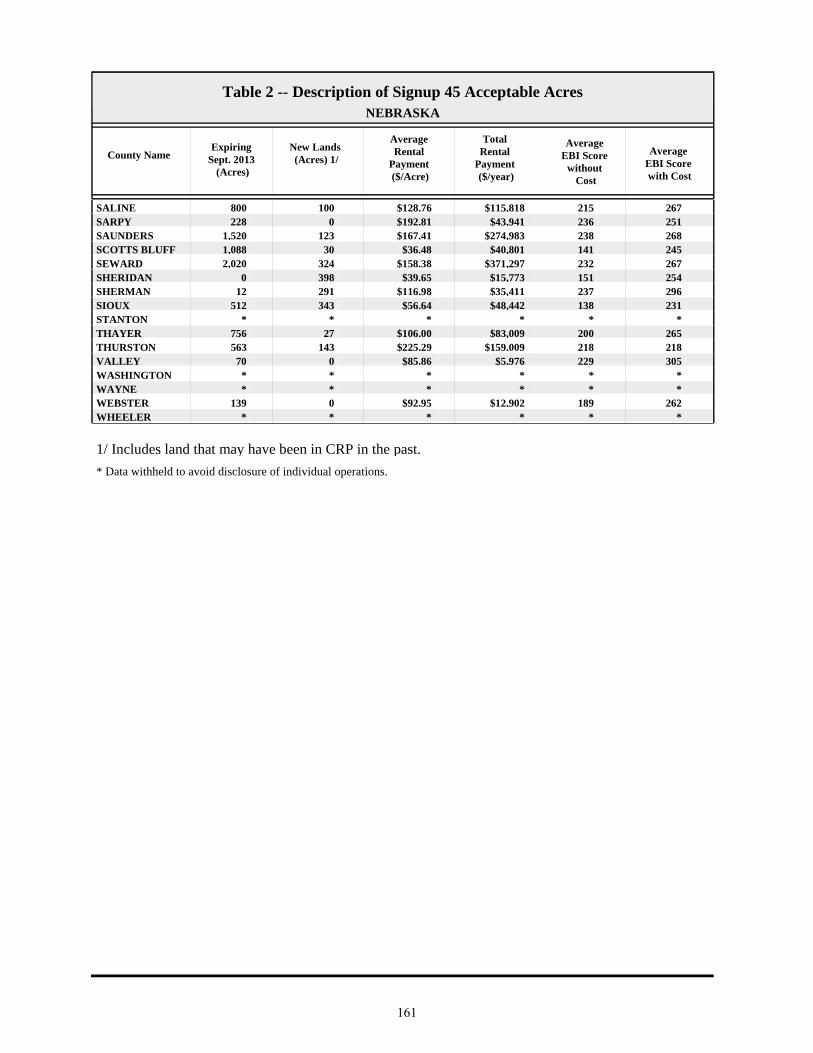
County NameExpiring
Sept. 2013 (Acres)
New Lands (Acres) 1/
Average Rental
Payment ($/Acre)
Total Rental
Payment ($/year)
Average EBI Score
without Cost
Average EBI Score with Cost
Table 2 -- Description of Signup 45 Acceptable AcresNEBRASKA
SALINE 800 100 $128.76 $115,818 215 267SARPY 228 0 $192.81 $43,941 236 251SAUNDERS 1,520 123 $167.41 $274,983 238 268SCOTTS BLUFF 1,088 30 $36.48 $40,801 141 245SEWARD 2,020 324 $158.38 $371,297 232 267SHERIDAN 0 398 $39.65 $15,773 151 254SHERMAN 12 291 $116.98 $35,411 237 296SIOUX 512 343 $56.64 $48,442 138 231STANTON * * * * * * THAYER 756 27 $106.00 $83,009 200 265THURSTON 563 143 $225.29 $159,009 218 218VALLEY 70 0 $85.86 $5,976 229 305WASHINGTON * * * * * * WAYNE * * * * * * WEBSTER 139 0 $92.95 $12,902 189 262WHEELER * * * * * *
* Data withheld to avoid disclosure of individual operations.
1/ Includes land that may have been in CRP in the past.
161

County Name
EI>=8 (Acres)
National Priority
Area
State Priority
Area (Acres)
Rare and Declining Habitat (Acres)
Permanent Wildlife Habitat (Acres)
Pollinator Habitat Offers
Table 3 -- Description of Signup 45 Acceptable AcresNEBRASKA
Average Erodibility Index (EI)
Pollinator Habitat (Acres)
STATE TOTALS 37,737 0 25,389 9,183 1,574 6814 469ADAMS * * * * * * * * ANTELOPE 180 0 57 0 0 1212 22BANNER 1,060 0 1,060 352 0 012 0BOONE 1,067 0 0 19 0 212 53BOX BUTTE 132 0 310 0 0 09 0BOYD 126 0 0 0 0 014 0BUFFALO * * * * * * * * BURT 115 0 0 0 3 221 2BUTLER 685 0 741 46 0 315 16CASS * * * * * * * * CEDAR 325 0 354 33 0 118 10CHASE 2,232 0 0 0 0 013 0CHEYENNE 1,393 0 2,224 807 872 09 0CLAY * * * * * * * * CUSTER 90 0 0 0 0 015 0DAWES * * * * * * * * DAWSON * * * * * * * * DEUEL * * * * * * * * DIXON 348 0 348 0 0 216 25DODGE 70 0 0 27 0 016 0DOUGLAS * * * * * * * * DUNDY 1,264 0 0 0 0 016 0FRANKLIN 127 0 0 0 0 217 3FRONTIER * * * * * * * * FURNAS 286 0 0 0 0 012 0GAGE 1,605 0 1,516 412 0 1715 66GARDEN 238 0 0 0 238 015 0GOSPER 84 0 0 0 0 015 0GREELEY 243 0 239 0 0 213 18HALL * * * * * * * * HARLAN 157 0 0 0 0 013 0HAYES 845 0 916 21 50 012 0HITCHCOCK 249 0 298 194 0 011 0HOLT * * * * * * * * HOWARD 200 0 200 0 0 211 3JEFFERSON 526 0 560 184 0 110 12JOHNSON 169 0 0 74 0 013 0KEARNEY * * * * * * * * KEITH 786 0 0 38 7 012 0KIMBALL 5,196 0 5,202 5,081 0 015 0KNOX 1,445 0 1,445 0 1 219 7LANCASTER 720 0 773 81 9 011 0LINCOLN 351 0 23 0 151 013 0MADISON * * * * * * * * MORRILL 1,858 0 1,858 0 10 015 0NANCE 486 0 0 0 0 020 0NEMAHA 95 0 0 72 0 430 9OTOE * * * * * * * * PAWNEE 491 0 0 75 0 511 25PERKINS 789 0 789 0 0 013 0PIERCE 71 0 0 0 0 017 0POLK * * * * * * * * RED WILLOW 8 0 0 22 0 08 0RICHARDSON 747 0 0 267 0 114 29SALINE 667 0 900 50 0 011 0
162

County Name
EI>=8 (Acres)
National Priority
Area
State Priority
Area (Acres)
Rare and Declining Habitat (Acres)
Permanent Wildlife Habitat (Acres)
Pollinator Habitat Offers
Table 3 -- Description of Signup 45 Acceptable AcresNEBRASKA
Average Erodibility Index (EI)
Pollinator Habitat (Acres)
SARPY 228 0 0 82 0 029 0SAUNDERS 1,643 0 1,643 118 0 014 0SCOTTS BLUFF 1,119 0 0 228 30 011 0SEWARD 2,344 0 2,344 5 60 014 0SHERIDAN 275 0 284 0 0 010 0SHERMAN 303 0 303 0 0 218 28SIOUX 855 0 0 343 0 013 0STANTON * * * * * * * * THAYER 585 0 783 7 13 19 7THURSTON 706 0 0 265 0 017 0VALLEY 70 0 70 0 0 021 0WASHINGTON * * * * * * * * WAYNE * * * * * * * * WEBSTER 139 0 0 0 67 018 0WHEELER * * * * * * * *
* Data withheld to avoid disclosure of individual operations.Note: Acceptable acres may be listed in multiple categories.
163

County NameIntroduced
GrassNative Grass Total
GrassHardwood
TreesSoftwood
TreesTotal Trees
Table 4 -- Description of Signup 45 Acceptable Acres 1/NEBRASKA
STATE TOTALS 1,739 26,843 28,583 30 10 40ADAMS * * * * * * ANTELOPE 0 159 159 0 0 0BANNER 532 176 708 0 0 0BOONE 0 996 996 0 0 0BOX BUTTE 297 12 310 0 0 0BOYD 0 126 126 0 0 0BUFFALO * * * * * * BURT 0 107 107 2 0 2BUTLER 113 566 679 0 0 0CASS * * * * * * CEDAR 59 252 310 0 0 0CHASE 0 2,230 2,230 0 2 2CHEYENNE 46 498 544 1 0 1CLAY * * * * * * CUSTER 0 90 90 0 0 0DAWES * * * * * * DAWSON * * * * * * DEUEL * * * * * * DIXON 183 138 322 2 0 2DODGE 0 42 42 0 0 0DOUGLAS * * * * * * DUNDY 0 1,264 1,264 0 0 0FRANKLIN 0 121 121 0 0 0FRONTIER * * * * * * FURNAS 0 286 286 0 0 0GAGE 56 1,088 1,143 0 0 0GARDEN 0 0 0 0 0 0GOSPER 0 84 84 0 0 0GREELEY 0 280 280 0 0 0HALL * * * * * * HARLAN 0 157 157 0 0 0HAYES 0 845 845 0 0 0HITCHCOCK 0 102 102 0 0 0HOLT * * * * * * HOWARD 0 197 197 0 0 0JEFFERSON 0 348 348 7 6 13JOHNSON 28 66 94 0 0 0KEARNEY * * * * * * KEITH 0 772 772 0 0 0KIMBALL 0 121 121 0 0 0KNOX 28 1,410 1,438 0 0 0LANCASTER 0 683 683 0 0 0LINCOLN 0 200 200 0 0 0MADISON * * * * * * MORRILL 0 1,841 1,841 1 0 1NANCE 0 481 481 0 0 0NEMAHA 0 15 15 0 0 0OTOE * * * * * * PAWNEE 0 390 390 0 0 0PERKINS 0 789 789 0 0 0PIERCE 0 71 71 0 0 0POLK * * * * * * RED WILLOW 0 9 9 0 0 0RICHARDSON 0 451 451 0 0 0SALINE 24 825 849 0 0 0
164
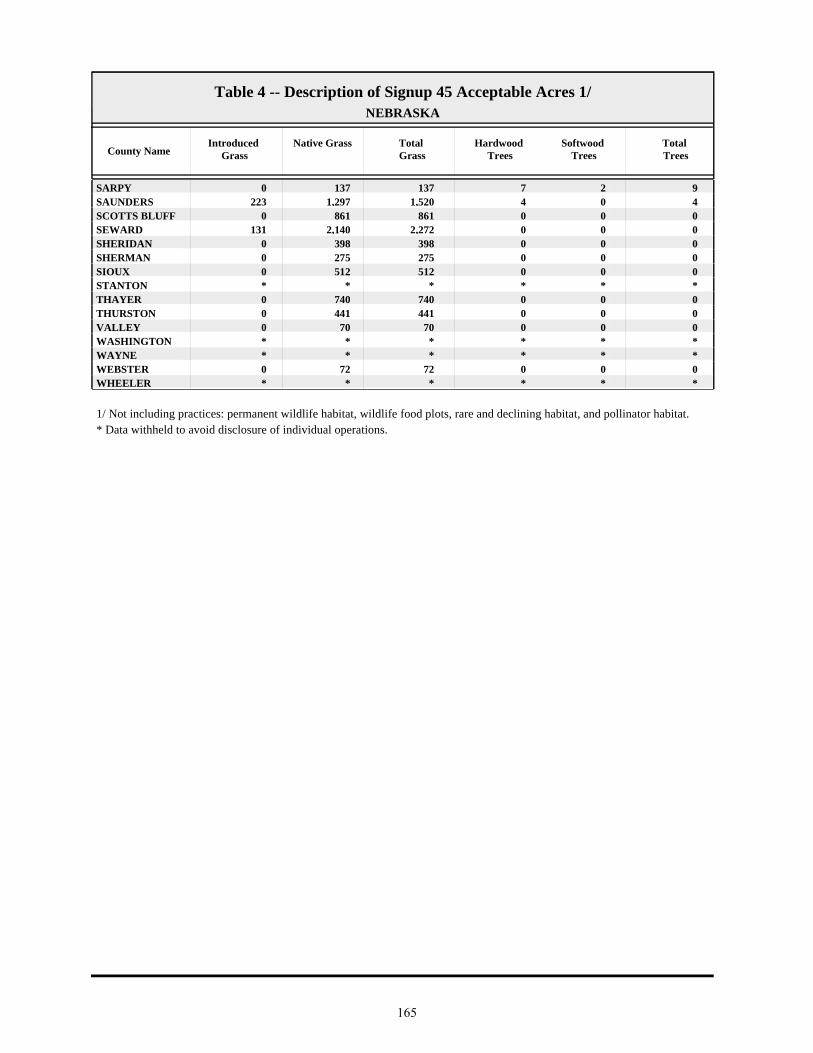
County NameIntroduced
GrassNative Grass Total
GrassHardwood
TreesSoftwood
TreesTotal Trees
Table 4 -- Description of Signup 45 Acceptable Acres 1/NEBRASKA
SARPY 0 137 137 7 2 9SAUNDERS 223 1,297 1,520 4 0 4SCOTTS BLUFF 0 861 861 0 0 0SEWARD 131 2,140 2,272 0 0 0SHERIDAN 0 398 398 0 0 0SHERMAN 0 275 275 0 0 0SIOUX 0 512 512 0 0 0STANTON * * * * * * THAYER 0 740 740 0 0 0THURSTON 0 441 441 0 0 0VALLEY 0 70 70 0 0 0WASHINGTON * * * * * * WAYNE * * * * * * WEBSTER 0 72 72 0 0 0WHEELER * * * * * *
* Data withheld to avoid disclosure of individual operations.1/ Not including practices: permanent wildlife habitat, wildlife food plots, rare and declining habitat, and pollinator habitat.
165

NEVADA
166

County Name Offers Received
Acceptable Offers
Offered Acres
Acceptable Acres
EnrollmentOct. 2013
before continuous
1/
Acreage Expiring Sept. 30,
2013
Enrollment as of
June 2013
Table 1 -- Offers Received, Acceptable Offers, and CRP AcreageNEVADA
STATE TOTALS 0 0 0 0 1460146CHURCHILL 0 0 0 0 * * 0CLARK 0 0 0 0 * * 0DOUGLAS 0 0 0 0 * * 0ELKO 0 0 0 0 * * 0ESMERALDA 0 0 0 0 * * 0EUREKA 0 0 0 0 1460146HUMBOLDT 0 0 0 0 * * 0LANDER 0 0 0 0 * * 0LINCOLN 0 0 0 0 * * 0LYON 0 0 0 0 * * 0MINERAL 0 0 0 0 * * 0NYE 0 0 0 0 * * 0PERSHING 0 0 0 0 * * 0STOREY 0 0 0 0 * * 0WASHOE 0 0 0 0 * * 0WHITE PINE 0 0 0 0 * * 0CARSON CITY 0 0 0 0 * * 0
1 / Not including continuous signup enrollment between July and September 2013.
* Data withheld to avoid disclosure of individual operations.
167

NEW HAMPSHIRE
168

County Name Offers Received
Acceptable Offers
Offered Acres
Acceptable Acres
EnrollmentOct. 2013
before continuous
1/
Acreage Expiring Sept. 30,
2013
Enrollment as of
June 2013
Table 1 -- Offers Received, Acceptable Offers, and CRP AcreageNEW HAMPSHIRE
STATE TOTALS 0 0 0 0 13013BELKNAP 0 0 0 0 404CARROLL 0 0 0 0 101CHESHIRE 0 0 0 0 * * 0COOS 0 0 0 0 * * 0GRAFTON 0 0 0 0 808HILLSBOROUGH 0 0 0 0 * * 0MERRIMACK 0 0 0 0 * * 0ROCKINGHAM 0 0 0 0 * * 0STRAFFORD 0 0 0 0 * * 0SULLIVAN 0 0 0 0 * * 0
1 / Not including continuous signup enrollment between July and September 2013.
* Data withheld to avoid disclosure of individual operations.
169

NEW JERSEY
170

County Name Offers Received
Acceptable Offers
Offered Acres
Acceptable Acres
EnrollmentOct. 2013
before continuous
1/
Acreage Expiring Sept. 30,
2013
Enrollment as of
June 2013
Table 1 -- Offers Received, Acceptable Offers, and CRP AcreageNEW JERSEY
STATE TOTALS 1 0 22 0 2,0411772,218ATLANTIC 0 0 0 0 42042BERGEN 0 0 0 0 * * 0BURLINGTON 0 0 0 0 505CAMDEN 0 0 0 0 * * 0CAPE MAY 0 0 0 0 * * 0CUMBERLAND 0 0 0 0 2900290ESSEX 0 0 0 0 * * 0GLOUCESTER 0 0 0 0 49049HUDSON 0 0 0 0 * * 0HUNTERDON 0 0 0 0 58492676MERCER * 0 * 0 762299MIDDLESEX 0 0 0 0 303MONMOUTH 0 0 0 0 134MORRIS 0 0 0 0 202OCEAN 0 0 0 0 * * 0PASSAIC 0 0 0 0 * * 0SALEM 0 0 0 0 7190719SOMERSET 0 0 0 0 9160151SUSSEX 0 0 0 0 19019UNION 0 0 0 0 * * 0WARREN 0 0 0 0 1590159
1 / Not including continuous signup enrollment between July and September 2013.
* Data withheld to avoid disclosure of individual operations.
171
NEW MEXICO
172

County Name Offers Received
Acceptable Offers
Offered Acres
Acceptable Acres
EnrollmentOct. 2013
before continuous
1/
Acreage Expiring Sept. 30,
2013
Enrollment as of
June 2013
Table 1 -- Offers Received, Acceptable Offers, and CRP AcreageNEW MEXICO
STATE TOTALS 277 91 61,042 19,476 425,8009,822416,146BERNALILLO 0 0 0 0 * * 0CATRON 0 0 0 0 * * 0CHAVES 0 0 0 0 * * 0CIBOLA 0 0 0 0 7020702COLFAX 4 0 531 0 188196384CURRY 45 17 10,304 3,471 142,7942,198141,521DE BACA 0 0 0 0 1,15101,151DONA ANA 0 0 0 0 * * 0EDDY 0 0 0 0 * * 0GRANT 0 0 0 0 * * 0GUADALUPE 0 0 0 0 1,54301,543HARDING 0 0 0 0 14,936014,936HIDALGO 0 0 0 0 * * 0LEA 4 4 400 400 21,81337821,791LINCOLN 0 0 0 0 * * 0LOS ALAMOS 0 0 0 0 * * 0LUNA 0 0 0 0 * * 0MCKINLEY 0 0 0 0 3070307MORA 0 0 0 0 * * 0OTERO 0 0 0 0 * * 0QUAY 69 43 16,001 8,702 83,4341,89776,629RIO ARRIBA 0 0 0 0 2620262ROOSEVELT 142 14 30,527 3,624 130,3363,340130,052SANDOVAL 0 0 0 0 * * 0SAN JUAN 0 0 0 0 * * 0SAN MIGUEL 0 0 0 0 8880888SANTA FE 0 0 0 0 * * 0SIERRA 0 0 0 0 * * 0SOCORRO 0 0 0 0 * * 0TAOS 0 0 0 0 * * 0TORRANCE 0 0 0 0 5,75905,759UNION 13 13 3,280 3,280 21,6871,81320,221VALENCIA 0 0 0 0 * * 0
1 / Not including continuous signup enrollment between July and September 2013.
* Data withheld to avoid disclosure of individual operations.
173

County NameExpiring
Sept. 2013 (Acres)
New Lands (Acres) 1/
Average Rental
Payment ($/Acre)
Total Rental
Payment ($/year)
Average EBI Score
without Cost
Average EBI Score with Cost
Table 2 -- Description of Signup 45 Acceptable AcresNEW MEXICO
STATE TOTALS 3,948 15,529 $31.99 $622,996 210 333CURRY 659 2,812 $33.61 $116,678 237 354LEA 378 22 $53.76 $21,491 187 281QUAY 1,098 7,605 $32.29 $280,995 197 323ROOSEVELT 0 3,624 $24.19 $87,648 252 389UNION 1,813 1,467 $35.43 $116,185 175 280
* Data withheld to avoid disclosure of individual operations.
1/ Includes land that may have been in CRP in the past.
174

County Name
EI>=8 (Acres)
National Priority
Area
State Priority
Area (Acres)
Rare and Declining Habitat (Acres)
Permanent Wildlife Habitat (Acres)
Pollinator Habitat Offers
Table 3 -- Description of Signup 45 Acceptable AcresNEW MEXICO
Average Erodibility Index (EI)
Pollinator Habitat (Acres)
STATE TOTALS 19,476 0 19,476 0 0 026 0CURRY 3,471 0 3,471 0 0 021 0LEA 400 0 400 0 0 063 0QUAY 8,702 0 8,702 0 0 021 0ROOSEVELT 3,624 0 3,624 0 0 040 0UNION 3,280 0 3,280 0 0 024 0
* Data withheld to avoid disclosure of individual operations.Note: Acceptable acres may be listed in multiple categories.
175

County NameIntroduced
GrassNative Grass Total
GrassHardwood
TreesSoftwood
TreesTotal Trees
Table 4 -- Description of Signup 45 Acceptable Acres 1/NEW MEXICO
STATE TOTALS 3,941 15,535 19,476 0 0 0CURRY 0 3,471 3,471 0 0 0LEA 166 234 400 0 0 0QUAY 1,963 6,740 8,702 0 0 0ROOSEVELT 0 3,624 3,624 0 0 0UNION 1,813 1,467 3,280 0 0 0
* Data withheld to avoid disclosure of individual operations.1/ Not including practices: permanent wildlife habitat, wildlife food plots, rare and declining habitat, and pollinator habitat.
176

NEW YORK
177

County Name Offers Received
Acceptable Offers
Offered Acres
Acceptable Acres
EnrollmentOct. 2013
before continuous
1/
Acreage Expiring Sept. 30,
2013
Enrollment as of
June 2013
Table 1 -- Offers Received, Acceptable Offers, and CRP AcreageNEW YORK
STATE TOTALS 47 38 1,154 929 44,5514,02347,645ALBANY 0 0 0 0 2150215ALLEGANY 4 4 95 95 1,7002411,847BRONX 0 0 0 0 * * 0BROOME 0 0 0 0 1,886291,915CATTARAUGUS * * * * * 891,659CAYUGA 4 4 104 104 1,5783881,862CHAUTAUQUA * * * * * 26721CHEMUNG 0 0 0 0 62835662CHENANGO 0 0 0 0 5,2213775,598CLINTON 0 0 0 0 29432COLUMBIA * 0 * 0 45163514CORTLAND 0 0 0 0 2,999183,017DELAWARE 0 0 0 0 2,416402,456DUTCHESS 0 0 0 0 191837ERIE * * * * * 56670ESSEX 0 0 0 0 1820182FRANKLIN 0 0 0 0 19612208FULTON 0 0 0 0 311849GENESEE * * * * * 39768GREENE 0 0 0 0 23838276HAMILTON 0 0 0 0 * * 0HERKIMER 0 0 0 0 1,10401,104JEFFERSON * * * * * 2861,662KINGS 0 0 0 0 * * 0LEWIS 0 0 0 0 661985LIVINGSTON 7 6 150 142 2,4503452,653MADISON 0 0 0 0 84138879MONROE * * * * * 3538MONTGOMERY 0 0 0 0 1270127NASSAU 0 0 0 0 * * 0NEW YORK 0 0 0 0 * * 0NIAGARA 3 * 64 * * 90328ONEIDA * * * * * 281,532ONONDAGA * * * * * 90932ONTARIO * 0 * 0 1,3912841,674ORANGE 0 0 0 0 1,66901,669ORLEANS 3 3 42 42 71476749OSWEGO 0 0 0 0 702293OTSEGO 0 0 0 0 4880488PUTNAM 0 0 0 0 * * 0QUEENS 0 0 0 0 * * 0RENSSELAER 0 0 0 0 1280128RICHMOND 0 0 0 0 * * 0ROCKLAND 0 0 0 0 * * 0ST LAWRENCE 0 0 0 0 1,20801,208SARATOGA 0 0 0 0 69170SCHENECTADY 0 0 0 0 * * 0SCHOHARIE 0 0 0 0 3540354SCHUYLER 0 0 0 0 3100310SENECA 0 0 0 0 751084STEUBEN 4 3 20 18 3,3088674,157SUFFOLK 0 0 0 0 * * 0
178

County Name Offers Received
Acceptable Offers
Offered Acres
Acceptable Acres
EnrollmentOct. 2013
before continuous
1/
Acreage Expiring Sept. 30,
2013
Enrollment as of
June 2013
Table 1 -- Offers Received, Acceptable Offers, and CRP AcreageNEW YORK
SULLIVAN 0 0 0 0 36036TIOGA * * * * * 721,166TOMPKINS 0 0 0 0 4630463ULSTER 0 0 0 0 707WARREN 0 0 0 0 * * 0WASHINGTON * * * * * 22207WAYNE * * * * * 57506WESTCHESTER 0 0 0 0 * * 0WYOMING * * * * * 60748YATES * 0 * 0 8391621,001
1 / Not including continuous signup enrollment between July and September 2013.
* Data withheld to avoid disclosure of individual operations.
179

County NameExpiring
Sept. 2013 (Acres)
New Lands (Acres) 1/
Average Rental
Payment ($/Acre)
Total Rental
Payment ($/year)
Average EBI Score
without Cost
Average EBI Score with Cost
Table 2 -- Description of Signup 45 Acceptable AcresNEW YORK
STATE TOTALS 836 93 $53.15 $49,368 158 254ALLEGANY 95 0 $40.03 $3,782 181 287CATTARAUGUS * * * * * * CAYUGA 104 0 $72.71 $7,562 180 263CHAUTAUQUA * * * * * * ERIE * * * * * * GENESEE * * * * * * JEFFERSON * * * * * * LIVINGSTON 121 21 $61.12 $8,678 158 249MONROE * * * * * * NIAGARA * * * * * * ONEIDA * * * * * * ONONDAGA * * * * * * ORLEANS 42 0 $60.49 $2,535 148 239STEUBEN 0 18 $28.50 $510 129 252TIOGA * * * * * * WASHINGTON * * * * * * WAYNE * * * * * * WYOMING * * * * * *
* Data withheld to avoid disclosure of individual operations.
1/ Includes land that may have been in CRP in the past.
180

County Name
EI>=8 (Acres)
National Priority
Area
State Priority
Area (Acres)
Rare and Declining Habitat (Acres)
Permanent Wildlife Habitat (Acres)
Pollinator Habitat Offers
Table 3 -- Description of Signup 45 Acceptable AcresNEW YORK
Average Erodibility Index (EI)
Pollinator Habitat (Acres)
STATE TOTALS 768 907 0 0 28 113 1ALLEGANY 95 95 0 0 0 120 1CATTARAUGUS * * * * * * * * CAYUGA 104 104 0 0 0 017 0CHAUTAUQUA * * * * * * * * ERIE * * * * * * * * GENESEE * * * * * * * * JEFFERSON * * * * * * * * LIVINGSTON 116 142 0 0 13 012 0MONROE * * * * * * * * NIAGARA * * * * * * * * ONEIDA * * * * * * * * ONONDAGA * * * * * * * * ORLEANS 0 42 0 0 0 05 0STEUBEN 18 18 0 0 0 013 0TIOGA * * * * * * * * WASHINGTON * * * * * * * * WAYNE * * * * * * * * WYOMING * * * * * * * *
* Data withheld to avoid disclosure of individual operations.Note: Acceptable acres may be listed in multiple categories.
181

County NameIntroduced
GrassNative Grass Total
GrassHardwood
TreesSoftwood
TreesTotal Trees
Table 4 -- Description of Signup 45 Acceptable Acres 1/NEW YORK
STATE TOTALS 693 100 793 14 66 80ALLEGANY 35 57 91 2 0 2CATTARAUGUS * * * * * * CAYUGA 96 0 96 0 0 0CHAUTAUQUA * * * * * * ERIE * * * * * * GENESEE * * * * * * JEFFERSON * * * * * * LIVINGSTON 106 15 121 1 5 6MONROE * * * * * * NIAGARA * * * * * * ONEIDA * * * * * * ONONDAGA * * * * * * ORLEANS 39 0 39 0 1 1STEUBEN 18 0 18 0 0 0TIOGA * * * * * * WASHINGTON * * * * * * WAYNE * * * * * * WYOMING * * * * * *
* Data withheld to avoid disclosure of individual operations.1/ Not including practices: permanent wildlife habitat, wildlife food plots, rare and declining habitat, and pollinator habitat.
182

NO
RT
H C
AR
OL
INA
183

County Name Offers Received
Acceptable Offers
Offered Acres
Acceptable Acres
EnrollmentOct. 2013
before continuous
1/
Acreage Expiring Sept. 30,
2013
Enrollment as of
June 2013
Table 1 -- Offers Received, Acceptable Offers, and CRP AcreageNORTH CAROLINA
STATE TOTALS 194 167 4,028 3,622 102,1547,745106,278ALAMANCE * * * * * 398ALEXANDER 0 0 0 0 1420142ALLEGHANY 0 0 0 0 101ANSON 21 18 1,525 1,279 5,1991,8795,800ASHE 0 0 0 0 * * 0AVERY 0 0 0 0 * * 0BEAUFORT 0 0 0 0 2,569202,589BERTIE 0 0 0 0 1,006411,047BLADEN * * * * * 1212,262BRUNSWICK 0 0 0 0 01717BUNCOMBE 0 0 0 0 86591BURKE 0 0 0 0 71071CABARRUS 5 5 120 120 381290551CALDWELL 0 0 0 0 707CAMDEN 0 0 0 0 282553CARTERET 0 0 0 0 13013CASWELL 3 3 106 106 894126914CATAWBA * * * * * 84455CHATHAM 0 0 0 0 64033674CHEROKEE 0 0 0 0 22022CHOWAN 0 0 0 0 4060406CLAY 0 0 0 0 202CLEVELAND * * * * * 7013,932COLUMBUS 0 0 0 0 2,69002,690CRAVEN 0 0 0 0 1,98901,989CUMBERLAND 0 0 0 0 1,413241,437CURRITUCK 0 0 0 0 23428DARE 0 0 0 0 1,41401,414DAVIDSON 4 4 84 84 48687489DAVIE * * * * * 38283DUPLIN 0 0 0 0 8811882DURHAM 0 0 0 0 24522268EDGECOMBE 0 0 0 0 4,79894,808FORSYTH 0 0 0 0 53053FRANKLIN 20 20 217 217 2,2974192,498GASTON * * * * * 88539GATES 0 0 0 0 1,76001,760GRAHAM 0 0 0 0 * * 0GRANVILLE 11 11 150 150 2,5442082,602GREENE 0 0 0 0 1,013681,081GUILFORD 0 0 0 0 77077HALIFAX 17 14 251 224 8,5893888,753HARNETT * * * * * 171,498HAYWOOD 0 0 0 0 808HENDERSON 0 0 0 0 21021HERTFORD 0 0 0 0 2,007252,032HOKE 0 0 0 0 1,829541,883HYDE 0 0 0 0 5,862685,929IREDELL * * * * * 121904JACKSON 0 0 0 0 * * 0JOHNSTON 13 13 186 186 3,2132343,262JONES 0 0 0 0 4980498LEE 0 0 0 0 85085LENOIR 0 0 0 0 1,4191681,587LINCOLN 3 3 44 44 1,1832011,340
184
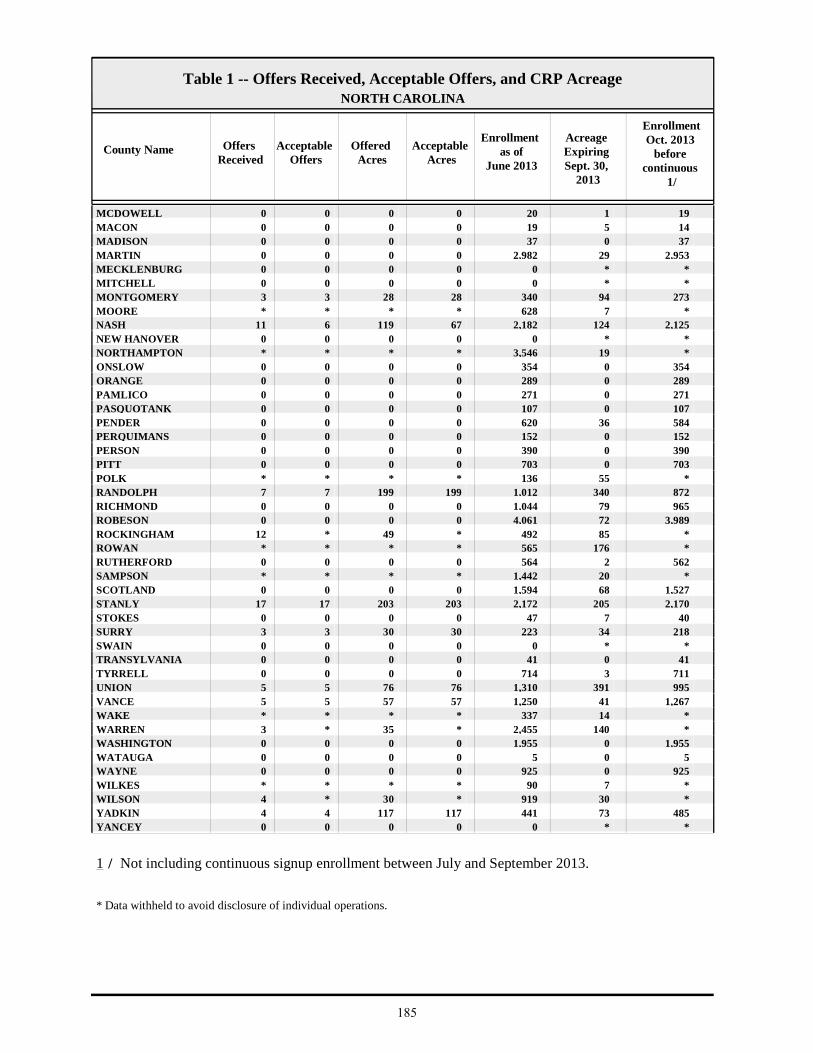
County Name Offers Received
Acceptable Offers
Offered Acres
Acceptable Acres
EnrollmentOct. 2013
before continuous
1/
Acreage Expiring Sept. 30,
2013
Enrollment as of
June 2013
Table 1 -- Offers Received, Acceptable Offers, and CRP AcreageNORTH CAROLINA
MCDOWELL 0 0 0 0 19120MACON 0 0 0 0 14519MADISON 0 0 0 0 37037MARTIN 0 0 0 0 2,953292,982MECKLENBURG 0 0 0 0 * * 0MITCHELL 0 0 0 0 * * 0MONTGOMERY 3 3 28 28 27394340MOORE * * * * * 7628NASH 11 6 119 67 2,1251242,182NEW HANOVER 0 0 0 0 * * 0NORTHAMPTON * * * * * 193,546ONSLOW 0 0 0 0 3540354ORANGE 0 0 0 0 2890289PAMLICO 0 0 0 0 2710271PASQUOTANK 0 0 0 0 1070107PENDER 0 0 0 0 58436620PERQUIMANS 0 0 0 0 1520152PERSON 0 0 0 0 3900390PITT 0 0 0 0 7030703POLK * * * * * 55136RANDOLPH 7 7 199 199 8723401,012RICHMOND 0 0 0 0 965791,044ROBESON 0 0 0 0 3,989724,061ROCKINGHAM 12 * 49 * * 85492ROWAN * * * * * 176565RUTHERFORD 0 0 0 0 5622564SAMPSON * * * * * 201,442SCOTLAND 0 0 0 0 1,527681,594STANLY 17 17 203 203 2,1702052,172STOKES 0 0 0 0 40747SURRY 3 3 30 30 21834223SWAIN 0 0 0 0 * * 0TRANSYLVANIA 0 0 0 0 41041TYRRELL 0 0 0 0 7113714UNION 5 5 76 76 9953911,310VANCE 5 5 57 57 1,267411,250WAKE * * * * * 14337WARREN 3 * 35 * * 1402,455WASHINGTON 0 0 0 0 1,95501,955WATAUGA 0 0 0 0 505WAYNE 0 0 0 0 9250925WILKES * * * * * 790WILSON 4 * 30 * * 30919YADKIN 4 4 117 117 48573441YANCEY 0 0 0 0 * * 0
1 / Not including continuous signup enrollment between July and September 2013.
* Data withheld to avoid disclosure of individual operations.
185

County NameExpiring
Sept. 2013 (Acres)
New Lands (Acres) 1/
Average Rental
Payment ($/Acre)
Total Rental
Payment ($/year)
Average EBI Score
without Cost
Average EBI Score with Cost
Table 2 -- Description of Signup 45 Acceptable AcresNORTH CAROLINA
STATE TOTALS 3,367 255 $63.89 $231,403 175 269ALAMANCE * * * * * * ANSON 1,279 0 $70.89 $90,645 171 255BLADEN * * * * * * CABARRUS 120 0 $38.86 $4,644 208 331CASWELL 106 0 $31.10 $3,281 204 318CATAWBA * * * * * * CLEVELAND * * * * * * DAVIDSON 55 29 $43.10 $3,616 180 287DAVIE * * * * * * FRANKLIN 209 9 $50.90 $11,066 173 270GASTON * * * * * * GRANVILLE 136 14 $37.74 $5,665 142 246HALIFAX 188 36 $107.78 $24,099 200 274HARNETT * * * * * * IREDELL * * * * * * JOHNSTON 186 0 $79.92 $14,850 165 245LINCOLN 44 0 $32.81 $1,440 150 270MONTGOMERY 28 0 $34.89 $963 206 311MOORE * * * * * * NASH 67 0 $106.27 $7,077 171 235NORTHAMPTON * * * * * * POLK * * * * * * RANDOLPH 199 0 $41.60 $8,292 193 294ROCKINGHAM * * * * * * ROWAN * * * * * * SAMPSON * * * * * * STANLY 168 36 $80.94 $16,463 213 314SURRY 26 4 $85.91 $2,560 221 297UNION 76 0 $83.54 $6,383 242 320VANCE 32 25 $41.19 $2,352 132 233WAKE * * * * * * WARREN * * * * * * WILKES * * * * * * WILSON * * * * * * YADKIN 72 45 $45.53 $5,318 129 252
* Data withheld to avoid disclosure of individual operations.
1/ Includes land that may have been in CRP in the past.
186

County Name
EI>=8 (Acres)
National Priority
Area
State Priority
Area (Acres)
Rare and Declining Habitat (Acres)
Permanent Wildlife Habitat (Acres)
Pollinator Habitat Offers
Table 3 -- Description of Signup 45 Acceptable AcresNORTH CAROLINA
Average Erodibility Index (EI)
Pollinator Habitat (Acres)
STATE TOTALS 3,329 1,898 1,226 0 195 020 0ALAMANCE * * * * * * * * ANSON 1,279 1,279 0 0 0 021 0BLADEN * * * * * * * * CABARRUS 114 0 0 0 0 037 0CASWELL 106 0 0 0 0 017 0CATAWBA * * * * * * * * CLEVELAND * * * * * * * * DAVIDSON 84 0 0 0 0 019 0DAVIE * * * * * * * * FRANKLIN 146 0 217 0 50 020 0GASTON * * * * * * * * GRANVILLE 147 0 24 0 0 014 0HALIFAX 157 224 0 0 60 08 0HARNETT * * * * * * * * IREDELL * * * * * * * * JOHNSTON 113 186 186 0 0 011 0LINCOLN 44 0 44 0 0 012 0MONTGOMERY 28 28 0 0 0 024 0MOORE * * * * * * * * NASH 67 67 67 0 11 012 0NORTHAMPTON * * * * * * * * POLK * * * * * * * * RANDOLPH 199 0 0 0 0 030 0ROCKINGHAM * * * * * * * * ROWAN * * * * * * * * SAMPSON * * * * * * * * STANLY 203 0 203 0 9 038 0SURRY 30 0 30 0 0 061 0UNION 76 0 76 0 25 029 0VANCE 30 0 57 0 0 08 0WAKE * * * * * * * * WARREN * * * * * * * * WILKES * * * * * * * * WILSON * * * * * * * * YADKIN 72 0 117 0 0 012 0
* Data withheld to avoid disclosure of individual operations.Note: Acceptable acres may be listed in multiple categories.
187

County NameIntroduced
GrassNative Grass Total
GrassHardwood
TreesSoftwood
TreesTotal Trees
Table 4 -- Description of Signup 45 Acceptable Acres 1/NORTH CAROLINA
STATE TOTALS 153 0 153 22 3,252 3,275ALAMANCE * * * * * * ANSON 0 0 0 0 1,279 1,279BLADEN * * * * * * CABARRUS 0 0 0 0 120 120CASWELL 0 0 0 0 106 106CATAWBA * * * * * * CLEVELAND * * * * * * DAVIDSON 0 0 0 0 84 84DAVIE * * * * * * FRANKLIN 9 0 9 4 155 159GASTON * * * * * * GRANVILLE 0 0 0 0 150 150HALIFAX 0 0 0 0 164 164HARNETT * * * * * * IREDELL * * * * * * JOHNSTON 24 0 24 16 146 162LINCOLN 0 0 0 0 44 44MONTGOMERY 0 0 0 0 28 28MOORE * * * * * * NASH 0 0 0 0 56 56NORTHAMPTON * * * * * * POLK * * * * * * RANDOLPH 22 0 22 0 177 177ROCKINGHAM * * * * * * ROWAN * * * * * * SAMPSON * * * * * * STANLY 12 0 12 0 182 182SURRY 1 0 1 0 29 29UNION 0 0 0 0 52 52VANCE 0 0 0 0 57 57WAKE * * * * * * WARREN * * * * * * WILKES * * * * * * WILSON * * * * * * YADKIN 45 0 45 0 72 72
* Data withheld to avoid disclosure of individual operations.1/ Not including practices: permanent wildlife habitat, wildlife food plots, rare and declining habitat, and pollinator habitat.
188
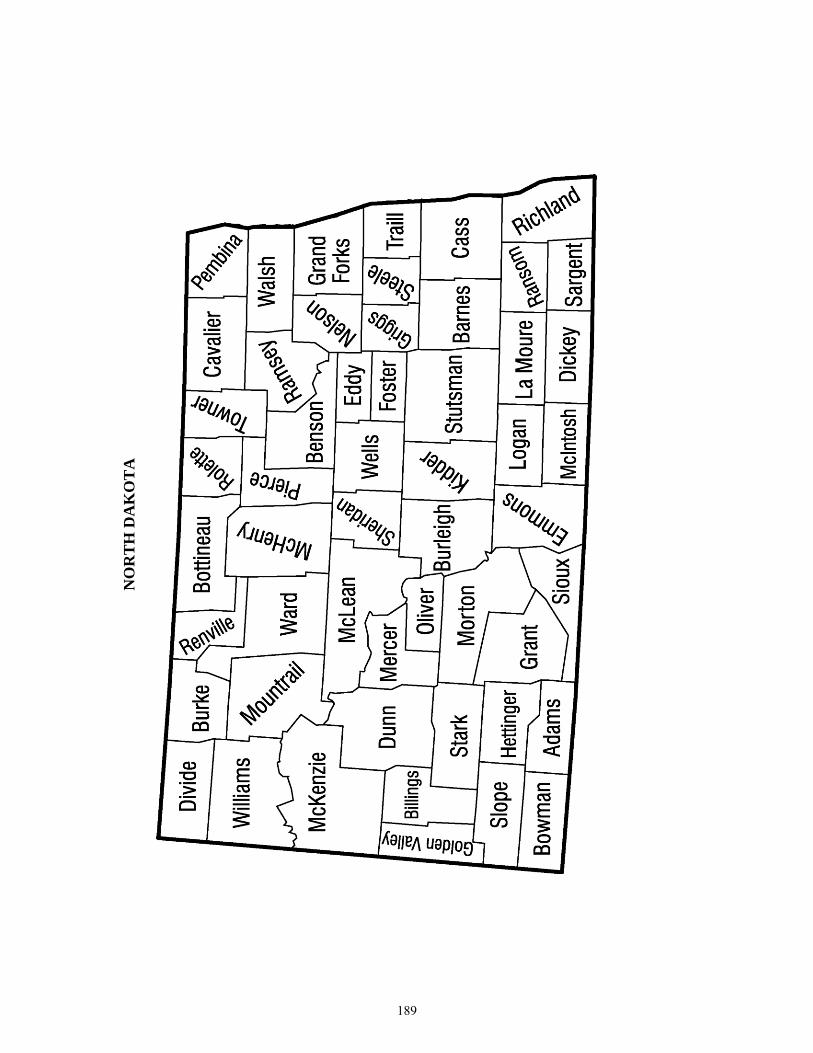
NO
RT
H D
AK
OT
A
189

County Name Offers Received
Acceptable Offers
Offered Acres
Acceptable Acres
EnrollmentOct. 2013
before continuous
1/
Acreage Expiring Sept. 30,
2013
Enrollment as of
June 2013
Table 1 -- Offers Received, Acceptable Offers, and CRP AcreageNORTH DAKOTA
STATE TOTALS 1,055 731 71,114 49,406 1,585,689254,7731,791,056ADAMS 13 9 734 526 39,5371,13640,147BARNES 109 94 5,301 4,938 56,58414,84566,491BENSON 15 14 1,068 922 28,4335,26132,773BILLINGS 0 0 0 0 4,11654,120BOTTINEAU 63 36 3,114 1,526 55,22016,93870,631BOWMAN 6 4 789 479 30,82516730,514BURKE 30 21 2,899 2,057 39,7126,34143,996BURLEIGH 7 4 625 291 29,1373,44032,286CASS 32 17 1,510 1,080 20,8015,06624,787CAVALIER 27 12 1,107 525 19,57711,05930,111DICKEY 25 6 2,326 496 33,4278,00640,937DIVIDE 60 54 5,846 5,330 61,5298,15864,357DUNN * 0 * 0 8,36708,367EDDY 17 12 1,637 1,411 33,9392,53335,061EMMONS 11 7 771 546 17,4763,70120,631FOSTER 7 * 913 * * 3,78516,045GOLDEN VALLEY 6 6 253 253 23,60383024,181GRAND FORKS 75 54 3,743 2,900 76,8788,27782,255GRANT 6 3 296 145 25,5943825,487GRIGGS 25 24 1,498 1,494 39,36912,53250,408HETTINGER 20 19 750 739 69,1351,17669,573KIDDER 5 * 575 * * 3,13648,249LA MOURE 22 17 1,169 779 37,4128,03944,671LOGAN 3 * 327 * * 3,56916,541MCHENRY 16 13 961 905 60,8148,42268,331MCINTOSH * * * * * 1,5359,291MCKENZIE * * * * * 2268,461MCLEAN 18 11 735 434 37,1827,74944,498MERCER * 0 * 0 1,6851,3463,031MORTON 6 * 271 * * 3947,754MOUNTRAIL 42 24 4,749 2,920 35,7504,86437,694NELSON 105 90 7,322 6,184 68,10214,08476,002OLIVER * 0 * 0 7664770PEMBINA 35 20 2,462 1,564 14,5134,74617,695PIERCE 5 4 508 488 29,6535,24834,413RAMSEY 8 6 487 281 32,8228,66941,210RANSOM 38 35 2,414 2,289 49,1435,24952,103RENVILLE 4 3 117 105 9,3761,44910,720RICHLAND 15 10 566 448 26,9634,14830,662ROLETTE 3 0 231 0 33,6146,69040,304SARGENT 7 3 350 157 39,4511,45140,745SHERIDAN 11 3 681 315 16,7835,52921,998SIOUX 0 0 0 0 1,43591,444SLOPE * * * * * 15314,127STARK 4 4 415 415 29,38795929,931STEELE 33 20 1,906 1,360 14,2794,82817,746STUTSMAN 10 8 500 329 61,35610,13871,165TOWNER 6 3 282 187 39,5006,13445,447TRAILL 8 6 150 139 12,23776512,862WALSH 43 23 2,287 1,238 56,7538,08463,599
190

County Name Offers Received
Acceptable Offers
Offered Acres
Acceptable Acres
EnrollmentOct. 2013
before continuous
1/
Acreage Expiring Sept. 30,
2013
Enrollment as of
June 2013
Table 1 -- Offers Received, Acceptable Offers, and CRP AcreageNORTH DAKOTA
WARD 6 6 655 655 18,3532,07219,771WELLS 3 * 227 * * 7,59429,077WILLIAMS 38 15 5,097 1,793 15,1794,19617,583
1 / Not including continuous signup enrollment between July and September 2013.
* Data withheld to avoid disclosure of individual operations.
191

County NameExpiring
Sept. 2013 (Acres)
New Lands (Acres) 1/
Average Rental
Payment ($/Acre)
Total Rental
Payment ($/year)
Average EBI Score
without Cost
Average EBI Score with Cost
Table 2 -- Description of Signup 45 Acceptable AcresNORTH DAKOTA
STATE TOTALS 32,867 16,539 $52.66 $2,601,856 143 242ADAMS 36 490 $32.83 $17,272 139 245BARNES 4,323 615 $68.08 $336,166 146 234BENSON 740 181 $43.97 $40,528 148 255BOTTINEAU 1,312 214 $40.90 $62,425 112 226BOWMAN 0 479 $30.03 $14,370 127 235BURKE 1,308 749 $33.71 $69,336 142 248BURLEIGH 6 284 $42.10 $12,229 127 228CASS 1,013 67 $93.39 $100,845 149 232CAVALIER 276 249 $48.62 $25,530 125 228DICKEY 0 496 $74.55 $36,971 140 230DIVIDE 3,292 2,039 $30.47 $162,424 143 251EDDY 631 780 $43.48 $61,344 164 265EMMONS 438 108 $63.82 $34,845 151 245FOSTER * * * * * * GOLDEN VALLEY 253 0 $25.98 $6,564 140 272GRAND FORKS 2,443 458 $61.67 $178,876 148 255GRANT 27 117 $34.02 $4,917 112 218GRIGGS 1,355 139 $51.37 $76,733 162 261HETTINGER 317 422 $37.55 $27,743 185 289KIDDER * * * * * * LA MOURE 668 111 $75.65 $58,921 133 226LOGAN * * * * * * MCHENRY 748 157 $40.94 $37,027 145 251MCINTOSH * * * * * * MCKENZIE * * * * * * MCLEAN 282 152 $43.98 $19,073 128 237MORTON * * * * * * MOUNTRAIL 596 2,324 $37.94 $110,787 138 241NELSON 4,165 2,020 $57.81 $357,521 141 234PEMBINA 1,457 107 $77.54 $121,294 139 239PIERCE 20 468 $44.12 $21,524 117 219RAMSEY 171 110 $46.75 $13,137 128 229RANSOM 1,835 455 $88.04 $201,560 149 227RENVILLE 105 0 $43.13 $4,516 118 219RICHLAND 173 276 $101.13 $45,348 178 251SARGENT 9 148 $75.75 $11,855 146 228SHERIDAN 315 0 $34.06 $10,734 154 260SLOPE * * * * * * STARK 0 415 $35.72 $14,805 157 263STEELE 1,356 5 $56.12 $76,350 148 242STUTSMAN 281 49 $63.76 $20,984 146 241TOWNER 187 0 $34.73 $6,498 110 216TRAILL 0 139 $75.53 $10,506 148 236WALSH 972 266 $64.05 $79,273 120 231WARD 339 316 $42.63 $27,923 130 233WELLS * * * * * * WILLIAMS 919 874 $27.19 $48,739 136 253
* Data withheld to avoid disclosure of individual operations.
1/ Includes land that may have been in CRP in the past.
192

County Name
EI>=8 (Acres)
National Priority
Area
State Priority
Area (Acres)
Rare and Declining Habitat (Acres)
Permanent Wildlife Habitat (Acres)
Pollinator Habitat Offers
Table 3 -- Description of Signup 45 Acceptable AcresNORTH DAKOTA
Average Erodibility Index (EI)
Pollinator Habitat (Acres)
STATE TOTALS 27,437 46,524 3,086 720 34,981 189 158ADAMS 526 0 500 0 517 012 0BARNES 1,108 4,938 0 76 4,254 17 3BENSON 259 922 0 0 922 07 0BOTTINEAU 583 1,526 0 0 96 17 4BOWMAN 479 0 479 0 0 015 0BURKE 1,983 2,057 0 0 1,182 011 0BURLEIGH 33 291 0 0 280 07 0CASS 111 1,080 0 93 961 06 0CAVALIER 162 525 0 119 372 17 2DICKEY 269 496 0 0 474 28 13DIVIDE 4,873 5,331 0 0 4,107 012 0EDDY 1,356 1,411 0 0 1,120 013 0EMMONS 475 546 0 0 471 111 7FOSTER * * * * * * * * GOLDEN VALLEY 253 0 0 0 0 020 0GRAND FORKS 1,842 2,900 0 174 1,442 010 0GRANT 145 0 117 0 117 011 0GRIGGS 1,172 1,494 0 0 1,366 011 0HETTINGER 674 0 739 0 719 014 0KIDDER * * * * * * * * LA MOURE 132 779 0 0 778 05 0LOGAN * * * * * * * * MCHENRY 767 905 386 0 388 111 39MCINTOSH * * * * * * * * MCKENZIE * * * * * * * * MCLEAN 343 434 0 0 406 09 0MORTON * * * * * * * * MOUNTRAIL 2,694 2,920 0 0 672 010 0NELSON 413 6,185 0 0 6,012 06 0PEMBINA 1,464 1,564 0 0 1,133 811 65PIERCE 133 488 0 0 355 010 0RAMSEY 89 281 0 0 281 06 0RANSOM 501 2,289 0 0 2,158 16 7RENVILLE 105 105 0 0 53 010 0RICHLAND 343 448 0 257 109 010 0SARGENT 148 157 0 0 152 08 0SHERIDAN 315 315 315 0 0 017 0SLOPE * * * * * * * * STARK 415 0 397 0 0 015 0STEELE 829 1,361 0 0 1,361 09 0STUTSMAN 100 329 0 0 149 07 0TOWNER 0 187 0 0 168 26 19TRAILL 103 139 0 0 97 012 0WALSH 453 1,238 0 0 1,069 07 0WARD 65 655 0 0 652 06 0WELLS * * * * * * * * WILLIAMS 1,270 1,793 0 0 0 015 0
* Data withheld to avoid disclosure of individual operations.Note: Acceptable acres may be listed in multiple categories.
193

County NameIntroduced
GrassNative Grass Total
GrassHardwood
TreesSoftwood
TreesTotal Trees
Table 4 -- Description of Signup 45 Acceptable Acres 1/NORTH DAKOTA
STATE TOTALS 11,027 2,307 13,334 51 18 69ADAMS 0 10 10 0 0 0BARNES 500 76 576 0 0 0BENSON 0 0 0 0 0 0BOTTINEAU 1,421 0 1,421 0 0 0BOWMAN 479 0 479 0 0 0BURKE 229 645 874 0 0 0BURLEIGH 0 0 0 0 11 11CASS 10 10 20 0 0 0CAVALIER 28 0 28 0 4 4DICKEY 0 0 0 0 0 0DIVIDE 997 207 1,204 0 0 0EDDY 127 165 292 0 0 0EMMONS 68 0 68 0 0 0FOSTER * * * * * * GOLDEN VALLEY 252 0 252 0 0 0GRAND FORKS 713 572 1,284 0 0 0GRANT 27 0 27 0 0 0GRIGGS 128 0 128 0 0 0HETTINGER 0 0 0 0 0 0KIDDER * * * * * * LA MOURE 0 0 0 0 0 0LOGAN * * * * * * MCHENRY 451 0 451 27 0 27MCINTOSH * * * * * * MCKENZIE * * * * * * MCLEAN 8 0 8 19 0 19MORTON * * * * * * MOUNTRAIL 2,232 6 2,238 1 0 1NELSON 172 0 172 0 0 0PEMBINA 173 186 359 2 4 5PIERCE 133 0 133 0 0 0RAMSEY 0 0 0 0 0 0RANSOM 0 91 91 0 0 0RENVILLE 50 0 50 0 0 0RICHLAND 0 83 83 0 0 0SARGENT 0 0 0 0 0 0SHERIDAN 315 0 315 0 0 0SLOPE * * * * * * STARK 415 0 415 0 0 0STEELE 0 0 0 0 0 0STUTSMAN 99 80 179 0 0 0TOWNER 0 0 0 0 0 0TRAILL 42 0 42 0 0 0WALSH 68 100 168 0 0 0WARD 0 0 0 2 0 2WELLS * * * * * * WILLIAMS 1,716 76 1,793 0 0 0
* Data withheld to avoid disclosure of individual operations.1/ Not including practices: permanent wildlife habitat, wildlife food plots, rare and declining habitat, and pollinator habitat.
194

OH
IO
195
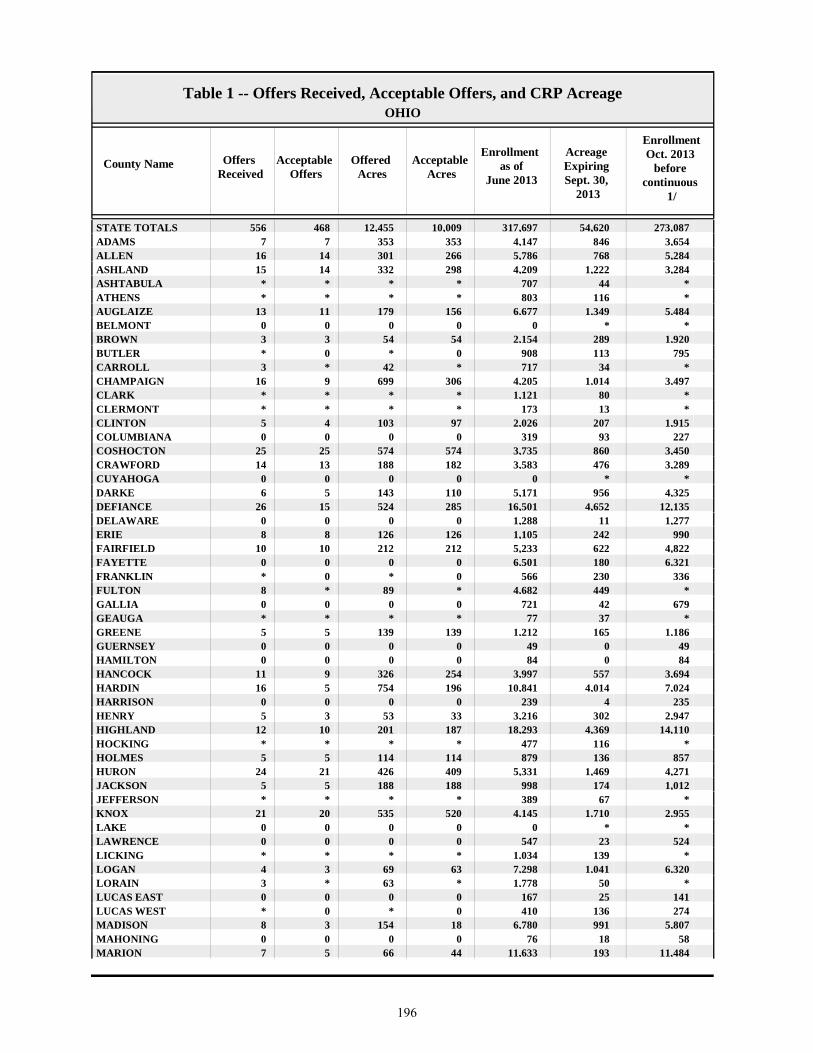
County Name Offers Received
Acceptable Offers
Offered Acres
Acceptable Acres
EnrollmentOct. 2013
before continuous
1/
Acreage Expiring Sept. 30,
2013
Enrollment as of
June 2013
Table 1 -- Offers Received, Acceptable Offers, and CRP AcreageOHIO
STATE TOTALS 556 468 12,455 10,009 273,08754,620317,697ADAMS 7 7 353 353 3,6548464,147ALLEN 16 14 301 266 5,2847685,786ASHLAND 15 14 332 298 3,2841,2224,209ASHTABULA * * * * * 44707ATHENS * * * * * 116803AUGLAIZE 13 11 179 156 5,4841,3496,677BELMONT 0 0 0 0 * * 0BROWN 3 3 54 54 1,9202892,154BUTLER * 0 * 0 795113908CARROLL 3 * 42 * * 34717CHAMPAIGN 16 9 699 306 3,4971,0144,205CLARK * * * * * 801,121CLERMONT * * * * * 13173CLINTON 5 4 103 97 1,9152072,026COLUMBIANA 0 0 0 0 22793319COSHOCTON 25 25 574 574 3,4508603,735CRAWFORD 14 13 188 182 3,2894763,583CUYAHOGA 0 0 0 0 * * 0DARKE 6 5 143 110 4,3259565,171DEFIANCE 26 15 524 285 12,1354,65216,501DELAWARE 0 0 0 0 1,277111,288ERIE 8 8 126 126 9902421,105FAIRFIELD 10 10 212 212 4,8226225,233FAYETTE 0 0 0 0 6,3211806,501FRANKLIN * 0 * 0 336230566FULTON 8 * 89 * * 4494,682GALLIA 0 0 0 0 67942721GEAUGA * * * * * 3777GREENE 5 5 139 139 1,1861651,212GUERNSEY 0 0 0 0 49049HAMILTON 0 0 0 0 84084HANCOCK 11 9 326 254 3,6945573,997HARDIN 16 5 754 196 7,0244,01410,841HARRISON 0 0 0 0 2354239HENRY 5 3 53 33 2,9473023,216HIGHLAND 12 10 201 187 14,1104,36918,293HOCKING * * * * * 116477HOLMES 5 5 114 114 857136879HURON 24 21 426 409 4,2711,4695,331JACKSON 5 5 188 188 1,012174998JEFFERSON * * * * * 67389KNOX 21 20 535 520 2,9551,7104,145LAKE 0 0 0 0 * * 0LAWRENCE 0 0 0 0 52423547LICKING * * * * * 1391,034LOGAN 4 3 69 63 6,3201,0417,298LORAIN 3 * 63 * * 501,778LUCAS EAST 0 0 0 0 14125167LUCAS WEST * 0 * 0 274136410MADISON 8 3 154 18 5,8079916,780MAHONING 0 0 0 0 581876MARION 7 5 66 44 11,48419311,633
196

County Name Offers Received
Acceptable Offers
Offered Acres
Acceptable Acres
EnrollmentOct. 2013
before continuous
1/
Acreage Expiring Sept. 30,
2013
Enrollment as of
June 2013
Table 1 -- Offers Received, Acceptable Offers, and CRP AcreageOHIO
MEDINA * * * * * 74310MEIGS 0 0 0 0 3000300MERCER 8 6 187 99 4,4493624,713MIAMI * * * * * 271,520MONROE 0 0 0 0 * * 0MONTGOMERY 0 0 0 0 71734751MORGAN * * * * * 31310MORROW * * * * * 1443,080MUSKINGUM 3 3 130 130 413147431NOBLE 0 0 0 0 * * 0OTTAWA 0 0 0 0 2,9258473,772PAULDING 10 9 96 93 6,6287467,281PERRY 4 4 286 286 808385907PICKAWAY 9 9 163 163 12,90968413,429PIKE 11 10 328 315 3,8263603,871PORTAGE 0 0 0 0 2303234PREBLE 5 5 131 131 3,0723453,286PUTNAM 19 18 118 114 3,8703284,084RICHLAND 12 11 192 180 4,0226674,509ROSS 3 3 94 94 25,0912,12827,124SANDUSKY 25 25 283 283 3,2156753,607SCIOTO 0 0 0 0 3,06413,065SENECA 13 10 205 125 6,0971,5817,553SHELBY 9 9 228 228 4,9327405,444STARK 3 3 85 85 23043189SUMMIT 0 0 0 0 * * 0TRUMBULL 0 0 0 0 352115468TUSCARAWAS 3 3 51 51 339189477UNION 9 * 318 * * 1,2549,443VAN WERT * 0 * 0 2,2391092,348VINTON * * * * * 22825WARREN 3 3 38 38 38494439WASHINGTON 3 3 37 37 66062685WAYNE * * * * * 69409WILLIANS 50 49 1,631 1,591 14,96410,13123,505WOOD 26 25 261 252 7,7074297,884WYANDOT 6 6 80 80 7,3821,1518,454
1 / Not including continuous signup enrollment between July and September 2013.
* Data withheld to avoid disclosure of individual operations.
197

County NameExpiring
Sept. 2013 (Acres)
New Lands (Acres) 1/
Average Rental
Payment ($/Acre)
Total Rental
Payment ($/year)
Average EBI Score
without Cost
Average EBI Score with Cost
Table 2 -- Description of Signup 45 Acceptable AcresOHIO
STATE TOTALS 9,328 682 $112.32 $1,124,287 191 260ADAMS 314 39 $93.60 $33,042 167 241ALLEN 266 0 $120.35 $32,038 184 263ASHLAND 292 6 $82.54 $24,556 195 295ASHTABULA * * * * * * ATHENS * * * * * * AUGLAIZE 140 15 $156.81 $24,384 175 224BROWN 54 0 $79.15 $4,298 221 305CARROLL * * * * * * CHAMPAIGN 306 0 $158.42 $48,428 184 236CLARK * * * * * * CLERMONT * * * * * * CLINTON 97 0 $120.89 $11,678 180 236COSHOCTON 572 2 $84.89 $48,752 216 294CRAWFORD 174 8 $128.38 $23,405 177 249DARKE 109 1 $166.98 $18,351 216 248DEFIANCE 285 0 $106.15 $30,285 167 241ERIE 126 0 $107.62 $13,603 171 258FAIRFIELD 178 33 $118.84 $25,134 188 256FULTON * * * * * * GEAUGA * * * * * * GREENE 55 84 $145.32 $20,141 183 238HANCOCK 254 0 $131.13 $33,308 181 239HARDIN 178 19 $140.65 $27,623 167 220HENRY 33 0 $125.32 $4,161 179 247HIGHLAND 187 0 $108.44 $20,245 200 266HOCKING * * * * * * HOLMES 114 0 $95.82 $10,933 239 316HURON 385 24 $119.00 $48,648 191 264JACKSON 158 30 $54.37 $10,215 151 245JEFFERSON * * * * * * KNOX 513 7 $82.94 $43,097 231 310LICKING * * * * * * LOGAN 63 0 $130.44 $8,205 181 234LORAIN * * * * * * MADISON 10 8 $139.19 $2,450 223 269MARION 44 0 $147.03 $6,469 197 254MEDINA * * * * * * MERCER 93 6 $153.09 $15,110 188 245MIAMI * * * * * * MORGAN * * * * * * MORROW * * * * * * MUSKINGUM 130 0 $78.14 $10,150 238 318PAULDING 93 0 $111.68 $10,364 162 238PERRY 286 0 $84.53 $24,152 184 260PICKAWAY 163 0 $135.66 $22,167 179 239PIKE 225 91 $104.39 $32,893 209 286PREBLE 117 15 $119.34 $15,633 240 299PUTNAM 93 21 $114.64 $13,034 165 239RICHLAND 180 0 $102.48 $18,426 199 269ROSS 94 0 $120.72 $11,396 217 277SANDUSKY 231 52 $126.04 $35,733 168 237SENECA 125 0 $126.04 $15,692 191 248SHELBY 225 3 $145.28 $33,181 215 266STARK 43 41 $71.09 $6,015 198 294
198
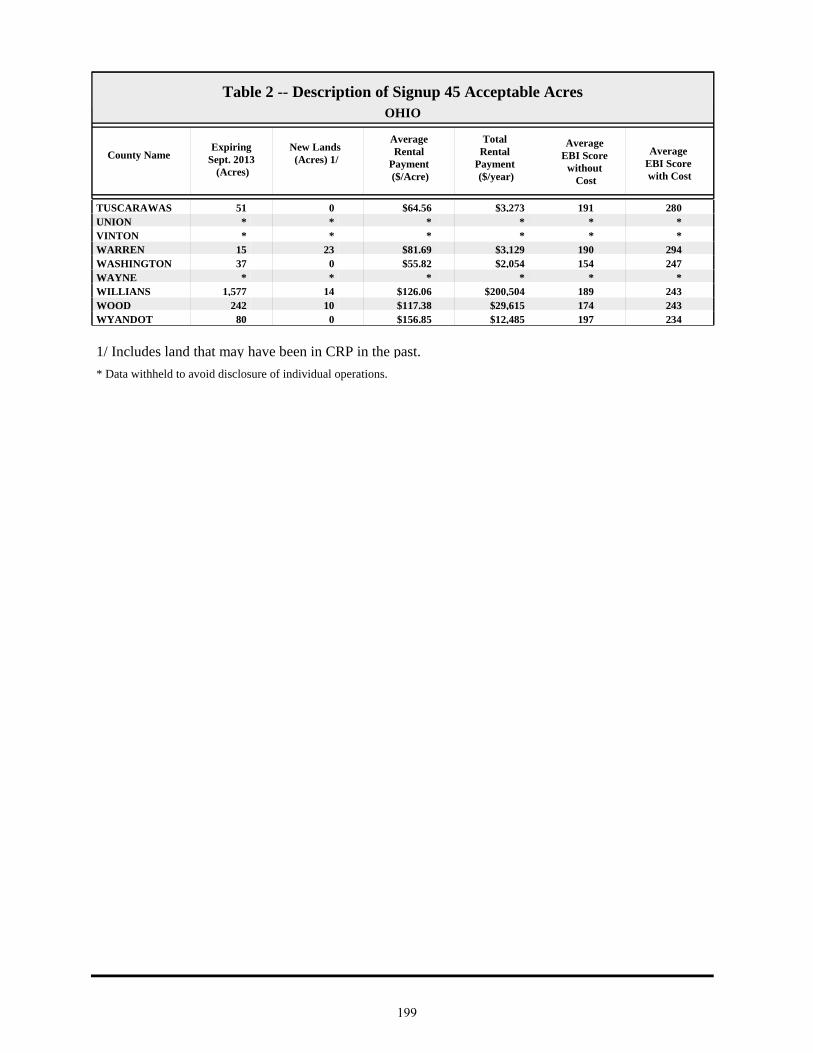
County NameExpiring
Sept. 2013 (Acres)
New Lands (Acres) 1/
Average Rental
Payment ($/Acre)
Total Rental
Payment ($/year)
Average EBI Score
without Cost
Average EBI Score with Cost
Table 2 -- Description of Signup 45 Acceptable AcresOHIO
TUSCARAWAS 51 0 $64.56 $3,273 191 280UNION * * * * * * VINTON * * * * * * WARREN 15 23 $81.69 $3,129 190 294WASHINGTON 37 0 $55.82 $2,054 154 247WAYNE * * * * * * WILLIANS 1,577 14 $126.06 $200,504 189 243WOOD 242 10 $117.38 $29,615 174 243WYANDOT 80 0 $156.85 $12,485 197 234
* Data withheld to avoid disclosure of individual operations.
1/ Includes land that may have been in CRP in the past.
199

County Name
EI>=8 (Acres)
National Priority
Area
State Priority
Area (Acres)
Rare and Declining Habitat (Acres)
Permanent Wildlife Habitat (Acres)
Pollinator Habitat Offers
Table 3 -- Description of Signup 45 Acceptable AcresOHIO
Average Erodibility Index (EI)
Pollinator Habitat (Acres)
STATE TOTALS 5,624 5,443 1,897 23 2,712 8115 362ADAMS 353 0 0 0 0 123 1ALLEN 63 266 0 0 71 76 10ASHLAND 141 298 0 0 96 311 11ASHTABULA * * * * * * * * ATHENS * * * * * * * * AUGLAIZE 62 156 0 0 27 07 0BROWN 54 0 44 0 0 134 4CARROLL * * * * * * * * CHAMPAIGN 290 0 133 0 61 111 16CLARK * * * * * * * * CLERMONT * * * * * * * * CLINTON 35 0 97 0 79 05 0COSHOCTON 574 0 326 0 0 033 0CRAWFORD 0 182 0 0 119 05 0DARKE 94 0 110 0 6 49 12DEFIANCE 64 285 23 0 96 55 20ERIE 0 126 0 0 84 03 0FAIRFIELD 212 0 21 0 45 123 3FULTON * * * * * * * * GEAUGA * * * * * * * * GREENE 139 0 39 0 30 113 8HANCOCK 0 254 0 0 158 23 12HARDIN 43 196 0 0 0 06 0HENRY 8 33 0 0 26 07 0HIGHLAND 187 0 4 0 79 222 5HOCKING * * * * * * * * HOLMES 114 0 0 0 0 033 0HURON 12 409 0 0 17 05 0JACKSON 188 0 0 0 0 068 0JEFFERSON * * * * * * * * KNOX 518 0 487 0 61 021 0LICKING * * * * * * * * LOGAN 63 0 63 0 0 015 0LORAIN * * * * * * * * MADISON 15 0 18 0 0 013 0MARION 0 44 0 0 0 13 1MEDINA * * * * * * * * MERCER 77 99 0 0 8 28 2MIAMI * * * * * * * * MORGAN * * * * * * * * MORROW * * * * * * * * MUSKINGUM 130 0 0 0 0 033 0PAULDING 2 93 93 0 41 02 0PERRY 286 0 0 0 39 061 0PICKAWAY 110 0 0 0 0 39 11PIKE 315 0 254 0 0 037 0PREBLE 131 0 131 0 0 218 7PUTNAM 25 114 0 0 15 14 1RICHLAND 82 180 0 0 27 310 7ROSS 94 0 0 0 22 021 0SANDUSKY 9 284 0 0 195 02 0SENECA 16 125 0 0 63 05 0SHELBY 211 228 0 0 15 511 17STARK 85 0 0 0 0 016 0TUSCARAWAS 51 0 0 0 0 042 0
200

County Name
EI>=8 (Acres)
National Priority
Area
State Priority
Area (Acres)
Rare and Declining Habitat (Acres)
Permanent Wildlife Habitat (Acres)
Pollinator Habitat Offers
Table 3 -- Description of Signup 45 Acceptable AcresOHIO
Average Erodibility Index (EI)
Pollinator Habitat (Acres)
UNION * * * * * * * * VINTON * * * * * * * * WARREN 38 0 0 0 0 314 4WASHINGTON 37 0 0 0 0 025 0WAYNE * * * * * * * * WILLIANS 347 1,591 0 0 1,016 305 205WOOD 0 252 2 3 175 04 0WYANDOT 2 80 0 0 0 03 0
* Data withheld to avoid disclosure of individual operations.Note: Acceptable acres may be listed in multiple categories.
201

County NameIntroduced
GrassNative Grass Total
GrassHardwood
TreesSoftwood
TreesTotal Trees
Table 4 -- Description of Signup 45 Acceptable Acres 1/OHIO
STATE TOTALS 3,334 1,739 5,072 1,314 453 1,767ADAMS 352 0 352 0 0 0ALLEN 85 68 152 33 0 33ASHLAND 90 46 135 42 0 43ASHTABULA * * * * * * ATHENS * * * * * * AUGLAIZE 25 97 122 4 0 4BROWN 51 0 51 0 0 0CARROLL * * * * * * CHAMPAIGN 28 185 213 8 7 15CLARK * * * * * * CLERMONT * * * * * * CLINTON 0 18 18 0 0 0COSHOCTON 473 25 497 16 50 66CRAWFORD 2 6 8 51 0 51DARKE 0 75 75 14 4 17DEFIANCE 36 85 121 49 0 49ERIE 0 13 13 30 0 30FAIRFIELD 136 6 142 21 0 21FULTON * * * * * * GEAUGA * * * * * * GREENE 0 88 88 13 0 13HANCOCK 1 13 14 66 0 66HARDIN 188 8 196 0 0 0HENRY 0 8 8 0 0 0HIGHLAND 41 0 41 17 45 63HOCKING * * * * * * HOLMES 21 0 21 93 0 93HURON 115 190 305 83 0 83JACKSON 150 12 162 0 25 25JEFFERSON * * * * * * KNOX 217 77 293 166 0 166LICKING * * * * * * LOGAN 0 49 49 8 6 14LORAIN * * * * * * MADISON 0 2 2 16 0 16MARION 9 0 9 34 0 34MEDINA * * * * * * MERCER 32 33 65 23 1 24MIAMI * * * * * * MORGAN * * * * * * MORROW * * * * * * MUSKINGUM 130 0 130 0 0 0PAULDING 2 29 30 22 0 22PERRY 234 0 234 0 0 0PICKAWAY 0 32 32 115 5 120PIKE 106 0 106 47 162 209PREBLE 19 75 94 0 26 26PUTNAM 13 78 91 2 5 7RICHLAND 134 6 140 5 0 5ROSS 0 15 15 56 0 56SANDUSKY 1 45 45 42 0 42SENECA 24 3 28 34 0 34SHELBY 16 179 195 0 0 0STARK 9 3 12 72 0 72TUSCARAWAS 22 0 22 6 23 29
202

County NameIntroduced
GrassNative Grass Total
GrassHardwood
TreesSoftwood
TreesTotal Trees
Table 4 -- Description of Signup 45 Acceptable Acres 1/OHIO
UNION * * * * * * VINTON * * * * * * WARREN 8 26 34 0 0 0WASHINGTON 32 0 32 5 0 5WAYNE * * * * * * WILLIANS 304 30 334 31 1 32WOOD 2 70 72 2 0 2WYANDOT 0 17 17 63 0 63
* Data withheld to avoid disclosure of individual operations.1/ Not including practices: permanent wildlife habitat, wildlife food plots, rare and declining habitat, and pollinator habitat.
203

OK
LA
HO
MA
204

County Name Offers Received
Acceptable Offers
Offered Acres
Acceptable Acres
EnrollmentOct. 2013
before continuous
1/
Acreage Expiring Sept. 30,
2013
Enrollment as of
June 2013
Table 1 -- Offers Received, Acceptable Offers, and CRP AcreageOKLAHOMA
STATE TOTALS 575 526 60,060 55,674 768,03574,861787,223ADAIR 0 0 0 0 2490249ALFALFA 29 23 2,022 1,555 6,8892,9978,331ATOKA 0 0 0 0 101BEAVER 68 67 9,904 9,810 114,40010,580115,169BECKHAM 9 9 769 769 24,3871,37524,993BLAINE 5 5 394 394 3,7022323,541BRYAN 3 * 115 * * 3332,575CADDO 5 4 448 428 4,0757194,365CANADIAN * * * * * 306912CARTER 0 0 0 0 * * 0CHEROKEE 0 0 0 0 1730173CHOCTAW 0 0 0 0 28028CIMARRON 7 7 817 817 119,2491,181119,614CLEVELAND 0 0 0 0 * * 0COAL 0 0 0 0 * * 0COMANCHE * * * * * 65586COTTON * * * * * 01,240CRAIG * 0 * 0 413132545CREEK 0 0 0 0 * * 0CUSTER 3 3 200 200 3,2834193,503DELAWARE 0 0 0 0 1570157DEWEY 10 10 643 643 17,47994217,778ELLIS 80 80 8,011 8,011 56,49211,68060,160GARFIELD 12 10 557 480 4,3969214,837GARVIN 0 0 0 0 * * 0GRADY * * * * * 0768GRANT 61 50 4,709 3,612 31,2747,20934,872GREER 8 4 530 250 11,53442911,714HARMON * * * * * 32524,333HARPER 53 53 5,711 5,711 55,3986,28755,974HASKELL 0 0 0 0 * * 0HUGHES 0 0 0 0 21021JACKSON 6 6 154 154 7,3481,1328,326JEFFERSON * * * * * 76398JOHNSTON 0 0 0 0 * * 0KAY 7 7 327 327 6,8475857,105KINGFISHER 6 * 435 * * 7403,240KIOWA 6 5 506 492 8,8208519,179LATIMER 0 0 0 0 * * 0LEFLORE 0 0 0 0 * * 0LINCOLN 0 0 0 0 3730373LOGAN * * * * * 1082,035LOVE 0 0 0 0 * * 0MCCLAIN 0 0 0 0 * * 0MCCURTAIN 0 0 0 0 1,06001,060MCINTOSH 0 0 0 0 * * 0MAJOR 24 24 1,901 1,901 12,6572,56813,325MARSHALL 0 0 0 0 1870187MAYES 0 0 0 0 * * 0MURRAY 0 0 0 0 * * 0MUSKOGEE 0 0 0 0 1910191NOBLE 0 0 0 0 723260983
205

County Name Offers Received
Acceptable Offers
Offered Acres
Acceptable Acres
EnrollmentOct. 2013
before continuous
1/
Acreage Expiring Sept. 30,
2013
Enrollment as of
June 2013
Table 1 -- Offers Received, Acceptable Offers, and CRP AcreageOKLAHOMA
NOWATA 0 0 0 0 106676OKFUSKEE 0 0 0 0 * * 0OKLAHOMA 0 0 0 0 * * 0OKMULGEE 0 0 0 0 8210OSAGE 4 0 625 0 86527612OTTAWA 0 0 0 0 4150415PAWNEE 0 0 0 0 * * 0PAYNE 0 0 0 0 12120140PITTSBURG 0 0 0 0 * * 0PONTOTOC 0 0 0 0 * * 0POTTAWATOMIE 0 0 0 0 84084PUSHMATAHA 0 0 0 0 * * 0ROGER MILLS 6 6 948 948 12,2932,13713,483ROGERS 0 0 0 0 05151SEMINOLE 0 0 0 0 92092SEQUOYAH 0 0 0 0 * * 0STEPHENS 0 0 0 0 1870187TEXAS 74 73 11,688 11,653 184,81510,479183,641TILLMAN 3 * 312 * * 4593,861TULSA 0 0 0 0 * * 0WAGONER 0 0 0 0 244972WASHINGTON 0 0 0 0 * * 0WASHITA 13 8 1,307 867 3,7231,6374,493WOODS 50 45 4,631 4,047 19,6795,30120,933WOODWARD 15 15 1,540 1,540 16,0901,68116,231
1 / Not including continuous signup enrollment between July and September 2013.
* Data withheld to avoid disclosure of individual operations.
206
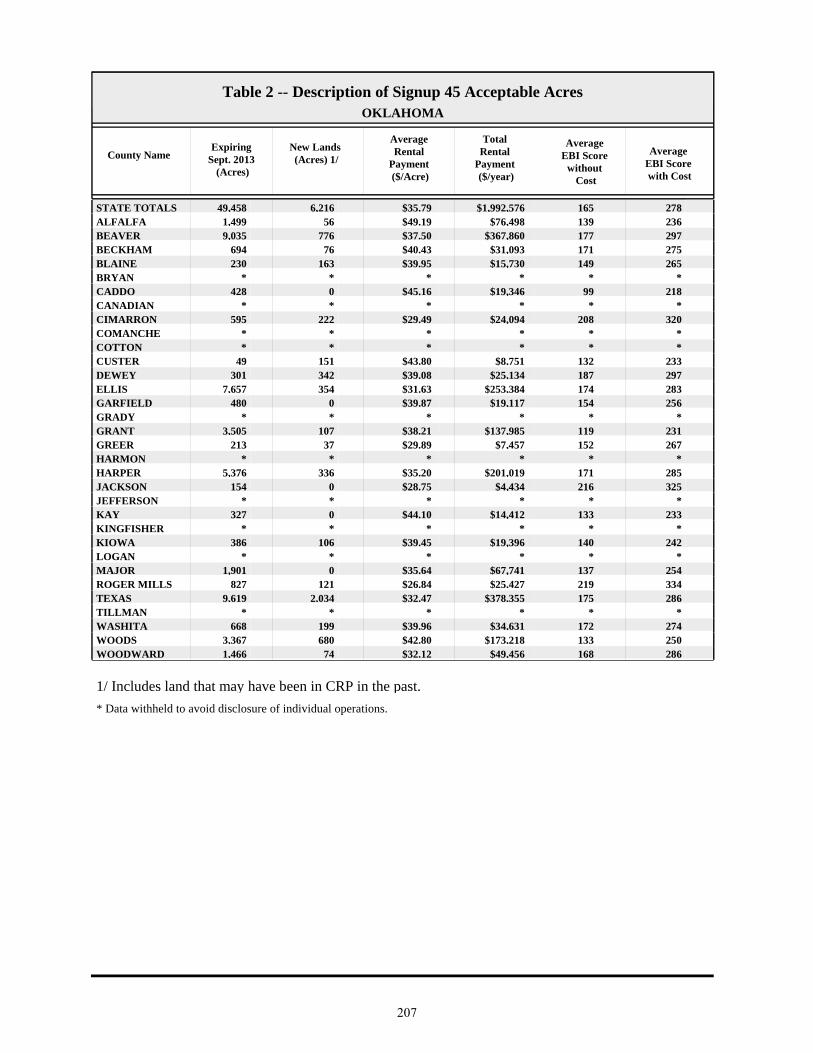
County NameExpiring
Sept. 2013 (Acres)
New Lands (Acres) 1/
Average Rental
Payment ($/Acre)
Total Rental
Payment ($/year)
Average EBI Score
without Cost
Average EBI Score with Cost
Table 2 -- Description of Signup 45 Acceptable AcresOKLAHOMA
STATE TOTALS 49,458 6,216 $35.79 $1,992,576 165 278ALFALFA 1,499 56 $49.19 $76,498 139 236BEAVER 9,035 776 $37.50 $367,860 177 297BECKHAM 694 76 $40.43 $31,093 171 275BLAINE 230 163 $39.95 $15,730 149 265BRYAN * * * * * * CADDO 428 0 $45.16 $19,346 99 218CANADIAN * * * * * * CIMARRON 595 222 $29.49 $24,094 208 320COMANCHE * * * * * * COTTON * * * * * * CUSTER 49 151 $43.80 $8,751 132 233DEWEY 301 342 $39.08 $25,134 187 297ELLIS 7,657 354 $31.63 $253,384 174 283GARFIELD 480 0 $39.87 $19,117 154 256GRADY * * * * * * GRANT 3,505 107 $38.21 $137,985 119 231GREER 213 37 $29.89 $7,457 152 267HARMON * * * * * * HARPER 5,376 336 $35.20 $201,019 171 285JACKSON 154 0 $28.75 $4,434 216 325JEFFERSON * * * * * * KAY 327 0 $44.10 $14,412 133 233KINGFISHER * * * * * * KIOWA 386 106 $39.45 $19,396 140 242LOGAN * * * * * * MAJOR 1,901 0 $35.64 $67,741 137 254ROGER MILLS 827 121 $26.84 $25,427 219 334TEXAS 9,619 2,034 $32.47 $378,355 175 286TILLMAN * * * * * * WASHITA 668 199 $39.96 $34,631 172 274WOODS 3,367 680 $42.80 $173,218 133 250WOODWARD 1,466 74 $32.12 $49,456 168 286
* Data withheld to avoid disclosure of individual operations.
1/ Includes land that may have been in CRP in the past.
207

County Name
EI>=8 (Acres)
National Priority
Area
State Priority
Area (Acres)
Rare and Declining Habitat (Acres)
Permanent Wildlife Habitat (Acres)
Pollinator Habitat Offers
Table 3 -- Description of Signup 45 Acceptable AcresOKLAHOMA
Average Erodibility Index (EI)
Pollinator Habitat (Acres)
STATE TOTALS 49,116 0 40,752 452 229 612 29ALFALFA 1,213 0 76 0 0 010 0BEAVER 9,335 0 9,811 152 0 013 0BECKHAM 769 0 271 0 0 015 0BLAINE 394 0 299 0 0 010 0BRYAN * * * * * * * * CADDO 72 0 25 0 0 07 0CANADIAN * * * * * * * * CIMARRON 817 0 817 0 0 017 0COMANCHE * * * * * * * * COTTON * * * * * * * * CUSTER 200 0 151 0 0 011 0DEWEY 535 0 548 0 0 013 0ELLIS 7,334 0 7,952 0 0 011 0GARFIELD 361 0 0 119 0 012 0GRADY * * * * * * * * GRANT 1,378 0 0 41 0 17 2GREER 250 0 64 0 0 013 0HARMON * * * * * * * * HARPER 5,142 0 5,629 0 0 011 0JACKSON 154 0 154 8 0 014 0JEFFERSON * * * * * * * * KAY 249 0 0 0 0 010 0KINGFISHER * * * * * * * * KIOWA 249 0 106 0 0 08 0LOGAN * * * * * * * * MAJOR 1,512 0 0 0 0 510 27ROGER MILLS 948 0 948 0 0 016 0TEXAS 11,653 0 11,653 0 216 013 0TILLMAN * * * * * * * * WASHITA 784 0 0 132 0 018 0WOODS 3,194 0 1,096 0 0 010 0WOODWARD 1,540 0 901 0 0 014 0
* Data withheld to avoid disclosure of individual operations.Note: Acceptable acres may be listed in multiple categories.
208

County NameIntroduced
GrassNative Grass Total
GrassHardwood
TreesSoftwood
TreesTotal Trees
Table 4 -- Description of Signup 45 Acceptable Acres 1/OKLAHOMA
STATE TOTALS 9,587 45,130 54,717 70 0 70ALFALFA 0 1,537 1,537 0 0 0BEAVER 2,273 7,386 9,659 0 0 0BECKHAM 170 600 769 0 0 0BLAINE 140 249 389 0 0 0BRYAN * * * * * * CADDO 47 381 428 0 0 0CANADIAN * * * * * * CIMARRON 199 618 817 0 0 0COMANCHE * * * * * * COTTON * * * * * * CUSTER 49 151 200 0 0 0DEWEY 168 475 643 0 0 0ELLIS 1,624 6,388 8,011 0 0 0GARFIELD 50 309 359 0 0 0GRADY * * * * * * GRANT 79 3,439 3,517 0 0 0GREER 0 250 250 0 0 0HARMON * * * * * * HARPER 946 4,765 5,712 0 0 0JACKSON 0 146 146 0 0 0JEFFERSON * * * * * * KAY 0 327 327 0 0 0KINGFISHER * * * * * * KIOWA 0 492 492 0 0 0LOGAN * * * * * * MAJOR 69 1,799 1,869 0 0 0ROGER MILLS 0 948 948 0 0 0TEXAS 2,939 8,406 11,345 0 0 0TILLMAN * * * * * * WASHITA 177 556 733 0 0 0WOODS 140 3,907 4,047 0 0 0WOODWARD 43 1,495 1,538 0 0 0
* Data withheld to avoid disclosure of individual operations.1/ Not including practices: permanent wildlife habitat, wildlife food plots, rare and declining habitat, and pollinator habitat.
209
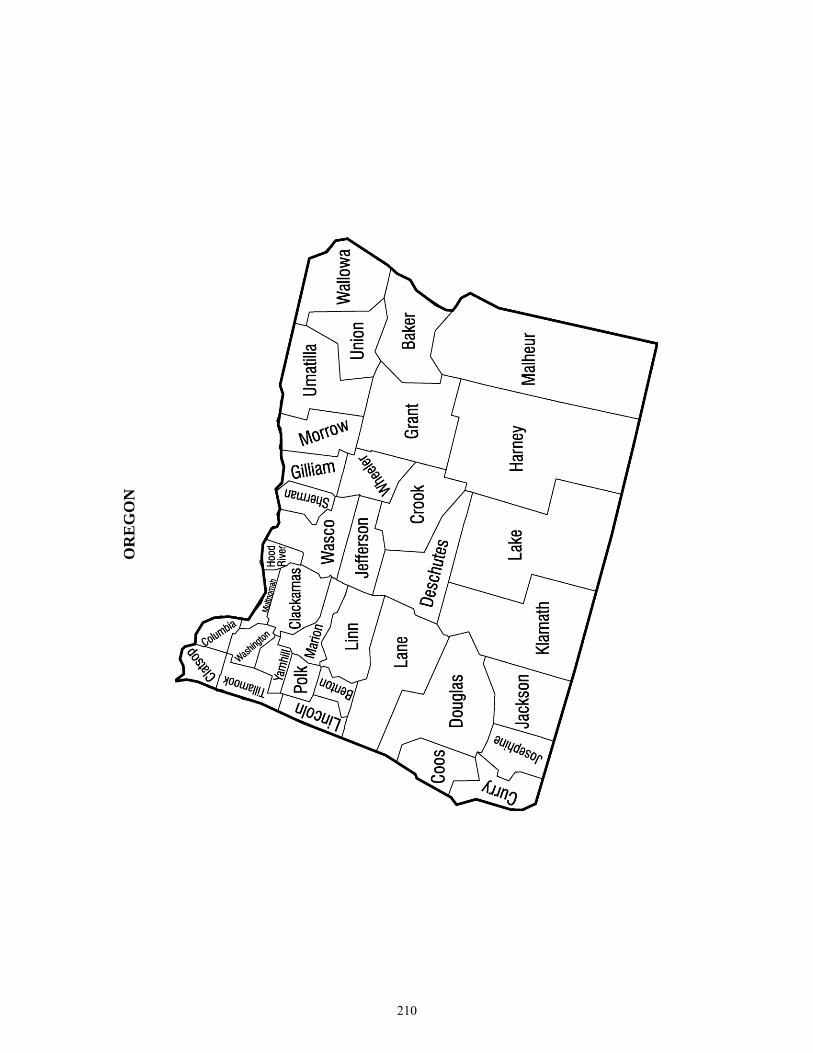
OR
EG
ON
210

County Name Offers Received
Acceptable Offers
Offered Acres
Acceptable Acres
EnrollmentOct. 2013
before continuous
1/
Acreage Expiring Sept. 30,
2013
Enrollment as of
June 2013
Table 1 -- Offers Received, Acceptable Offers, and CRP AcreageOREGON
STATE TOTALS 348 337 59,831 59,519 547,66456,437544,583BAKER 0 0 0 0 5,335505,385BENTON 0 0 0 0 6910691CLACKAMAS 0 0 0 0 97097CLATSOP 0 0 0 0 24024COLUMBIA 0 0 0 0 33553388COOS 0 0 0 0 2440244CROOK 0 0 0 0 6280628CURRY 0 0 0 0 9240924DESCHUTES 0 0 0 0 99099DOUGLAS 0 0 0 0 1,372871,460GILLIAM 13 13 4,384 4,384 71,9494,49772,062GRANT 0 0 0 0 2,07002,070HARNEY 0 0 0 0 1,786271,813HOOD RIVER 0 0 0 0 * * 0JACKSON 0 0 0 0 2650265JEFFERSON 0 0 0 0 4,344484,391JOSEPHINE 0 0 0 0 202KLAMATH 0 0 0 0 1,4762101,686LAKE 0 0 0 0 5950595LANE 0 0 0 0 2089216LINCOLN 0 0 0 0 1980198LINN 0 0 0 0 84720867MALHEUR 0 0 0 0 31839357MARION * 0 * 0 26244306MORROW 53 53 11,524 11,524 114,85713,191116,524MULTNOMAH 0 0 0 0 95095POLK 3 * 62 * * 1261,010SHERMAN 32 32 3,818 3,818 81,5694,73082,481TILLAMOOK 0 0 0 0 * * 0UMATILLA 213 205 34,914 34,627 160,78824,397150,558UNION 13 13 1,604 1,604 9,0851,7419,222WALLOWA 15 15 2,477 2,477 21,0274,05322,603WASCO 5 5 1,039 1,039 58,1433,02860,131WASHINGTON 0 0 0 0 3630363WHEELER 0 0 0 0 5,65265,657YAMHILL 0 0 0 0 1,088811,168
1 / Not including continuous signup enrollment between July and September 2013.
* Data withheld to avoid disclosure of individual operations.
211
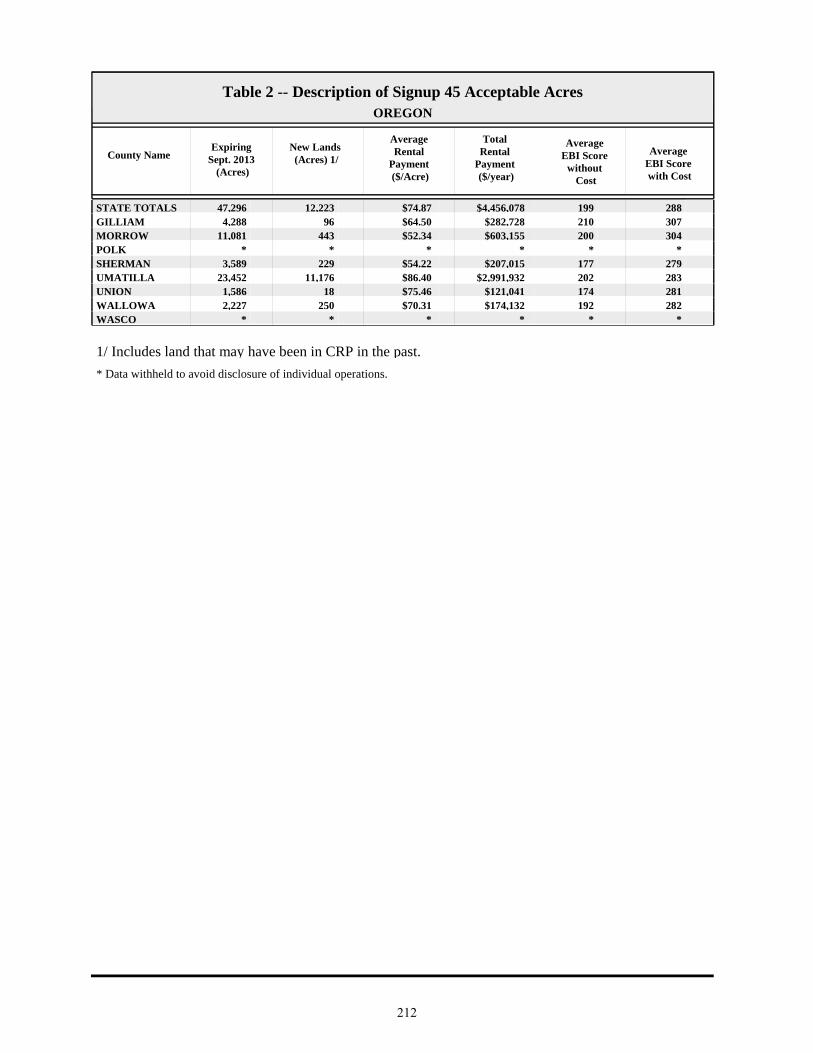
County NameExpiring
Sept. 2013 (Acres)
New Lands (Acres) 1/
Average Rental
Payment ($/Acre)
Total Rental
Payment ($/year)
Average EBI Score
without Cost
Average EBI Score with Cost
Table 2 -- Description of Signup 45 Acceptable AcresOREGON
STATE TOTALS 47,296 12,223 $74.87 $4,456,078 199 288GILLIAM 4,288 96 $64.50 $282,728 210 307MORROW 11,081 443 $52.34 $603,155 200 304POLK * * * * * * SHERMAN 3,589 229 $54.22 $207,015 177 279UMATILLA 23,452 11,176 $86.40 $2,991,932 202 283UNION 1,586 18 $75.46 $121,041 174 281WALLOWA 2,227 250 $70.31 $174,132 192 282WASCO * * * * * *
* Data withheld to avoid disclosure of individual operations.
1/ Includes land that may have been in CRP in the past.
212
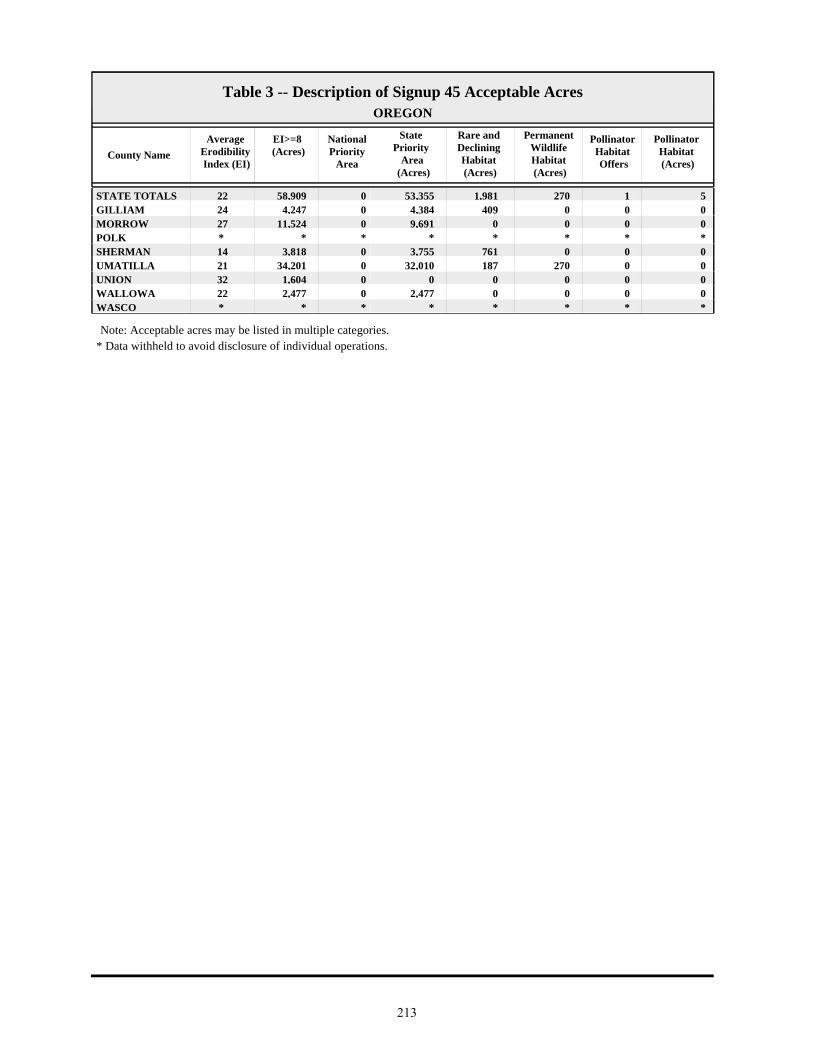
County Name
EI>=8 (Acres)
National Priority
Area
State Priority
Area (Acres)
Rare and Declining Habitat (Acres)
Permanent Wildlife Habitat (Acres)
Pollinator Habitat Offers
Table 3 -- Description of Signup 45 Acceptable AcresOREGON
Average Erodibility Index (EI)
Pollinator Habitat (Acres)
STATE TOTALS 58,909 0 53,355 1,981 270 122 5GILLIAM 4,247 0 4,384 409 0 024 0MORROW 11,524 0 9,691 0 0 027 0POLK * * * * * * * * SHERMAN 3,818 0 3,755 761 0 014 0UMATILLA 34,201 0 32,010 187 270 021 0UNION 1,604 0 0 0 0 032 0WALLOWA 2,477 0 2,477 0 0 022 0WASCO * * * * * * * *
* Data withheld to avoid disclosure of individual operations.Note: Acceptable acres may be listed in multiple categories.
213
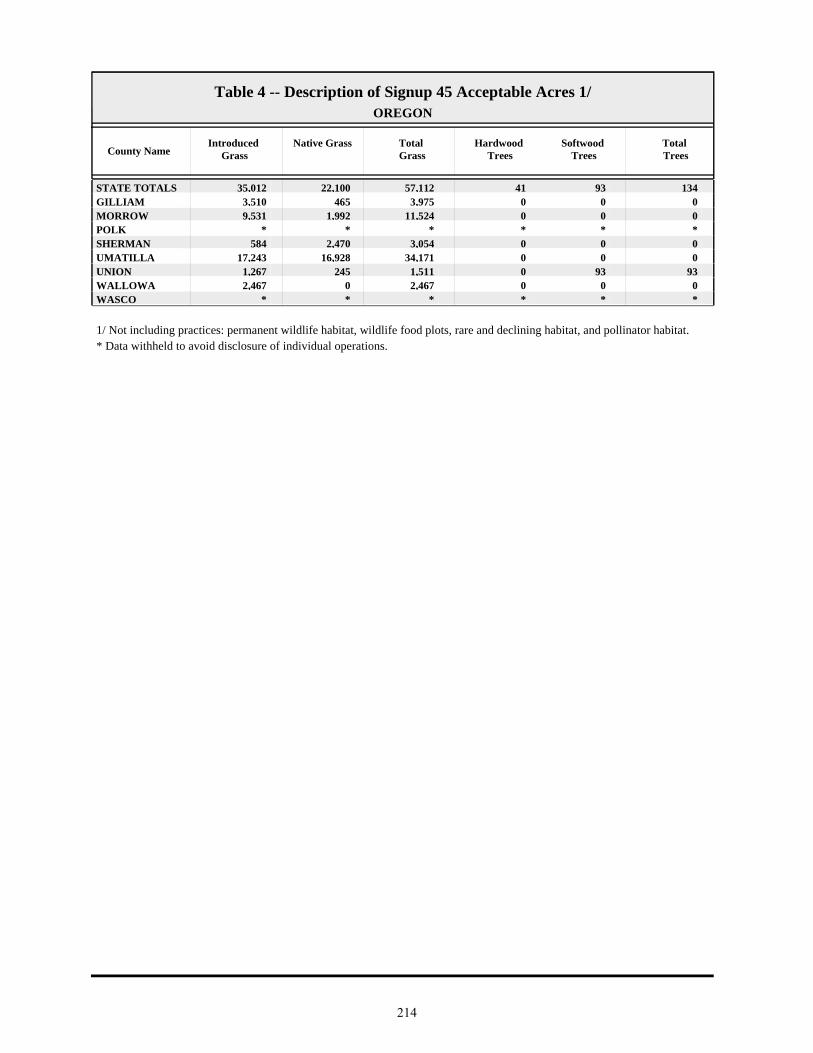
County NameIntroduced
GrassNative Grass Total
GrassHardwood
TreesSoftwood
TreesTotal Trees
Table 4 -- Description of Signup 45 Acceptable Acres 1/OREGON
STATE TOTALS 35,012 22,100 57,112 41 93 134GILLIAM 3,510 465 3,975 0 0 0MORROW 9,531 1,992 11,524 0 0 0POLK * * * * * * SHERMAN 584 2,470 3,054 0 0 0UMATILLA 17,243 16,928 34,171 0 0 0UNION 1,267 245 1,511 0 93 93WALLOWA 2,467 0 2,467 0 0 0WASCO * * * * * *
* Data withheld to avoid disclosure of individual operations.1/ Not including practices: permanent wildlife habitat, wildlife food plots, rare and declining habitat, and pollinator habitat.
214

PE
NN
SY
LV
AN
IA
215

County Name Offers Received
Acceptable Offers
Offered Acres
Acceptable Acres
EnrollmentOct. 2013
before continuous
1/
Acreage Expiring Sept. 30,
2013
Enrollment as of
June 2013
Table 1 -- Offers Received, Acceptable Offers, and CRP AcreagePENNSYLVANIA
STATE TOTALS 4 4 66 66 172,86813,601186,404ADAMS 0 0 0 0 1,9437232,665ALLEGHENY 0 0 0 0 96096ARMSTRONG 0 0 0 0 2,56682,574BEAVER 0 0 0 0 7790779BEDFORD 0 0 0 0 4,0846634,748BERKS 0 0 0 0 3,4643303,794BLAIR 0 0 0 0 1,80201,802BRADFORD 0 0 0 0 19,464819,472BUCKS 0 0 0 0 216081BUTLER 0 0 0 0 2,70932,711CAMBRIA 0 0 0 0 3,60603,606CAMERON 0 0 0 0 18018CARBON 0 0 0 0 7480748CENTRE 0 0 0 0 2,31202,312CHESTER 0 0 0 0 1,092701,162CLARION 0 0 0 0 2,87202,872CLEARFIELD 0 0 0 0 1,45501,455CLINTON 0 0 0 0 7640764COLUMBIA 0 0 0 0 7,5976618,258CRAWFORD 0 0 0 0 2,22452,229CUMBERLAND 0 0 0 0 2,2531,0243,277DAUPHIN 0 0 0 0 1,1425421,684DELAWARE 0 0 0 0 * * 0ELK 0 0 0 0 33033ERIE 0 0 0 0 3,405133,418FAYETTE 0 0 0 0 2,17702,177FOREST 0 0 0 0 32032FRANKLIN 0 0 0 0 2,9682973,265FULTON 0 0 0 0 3,2104813,692GREENE 0 0 0 0 4490449HUNTINGDON 0 0 0 0 4,587324,618INDIANA 0 0 0 0 3,64103,641JEFFERSON * * * * * 331,687JUNIATA 0 0 0 0 2,6111,2353,846LACKAWANNA 0 0 0 0 7090709LANCASTER 0 0 0 0 2,0493782,427LAWRENCE 0 0 0 0 82640865LEBANON 0 0 0 0 746130876LEHIGH 0 0 0 0 15015LUZERNE 0 0 0 0 3,27903,279LYCOMING 0 0 0 0 10,39622410,621MCKEAN 0 0 0 0 1,42021,422MERCER 0 0 0 0 1,17391,182MIFFLIN 0 0 0 0 2,10402,104MONROE 0 0 0 0 101MONTGOMERY 0 0 0 0 3810381MONTOUR 0 0 0 0 4,2606194,879NORTHAMPTON 0 0 0 0 42750NORTHUMBERLAND 0 0 0 0 4,2952,1456,441PERRY 0 0 0 0 2,7916073,398PHILADELPHIA 0 0 0 0 * * 0PIKE 0 0 0 0 10010
216

County Name Offers Received
Acceptable Offers
Offered Acres
Acceptable Acres
EnrollmentOct. 2013
before continuous
1/
Acreage Expiring Sept. 30,
2013
Enrollment as of
June 2013
Table 1 -- Offers Received, Acceptable Offers, and CRP AcreagePENNSYLVANIA
POTTER 0 0 0 0 5,62605,626SCHUYLKILL 0 0 0 0 3,3425333,875SNYDER 0 0 0 0 2,0367982,834SOMERSET 3 3 33 33 5,0954655,527SULLIVAN 0 0 0 0 1,07901,079SUSQUEHANNA 0 0 0 0 5,433105,443TIOGA 0 0 0 0 12,3984112,440UNION 0 0 0 0 1,1732531,426VENANGO 0 0 0 0 1,44001,441WARREN 0 0 0 0 1,13541,139WASHINGTON 0 0 0 0 3,19233,194WAYNE 0 0 0 0 9800980WESTMORELAND 0 0 0 0 3,19243,196WYOMING 0 0 0 0 2,00602,006YORK 0 0 0 0 2,4311,1413,572
1 / Not including continuous signup enrollment between July and September 2013.
* Data withheld to avoid disclosure of individual operations.
217

County NameExpiring
Sept. 2013 (Acres)
New Lands (Acres) 1/
Average Rental
Payment ($/Acre)
Total Rental
Payment ($/year)
Average EBI Score
without Cost
Average EBI Score with Cost
Table 2 -- Description of Signup 45 Acceptable AcresPENNSYLVANIA
STATE TOTALS 66 0 $27.39 $1,802 167 276JEFFERSON * * * * * * SOMERSET * * * * * *
* Data withheld to avoid disclosure of individual operations.
1/ Includes land that may have been in CRP in the past.
218
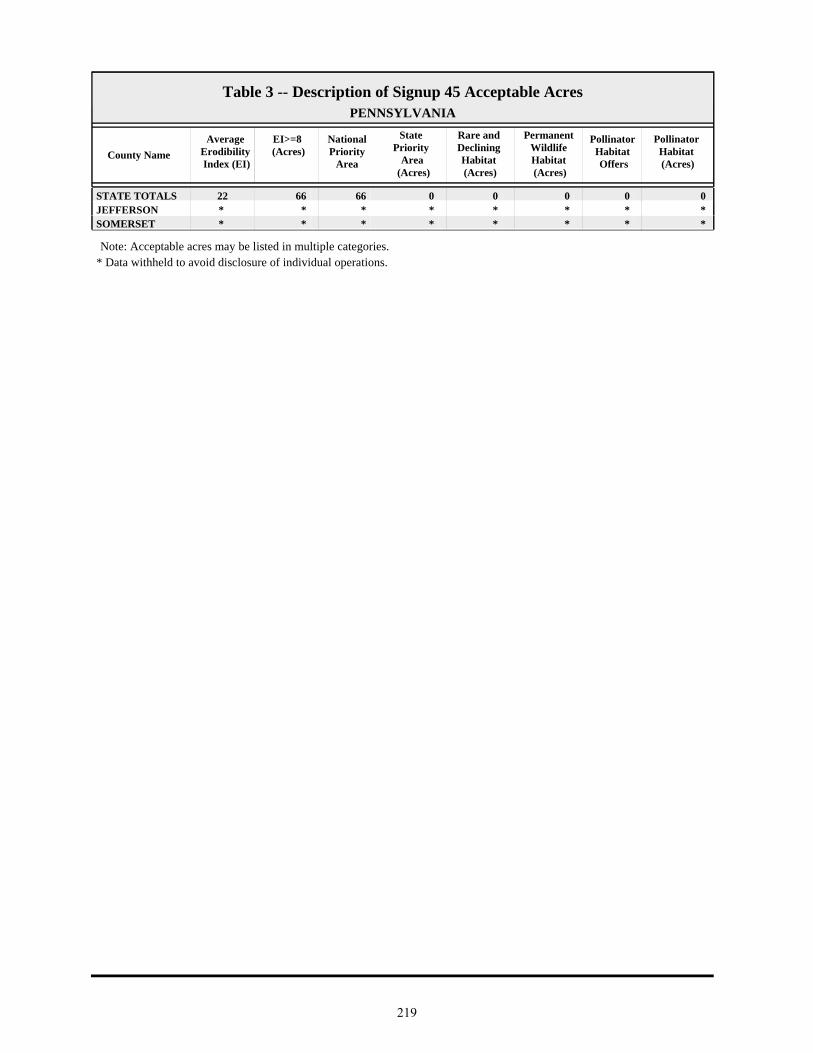
County Name
EI>=8 (Acres)
National Priority
Area
State Priority
Area (Acres)
Rare and Declining Habitat (Acres)
Permanent Wildlife Habitat (Acres)
Pollinator Habitat Offers
Table 3 -- Description of Signup 45 Acceptable AcresPENNSYLVANIA
Average Erodibility Index (EI)
Pollinator Habitat (Acres)
STATE TOTALS 66 66 0 0 0 022 0JEFFERSON * * * * * * * * SOMERSET * * * * * * * *
* Data withheld to avoid disclosure of individual operations.Note: Acceptable acres may be listed in multiple categories.
219

County NameIntroduced
GrassNative Grass Total
GrassHardwood
TreesSoftwood
TreesTotal Trees
Table 4 -- Description of Signup 45 Acceptable Acres 1/PENNSYLVANIA
STATE TOTALS 33 0 33 0 33 33JEFFERSON * * * * * * SOMERSET * * * * * *
* Data withheld to avoid disclosure of individual operations.1/ Not including practices: permanent wildlife habitat, wildlife food plots, rare and declining habitat, and pollinator habitat.
220

PU
ER
TO
RIC
O
221

County Name Offers Received
Acceptable Offers
Offered Acres
Acceptable Acres
EnrollmentOct. 2013
before continuous
1/
Acreage Expiring Sept. 30,
2013
Enrollment as of
June 2013
Table 1 -- Offers Received, Acceptable Offers, and CRP AcreagePUERTO RICO
STATE TOTALS 0 0 0 0 1,04901,049ADJUNTAS 0 0 0 0 * * 0ARECIBO 0 0 0 0 * * 0BARRANQUITAS 0 0 0 0 * * 0CAGUAS 0 0 0 0 404COROZAL 0 0 0 0 1540154LARES 0 0 0 0 * * 0MAYAQUEZ 0 0 0 0 7190719PONCE 0 0 0 0 1400140UTUADO 0 0 0 0 32032
1 / Not including continuous signup enrollment between July and September 2013.
* Data withheld to avoid disclosure of individual operations.
222

RHODE ISLAND
223

County Name Offers Received
Acceptable Offers
Offered Acres
Acceptable Acres
EnrollmentOct. 2013
before continuous
1/
Acreage Expiring Sept. 30,
2013
Enrollment as of
June 2013
Table 1 -- Offers Received, Acceptable Offers, and CRP AcreageRHODE ISLAND
STATE TOTALS 0 0 0 0 28028BRISTOL 0 0 0 0 * * 0KENT 0 0 0 0 * * 0NEWPORT 0 0 0 0 * * 0PROVIDENCE 0 0 0 0 28028WASHINGTON 0 0 0 0 * * 0
1 / Not including continuous signup enrollment between July and September 2013.
* Data withheld to avoid disclosure of individual operations.
224

SO
UT
H C
AR
OL
INA
225

County Name Offers Received
Acceptable Offers
Offered Acres
Acceptable Acres
EnrollmentOct. 2013
before continuous
1/
Acreage Expiring Sept. 30,
2013
Enrollment as of
June 2013
Table 1 -- Offers Received, Acceptable Offers, and CRP AcreageSOUTH CAROLINA
STATE TOTALS 107 96 3,057 2,797 110,38714,549122,139ABBEVILLE * * * * * 117664AIKEN 0 0 0 0 1,362461,408ALLENDALE * * * * * 783,193ANDERSON * * * * * 691,802BAMBERG 11 11 658 658 8,7341,4659,540BARNWELL 0 0 0 0 3,963854,048BEAUFORT 0 0 0 0 0117117BERKELEY 3 3 41 41 40691457CALHOUN * * * * * 992,083CHARLESTON 0 0 0 0 297105401CHEROKEE 0 0 0 0 2220222CHESTER * * * * * 72292CHESTERFIELD 7 7 168 168 10,07052710,430CLARENDON 4 4 88 88 5,9731,9447,830COLLETON 8 7 240 222 2,8776223,277DARLINGTON 0 0 0 0 1,806251,831DILLON 0 0 0 0 2,6712842,955DORCHESTER 0 0 0 0 642198840EDGEFIELD * * * * * 2121,379FAIRFIELD 0 0 0 0 * * 0FLORENCE 3 3 51 51 2,9602613,171GEORGETOWN 7 5 46 30 1,3223771,670GREENVILLE 0 0 0 0 4690469GREENWOOD 0 0 0 0 1180118HAMPTON 0 0 0 0 1,8224442,266HORRY * * * * * 1,0825,447JASPER 0 0 0 0 12426150KERSHAW 0 0 0 0 1,8172312,048LANCASTER * * * * * 25512LAURENS * * * * * 481,347LEE * * * * * 51910,241LEXINGTON 0 0 0 0 50135536MCCORMICK 0 0 0 0 72072MARION 0 0 0 0 1,2524251,678MARLBORO * * * * * 1962,455NEWBERRY * * * * * 154654OCONEE * * * * * 107281ORANGEBURG 5 5 88 88 9,93821910,069PICKENS 0 0 0 0 0101101RICHLAND 0 0 0 0 21052262SALUDA 13 13 324 324 1,6368122,124SPARTANBURG * * * * * 32794SUMTER 13 10 322 209 7,9501,1448,885UNION 0 0 0 0 4550455WILLIAMSBURG 9 9 362 362 11,5952,06713,300YORK * 0 * 0 22936265
1 / Not including continuous signup enrollment between July and September 2013.
* Data withheld to avoid disclosure of individual operations.
226

County NameExpiring
Sept. 2013 (Acres)
New Lands (Acres) 1/
Average Rental
Payment ($/Acre)
Total Rental
Payment ($/year)
Average EBI Score
without Cost
Average EBI Score with Cost
Table 2 -- Description of Signup 45 Acceptable AcresSOUTH CAROLINA
STATE TOTALS 2,749 48 $34.84 $97,465 157 273ABBEVILLE * * * * * * ALLENDALE * * * * * * ANDERSON * * * * * * BAMBERG 658 0 $34.65 $22,798 157 270BERKELEY 41 0 $33.15 $1,343 147 253CALHOUN * * * * * * CHESTER * * * * * * CHESTERFIELD 168 0 $39.16 $6,563 170 283CLARENDON 88 0 $43.00 $3,767 137 255COLLETON 222 0 $37.24 $8,255 155 278EDGEFIELD * * * * * * FLORENCE 51 0 $39.88 $2,030 151 266GEORGETOWN 30 0 $30.52 $916 153 286HORRY * * * * * * LANCASTER * * * * * * LAURENS * * * * * * LEE * * * * * * MARLBORO * * * * * * NEWBERRY * * * * * * OCONEE * * * * * * ORANGEBURG 88 0 $41.10 $3,613 160 271SALUDA 324 0 $23.84 $7,718 166 302SPARTANBURG * * * * * * SUMTER 209 0 $41.69 $8,705 186 297WILLIAMSBURG 356 6 $42.21 $15,262 143 244
* Data withheld to avoid disclosure of individual operations.
1/ Includes land that may have been in CRP in the past.
227

County Name
EI>=8 (Acres)
National Priority
Area
State Priority
Area (Acres)
Rare and Declining Habitat (Acres)
Permanent Wildlife Habitat (Acres)
Pollinator Habitat Offers
Table 3 -- Description of Signup 45 Acceptable AcresSOUTH CAROLINA
Average Erodibility Index (EI)
Pollinator Habitat (Acres)
STATE TOTALS 1,302 2,415 41 0 14 012 0ABBEVILLE * * * * * * * * ALLENDALE * * * * * * * * ANDERSON * * * * * * * * BAMBERG 267 658 0 0 3 06 0BERKELEY 0 41 0 0 0 01 0CALHOUN * * * * * * * * CHESTER * * * * * * * * CHESTERFIELD 147 168 0 0 0 025 0CLARENDON 0 88 0 0 0 02 0COLLETON 0 222 0 0 0 03 0EDGEFIELD * * * * * * * * FLORENCE 0 41 41 0 0 01 0GEORGETOWN 12 30 0 0 0 05 0HORRY * * * * * * * * LANCASTER * * * * * * * * LAURENS * * * * * * * * LEE * * * * * * * * MARLBORO * * * * * * * * NEWBERRY * * * * * * * * OCONEE * * * * * * * * ORANGEBURG 19 88 0 0 0 05 0SALUDA 324 324 0 0 0 021 0SPARTANBURG * * * * * * * * SUMTER 92 209 0 0 0 036 0WILLIAMSBURG 0 362 0 0 12 03 0
* Data withheld to avoid disclosure of individual operations.Note: Acceptable acres may be listed in multiple categories.
228
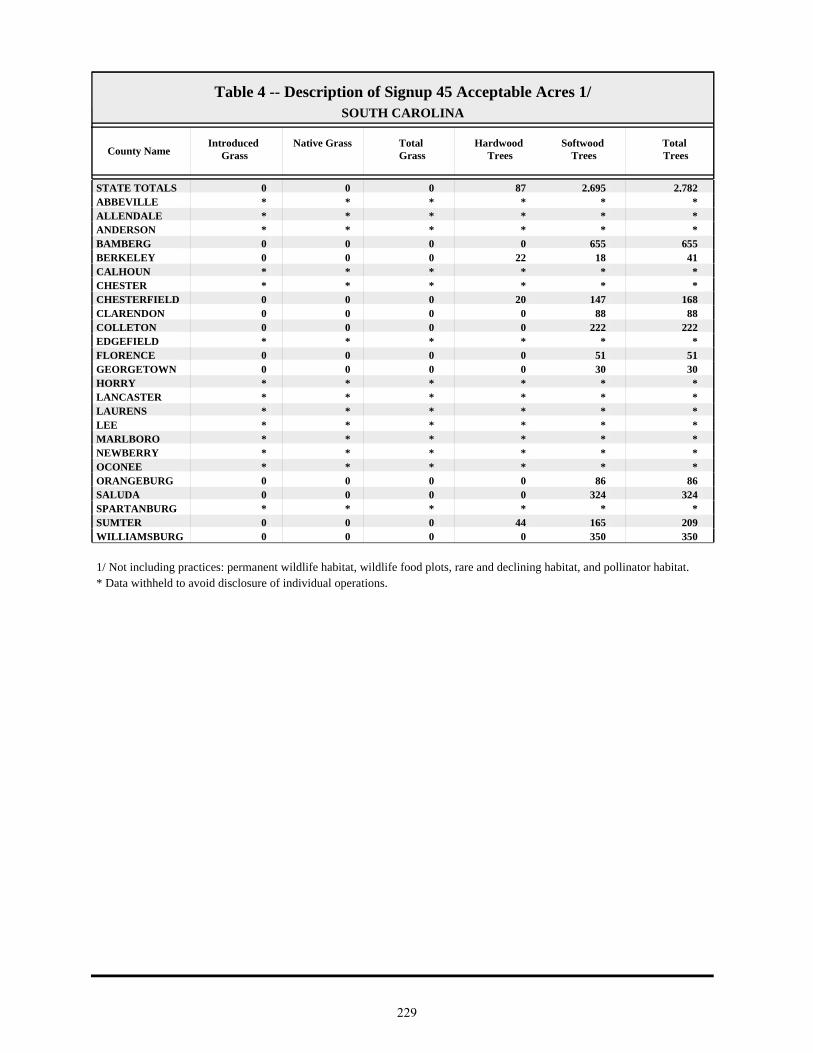
County NameIntroduced
GrassNative Grass Total
GrassHardwood
TreesSoftwood
TreesTotal Trees
Table 4 -- Description of Signup 45 Acceptable Acres 1/SOUTH CAROLINA
STATE TOTALS 0 0 0 87 2,695 2,782ABBEVILLE * * * * * * ALLENDALE * * * * * * ANDERSON * * * * * * BAMBERG 0 0 0 0 655 655BERKELEY 0 0 0 22 18 41CALHOUN * * * * * * CHESTER * * * * * * CHESTERFIELD 0 0 0 20 147 168CLARENDON 0 0 0 0 88 88COLLETON 0 0 0 0 222 222EDGEFIELD * * * * * * FLORENCE 0 0 0 0 51 51GEORGETOWN 0 0 0 0 30 30HORRY * * * * * * LANCASTER * * * * * * LAURENS * * * * * * LEE * * * * * * MARLBORO * * * * * * NEWBERRY * * * * * * OCONEE * * * * * * ORANGEBURG 0 0 0 0 86 86SALUDA 0 0 0 0 324 324SPARTANBURG * * * * * * SUMTER 0 0 0 44 165 209WILLIAMSBURG 0 0 0 0 350 350
* Data withheld to avoid disclosure of individual operations.1/ Not including practices: permanent wildlife habitat, wildlife food plots, rare and declining habitat, and pollinator habitat.
229

SO
UT
H D
AK
OT
A
230

County Name Offers Received
Acceptable Offers
Offered Acres
Acceptable Acres
EnrollmentOct. 2013
before continuous
1/
Acreage Expiring Sept. 30,
2013
Enrollment as of
June 2013
Table 1 -- Offers Received, Acceptable Offers, and CRP AcreageSOUTH DAKOTA
STATE TOTALS 261 146 19,493 14,837 884,801105,141975,105AURORA * * * * * 42815,987BEADLE 5 4 305 187 18,2262,32920,367BENNETT * * * * * 2155,497BON HOMME * * * * * 72410,509BROOKINGS 22 11 512 260 23,7704,18927,699BROWN * 0 * 0 64,2029,08973,291BRULE * * * * * 4578,880BUFFALO 0 0 0 0 2,1747062,880BUTTE 7 7 2,500 2,500 13,3943,39614,290CAMPBELL * * * * * 6,83418,870CHARLES MIX 13 7 573 361 15,5761,64116,856CLARK 11 5 56 28 24,6982,34127,010CLAY 5 4 266 254 6,7706467,162CODINGTON 15 5 104 57 12,0912,19914,234CORSON 0 0 0 0 3,3882833,671CUSTER 0 0 0 0 85085DAVISON 0 0 0 0 8,4883398,827DAY * 0 * 0 31,8128,00339,814DEUEL 11 * 111 * * 3,19623,101DEWEY * * * * * 593,074DOUGLAS 3 0 34 0 5,5587566,314EDMUNDS 11 5 1,102 660 10,8031,33611,479FALL RIVER 0 0 0 0 9962821,278FAULK 7 6 213 149 4,8408935,584GRANT 5 4 55 38 9,86174010,563GREGORY 0 0 0 0 6,7582947,052HAAKON 7 6 1,379 976 32,3072,50933,840HAMLIN 7 4 37 10 13,14574913,885HAND 7 * 465 * * 1,82013,814HANSON * * * * * 77710,007HARDING 0 0 0 0 3,1784023,580HUGHES * * * * * 76212,385HUTCHINSON * * * * * 1,23523,369HYDE 0 0 0 0 5,4535165,969JACKSON 0 0 0 0 6,638576,694JERAULD 4 4 192 192 7,9061757,889JONES 0 0 0 0 6,7246337,357KINGSBURY * 0 * 0 7,2388688,106LAKE 10 5 430 132 8,0791,4999,447LAWRENCE 0 0 0 0 28028LINCOLN 5 * 140 * * 6938,335LYMAN 25 9 3,199 1,601 60,7872,76261,948MCCOOK 0 0 0 0 11,52138911,910MCPHERSON * * * * * 2,51512,090MARSHALL 0 0 0 0 37,6594,51942,178MEADE 9 9 4,193 4,193 14,4475,34015,593MELLETTE 0 0 0 0 8028810MINER 3 * 33 * * 1,12519,595MINNEHAHA 6 3 167 53 6,6381,3087,893MOODY * * * * * 71114,271PENNINGTON 0 0 0 0 3,093913,184PERKINS * 0 * 0 35,6241,55137,175
231

County Name Offers Received
Acceptable Offers
Offered Acres
Acceptable Acres
EnrollmentOct. 2013
before continuous
1/
Acreage Expiring Sept. 30,
2013
Enrollment as of
June 2013
Table 1 -- Offers Received, Acceptable Offers, and CRP AcreageSOUTH DAKOTA
POTTER * * * * * 2,93912,353ROBERTS 8 8 346 346 31,3244,25235,230SANBORN 7 0 256 0 16,64063617,276SHANNON 0 0 0 0 760126886SPINK * 0 * 0 28,6692,44631,115STANLEY 5 5 1,138 1,138 29,7673,20631,835SULLY * * * * * 1,29912,416TODD 0 0 0 0 255142398TRIPP 5 3 76 28 16,71057017,252TURNER 3 3 107 107 8,7604449,097UNION 8 6 320 249 6,4034626,616WALWORTH * 0 * 0 8,2613,34111,602YANKTON * 0 * 0 9,75758210,340ZIEBACH 0 0 0 0 2,6543072,961
1 / Not including continuous signup enrollment between July and September 2013.
* Data withheld to avoid disclosure of individual operations.
232

County NameExpiring
Sept. 2013 (Acres)
New Lands (Acres) 1/
Average Rental
Payment ($/Acre)
Total Rental
Payment ($/year)
Average EBI Score
without Cost
Average EBI Score with Cost
Table 2 -- Description of Signup 45 Acceptable AcresSOUTH DAKOTA
STATE TOTALS 12,620 2,217 $56.66 $840,626 152 258AURORA * * * * * * BEADLE 110 78 $131.38 $24,594 155 214BENNETT * * * * * * BON HOMME * * * * * * BROOKINGS 251 9 $155.08 $40,243 187 228BRULE * * * * * * BUTTE 2,159 341 $30.52 $76,306 140 272CAMPBELL * * * * * * CHARLES MIX 336 25 $122.47 $44,187 160 217CLARK 22 7 $117.17 $3,316 159 220CLAY 74 180 $139.47 $35,425 161 226CODINGTON 57 0 $142.31 $8,069 160 215DEUEL * * * * * * DEWEY * * * * * * EDMUNDS 519 141 $79.00 $52,103 135 215FAULK 79 70 $77.07 $11,499 141 230GRANT 14 24 $120.14 $4,553 169 244HAAKON 976 0 $34.56 $33,734 157 262HAMLIN 10 0 $126.88 $1,243 157 218HAND * * * * * * HANSON * * * * * * HUGHES * * * * * * HUTCHINSON * * * * * * JERAULD 147 45 $78.84 $15,113 144 225LAKE 132 0 $168.71 $22,203 188 226LINCOLN * * * * * * LYMAN 1,210 391 $64.15 $102,704 157 246MCPHERSON * * * * * * MEADE 4,193 0 $23.80 $99,801 140 276MINER * * * * * * MINNEHAHA 49 5 $157.27 $8,382 179 233MOODY * * * * * * POTTER * * * * * * ROBERTS 335 11 $137.62 $47,673 167 225STANLEY 970 167 $31.00 $35,271 188 296SULLY * * * * * * TRIPP 0 28 $57.37 $1,583 144 236TURNER 107 0 $153.73 $16,464 198 235UNION 28 221 $186.92 $46,543 247 266
* Data withheld to avoid disclosure of individual operations.
1/ Includes land that may have been in CRP in the past.
233

County Name
EI>=8 (Acres)
National Priority
Area
State Priority
Area (Acres)
Rare and Declining Habitat (Acres)
Permanent Wildlife Habitat (Acres)
Pollinator Habitat Offers
Table 3 -- Description of Signup 45 Acceptable AcresSOUTH DAKOTA
Average Erodibility Index (EI)
Pollinator Habitat (Acres)
STATE TOTALS 11,464 4,177 3,747 61 3,172 1613 67AURORA * * * * * * * * BEADLE 85 187 0 0 180 17 2BENNETT * * * * * * * * BON HOMME * * * * * * * * BROOKINGS 73 260 0 0 112 36 8BRULE * * * * * * * * BUTTE 2,500 0 0 0 0 019 0CAMPBELL * * * * * * * * CHARLES MIX 8 361 0 0 19 06 0CLARK 0 28 0 0 22 05 0CLAY 10 254 0 0 239 06 0CODINGTON 0 57 0 0 57 04 0DEUEL * * * * * * * * DEWEY * * * * * * * * EDMUNDS 71 660 0 0 21 04 0FAULK 0 149 0 0 0 04 0GRANT 5 38 5 4 14 16 1HAAKON 976 0 976 0 89 011 0HAMLIN 0 10 0 0 10 04 0HAND * * * * * * * * HANSON * * * * * * * * HUGHES * * * * * * * * HUTCHINSON * * * * * * * * JERAULD 0 192 0 0 141 04 0LAKE 28 132 0 0 96 26 10LINCOLN * * * * * * * * LYMAN 1,601 0 1,601 0 391 09 0MCPHERSON * * * * * * * * MEADE 4,193 0 0 0 0 017 0MINER * * * * * * * * MINNEHAHA 32 53 0 0 0 19 3MOODY * * * * * * * * POTTER * * * * * * * * ROBERTS 0 346 0 0 84 34 18STANLEY 1,138 0 1,138 0 938 013 0SULLY * * * * * * * * TRIPP 5 0 28 0 0 07 0TURNER 38 107 0 0 1 36 11UNION 249 249 0 24 146 015 0
* Data withheld to avoid disclosure of individual operations.Note: Acceptable acres may be listed in multiple categories.
234

County NameIntroduced
GrassNative Grass Total
GrassHardwood
TreesSoftwood
TreesTotal Trees
Table 4 -- Description of Signup 45 Acceptable Acres 1/SOUTH DAKOTA
STATE TOTALS 1,485 9,893 11,378 0 0 0AURORA * * * * * * BEADLE 0 0 0 0 0 0BENNETT * * * * * * BON HOMME * * * * * * BROOKINGS 13 119 132 0 0 0BRULE * * * * * * BUTTE 56 2,445 2,500 0 0 0CAMPBELL * * * * * * CHARLES MIX 8 316 324 0 0 0CLARK 0 7 7 0 0 0CLAY 0 15 15 0 0 0CODINGTON 0 0 0 0 0 0DEUEL * * * * * * DEWEY * * * * * * EDMUNDS 597 0 597 0 0 0FAULK 35 107 142 0 0 0GRANT 0 19 19 0 0 0HAAKON 273 606 879 0 0 0HAMLIN 0 0 0 0 0 0HAND * * * * * * HANSON * * * * * * HUGHES * * * * * * HUTCHINSON * * * * * * JERAULD 0 41 41 0 0 0LAKE 0 26 26 0 0 0LINCOLN * * * * * * LYMAN 0 1,210 1,210 0 0 0MCPHERSON * * * * * * MEADE 0 4,193 4,193 0 0 0MINER * * * * * * MINNEHAHA 0 50 50 0 0 0MOODY * * * * * * POTTER * * * * * * ROBERTS 63 182 245 0 0 0STANLEY 0 168 168 0 0 0SULLY * * * * * * TRIPP 0 28 28 0 0 0TURNER 0 91 91 0 0 0UNION 0 78 78 0 0 0
* Data withheld to avoid disclosure of individual operations.1/ Not including practices: permanent wildlife habitat, wildlife food plots, rare and declining habitat, and pollinator habitat.
235

TE
NN
ES
SE
E
236

County Name Offers Received
Acceptable Offers
Offered Acres
Acceptable Acres
EnrollmentOct. 2013
before continuous
1/
Acreage Expiring Sept. 30,
2013
Enrollment as of
June 2013
Table 1 -- Offers Received, Acceptable Offers, and CRP AcreageTENNESSEE
STATE TOTALS 771 749 24,910 24,555 150,43350,954176,831ANDERSON 0 0 0 0 53539BEDFORD * * * * * 215348BENTON 19 17 709 641 2,6942,3254,378BLEDSOE 0 0 0 0 23096325BLOUNT 0 0 0 0 * * 0BRADLEY 0 0 0 0 1760176CAMPBELL 0 0 0 0 20020CANNON 0 0 0 0 58058CARROLL 89 87 2,105 2,098 9,9163,78911,607CARTER 0 0 0 0 * * 0CHEATHAM * * * * * 19254CHESTER 15 14 310 297 3,5422713,516CLAIBORNE 0 0 0 0 23023CLAY 0 0 0 0 99099COCKE 0 0 0 0 * * 0COFFEE * * * * * 0135CROCKETT 30 30 923 923 3,6372,5805,294CUMBERLAND 4 3 76 41 997801,036DAVIDSON 0 0 0 0 12012DECATUR 13 11 438 392 1,4127481,768DEKALB * * * * * 69167DICKSON * * * * * 36534DYER 16 16 398 398 2,8811,7034,186FAYETTE 45 45 2,955 2,955 14,0295,84416,918FENTRESS 0 0 0 0 2450245FRANKLIN * * * * * 107594GIBSON 44 44 1,269 1,269 8,0792,6389,448GILES 9 9 398 398 1,5915141,707GRAINGER 0 0 0 0 * * 0GREENE 0 0 0 0 12416140GRUNDY 0 0 0 0 1160116HAMBLEN 0 0 0 0 * * 0HAMILTON 0 0 0 0 11011HANCOCK 0 0 0 0 303HARDEMAN 31 31 1,015 1,015 7,6672,6889,340HARDIN 9 9 298 298 6,0997596,560HAWKINS 0 0 0 0 24024HAYWOOD 74 73 2,430 2,421 10,2264,62212,427HENDERSON 14 13 643 618 6,7491,0337,165HENRY 33 32 982 975 6,2502,0487,323HICKMAN * * * * * 29521HOUSTON 0 0 0 0 11011HUMPHREYS 0 0 0 0 14723170JACKSON 0 0 0 0 909JEFFERSON 0 0 0 0 * * 0JOHNSON 0 0 0 0 * * 0KNOX * * * * * 21125LAKE 0 0 0 0 1580158LAUDERDALE 47 47 1,018 1,018 8,4973,33610,816LAWRENCE 28 27 935 930 6,5951,9277,592LEWIS 0 0 0 0 18018LINCOLN * * * * * 158600
237

County Name Offers Received
Acceptable Offers
Offered Acres
Acceptable Acres
EnrollmentOct. 2013
before continuous
1/
Acreage Expiring Sept. 30,
2013
Enrollment as of
June 2013
Table 1 -- Offers Received, Acceptable Offers, and CRP AcreageTENNESSEE
LOUDON * * * * * 1111MCMINN * * * * * 28133MCNAIRY 30 30 910 910 7,2051,2307,526MACON * 0 * 0 291645MADISON 72 69 2,587 2,545 10,3573,53711,349MARION 0 0 0 0 50050MARSHALL * 0 * 0 2520252MAURY * * * * * 4462MEIGS 6 6 270 270 430291452MONROE 0 0 0 0 * * 0MONTGOMERY 4 4 95 95 422407735MOORE 0 0 0 0 14014MORGAN 0 0 0 0 * * 0OBION 35 33 916 896 6,0792,1817,364OVERTON 0 0 0 0 452065PERRY * 0 * 0 5886594PICKETT 0 0 0 0 * * 0POLK 0 0 0 0 77077PUTNAM 0 0 0 0 19014204RHEA * * * * * 29954ROANE * * * * * 0111ROBERTSON 4 4 25 25 52010505RUTHERFORD 0 0 0 0 505SCOTT 0 0 0 0 * * 0SEQUATCHIE 0 0 0 0 1270127SEVIER 0 0 0 0 * * 0SHELBY 8 8 452 451 1,8208232,192SMITH 0 0 0 0 82082STEWART 0 0 0 0 401655SULLIVAN 0 0 0 0 000SUMNER 0 0 0 0 5788145TIPTON 11 11 379 379 2,2499482,818TROUSDALE 0 0 0 0 * * 0UNICOI 0 0 0 0 * * 0UNION 0 0 0 0 31637VAN BUREN * * * * * 67834WARREN 0 0 0 0 707WASHINGTON 0 0 0 0 * * 0WAYNE 7 7 218 218 2,4582642,504WEAKLEY 51 50 1,693 1,672 9,2533,15910,739WHITE 0 0 0 0 17817195WILLIAMSON 0 0 0 0 7648125WILSON 0 0 0 0 44448
1 / Not including continuous signup enrollment between July and September 2013.
* Data withheld to avoid disclosure of individual operations.
238

County NameExpiring
Sept. 2013 (Acres)
New Lands (Acres) 1/
Average Rental
Payment ($/Acre)
Total Rental
Payment ($/year)
Average EBI Score
without Cost
Average EBI Score with Cost
Table 2 -- Description of Signup 45 Acceptable AcresTENNESSEE
STATE TOTALS 23,260 1,295 $106.03 $2,603,674 206 276BEDFORD * * * * * * BENTON 582 59 $104.83 $67,236 170 238CARROLL 2,058 41 $112.54 $236,143 250 313CHEATHAM * * * * * * CHESTER 206 91 $78.02 $23,196 184 270COFFEE * * * * * * CROCKETT 923 0 $119.54 $110,307 238 295CUMBERLAND 41 0 $117.67 $4,860 153 211DECATUR 363 29 $85.73 $33,641 170 246DEKALB * * * * * * DICKSON * * * * * * DYER 382 16 $107.15 $42,645 223 291FAYETTE 2,771 184 $78.34 $231,502 204 299FRANKLIN * * * * * * GIBSON 1,269 0 $112.32 $142,492 216 281GILES 398 0 $95.28 $37,883 177 248HARDEMAN 971 44 $99.03 $100,474 197 269HARDIN 298 0 $82.37 $24,528 173 251HAYWOOD 2,399 22 $138.72 $335,835 240 286HENDERSON 618 0 $81.42 $50,280 162 241HENRY 891 84 $130.39 $127,127 198 256HICKMAN * * * * * * KNOX * * * * * * LAUDERDALE 942 75 $116.07 $118,113 182 241LAWRENCE 930 0 $76.45 $71,083 172 265LINCOLN * * * * * * LOUDON * * * * * * MCMINN * * * * * * MCNAIRY 856 54 $71.28 $64,838 171 260MADISON 2,509 37 $127.39 $324,276 214 268MAURY * * * * * * MEIGS 270 0 $38.48 $10,381 169 273MONTGOMERY 95 0 $123.69 $11,701 158 213OBION 813 83 $126.29 $113,190 227 281RHEA * * * * * * ROANE * * * * * * ROBERTSON 4 22 $174.29 $4,427 275 301SHELBY 452 0 $100.39 $45,325 174 267TIPTON 377 2 $98.46 $37,334 205 291VAN BUREN * * * * * * WAYNE 218 0 $65.59 $14,326 185 294WEAKLEY 1,404 268 $113.82 $190,324 204 278
* Data withheld to avoid disclosure of individual operations.
1/ Includes land that may have been in CRP in the past.
239

County Name
EI>=8 (Acres)
National Priority
Area
State Priority
Area (Acres)
Rare and Declining Habitat (Acres)
Permanent Wildlife Habitat (Acres)
Pollinator Habitat Offers
Table 3 -- Description of Signup 45 Acceptable AcresTENNESSEE
Average Erodibility Index (EI)
Pollinator Habitat (Acres)
STATE TOTALS 24,440 0 11,859 0 275 533 12BEDFORD * * * * * * * * BENTON 641 0 0 0 0 043 0CARROLL 2,036 0 2,098 0 0 026 0CHEATHAM * * * * * * * * CHESTER 295 0 0 0 12 021 0COFFEE * * * * * * * * CROCKETT 923 0 923 0 0 038 0CUMBERLAND 41 0 0 0 0 060 0DECATUR 392 0 0 0 0 030 0DEKALB * * * * * * * * DICKSON * * * * * * * * DYER 376 0 398 0 0 041 0FAYETTE 2,955 0 0 0 0 032 0FRANKLIN * * * * * * * * GIBSON 1,269 0 1,269 0 0 043 0GILES 398 0 398 0 12 127 3HARDEMAN 1,015 0 0 0 0 031 0HARDIN 298 0 0 0 0 021 0HAYWOOD 2,421 0 2,421 0 0 031 0HENDERSON 618 0 5 0 10 032 0HENRY 975 0 672 0 0 024 0HICKMAN * * * * * * * * KNOX * * * * * * * * LAUDERDALE 1,018 0 0 0 0 040 0LAWRENCE 901 0 930 0 0 332 7LINCOLN * * * * * * * * LOUDON * * * * * * * * MCMINN * * * * * * * * MCNAIRY 910 0 0 0 10 119 2MADISON 2,546 0 0 0 33 031 0MAURY * * * * * * * * MEIGS 270 0 0 0 198 059 0MONTGOMERY 95 0 95 0 0 022 0OBION 896 0 896 0 0 042 0RHEA * * * * * * * * ROANE * * * * * * * * ROBERTSON 25 0 25 0 0 023 0SHELBY 452 0 0 0 0 032 0TIPTON 379 0 0 0 0 036 0VAN BUREN * * * * * * * * WAYNE 218 0 0 0 0 059 0WEAKLEY 1,672 0 1,672 0 0 038 0
* Data withheld to avoid disclosure of individual operations.Note: Acceptable acres may be listed in multiple categories.
240

County NameIntroduced
GrassNative Grass Total
GrassHardwood
TreesSoftwood
TreesTotal Trees
Table 4 -- Description of Signup 45 Acceptable Acres 1/TENNESSEE
STATE TOTALS 8,672 11,073 19,746 373 4,057 4,430BEDFORD * * * * * * BENTON 287 354 641 0 0 0CARROLL 227 1,576 1,803 80 215 295CHEATHAM * * * * * * CHESTER 78 76 154 0 132 132COFFEE * * * * * * CROCKETT 119 750 869 4 50 54CUMBERLAND 41 0 41 0 0 0DECATUR 99 141 240 0 152 152DEKALB * * * * * * DICKSON * * * * * * DYER 156 236 392 6 0 6FAYETTE 147 1,505 1,652 0 1,273 1,273FRANKLIN * * * * * * GIBSON 658 537 1,195 32 42 74GILES 58 209 267 0 110 110HARDEMAN 450 383 833 52 124 176HARDIN 6 200 206 10 63 73HAYWOOD 47 2,243 2,290 6 121 127HENDERSON 296 207 502 11 95 105HENRY 855 30 885 41 49 90HICKMAN * * * * * * KNOX * * * * * * LAUDERDALE 825 116 941 45 32 77LAWRENCE 688 59 748 0 161 161LINCOLN * * * * * * LOUDON * * * * * * MCMINN * * * * * * MCNAIRY 134 119 253 0 644 644MADISON 526 1,531 2,057 13 443 456MAURY * * * * * * MEIGS 0 72 72 0 0 0MONTGOMERY 95 0 95 0 0 0OBION 627 228 856 7 34 41RHEA * * * * * * ROANE * * * * * * ROBERTSON 4 22 25 0 0 0SHELBY 310 128 438 0 14 14TIPTON 179 129 308 39 24 63VAN BUREN * * * * * * WAYNE 15 0 15 21 180 201WEAKLEY 1,517 69 1,585 7 78 85
* Data withheld to avoid disclosure of individual operations.1/ Not including practices: permanent wildlife habitat, wildlife food plots, rare and declining habitat, and pollinator habitat.
241

TEXAS
242

County Name Offers Received
Acceptable Offers
Offered Acres
Acceptable Acres
EnrollmentOct. 2013
before continuous
1/
Acreage Expiring Sept. 30,
2013
Enrollment as of
June 2013
Table 1 -- Offers Received, Acceptable Offers, and CRP AcreageTEXAS
STATE TOTALS 2,226 2,091 333,192 312,389 3,212,393361,7273,261,730ANDERSON 0 0 0 0 * * 0ANDREWS 3 3 2,058 2,058 26,006023,948ANGELINA 0 0 0 0 81969888ARANSAS 0 0 0 0 * * 0ARCHER 0 0 0 0 1500150ARMSTRONG 3 3 663 663 16,48713615,960ATASCOSA 0 0 0 0 3450345AUSTIN 0 0 0 0 171734BAILEY 8 8 1,834 1,834 135,99236134,194BANDERA 0 0 0 0 39039BASTROP 0 0 0 0 47047BAYLOR * * * * * 72561BEE 0 0 0 0 71071BELL 0 0 0 0 2070207BEXAR 0 0 0 0 * * 0BLANCO 0 0 0 0 * * 0BORDEN 3 * 660 * * 7886,780BOSQUE * * * * * 364364BOWIE 0 0 0 0 1,166211,187BRAZORIA 0 0 0 0 * * 0BRAZOS 0 0 0 0 * * 0BREWSTER 0 0 0 0 1,57401,574BRISCOE 18 11 3,403 2,158 44,2761,39743,514BROOKS 0 0 0 0 1,182201,202BROWN 0 0 0 0 1680168BURLESON 0 0 0 0 * * 0BURNET 0 0 0 0 40040CALDWELL 0 0 0 0 45045CALHOUN 0 0 0 0 83083CALLAHAN 0 0 0 0 7850785CAMERON 0 0 0 0 5,3063405,646CAMP 0 0 0 0 * * 0CARSON 30 30 7,026 7,026 47,36011,36851,702CASS 0 0 0 0 * * 0CASTRO 62 49 9,781 8,142 103,41213,453108,724CHAMBERS 0 0 0 0 * * 0CHEROKEE 0 0 0 0 49049CHILDRESS 20 19 1,946 1,870 30,8601,46830,458CLAY 0 0 0 0 8650865COCHRAN * 0 * 0 80,699080,699COKE * 0 * 0 7810781COLEMAN 3 3 443 443 3,3128433,711COLLIN * * * * * 3043COLLINGSWORTH 21 21 2,027 2,027 37,2482,12037,341COLORADO 0 0 0 0 1410141COMAL 0 0 0 0 * * 0COMANCHE 0 0 0 0 2860286CONCHO 12 11 1,277 1,206 6,8841,5537,231COOKE 0 0 0 0 * * 0CORYELL 0 0 0 0 6983151COTTLE 12 10 2,302 1,915 34,89667633,657CRANE 0 0 0 0 58058
243
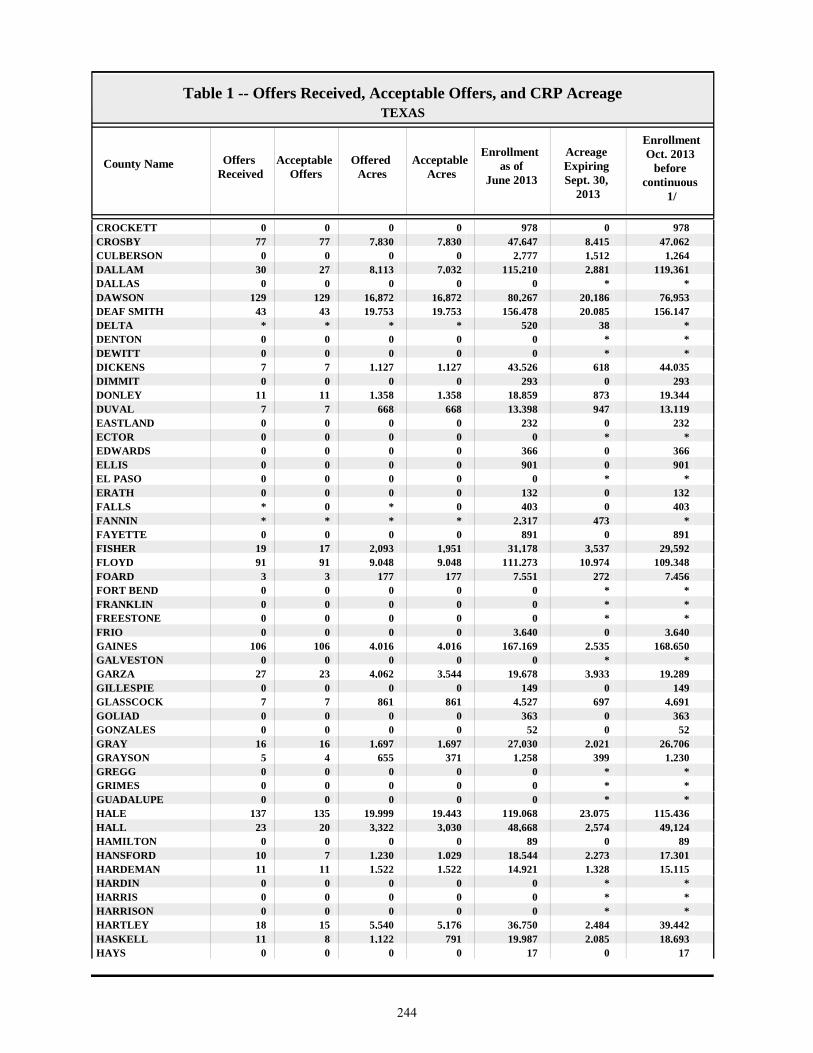
County Name Offers Received
Acceptable Offers
Offered Acres
Acceptable Acres
EnrollmentOct. 2013
before continuous
1/
Acreage Expiring Sept. 30,
2013
Enrollment as of
June 2013
Table 1 -- Offers Received, Acceptable Offers, and CRP AcreageTEXAS
CROCKETT 0 0 0 0 9780978CROSBY 77 77 7,830 7,830 47,0628,41547,647CULBERSON 0 0 0 0 1,2641,5122,777DALLAM 30 27 8,113 7,032 119,3612,881115,210DALLAS 0 0 0 0 * * 0DAWSON 129 129 16,872 16,872 76,95320,18680,267DEAF SMITH 43 43 19,753 19,753 156,14720,085156,478DELTA * * * * * 38520DENTON 0 0 0 0 * * 0DEWITT 0 0 0 0 * * 0DICKENS 7 7 1,127 1,127 44,03561843,526DIMMIT 0 0 0 0 2930293DONLEY 11 11 1,358 1,358 19,34487318,859DUVAL 7 7 668 668 13,11994713,398EASTLAND 0 0 0 0 2320232ECTOR 0 0 0 0 * * 0EDWARDS 0 0 0 0 3660366ELLIS 0 0 0 0 9010901EL PASO 0 0 0 0 * * 0ERATH 0 0 0 0 1320132FALLS * 0 * 0 4030403FANNIN * * * * * 4732,317FAYETTE 0 0 0 0 8910891FISHER 19 17 2,093 1,951 29,5923,53731,178FLOYD 91 91 9,048 9,048 109,34810,974111,273FOARD 3 3 177 177 7,4562727,551FORT BEND 0 0 0 0 * * 0FRANKLIN 0 0 0 0 * * 0FREESTONE 0 0 0 0 * * 0FRIO 0 0 0 0 3,64003,640GAINES 106 106 4,016 4,016 168,6502,535167,169GALVESTON 0 0 0 0 * * 0GARZA 27 23 4,062 3,544 19,2893,93319,678GILLESPIE 0 0 0 0 1490149GLASSCOCK 7 7 861 861 4,6916974,527GOLIAD 0 0 0 0 3630363GONZALES 0 0 0 0 52052GRAY 16 16 1,697 1,697 26,7062,02127,030GRAYSON 5 4 655 371 1,2303991,258GREGG 0 0 0 0 * * 0GRIMES 0 0 0 0 * * 0GUADALUPE 0 0 0 0 * * 0HALE 137 135 19,999 19,443 115,43623,075119,068HALL 23 20 3,322 3,030 49,1242,57448,668HAMILTON 0 0 0 0 89089HANSFORD 10 7 1,230 1,029 17,3012,27318,544HARDEMAN 11 11 1,522 1,522 15,1151,32814,921HARDIN 0 0 0 0 * * 0HARRIS 0 0 0 0 * * 0HARRISON 0 0 0 0 * * 0HARTLEY 18 15 5,540 5,176 39,4422,48436,750HASKELL 11 8 1,122 791 18,6932,08519,987HAYS 0 0 0 0 17017
244
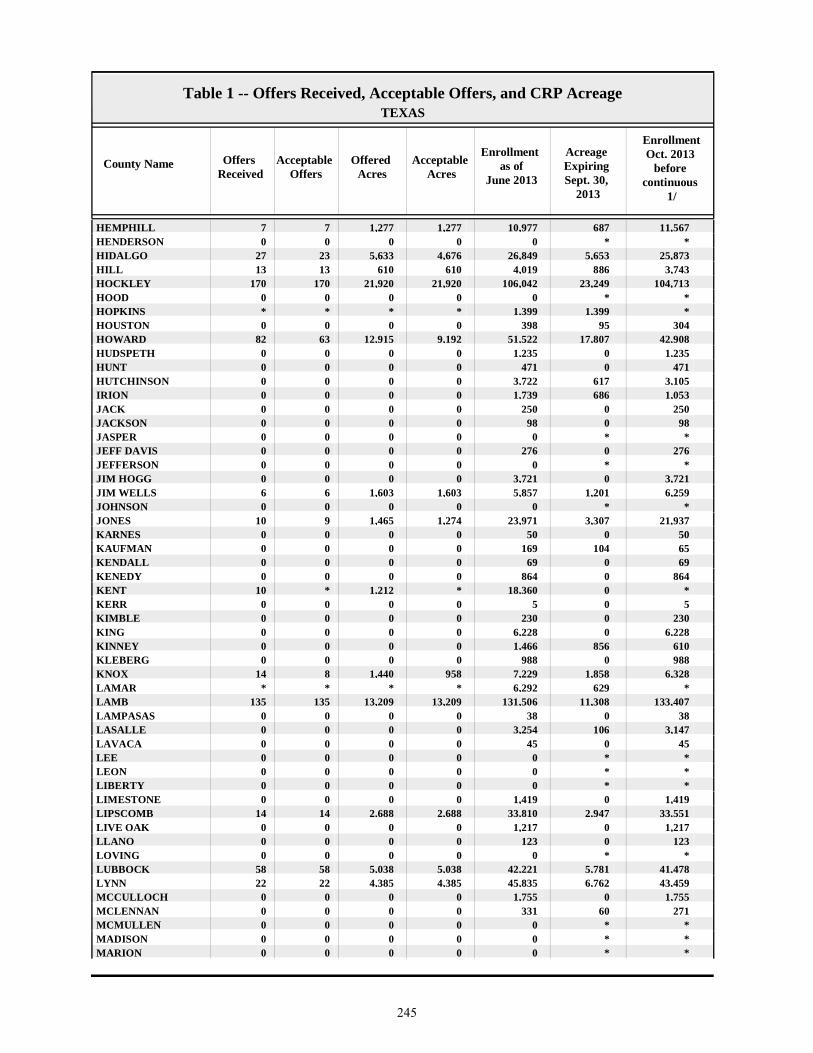
County Name Offers Received
Acceptable Offers
Offered Acres
Acceptable Acres
EnrollmentOct. 2013
before continuous
1/
Acreage Expiring Sept. 30,
2013
Enrollment as of
June 2013
Table 1 -- Offers Received, Acceptable Offers, and CRP AcreageTEXAS
HEMPHILL 7 7 1,277 1,277 11,56768710,977HENDERSON 0 0 0 0 * * 0HIDALGO 27 23 5,633 4,676 25,8735,65326,849HILL 13 13 610 610 3,7438864,019HOCKLEY 170 170 21,920 21,920 104,71323,249106,042HOOD 0 0 0 0 * * 0HOPKINS * * * * * 1,3991,399HOUSTON 0 0 0 0 30495398HOWARD 82 63 12,915 9,192 42,90817,80751,522HUDSPETH 0 0 0 0 1,23501,235HUNT 0 0 0 0 4710471HUTCHINSON 0 0 0 0 3,1056173,722IRION 0 0 0 0 1,0536861,739JACK 0 0 0 0 2500250JACKSON 0 0 0 0 98098JASPER 0 0 0 0 * * 0JEFF DAVIS 0 0 0 0 2760276JEFFERSON 0 0 0 0 * * 0JIM HOGG 0 0 0 0 3,72103,721JIM WELLS 6 6 1,603 1,603 6,2591,2015,857JOHNSON 0 0 0 0 * * 0JONES 10 9 1,465 1,274 21,9373,30723,971KARNES 0 0 0 0 50050KAUFMAN 0 0 0 0 65104169KENDALL 0 0 0 0 69069KENEDY 0 0 0 0 8640864KENT 10 * 1,212 * * 018,360KERR 0 0 0 0 505KIMBLE 0 0 0 0 2300230KING 0 0 0 0 6,22806,228KINNEY 0 0 0 0 6108561,466KLEBERG 0 0 0 0 9880988KNOX 14 8 1,440 958 6,3281,8587,229LAMAR * * * * * 6296,292LAMB 135 135 13,209 13,209 133,40711,308131,506LAMPASAS 0 0 0 0 38038LASALLE 0 0 0 0 3,1471063,254LAVACA 0 0 0 0 45045LEE 0 0 0 0 * * 0LEON 0 0 0 0 * * 0LIBERTY 0 0 0 0 * * 0LIMESTONE 0 0 0 0 1,41901,419LIPSCOMB 14 14 2,688 2,688 33,5512,94733,810LIVE OAK 0 0 0 0 1,21701,217LLANO 0 0 0 0 1230123LOVING 0 0 0 0 * * 0LUBBOCK 58 58 5,038 5,038 41,4785,78142,221LYNN 22 22 4,385 4,385 43,4596,76245,835MCCULLOCH 0 0 0 0 1,75501,755MCLENNAN 0 0 0 0 27160331MCMULLEN 0 0 0 0 * * 0MADISON 0 0 0 0 * * 0MARION 0 0 0 0 * * 0
245
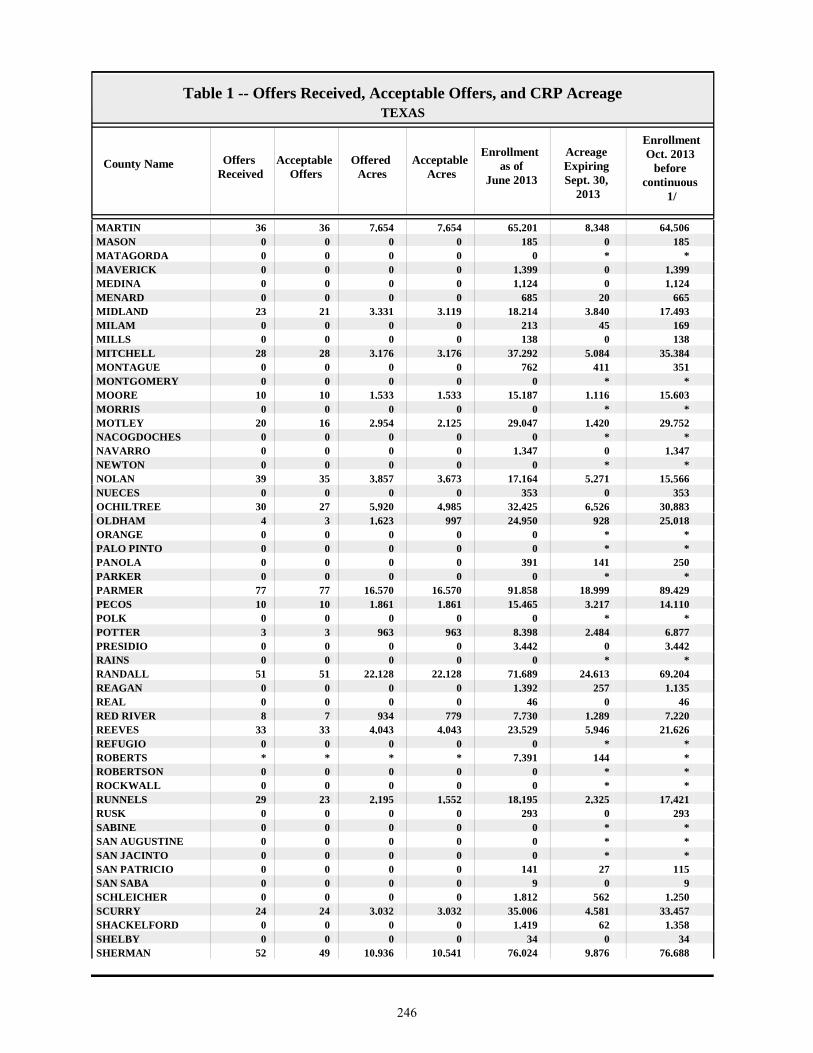
County Name Offers Received
Acceptable Offers
Offered Acres
Acceptable Acres
EnrollmentOct. 2013
before continuous
1/
Acreage Expiring Sept. 30,
2013
Enrollment as of
June 2013
Table 1 -- Offers Received, Acceptable Offers, and CRP AcreageTEXAS
MARTIN 36 36 7,654 7,654 64,5068,34865,201MASON 0 0 0 0 1850185MATAGORDA 0 0 0 0 * * 0MAVERICK 0 0 0 0 1,39901,399MEDINA 0 0 0 0 1,12401,124MENARD 0 0 0 0 66520685MIDLAND 23 21 3,331 3,119 17,4933,84018,214MILAM 0 0 0 0 16945213MILLS 0 0 0 0 1380138MITCHELL 28 28 3,176 3,176 35,3845,08437,292MONTAGUE 0 0 0 0 351411762MONTGOMERY 0 0 0 0 * * 0MOORE 10 10 1,533 1,533 15,6031,11615,187MORRIS 0 0 0 0 * * 0MOTLEY 20 16 2,954 2,125 29,7521,42029,047NACOGDOCHES 0 0 0 0 * * 0NAVARRO 0 0 0 0 1,34701,347NEWTON 0 0 0 0 * * 0NOLAN 39 35 3,857 3,673 15,5665,27117,164NUECES 0 0 0 0 3530353OCHILTREE 30 27 5,920 4,985 30,8836,52632,425OLDHAM 4 3 1,623 997 25,01892824,950ORANGE 0 0 0 0 * * 0PALO PINTO 0 0 0 0 * * 0PANOLA 0 0 0 0 250141391PARKER 0 0 0 0 * * 0PARMER 77 77 16,570 16,570 89,42918,99991,858PECOS 10 10 1,861 1,861 14,1103,21715,465POLK 0 0 0 0 * * 0POTTER 3 3 963 963 6,8772,4848,398PRESIDIO 0 0 0 0 3,44203,442RAINS 0 0 0 0 * * 0RANDALL 51 51 22,128 22,128 69,20424,61371,689REAGAN 0 0 0 0 1,1352571,392REAL 0 0 0 0 46046RED RIVER 8 7 934 779 7,2201,2897,730REEVES 33 33 4,043 4,043 21,6265,94623,529REFUGIO 0 0 0 0 * * 0ROBERTS * * * * * 1447,391ROBERTSON 0 0 0 0 * * 0ROCKWALL 0 0 0 0 * * 0RUNNELS 29 23 2,195 1,552 17,4212,32518,195RUSK 0 0 0 0 2930293SABINE 0 0 0 0 * * 0SAN AUGUSTINE 0 0 0 0 * * 0SAN JACINTO 0 0 0 0 * * 0SAN PATRICIO 0 0 0 0 11527141SAN SABA 0 0 0 0 909SCHLEICHER 0 0 0 0 1,2505621,812SCURRY 24 24 3,032 3,032 33,4574,58135,006SHACKELFORD 0 0 0 0 1,358621,419SHELBY 0 0 0 0 34034SHERMAN 52 49 10,936 10,541 76,6889,87676,024
246

County Name Offers Received
Acceptable Offers
Offered Acres
Acceptable Acres
EnrollmentOct. 2013
before continuous
1/
Acreage Expiring Sept. 30,
2013
Enrollment as of
June 2013
Table 1 -- Offers Received, Acceptable Offers, and CRP AcreageTEXAS
SMITH 0 0 0 0 64064SOMERVELL 0 0 0 0 * * 0STARR * * * * * 1,87629,116STEPHENS 0 0 0 0 2140214STERLING 0 0 0 0 * * 0STONEWALL 15 14 1,753 1,751 20,7252,16121,135SUTTON 0 0 0 0 172133304SWISHER 36 26 5,884 3,879 111,1963,315110,632TARRANT 0 0 0 0 * * 0TAYLOR 6 4 592 440 8,1591,3579,076TERRELL 0 0 0 0 3040304TERRY 76 76 7,223 7,223 102,7255,993101,496THROCKMORTON 0 0 0 0 77190860TITUS 0 0 0 0 * * 0TOM GREEN * * * * * 964,065TRAVIS 0 0 0 0 * * 0TRINITY * 0 * 0 6350635TYLER 0 0 0 0 * * 0UPSHUR 0 0 0 0 * * 0UPTON 0 0 0 0 4850485UVALDE * * * * * 1082,809VAL VERDE 0 0 0 0 8490849VAN ZANDT 0 0 0 0 * * 0VICTORIA 0 0 0 0 1920192WALKER 0 0 0 0 * * 0WALLER 0 0 0 0 * * 0WARD 0 0 0 0 1,3044251,728WASHINGTON 0 0 0 0 1200120WEBB 0 0 0 0 42042WHARTON 0 0 0 0 13013WHEELER 13 13 1,403 1,403 26,1211,56426,282WICHITA 0 0 0 0 69473WILBARGER 7 7 732 732 7,6553017,225WILLACY 5 0 426 0 7,6281,5039,132WILLIAMSON * * * * * 57938WILSON 0 0 0 0 * * 0WINKLER 0 0 0 0 * * 0WISE 0 0 0 0 * * 0WOOD 0 0 0 0 * * 0YOAKUM 16 16 1,214 1,214 65,56212064,468YOUNG 0 0 0 0 33730367ZAPATA 0 0 0 0 * * 0ZAVALA 0 0 0 0 2,27202,272
1 / Not including continuous signup enrollment between July and September 2013.
* Data withheld to avoid disclosure of individual operations.
247

County NameExpiring
Sept. 2013 (Acres)
New Lands (Acres) 1/
Average Rental
Payment ($/Acre)
Total Rental
Payment ($/year)
Average EBI Score
without Cost
Average EBI Score with Cost
Table 2 -- Description of Signup 45 Acceptable AcresTEXAS
STATE TOTALS 238,082 74,307 $33.28 $10,394,884 158 270ANDREWS 0 2,058 $32.04 $65,933 183 290ARMSTRONG 136 527 $29.32 $19,433 114 223BAILEY 157 1,677 $36.04 $66,103 251 356BAYLOR * * * * * * BORDEN * * * * * * BOSQUE * * * * * * BRISCOE 1,006 1,152 $28.51 $61,522 134 265CARSON 6,612 415 $36.56 $256,884 157 264CASTRO 7,871 271 $31.09 $253,106 151 264CHILDRESS 1,038 832 $37.10 $69,364 114 228COLEMAN 443 0 $19.25 $8,528 121 236COLLIN * * * * * * COLLINGSWORT 1,133 895 $35.24 $71,427 188 293CONCHO 1,066 140 $37.21 $44,872 155 262COTTLE 326 1,590 $32.41 $62,078 107 231CROSBY 7,143 687 $35.07 $274,583 132 252DALLAM 2,130 4,902 $26.47 $186,153 136 269DAWSON 16,706 167 $36.30 $612,409 183 289DEAF SMITH 17,283 2,470 $29.71 $586,819 160 271DELTA * * * * * * DICKENS 330 797 $35.71 $40,241 152 260DONLEY 1,074 284 $30.38 $41,255 227 337DUVAL 668 0 $29.91 $19,982 150 258FANNIN * * * * * * FISHER 1,951 0 $41.10 $80,185 126 241FLOYD 8,094 955 $32.45 $293,661 133 240FOARD 177 0 $32.75 $5,806 122 228GAINES 3,794 223 $41.32 $165,974 189 296GARZA 2,663 881 $34.76 $123,163 139 267GLASSCOCK 649 212 $38.70 $33,331 149 263GRAY 1,650 47 $30.48 $51,708 142 262GRAYSON 371 0 $42.04 $15,576 188 289HALE 18,325 1,118 $31.61 $614,526 124 231HALL 1,893 1,137 $39.16 $118,657 126 248HANSFORD 768 261 $26.14 $26,912 118 232HARDEMAN 1,118 404 $27.22 $41,419 131 242HARTLEY 1,531 3,645 $32.21 $166,739 140 247HASKELL 375 416 $22.63 $17,890 115 232HEMPHILL 1,277 0 $24.11 $30,783 149 269HIDALGO 3,341 1,336 $45.38 $212,196 164 269HILL 610 0 $37.81 $23,064 198 326HOCKLEY 842 21,079 $34.68 $760,224 224 330HOPKINS * * * * * * HOWARD 9,132 60 $39.78 $365,680 133 246JIM WELLS 1,603 0 $35.12 $56,302 133 239JONES 1,125 149 $24.85 $31,655 107 235KENT * * * * * * KNOX 844 114 $31.82 $30,471 108 222LAMAR * * * * * * LAMB 8,623 4,585 $37.84 $499,805 199 304LIPSCOMB 2,329 360 $26.70 $71,792 136 253LUBBOCK 4,085 953 $33.44 $168,477 149 258LYNN 4,098 288 $37.28 $163,498 148 258MARTIN 7,068 586 $38.90 $297,704 154 267
248

County NameExpiring
Sept. 2013 (Acres)
New Lands (Acres) 1/
Average Rental
Payment ($/Acre)
Total Rental
Payment ($/year)
Average EBI Score
without Cost
Average EBI Score with Cost
Table 2 -- Description of Signup 45 Acceptable AcresTEXAS
MIDLAND 2,439 680 $36.51 $113,851 164 276MITCHELL 3,078 99 $33.53 $106,494 125 241MOORE 868 664 $32.38 $49,617 103 230MOTLEY 1,032 1,093 $35.60 $75,647 141 259NOLAN 3,323 350 $37.16 $136,478 141 269OCHILTREE 4,121 864 $31.94 $159,186 159 269OLDHAM 431 566 $25.82 $25,727 168 301PARMER 15,955 615 $34.65 $574,092 155 260PECOS 1,861 0 $29.52 $54,946 170 278POTTER 963 0 $30.97 $29,820 123 230RANDALL 18,839 3,290 $28.15 $622,884 158 271RED RIVER 779 0 $52.64 $41,001 104 224REEVES 3,964 79 $37.01 $149,609 154 259ROBERTS * * * * * * RUNNELS 1,454 98 $29.98 $46,512 132 245SCURRY 3,032 0 $33.79 $102,429 108 236SHERMAN 8,799 1,741 $27.69 $291,837 138 263STARR * * * * * * STONEWALL 1,271 479 $20.80 $36,412 131 257SWISHER 2,019 1,860 $27.22 $105,566 129 254TAYLOR 440 0 $24.67 $10,862 95 222TERRY 5,389 1,834 $33.43 $241,433 219 325TOM GREEN * * * * * * UVALDE * * * * * * WHEELER 1,201 202 $30.93 $43,387 203 311WILBARGER 258 474 $27.48 $20,124 154 264WILLIAMSON * * * * * * YOAKUM 260 954 $38.20 $46,376 236 340
* Data withheld to avoid disclosure of individual operations.
1/ Includes land that may have been in CRP in the past.
249
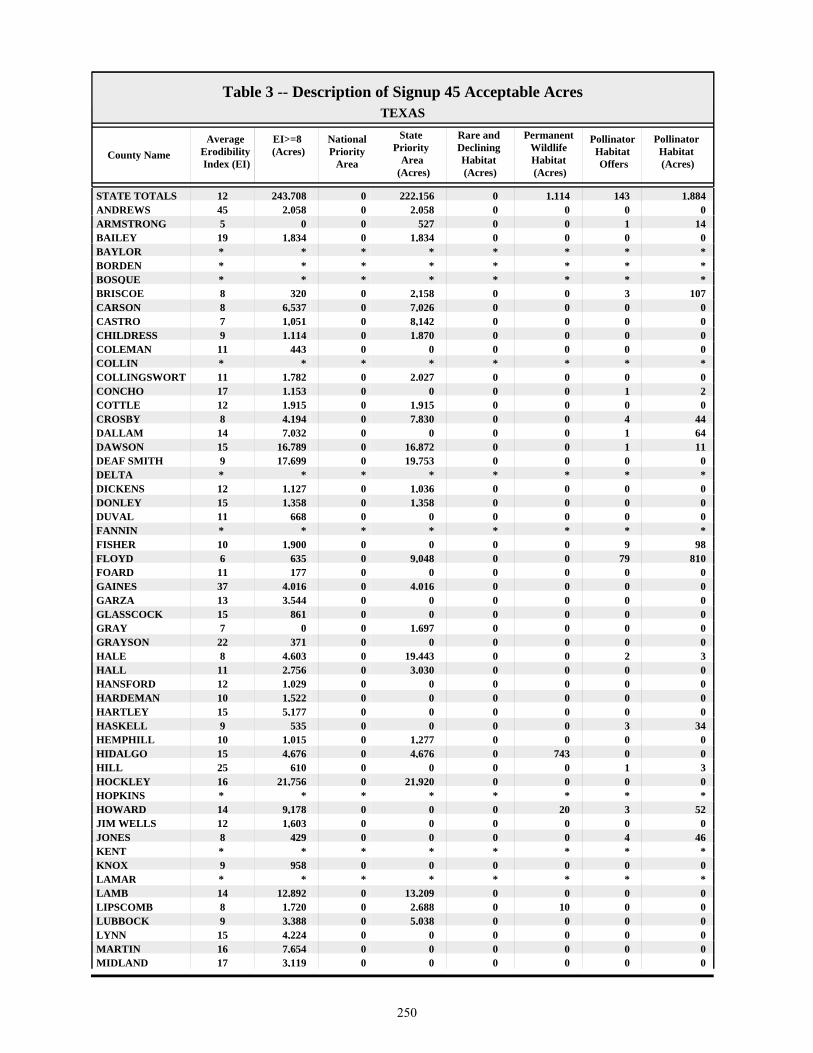
County Name
EI>=8 (Acres)
National Priority
Area
State Priority
Area (Acres)
Rare and Declining Habitat (Acres)
Permanent Wildlife Habitat (Acres)
Pollinator Habitat Offers
Table 3 -- Description of Signup 45 Acceptable AcresTEXAS
Average Erodibility Index (EI)
Pollinator Habitat (Acres)
STATE TOTALS 243,708 0 222,156 0 1,114 14312 1,884ANDREWS 2,058 0 2,058 0 0 045 0ARMSTRONG 0 0 527 0 0 15 14BAILEY 1,834 0 1,834 0 0 019 0BAYLOR * * * * * * * * BORDEN * * * * * * * * BOSQUE * * * * * * * * BRISCOE 320 0 2,158 0 0 38 107CARSON 6,537 0 7,026 0 0 08 0CASTRO 1,051 0 8,142 0 0 07 0CHILDRESS 1,114 0 1,870 0 0 09 0COLEMAN 443 0 0 0 0 011 0COLLIN * * * * * * * * COLLINGSWORT 1,782 0 2,027 0 0 011 0CONCHO 1,153 0 0 0 0 117 2COTTLE 1,915 0 1,915 0 0 012 0CROSBY 4,194 0 7,830 0 0 48 44DALLAM 7,032 0 0 0 0 114 64DAWSON 16,789 0 16,872 0 0 115 11DEAF SMITH 17,699 0 19,753 0 0 09 0DELTA * * * * * * * * DICKENS 1,127 0 1,036 0 0 012 0DONLEY 1,358 0 1,358 0 0 015 0DUVAL 668 0 0 0 0 011 0FANNIN * * * * * * * * FISHER 1,900 0 0 0 0 910 98FLOYD 635 0 9,048 0 0 796 810FOARD 177 0 0 0 0 011 0GAINES 4,016 0 4,016 0 0 037 0GARZA 3,544 0 0 0 0 013 0GLASSCOCK 861 0 0 0 0 015 0GRAY 0 0 1,697 0 0 07 0GRAYSON 371 0 0 0 0 022 0HALE 4,603 0 19,443 0 0 28 3HALL 2,756 0 3,030 0 0 011 0HANSFORD 1,029 0 0 0 0 012 0HARDEMAN 1,522 0 0 0 0 010 0HARTLEY 5,177 0 0 0 0 015 0HASKELL 535 0 0 0 0 39 34HEMPHILL 1,015 0 1,277 0 0 010 0HIDALGO 4,676 0 4,676 0 743 015 0HILL 610 0 0 0 0 125 3HOCKLEY 21,756 0 21,920 0 0 016 0HOPKINS * * * * * * * * HOWARD 9,178 0 0 0 20 314 52JIM WELLS 1,603 0 0 0 0 012 0JONES 429 0 0 0 0 48 46KENT * * * * * * * * KNOX 958 0 0 0 0 09 0LAMAR * * * * * * * * LAMB 12,892 0 13,209 0 0 014 0LIPSCOMB 1,720 0 2,688 0 10 08 0LUBBOCK 3,388 0 5,038 0 0 09 0LYNN 4,224 0 0 0 0 015 0MARTIN 7,654 0 0 0 0 016 0MIDLAND 3,119 0 0 0 0 017 0
250

County Name
EI>=8 (Acres)
National Priority
Area
State Priority
Area (Acres)
Rare and Declining Habitat (Acres)
Permanent Wildlife Habitat (Acres)
Pollinator Habitat Offers
Table 3 -- Description of Signup 45 Acceptable AcresTEXAS
Average Erodibility Index (EI)
Pollinator Habitat (Acres)
MITCHELL 3,176 0 0 0 0 1210 148MOORE 1,485 0 0 0 0 09 0MOTLEY 2,125 0 2,125 0 0 011 0NOLAN 3,448 0 0 0 0 014 0OCHILTREE 4,425 0 4,985 0 0 011 0OLDHAM 997 0 997 0 0 29 54PARMER 2,111 0 16,570 0 0 07 0PECOS 1,861 0 0 0 0 019 0POTTER 234 0 963 0 0 08 0RANDALL 20,814 0 22,128 0 0 38 86RED RIVER 779 0 0 0 0 010 0REEVES 4,043 0 0 0 0 023 0ROBERTS * * * * * * * * RUNNELS 1,439 0 0 0 0 415 138SCURRY 2,478 0 0 0 0 29 17SHERMAN 10,541 0 0 0 0 414 76STARR * * * * * * * * STONEWALL 1,654 0 0 0 0 111 18SWISHER 769 0 3,879 0 0 28 53TAYLOR 304 0 0 0 0 17 5TERRY 7,223 0 7,223 0 2 018 0TOM GREEN * * * * * * * * UVALDE * * * * * * * * WHEELER 1,403 0 1,403 0 339 015 0WILBARGER 732 0 0 0 0 015 0WILLIAMSON * * * * * * * * YOAKUM 1,214 0 1,214 0 0 031 0
* Data withheld to avoid disclosure of individual operations.Note: Acceptable acres may be listed in multiple categories.
251
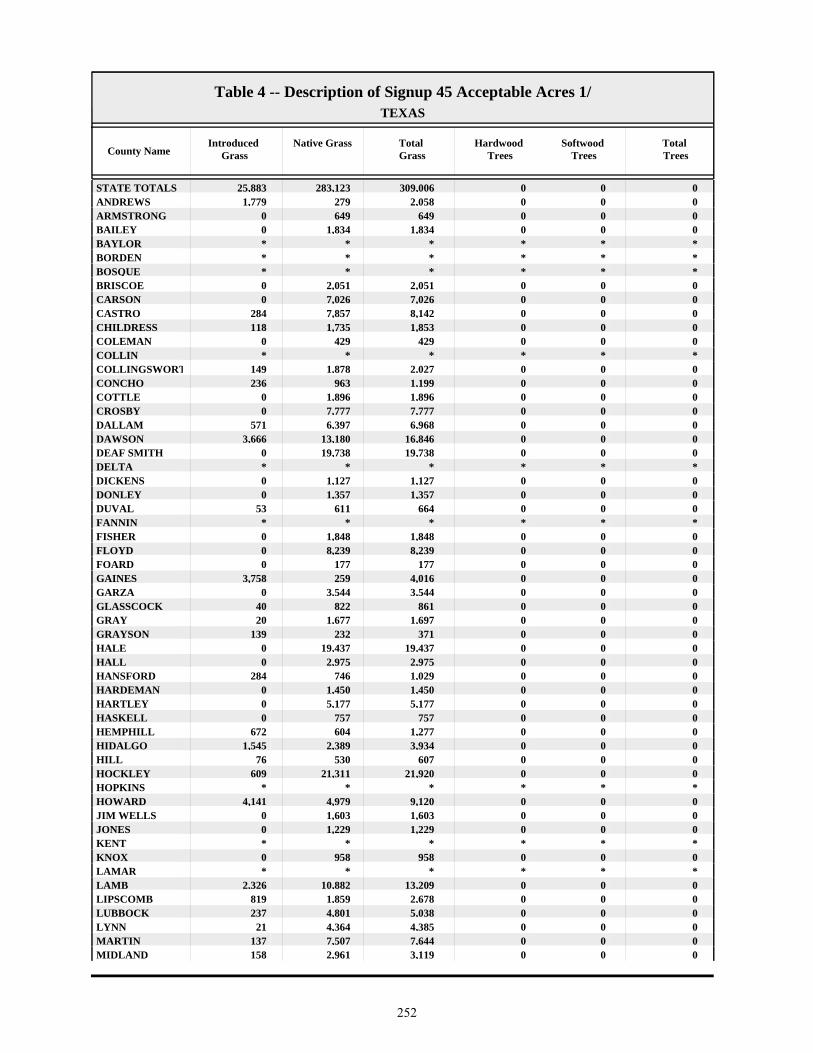
County NameIntroduced
GrassNative Grass Total
GrassHardwood
TreesSoftwood
TreesTotal Trees
Table 4 -- Description of Signup 45 Acceptable Acres 1/TEXAS
STATE TOTALS 25,883 283,123 309,006 0 0 0ANDREWS 1,779 279 2,058 0 0 0ARMSTRONG 0 649 649 0 0 0BAILEY 0 1,834 1,834 0 0 0BAYLOR * * * * * * BORDEN * * * * * * BOSQUE * * * * * * BRISCOE 0 2,051 2,051 0 0 0CARSON 0 7,026 7,026 0 0 0CASTRO 284 7,857 8,142 0 0 0CHILDRESS 118 1,735 1,853 0 0 0COLEMAN 0 429 429 0 0 0COLLIN * * * * * * COLLINGSWORT 149 1,878 2,027 0 0 0CONCHO 236 963 1,199 0 0 0COTTLE 0 1,896 1,896 0 0 0CROSBY 0 7,777 7,777 0 0 0DALLAM 571 6,397 6,968 0 0 0DAWSON 3,666 13,180 16,846 0 0 0DEAF SMITH 0 19,738 19,738 0 0 0DELTA * * * * * * DICKENS 0 1,127 1,127 0 0 0DONLEY 0 1,357 1,357 0 0 0DUVAL 53 611 664 0 0 0FANNIN * * * * * * FISHER 0 1,848 1,848 0 0 0FLOYD 0 8,239 8,239 0 0 0FOARD 0 177 177 0 0 0GAINES 3,758 259 4,016 0 0 0GARZA 0 3,544 3,544 0 0 0GLASSCOCK 40 822 861 0 0 0GRAY 20 1,677 1,697 0 0 0GRAYSON 139 232 371 0 0 0HALE 0 19,437 19,437 0 0 0HALL 0 2,975 2,975 0 0 0HANSFORD 284 746 1,029 0 0 0HARDEMAN 0 1,450 1,450 0 0 0HARTLEY 0 5,177 5,177 0 0 0HASKELL 0 757 757 0 0 0HEMPHILL 672 604 1,277 0 0 0HIDALGO 1,545 2,389 3,934 0 0 0HILL 76 530 607 0 0 0HOCKLEY 609 21,311 21,920 0 0 0HOPKINS * * * * * * HOWARD 4,141 4,979 9,120 0 0 0JIM WELLS 0 1,603 1,603 0 0 0JONES 0 1,229 1,229 0 0 0KENT * * * * * * KNOX 0 958 958 0 0 0LAMAR * * * * * * LAMB 2,326 10,882 13,209 0 0 0LIPSCOMB 819 1,859 2,678 0 0 0LUBBOCK 237 4,801 5,038 0 0 0LYNN 21 4,364 4,385 0 0 0MARTIN 137 7,507 7,644 0 0 0MIDLAND 158 2,961 3,119 0 0 0
252

County NameIntroduced
GrassNative Grass Total
GrassHardwood
TreesSoftwood
TreesTotal Trees
Table 4 -- Description of Signup 45 Acceptable Acres 1/TEXAS
MITCHELL 0 3,018 3,018 0 0 0MOORE 0 1,533 1,533 0 0 0MOTLEY 67 2,033 2,100 0 0 0NOLAN 0 3,622 3,622 0 0 0OCHILTREE 899 4,086 4,985 0 0 0OLDHAM 0 943 943 0 0 0PARMER 0 16,570 16,570 0 0 0PECOS 0 1,861 1,861 0 0 0POTTER 0 963 963 0 0 0RANDALL 0 22,042 22,042 0 0 0RED RIVER 0 779 779 0 0 0REEVES 0 4,043 4,043 0 0 0ROBERTS * * * * * * RUNNELS 105 1,298 1,403 0 0 0SCURRY 0 3,006 3,006 0 0 0SHERMAN 223 10,242 10,464 0 0 0STARR * * * * * * STONEWALL 0 1,715 1,715 0 0 0SWISHER 0 3,820 3,820 0 0 0TAYLOR 35 389 423 0 0 0TERRY 1,922 5,299 7,221 0 0 0TOM GREEN * * * * * * UVALDE * * * * * * WHEELER 350 714 1,063 0 0 0WILBARGER 0 732 732 0 0 0WILLIAMSON * * * * * * YOAKUM 68 1,146 1,214 0 0 0
* Data withheld to avoid disclosure of individual operations.1/ Not including practices: permanent wildlife habitat, wildlife food plots, rare and declining habitat, and pollinator habitat.
253
UTAH
254

County Name Offers Received
Acceptable Offers
Offered Acres
Acceptable Acres
EnrollmentOct. 2013
before continuous
1/
Acreage Expiring Sept. 30,
2013
Enrollment as of
June 2013
Table 1 -- Offers Received, Acceptable Offers, and CRP AcreageUTAH
STATE TOTALS 48 46 6,754 6,332 178,5144,986177,168BEAVER 0 0 0 0 * * 0BOX ELDER 6 5 1,344 938 71,02614870,236CACHE 30 29 1,251 1,235 11,6621,51311,940CARBON 0 0 0 0 * * 0DAGGETT 0 0 0 0 * * 0DAVIS 0 0 0 0 * * 0DUCHESNE 0 0 0 0 * * 0EMERY 0 0 0 0 * * 0GARFIELD 0 0 0 0 * * 0GRAND 0 0 0 0 * * 0IRON 0 0 0 0 * * 0JUAB 3 3 201 201 17,08412917,013KANE 0 0 0 0 * * 0MILLARD 3 3 79 79 10,36112110,403MORGAN 0 0 0 0 1020102PIUTE 0 0 0 0 * * 0RICH * * * * * 1,43114,586SALT LAKE 0 0 0 0 * * 0SAN JUAN 0 0 0 0 34,171034,171SANPETE 0 0 0 0 * * 0SEVIER 0 0 0 0 * * 0SUMMIT 0 0 0 0 27027TOOELE 0 0 0 0 2090209UINTAH * * * * * 1,5631,899UTAH 3 3 804 804 16,692015,889WASATCH 0 0 0 0 * * 0WASHINGTON * * * * * 82694WAYNE 0 0 0 0 * * 0WEBER 0 0 0 0 * * 0
1 / Not including continuous signup enrollment between July and September 2013.
* Data withheld to avoid disclosure of individual operations.
255

County NameExpiring
Sept. 2013 (Acres)
New Lands (Acres) 1/
Average Rental
Payment ($/Acre)
Total Rental
Payment ($/year)
Average EBI Score
without Cost
Average EBI Score with Cost
Table 2 -- Description of Signup 45 Acceptable AcresUTAH
STATE TOTALS 4,522 1,810 $34.95 $221,339 161 267BOX ELDER 108 831 $40.81 $38,285 188 290CACHE 1,159 76 $43.31 $53,504 168 274JUAB 129 72 $27.83 $5,593 115 232MILLARD 52 27 $33.74 $2,665 154 259RICH * * * * * * UINTAH * * * * * * UTAH 0 804 $37.62 $30,246 156 260WASHINGTON * * * * * *
* Data withheld to avoid disclosure of individual operations.
1/ Includes land that may have been in CRP in the past.
256

County Name
EI>=8 (Acres)
National Priority
Area
State Priority
Area (Acres)
Rare and Declining Habitat (Acres)
Permanent Wildlife Habitat (Acres)
Pollinator Habitat Offers
Table 3 -- Description of Signup 45 Acceptable AcresUTAH
Average Erodibility Index (EI)
Pollinator Habitat (Acres)
STATE TOTALS 3,607 0 6,332 0 1,444 011 0BOX ELDER 360 0 938 0 0 010 0CACHE 1,222 0 1,235 0 13 020 0JUAB 75 0 201 0 0 07 0MILLARD 79 0 79 0 0 019 0RICH * * * * * * * * UINTAH * * * * * * * * UTAH 227 0 804 0 0 08 0WASHINGTON * * * * * * * *
* Data withheld to avoid disclosure of individual operations.Note: Acceptable acres may be listed in multiple categories.
257

County NameIntroduced
GrassNative Grass Total
GrassHardwood
TreesSoftwood
TreesTotal Trees
Table 4 -- Description of Signup 45 Acceptable Acres 1/UTAH
STATE TOTALS 4,834 54 4,889 0 0 0BOX ELDER 938 0 938 0 0 0CACHE 1,222 0 1,222 0 0 0JUAB 147 54 201 0 0 0MILLARD 79 0 79 0 0 0RICH * * * * * * UINTAH * * * * * * UTAH 804 0 804 0 0 0WASHINGTON * * * * * *
* Data withheld to avoid disclosure of individual operations.1/ Not including practices: permanent wildlife habitat, wildlife food plots, rare and declining habitat, and pollinator habitat.
258

VERMONT
259

County Name Offers Received
Acceptable Offers
Offered Acres
Acceptable Acres
EnrollmentOct. 2013
before continuous
1/
Acreage Expiring Sept. 30,
2013
Enrollment as of
June 2013
Table 1 -- Offers Received, Acceptable Offers, and CRP AcreageVERMONT
STATE TOTALS 0 0 0 0 2,83302,833ADDISON 0 0 0 0 1,17101,171BENNINGTON 0 0 0 0 54054CALEDONIA 0 0 0 0 31031CHITTENDEN 0 0 0 0 97097ESSEX 0 0 0 0 56056FRANKLIN 0 0 0 0 5360536GRAND ISLE 0 0 0 0 * * 0LAMOILLE 0 0 0 0 78078ORANGE 0 0 0 0 97097ORLEANS 0 0 0 0 1600160RUTLAND 0 0 0 0 4910491WASHINGTON 0 0 0 0 17017WINDHAM 0 0 0 0 40040WINDSOR 0 0 0 0 303
1 / Not including continuous signup enrollment between July and September 2013.
* Data withheld to avoid disclosure of individual operations.
260
VIR
GIN
A
261

County Name Offers Received
Acceptable Offers
Offered Acres
Acceptable Acres
EnrollmentOct. 2013
before continuous
1/
Acreage Expiring Sept. 30,
2013
Enrollment as of
June 2013
Table 1 -- Offers Received, Acceptable Offers, and CRP AcreageVIRGINIA
STATE TOTALS 130 115 2,509 2,319 56,6114,63958,931ACCOMACK 0 0 0 0 90132933ALBEMARLE 0 0 0 0 68531717ALLEGHANY 0 0 0 0 422163AMELIA 8 6 134 102 3,6243203,842AMHERST 0 0 0 0 1700170APPOMATTOX 0 0 0 0 34114355ARLINGTON 0 0 0 0 * * 0AUGUSTA 0 0 0 0 2,6452102,855BATH 0 0 0 0 40259460BEDFORD 0 0 0 0 1,08001,080BLAND 0 0 0 0 1060106BOTETOURT 0 0 0 0 2247231BRUNSWICK 15 14 136 133 2,6512872,805BUCHANAN 0 0 0 0 000BUCKINGHAM * * * * * 89626CAMPBELL 8 8 162 162 1,4594841,781CAROLINE 3 3 53 53 299101347CARROLL 0 0 0 0 3900390CHARLES CITY 0 0 0 0 611576CHARLOTTE 8 8 142 142 512195566CHESTERFIELD * * * * * 3775CLARKE 0 0 0 0 1680168CRAIG 0 0 0 0 1320132CULPEPER 0 0 0 0 9358943CUMBERLAND 0 0 0 0 44724471DICKENSON 0 0 0 0 202DINWIDDIE 12 12 300 300 2,1104122,222ESSEX * * * * * 37854FAIRFAX 0 0 0 0 * * 0FAUQUIER 0 0 0 0 9890989FLOYD 0 0 0 0 26026FLUVANNA 0 0 0 0 2174221FRANKLIN 0 0 0 0 83488FREDERICK * * * * * 8133GILES 0 0 0 0 15015GLOUCESTER 0 0 0 0 281442GOOCHLAND 0 0 0 0 1270127GRAYSON 0 0 0 0 3139323GREENE 0 0 0 0 3061307GREENSVILLE 14 7 153 65 2,2641242,323HALIFAX 10 8 141 98 3,6391513,692HANOVER 0 0 0 0 29613309HENRICO 0 0 0 0 * * 0HENRY 0 0 0 0 15015HIGHLAND 0 0 0 0 58535620ISLE OF WIGHT * * * * * 6294JAMES CITY 0 0 0 0 59059KING AND QUEEN 4 4 114 114 811182879KING GEORGE 4 4 123 123 941148966KING WILLIAM * * * * * 086LANCASTER 0 0 0 0 1440144LEE 0 0 0 0 1254130
262

County Name Offers Received
Acceptable Offers
Offered Acres
Acceptable Acres
EnrollmentOct. 2013
before continuous
1/
Acreage Expiring Sept. 30,
2013
Enrollment as of
June 2013
Table 1 -- Offers Received, Acceptable Offers, and CRP AcreageVIRGINIA
LOUDOUN 0 0 0 0 13124155LOUISA 0 0 0 0 6650665LUNENBURG 4 4 142 142 704163725MADISON 0 0 0 0 82810839MATHEWS 0 0 0 0 18826MECKLENBURG 5 5 191 191 1,1411911,141MIDDLESEX 0 0 0 0 79113191MONTGOMERY 0 0 0 0 84084NELSON 0 0 0 0 29811309NEW KENT 0 0 0 0 39039NORTHAMPTON 0 0 0 0 17521196NORTHUMBERLAND 0 0 0 0 11813131NOTTOWAY 0 0 0 0 89054944ORANGE 0 0 0 0 450208658PAGE 0 0 0 0 3171318PATRICK 0 0 0 0 1420142PITTSYLVANIA 9 8 223 216 1,7182491,751POWHATAN * * * * * 48433PRINCE EDWARD 4 4 96 96 2,479962,479PRINCE GEORGE * * * * * 66865PRINCE WILLIAM 0 0 0 0 3380338PULASKI 0 0 0 0 25025RAPPAHANNOCK 0 0 0 0 7590759RICHMOND 0 0 0 0 1770177ROANOKE 0 0 0 0 202ROCKBRIDGE * * * * * 21566ROCKINGHAM 0 0 0 0 1,241291,270RUSSELL 0 0 0 0 9542956SCOTT 0 0 0 0 1176123SHENANDOAH 0 0 0 0 40010410SMYTH 0 0 0 0 5760576SOUTHAMPTON 5 3 48 31 3,077603,106SPOTSYLVANIA 0 0 0 0 35525380STAFFORD * * * * * 46254SURRY 0 0 0 0 82082SUSSEX 3 3 17 17 63717636TAZEWELL 0 0 0 0 6161617WARREN 0 0 0 0 29029WASHINGTON 0 0 0 0 78012792WESTMORELAND * * * * * 31436WISE 0 0 0 0 * * 0WYTHE 0 0 0 0 2543257YORK 0 0 0 0 * * 0ALEXANDRIA 0 0 0 0 * * 0BEDFORD 0 0 0 0 * * 0BRISTOL 0 0 0 0 * * 0BUENA VISTA 0 0 0 0 * * 0CHARLOTTESVILLE 0 0 0 0 * * 0CHESAPEAKE * * * * * 18591CLIFTON FORGE 0 0 0 0 * * 0COLONIAL HEIGHTS 0 0 0 0 * * 0COVINGTON 0 0 0 0 * * 0DANVILLE 0 0 0 0 * * 0
263

County Name Offers Received
Acceptable Offers
Offered Acres
Acceptable Acres
EnrollmentOct. 2013
before continuous
1/
Acreage Expiring Sept. 30,
2013
Enrollment as of
June 2013
Table 1 -- Offers Received, Acceptable Offers, and CRP AcreageVIRGINIA
EMPORIA 0 0 0 0 * * 0FAIRFAX 0 0 0 0 * * 0FALLS CHURCH 0 0 0 0 * * 0FRANKLIN 0 0 0 0 * * 0FREDERICKSBURG 0 0 0 0 * * 0GALAX 0 0 0 0 * * 0HAMPTON 0 0 0 0 * * 0HARRISONBURG 0 0 0 0 * * 0HOPEWELL 0 0 0 0 * * 0LEXINGTON 0 0 0 0 * * 0LYNCHBURG 0 0 0 0 * * 0MANASSAS 0 0 0 0 * * 0MANASSAS PARK 0 0 0 0 * * 0MARTINSVILLE 0 0 0 0 * * 0NEWPORT NEWS 0 0 0 0 * * 0NORFOLK 0 0 0 0 * * 0NORTON 0 0 0 0 * * 0PETERSBURG 0 0 0 0 * * 0POQUOSON 0 0 0 0 * * 0PORTSMOUTH 0 0 0 0 * * 0RADFORD 0 0 0 0 * * 0RICHMOND 0 0 0 0 * * 0ROANOKE 0 0 0 0 * * 0SALEM 0 0 0 0 * * 0SOUTH BOSTON 0 0 0 0 * * 0STAUNTON 0 0 0 0 * * 0SUFFOLK 0 0 0 0 3440344VIRGINIA BEACH 0 0 0 0 53053WAYNESBORO 0 0 0 0 * * 0WILLIAMSBURG 0 0 0 0 * * 0WINCHESTER 0 0 0 0 * * 0
1 / Not including continuous signup enrollment between July and September 2013.
* Data withheld to avoid disclosure of individual operations.
264

County NameExpiring
Sept. 2013 (Acres)
New Lands (Acres) 1/
Average Rental
Payment ($/Acre)
Total Rental
Payment ($/year)
Average EBI Score
without Cost
Average EBI Score with Cost
Table 2 -- Description of Signup 45 Acceptable AcresVIRGINIA
STATE TOTALS 2,160 158 $39.61 $91,841 172 278AMELIA 102 0 $31.57 $3,208 187 294BRUNSWICK 129 4 $57.60 $7,650 149 249BUCKINGHAM * * * * * * CAMPBELL 138 25 $22.59 $3,665 185 297CAROLINE 53 0 $51.02 $2,714 142 260CHARLOTTE 142 0 $29.89 $4,236 178 287CHESTERFIELD * * * * * * DINWIDDIE 266 34 $44.87 $13,461 167 268ESSEX * * * * * * FREDERICK * * * * * * GREENSVILLE 46 19 $76.48 $4,971 167 248HALIFAX 95 3 $24.68 $2,416 167 278ISLE OF WIGHT * * * * * * KING AND QUEE 109 5 $50.71 $5,781 100 221KING GEORGE 123 0 $58.04 $7,133 187 279KING WILLIAM * * * * * * LUNENBURG 142 0 $27.00 $3,837 204 314MECKLENBURG 191 0 $30.10 $5,749 212 320PITTSYLVANIA 211 5 $26.65 $5,752 135 245POWHATAN * * * * * * PRINCE EDWARD 96 0 $30.69 $2,946 174 282PRINCE GEORGE * * * * * * ROCKBRIDGE * * * * * * SOUTHAMPTON 22 9 $70.17 $2,182 148 233STAFFORD * * * * * * SUSSEX 6 11 $53.82 $920 115 234WESTMORELAN * * * * * * CHESAPEAKE * * * * * *
* Data withheld to avoid disclosure of individual operations.
1/ Includes land that may have been in CRP in the past.
265

County Name
EI>=8 (Acres)
National Priority
Area
State Priority
Area (Acres)
Rare and Declining Habitat (Acres)
Permanent Wildlife Habitat (Acres)
Pollinator Habitat Offers
Table 3 -- Description of Signup 45 Acceptable AcresVIRGINIA
Average Erodibility Index (EI)
Pollinator Habitat (Acres)
STATE TOTALS 2,133 1,467 736 0 59 718 42AMELIA 102 102 0 0 0 021 0BRUNSWICK 130 133 0 0 0 09 0BUCKINGHAM * * * * * * * * CAMPBELL 151 162 0 0 0 055 0CAROLINE 53 53 0 0 0 012 0CHARLOTTE 142 0 142 0 0 020 0CHESTERFIELD * * * * * * * * DINWIDDIE 278 300 0 0 3 014 0ESSEX * * * * * * * * FREDERICK * * * * * * * * GREENSVILLE 65 19 19 0 0 020 0HALIFAX 98 0 98 0 12 017 0ISLE OF WIGHT * * * * * * * * KING AND QUEE 114 114 0 0 0 09 0KING GEORGE 76 123 0 0 5 49 13KING WILLIAM * * * * * * * * LUNENBURG 142 0 142 0 0 018 0MECKLENBURG 191 0 191 0 0 019 0PITTSYLVANIA 216 0 0 0 12 013 0POWHATAN * * * * * * * * PRINCE EDWARD 96 96 96 0 28 017 0PRINCE GEORGE * * * * * * * * ROCKBRIDGE * * * * * * * * SOUTHAMPTON 25 31 31 0 0 010 0STAFFORD * * * * * * * * SUSSEX 9 0 17 0 0 07 0WESTMORELAN * * * * * * * * CHESAPEAKE * * * * * * * *
* Data withheld to avoid disclosure of individual operations.Note: Acceptable acres may be listed in multiple categories.
266

County NameIntroduced
GrassNative Grass Total
GrassHardwood
TreesSoftwood
TreesTotal Trees
Table 4 -- Description of Signup 45 Acceptable Acres 1/VIRGINIA
STATE TOTALS 675 134 809 6 1,396 1,402AMELIA 67 0 67 0 34 34BRUNSWICK 34 0 34 0 99 99BUCKINGHAM * * * * * * CAMPBELL 117 0 117 0 45 45CAROLINE 11 0 11 0 42 42CHARLOTTE 22 45 67 0 68 68CHESTERFIELD * * * * * * DINWIDDIE 86 61 146 0 151 151ESSEX * * * * * * FREDERICK * * * * * * GREENSVILLE 0 0 0 0 65 65HALIFAX 5 0 5 0 82 82ISLE OF WIGHT * * * * * * KING AND QUEE 75 0 75 0 39 39KING GEORGE 106 0 106 0 0 0KING WILLIAM * * * * * * LUNENBURG 5 0 5 0 137 137MECKLENBURG 0 0 0 0 191 191PITTSYLVANIA 0 0 0 0 204 204POWHATAN * * * * * * PRINCE EDWARD 5 0 5 0 64 64PRINCE GEORGE * * * * * * ROCKBRIDGE * * * * * * SOUTHAMPTON 0 9 9 6 16 22STAFFORD * * * * * * SUSSEX 11 0 11 0 6 6WESTMORELAN * * * * * * CHESAPEAKE * * * * * *
* Data withheld to avoid disclosure of individual operations.1/ Not including practices: permanent wildlife habitat, wildlife food plots, rare and declining habitat, and pollinator habitat.
267

WA
SH
ING
TO
N
268

County Name Offers Received
Acceptable Offers
Offered Acres
Acceptable Acres
EnrollmentOct. 2013
before continuous
1/
Acreage Expiring Sept. 30,
2013
Enrollment as of
June 2013
Table 1 -- Offers Received, Acceptable Offers, and CRP AcreageWASHINGTON
STATE TOTALS 1,349 1,322 201,399 198,149 1,402,423253,4871,457,761ADAMS 206 205 36,124 35,881 198,84442,400205,363ASOTIN 3 3 137 137 21,86523021,958BENTON 116 113 21,352 21,090 108,07725,008111,995CHELAN * * * * * 391509CLALLAM 0 0 0 0 1010101CLARK 0 0 0 0 1320132COLUMBIA 46 45 8,307 8,194 42,95213,46848,226COWLITZ 0 0 0 0 15015DOUGLAS 178 177 26,823 26,807 182,03627,947183,176FERRY 5 5 293 293 60625339FRANKLIN 96 96 18,798 18,798 102,62920,943104,775GARFIELD 81 81 8,020 8,020 42,91713,20248,100GRANT 75 73 8,635 8,473 75,63310,00177,161GRAYS HARBOR 0 0 0 0 1360136ISLAND 0 0 0 0 303JEFFERSON 0 0 0 0 1529161KING 0 0 0 0 56056KITSAP 0 0 0 0 19019KITTITAS 3 3 367 367 3,9523693,954KLICKITAT 35 34 7,166 6,314 51,5036,22451,413LEWIS 0 0 0 0 8771878LINCOLN 207 206 21,681 21,672 163,32720,790162,445MASON 0 0 0 0 1580158OKANOGAN 9 * 1,121 * * 1,9135,683PACIFIC 0 0 0 0 12310132PEND OREILLE 0 0 0 0 * * 0PIERCE 0 0 0 0 101SAN JUAN 0 0 0 0 * * 0SKAGIT 0 0 0 0 55716573SKAMANIA 0 0 0 0 * * 0SNOHOMISH 0 0 0 0 18047227SPOKANE 87 78 4,632 4,156 29,4357,25932,539STEVENS 0 0 0 0 92922951THURSTON 0 0 0 0 27027WAHKIAKUM 0 0 0 0 2370237WALLA WALLA 41 41 11,687 11,687 148,42615,805152,544WHATCOM 0 0 0 0 2,261192,280WHITMAN 132 132 22,179 22,179 169,85943,049190,729YAKIMA 28 28 3,688 3,688 50,1154,33850,764
1 / Not including continuous signup enrollment between July and September 2013.
* Data withheld to avoid disclosure of individual operations.
269

County NameExpiring
Sept. 2013 (Acres)
New Lands (Acres) 1/
Average Rental
Payment ($/Acre)
Total Rental
Payment ($/year)
Average EBI Score
without Cost
Average EBI Score with Cost
Table 2 -- Description of Signup 45 Acceptable AcresWASHINGTON
STATE TOTALS 180,511 17,638 $61.20 $12,127,649 185 285ADAMS 33,997 1,884 $54.84 $1,967,869 192 300ASOTIN 96 40 $51.40 $7,026 160 256BENTON 20,097 993 $47.04 $992,153 136 247CHELAN * * * * * * COLUMBIA 8,193 2 $81.04 $664,022 186 276DOUGLAS 20,452 6,355 $52.93 $1,418,925 173 281FERRY 0 293 $57.78 $16,907 136 233FRANKLIN 18,234 564 $70.61 $1,327,286 206 293GARFIELD 7,860 160 $70.98 $569,231 176 272GRANT 8,393 80 $63.93 $541,638 169 274KITTITAS 367 0 $41.75 $15,318 207 308KLICKITAT 4,234 2,081 $52.11 $329,057 158 255LINCOLN 18,692 2,980 $61.84 $1,340,164 211 311OKANOGAN * * * * * * SPOKANE 3,910 246 $59.80 $248,511 168 268WALLA WALLA 11,343 344 $66.10 $772,469 244 337WHITMAN 21,271 908 $78.16 $1,733,600 187 272YAKIMA 2,979 709 $45.10 $166,328 166 274
* Data withheld to avoid disclosure of individual operations.
1/ Includes land that may have been in CRP in the past.
270

County Name
EI>=8 (Acres)
National Priority
Area
State Priority
Area (Acres)
Rare and Declining Habitat (Acres)
Permanent Wildlife Habitat (Acres)
Pollinator Habitat Offers
Table 3 -- Description of Signup 45 Acceptable AcresWASHINGTON
Average Erodibility Index (EI)
Pollinator Habitat (Acres)
STATE TOTALS 151,934 0 128,019 0 25,575 6318 1,133ADAMS 32,927 0 33,064 0 721 1513 309ASOTIN 137 0 0 0 0 021 0BENTON 6,015 0 20,259 0 38 08 0CHELAN * * * * * * * * COLUMBIA 8,194 0 0 0 258 042 0DOUGLAS 12,075 0 24,274 0 15,676 478 784FERRY 293 0 0 0 233 015 0FRANKLIN 10,919 0 18,433 0 127 010 0GARFIELD 8,020 0 0 0 0 033 0GRANT 4,850 0 4,065 0 1,877 012 0KITTITAS 367 0 0 0 0 020 0KLICKITAT 6,264 0 1,733 0 0 017 0LINCOLN 21,111 0 15,369 0 126 021 0OKANOGAN * * * * * * * * SPOKANE 4,068 0 0 0 68 035 0WALLA WALLA 11,012 0 8,020 0 0 034 0WHITMAN 22,179 0 0 0 6,095 024 0YAKIMA 3,502 0 2,803 0 0 015 0
* Data withheld to avoid disclosure of individual operations.Note: Acceptable acres may be listed in multiple categories.
271
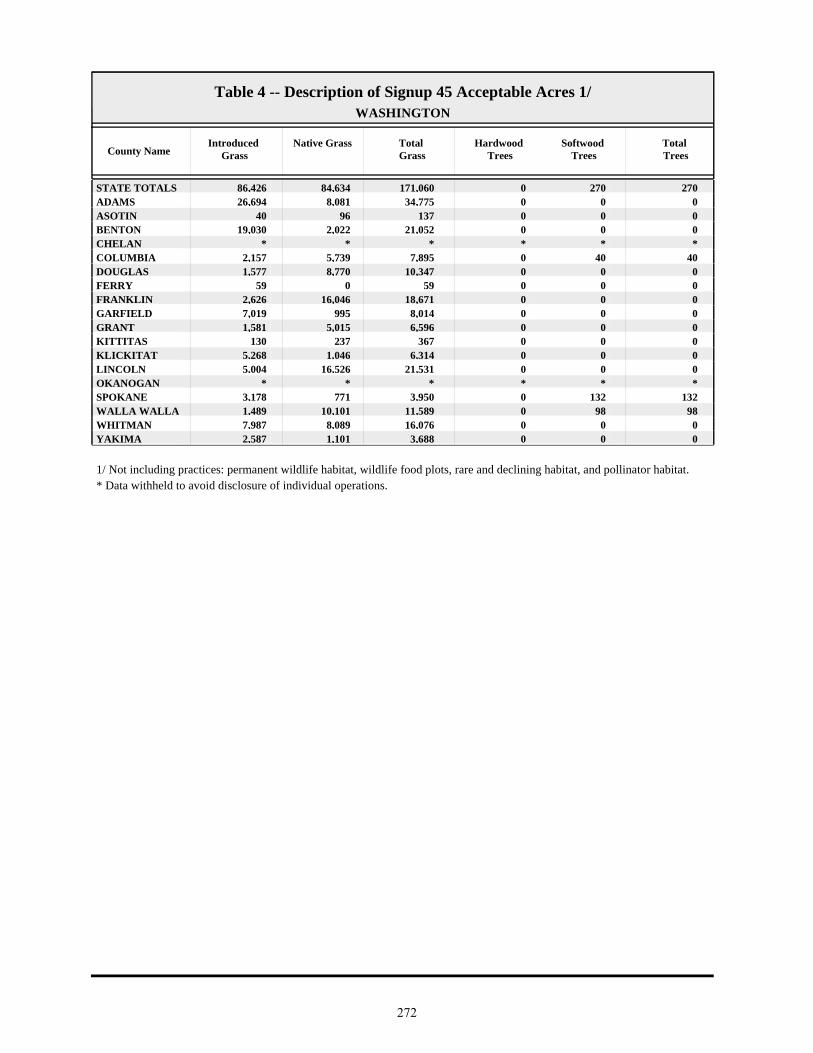
County NameIntroduced
GrassNative Grass Total
GrassHardwood
TreesSoftwood
TreesTotal Trees
Table 4 -- Description of Signup 45 Acceptable Acres 1/WASHINGTON
STATE TOTALS 86,426 84,634 171,060 0 270 270ADAMS 26,694 8,081 34,775 0 0 0ASOTIN 40 96 137 0 0 0BENTON 19,030 2,022 21,052 0 0 0CHELAN * * * * * * COLUMBIA 2,157 5,739 7,895 0 40 40DOUGLAS 1,577 8,770 10,347 0 0 0FERRY 59 0 59 0 0 0FRANKLIN 2,626 16,046 18,671 0 0 0GARFIELD 7,019 995 8,014 0 0 0GRANT 1,581 5,015 6,596 0 0 0KITTITAS 130 237 367 0 0 0KLICKITAT 5,268 1,046 6,314 0 0 0LINCOLN 5,004 16,526 21,531 0 0 0OKANOGAN * * * * * * SPOKANE 3,178 771 3,950 0 132 132WALLA WALLA 1,489 10,101 11,589 0 98 98WHITMAN 7,987 8,089 16,076 0 0 0YAKIMA 2,587 1,101 3,688 0 0 0
* Data withheld to avoid disclosure of individual operations.1/ Not including practices: permanent wildlife habitat, wildlife food plots, rare and declining habitat, and pollinator habitat.
272

WE
ST
VIR
GIN
IA
273

County Name Offers Received
Acceptable Offers
Offered Acres
Acceptable Acres
EnrollmentOct. 2013
before continuous
1/
Acreage Expiring Sept. 30,
2013
Enrollment as of
June 2013
Table 1 -- Offers Received, Acceptable Offers, and CRP AcreageWEST VIRGINIA
STATE TOTALS 0 0 0 0 6,1311796,310BARBOUR 0 0 0 0 055BERKELEY 0 0 0 0 2330233BOONE 0 0 0 0 * * 0BRAXTON 0 0 0 0 13013BROOKE 0 0 0 0 * * 0CABELL 0 0 0 0 * * 0CALHOUN 0 0 0 0 11011CLAY 0 0 0 0 40040DODDRIDGE 0 0 0 0 808FAYETTE 0 0 0 0 26026GILMER 0 0 0 0 39039GRANT 0 0 0 0 1,546401,586GREENBRIER 0 0 0 0 5570557HAMPSHIRE 0 0 0 0 1,848931,940HANCOCK 0 0 0 0 * * 0HARDY 0 0 0 0 2297236HARRISON 0 0 0 0 51051JACKSON 0 0 0 0 303JEFFERSON 0 0 0 0 1240124KANAWHA 0 0 0 0 18018LEWIS 0 0 0 0 303LINCOLN 0 0 0 0 909LOGAN 0 0 0 0 * * 0MCDOWELL 0 0 0 0 * * 0MARION 0 0 0 0 * * 0MARSHALL 0 0 0 0 * * 0MASON 0 0 0 0 4230423MERCER 0 0 0 0 17017MINERAL 0 0 0 0 505MINGO 0 0 0 0 * * 0MONONGALIA 0 0 0 0 202MONROE 0 0 0 0 69069MORGAN 0 0 0 0 55055NICHOLAS 0 0 0 0 1330133OHIO 0 0 0 0 * * 0PENDLETON 0 0 0 0 91091PLEASANTS 0 0 0 0 * * 0POCAHONTAS 0 0 0 0 22128249PRESTON 0 0 0 0 92092PUTNAM 0 0 0 0 1350135RALEIGH 0 0 0 0 * * 0RANDOLPH 0 0 0 0 39039RITCHIE 0 0 0 0 * * 0ROANE 0 0 0 0 * * 0SUMMERS 0 0 0 0 * * 0TAYLOR 0 0 0 0 * * 0TUCKER 0 0 0 0 * * 0TYLER 0 0 0 0 47754UPSHUR 0 0 0 0 707WAYNE 0 0 0 0 * * 0WEBSTER 0 0 0 0 28028WETZEL 0 0 0 0 11011
274

County Name Offers Received
Acceptable Offers
Offered Acres
Acceptable Acres
EnrollmentOct. 2013
before continuous
1/
Acreage Expiring Sept. 30,
2013
Enrollment as of
June 2013
Table 1 -- Offers Received, Acceptable Offers, and CRP AcreageWEST VIRGINIA
WIRT 0 0 0 0 * * 0WOOD 0 0 0 0 * * 0WYOMING 0 0 0 0 * * 0
1 / Not including continuous signup enrollment between July and September 2013.
* Data withheld to avoid disclosure of individual operations.
275

WISCONSIN
276

County Name Offers Received
Acceptable Offers
Offered Acres
Acceptable Acres
EnrollmentOct. 2013
before continuous
1/
Acreage Expiring Sept. 30,
2013
Enrollment as of
June 2013
Table 1 -- Offers Received, Acceptable Offers, and CRP AcreageWISCONSIN
STATE TOTALS 903 777 14,328 12,049 257,60572,601318,157ADAMS * * * * * 74514ASHLAND 0 0 0 0 33033BARRON 8 8 168 168 2,4284962,756BAYFIELD 0 0 0 0 99099BROWN 11 9 135 80 1,7223381,980BUFFALO 23 23 384 384 6,4221,3757,413BURNETT 0 0 0 0 32032CALUMET 5 3 52 27 8281991,000CHIPPEWA 7 7 91 91 4,7803985,087CLARK 0 0 0 0 59645641COLUMBIA 36 28 798 596 4,8231,6155,842CRAWFORD 13 13 234 234 5,5562,5297,850DANE 48 43 803 729 16,7681,74917,788DODGE 29 25 291 276 6,3951,0277,147DOOR 14 14 163 163 3,2506693,756DOUGLAS 0 0 0 0 * * 0DUNN 25 25 465 465 5,4332,7047,672EAU CLAIRE 3 3 72 72 11,43283212,193FLORENCE 0 0 0 0 16016FOND DU LAC 18 16 180 172 5,8213,2758,924FOREST 0 0 0 0 * * 0GRANT 19 19 326 325 18,1756,94524,795GREEN 7 6 103 101 10,7141,58912,202GREEN LAKE 22 17 331 241 2,3018662,927IOWA 16 12 300 91 20,9134,33425,156IRON 0 0 0 0 * * 0JACKSON 0 0 0 0 2,0471,1783,225JEFFERSON 14 11 206 161 2,8325273,199JUNEAU 3 3 59 59 3,1351,1654,241KENOSHA 6 3 180 63 706185828KEWAUNEE 26 18 313 208 2,4581,6653,916LA CROSSE 10 7 188 127 2,3738983,144LAFAYETTE 23 22 429 417 17,4662,21619,265LANGLADE * * * * * 42114LINCOLN * * * * * 2020MANITOWOC 49 37 593 384 4,4392,3456,400MARATHON 0 0 0 0 1,0342131,247MARINETTE * * * * * 1741MARQUETTE 12 7 199 100 1,3206581,878MENOMINEE 0 0 0 0 03030MILWAUKEE 0 0 0 0 2240224MONROE 44 42 616 590 5,4682,8277,705OCONTO 3 * 47 * * 223801ONEIDA 0 0 0 0 * * 0OUTAGAMIE 13 10 248 176 2,4927083,025OZAUKEE 7 7 85 85 1,3123431,570PEPIN 5 3 38 22 2,3436903,012PIERCE 37 36 441 428 5,9361,7617,269POLK 25 25 474 474 4,4091,5095,445PORTAGE 16 15 365 345 1,3145121,482PRICE 0 0 0 0 303RACINE 7 5 88 51 1,3043451,598
277

County Name Offers Received
Acceptable Offers
Offered Acres
Acceptable Acres
EnrollmentOct. 2013
before continuous
1/
Acreage Expiring Sept. 30,
2013
Enrollment as of
June 2013
Table 1 -- Offers Received, Acceptable Offers, and CRP AcreageWISCONSIN
RICHLAND 29 25 538 495 8,7454,35212,602ROCK 36 33 495 485 9,8311,38910,735RUSK 0 0 0 0 10940149ST CROIX 39 28 868 625 8,6743,16311,212SAUK 11 9 120 102 6,3871,8568,141SAWYER 0 0 0 0 * * 0SHAWANO 11 9 121 104 2,2014122,509SHEBOYGAN 5 5 96 96 1,1683321,404TAYLOR 0 0 0 0 3300330TREMPEALEAU 63 54 918 831 9,3035,62914,101VERNON 28 28 425 425 3,2731,3744,221VILAS 0 0 0 0 * * 0WALWORTH 11 5 167 102 2,8655953,358WASHBURN 0 0 0 0 125566WASHINGTON 7 7 102 102 9891851,072WAUKESHA * 0 * 0 1,067511,119WAUPACA 30 27 447 413 3,2977603,645WAUSHARA 4 3 68 66 50347484WINNEBAGO 17 16 210 199 4,9841,1415,927WOOD 0 0 0 0 1,498781,576
1 / Not including continuous signup enrollment between July and September 2013.
* Data withheld to avoid disclosure of individual operations.
278

County NameExpiring
Sept. 2013 (Acres)
New Lands (Acres) 1/
Average Rental
Payment ($/Acre)
Total Rental
Payment ($/year)
Average EBI Score
without Cost
Average EBI Score with Cost
Table 2 -- Description of Signup 45 Acceptable AcresWISCONSIN
STATE TOTALS 11,009 1,041 $119.83 $1,443,869 198 266ADAMS * * * * * * BARRON 168 0 $69.66 $11,730 176 270BROWN 61 19 $124.87 $10,002 211 277BUFFALO 382 2 $109.48 $42,050 207 284CALUMET 27 0 $128.30 $3,439 184 237CHIPPEWA 59 32 $108.32 $9,879 168 247COLUMBIA 510 86 $136.50 $81,314 198 263CRAWFORD 184 50 $120.75 $28,293 225 282DANE 694 35 $135.64 $98,842 220 279DODGE 264 12 $152.22 $41,981 209 254DOOR 163 0 $71.66 $11,680 163 269DUNN 452 14 $105.15 $48,935 198 272EAU CLAIRE 72 0 $114.42 $8,181 189 255FOND DU LAC 136 36 $114.72 $19,744 194 263GRANT 177 149 $213.98 $69,650 266 274GREEN 101 0 $172.81 $17,368 265 293GREEN LAKE 234 7 $108.16 $26,012 167 254IOWA 91 0 $173.98 $15,815 223 269JEFFERSON 107 54 $113.86 $18,275 168 246JUNEAU 59 0 $123.58 $7,254 231 293KENOSHA 63 0 $137.90 $8,687 214 279KEWAUNEE 201 7 $110.89 $23,076 170 248LA CROSSE 116 11 $144.84 $18,380 214 259LAFAYETTE 417 1 $202.03 $84,328 222 245LANGLADE * * * * * * LINCOLN * * * * * * MANITOWOC 372 12 $112.17 $43,062 183 263MARINETTE * * * * * * MARQUETTE 95 5 $77.70 $7,739 140 243MONROE 549 41 $107.61 $63,499 194 267OCONTO * * * * * * OUTAGAMIE 172 4 $104.12 $18,283 188 272OZAUKEE 85 0 $88.39 $7,530 168 257PEPIN 5 16 $114.03 $2,463 207 292PIERCE 322 106 $132.66 $56,727 230 287POLK 387 86 $62.81 $29,747 189 289PORTAGE 340 5 $56.69 $19,559 150 258RACINE 46 5 $145.89 $7,426 213 263RICHLAND 481 14 $117.49 $58,195 212 275ROCK 454 31 $182.18 $88,283 238 269ST CROIX 625 0 $97.86 $61,123 180 260SAUK 89 14 $122.98 $12,581 193 268SHAWANO 81 23 $99.35 $10,353 185 274SHEBOYGAN 84 12 $95.51 $9,141 208 279TREMPEALEAU 810 21 $128.21 $106,490 209 263VERNON 381 44 $117.14 $49,818 185 251WALWORTH 84 17 $96.82 $9,837 154 247WASHINGTON 102 0 $87.61 $8,971 212 301WAUPACA 395 18 $91.16 $37,632 146 236WAUSHARA 22 44 $46.62 $3,086 128 235WINNEBAGO 191 8 $98.98 $19,706 167 254
* Data withheld to avoid disclosure of individual operations.
1/ Includes land that may have been in CRP in the past.
279
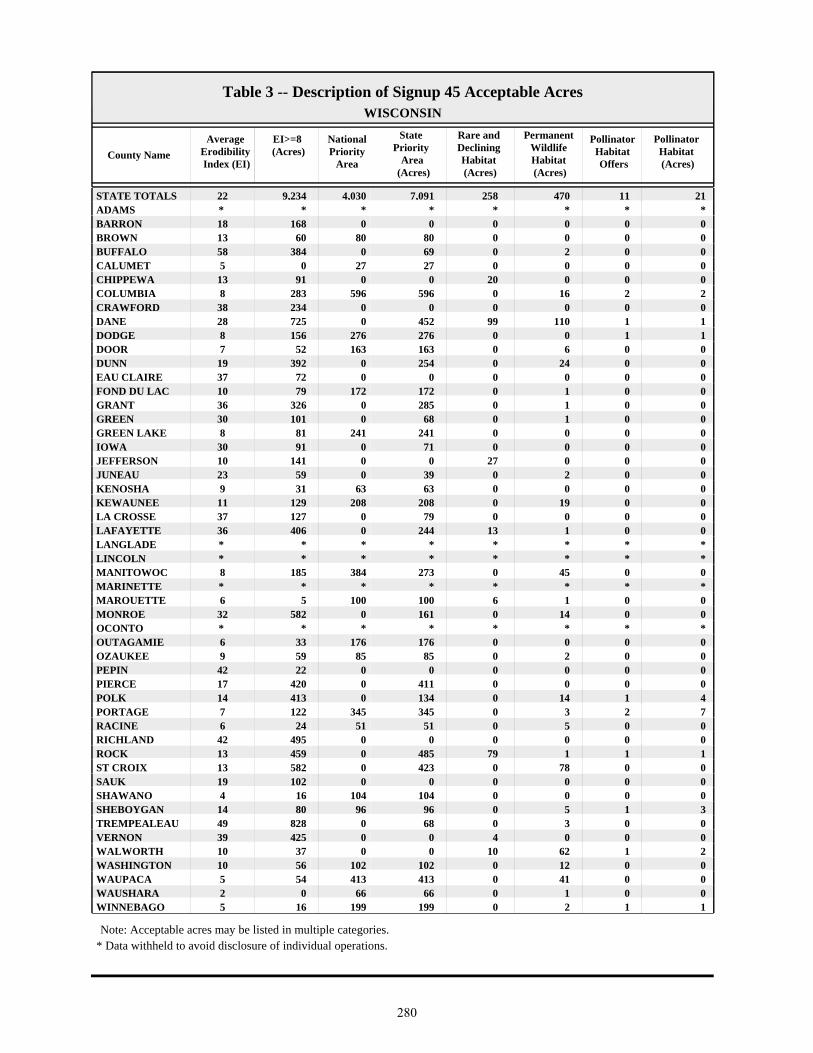
County Name
EI>=8 (Acres)
National Priority
Area
State Priority
Area (Acres)
Rare and Declining Habitat (Acres)
Permanent Wildlife Habitat (Acres)
Pollinator Habitat Offers
Table 3 -- Description of Signup 45 Acceptable AcresWISCONSIN
Average Erodibility Index (EI)
Pollinator Habitat (Acres)
STATE TOTALS 9,234 4,030 7,091 258 470 1122 21ADAMS * * * * * * * * BARRON 168 0 0 0 0 018 0BROWN 60 80 80 0 0 013 0BUFFALO 384 0 69 0 2 058 0CALUMET 0 27 27 0 0 05 0CHIPPEWA 91 0 0 20 0 013 0COLUMBIA 283 596 596 0 16 28 2CRAWFORD 234 0 0 0 0 038 0DANE 725 0 452 99 110 128 1DODGE 156 276 276 0 0 18 1DOOR 52 163 163 0 6 07 0DUNN 392 0 254 0 24 019 0EAU CLAIRE 72 0 0 0 0 037 0FOND DU LAC 79 172 172 0 1 010 0GRANT 326 0 285 0 1 036 0GREEN 101 0 68 0 1 030 0GREEN LAKE 81 241 241 0 0 08 0IOWA 91 0 71 0 0 030 0JEFFERSON 141 0 0 27 0 010 0JUNEAU 59 0 39 0 2 023 0KENOSHA 31 63 63 0 0 09 0KEWAUNEE 129 208 208 0 19 011 0LA CROSSE 127 0 79 0 0 037 0LAFAYETTE 406 0 244 13 1 036 0LANGLADE * * * * * * * * LINCOLN * * * * * * * * MANITOWOC 185 384 273 0 45 08 0MARINETTE * * * * * * * * MARQUETTE 5 100 100 6 1 06 0MONROE 582 0 161 0 14 032 0OCONTO * * * * * * * * OUTAGAMIE 33 176 176 0 0 06 0OZAUKEE 59 85 85 0 2 09 0PEPIN 22 0 0 0 0 042 0PIERCE 420 0 411 0 0 017 0POLK 413 0 134 0 14 114 4PORTAGE 122 345 345 0 3 27 7RACINE 24 51 51 0 5 06 0RICHLAND 495 0 0 0 0 042 0ROCK 459 0 485 79 1 113 1ST CROIX 582 0 423 0 78 013 0SAUK 102 0 0 0 0 019 0SHAWANO 16 104 104 0 0 04 0SHEBOYGAN 80 96 96 0 5 114 3TREMPEALEAU 828 0 68 0 3 049 0VERNON 425 0 0 4 0 039 0WALWORTH 37 0 0 10 62 110 2WASHINGTON 56 102 102 0 12 010 0WAUPACA 54 413 413 0 41 05 0WAUSHARA 0 66 66 0 1 02 0WINNEBAGO 16 199 199 0 2 15 1
* Data withheld to avoid disclosure of individual operations.Note: Acceptable acres may be listed in multiple categories.
280

County NameIntroduced
GrassNative Grass Total
GrassHardwood
TreesSoftwood
TreesTotal Trees
Table 4 -- Description of Signup 45 Acceptable Acres 1/WISCONSIN
STATE TOTALS 4,095 2,474 6,568 2,952 1,686 4,637ADAMS * * * * * * BARRON 25 73 99 47 23 70BROWN 41 0 41 32 8 39BUFFALO 149 46 195 137 37 174CALUMET 0 17 17 8 2 10CHIPPEWA 0 7 7 48 17 65COLUMBIA 159 105 264 272 37 308CRAWFORD 55 48 103 124 0 124DANE 197 165 362 146 8 154DODGE 32 153 186 67 20 87DOOR 13 0 13 98 46 144DUNN 174 9 183 21 238 259EAU CLAIRE 15 0 15 27 30 56FOND DU LAC 55 39 93 72 2 74GRANT 135 75 210 112 0 112GREEN 0 5 5 95 0 95GREEN LAKE 90 124 213 16 9 25IOWA 7 36 43 40 8 48JEFFERSON 24 63 86 38 4 42JUNEAU 57 0 57 0 0 0KENOSHA 0 32 32 31 0 31KEWAUNEE 103 5 108 36 46 82LA CROSSE 104 7 110 16 0 16LAFAYETTE 245 85 331 73 0 73LANGLADE * * * * * * LINCOLN * * * * * * MANITOWOC 107 4 111 159 66 225MARINETTE * * * * * * MARQUETTE 5 18 23 18 49 67MONROE 415 71 487 78 10 88OCONTO * * * * * * OUTAGAMIE 0 80 80 56 40 96OZAUKEE 20 34 55 0 29 29PEPIN 12 10 22 0 0 0PIERCE 111 214 325 89 7 96POLK 161 163 324 32 101 132PORTAGE 11 59 70 0 266 266RACINE 1 0 1 43 0 43RICHLAND 186 47 233 242 9 251ROCK 89 233 322 80 0 80ST CROIX 230 61 291 216 37 253SAUK 62 39 101 1 0 1SHAWANO 4 0 4 47 53 100SHEBOYGAN 46 39 85 0 1 1TREMPEALEAU 545 20 565 199 62 261VERNON 295 22 317 99 0 99WALWORTH 5 19 24 0 1 1WASHINGTON 13 46 59 27 4 31WAUPACA 18 61 79 3 286 289WAUSHARA 44 3 47 0 17 17WINNEBAGO 37 138 175 8 13 21
* Data withheld to avoid disclosure of individual operations.1/ Not including practices: permanent wildlife habitat, wildlife food plots, rare and declining habitat, and pollinator habitat.
281

WY
OM
ING
282

County Name Offers Received
Acceptable Offers
Offered Acres
Acceptable Acres
EnrollmentOct. 2013
before continuous
1/
Acreage Expiring Sept. 30,
2013
Enrollment as of
June 2013
Table 1 -- Offers Received, Acceptable Offers, and CRP AcreageWYOMING
STATE TOTALS 67 51 13,160 9,375 199,6505,444195,718ALBANY 0 0 0 0 63063BIG HORN 0 0 0 0 2360236CAMPBELL 3 0 535 0 12,196012,196CARBON 0 0 0 0 81081CONVERSE 4 4 718 718 3,55002,832CROOK 0 0 0 0 1,196161,212FREMONT 0 0 0 0 51152GOSHEN 20 17 3,443 2,571 75,15473073,312HOT SPRINGS 0 0 0 0 8470847JOHNSON 0 0 0 0 2570257LARAMIE 27 20 6,680 4,475 44,2824,25144,059LINCOLN 0 0 0 0 1,6262631,889NATRONA 0 0 0 0 2,55002,550NIOBRARA 3 3 527 527 9,67009,144PARK 0 0 0 0 2550255PLATTE 10 7 1,258 1,085 43,9268642,928SHERIDAN 0 0 0 0 2,43902,439SUBLETTE 0 0 0 0 11011SWEETWATER 0 0 0 0 * * 0TETON 0 0 0 0 * * 0UINTA 0 0 0 0 606WASHAKIE 0 0 0 0 40172473WESTON 0 0 0 0 85025875
1 / Not including continuous signup enrollment between July and September 2013.
* Data withheld to avoid disclosure of individual operations.
283

County NameExpiring
Sept. 2013 (Acres)
New Lands (Acres) 1/
Average Rental
Payment ($/Acre)
Total Rental
Payment ($/year)
Average EBI Score
without Cost
Average EBI Score with Cost
Table 2 -- Description of Signup 45 Acceptable AcresWYOMING
STATE TOTALS 2,608 6,767 $29.97 $280,951 121 244CONVERSE 0 718 $26.00 $18,659 120 230GOSHEN 498 2,073 $29.28 $75,298 152 270LARAMIE 2,043 2,432 $29.91 $133,840 102 232NIOBRARA 0 527 $34.05 $17,931 117 233PLATTE 67 1,018 $32.47 $35,223 127 245
* Data withheld to avoid disclosure of individual operations.
1/ Includes land that may have been in CRP in the past.
284
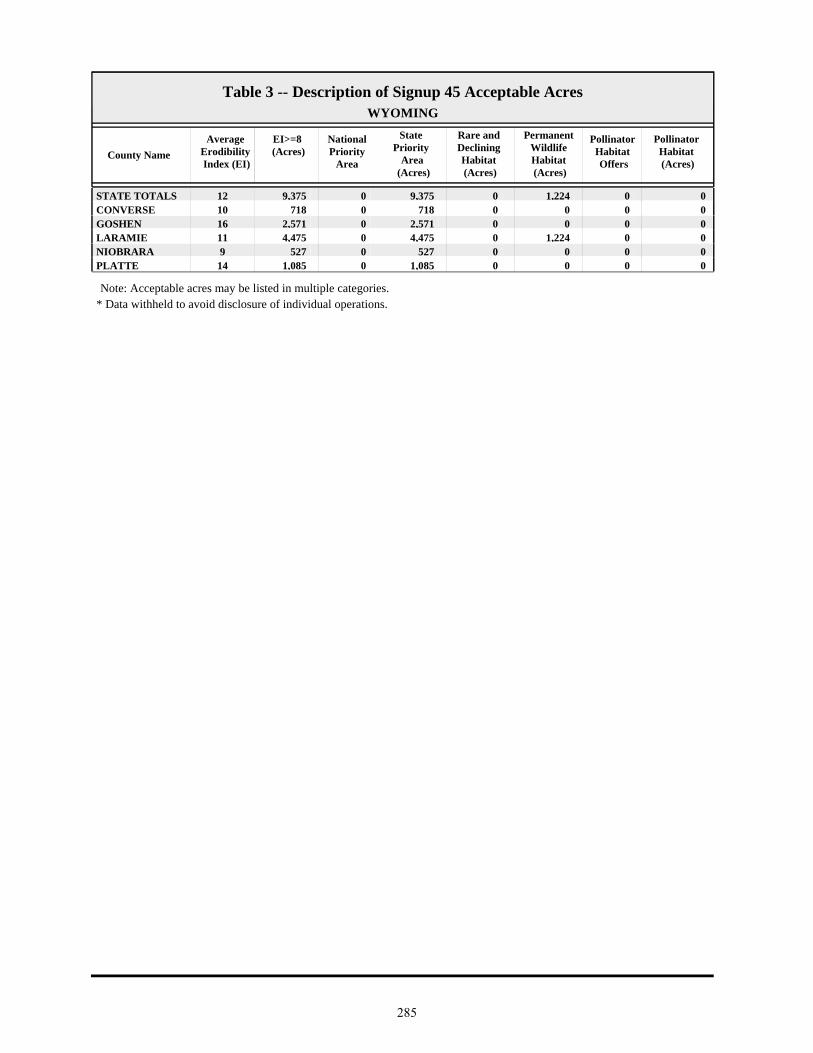
County Name
EI>=8 (Acres)
National Priority
Area
State Priority
Area (Acres)
Rare and Declining Habitat (Acres)
Permanent Wildlife Habitat (Acres)
Pollinator Habitat Offers
Table 3 -- Description of Signup 45 Acceptable AcresWYOMING
Average Erodibility Index (EI)
Pollinator Habitat (Acres)
STATE TOTALS 9,375 0 9,375 0 1,224 012 0CONVERSE 718 0 718 0 0 010 0GOSHEN 2,571 0 2,571 0 0 016 0LARAMIE 4,475 0 4,475 0 1,224 011 0NIOBRARA 527 0 527 0 0 09 0PLATTE 1,085 0 1,085 0 0 014 0
* Data withheld to avoid disclosure of individual operations.Note: Acceptable acres may be listed in multiple categories.
285

County NameIntroduced
GrassNative Grass Total
GrassHardwood
TreesSoftwood
TreesTotal Trees
Table 4 -- Description of Signup 45 Acceptable Acres 1/WYOMING
STATE TOTALS 7,791 358 8,149 0 0 0CONVERSE 718 0 718 0 0 0GOSHEN 2,377 194 2,571 0 0 0LARAMIE 3,085 163 3,249 0 0 0NIOBRARA 527 0 527 0 0 0PLATTE 1,085 0 1,085 0 0 0
* Data withheld to avoid disclosure of individual operations.1/ Not including practices: permanent wildlife habitat, wildlife food plots, rare and declining habitat, and pollinator habitat.
286
Farm Service Agency U.S. Department of Agriculture
Conservation and Environmental Programs Division (CEPD) 1400 Independence Ave., SW, Room 4709-S, Stop 0513
Washington, DC 20250-0513
Phone: 202-720-6221 Fax: 202-720-4619 www.fsa.usda.gov
About the Farm Service Agency’s Conservation and Environmental Programs Division (CEPD): The U.S. Department of Agriculture Farm Service Agency’s Conservation and Environmental Programs Division serves the nation’s agricultural producers, providing assistance and opportunities for producers to voluntarily invest in safeguarding environmentally sensitive lands. CEPD implements multiple diverse programs that help accomplish these goals, in-cluding the following programs:
■ Biomass Crop Assistance Program ■ Conservation Reserve Program ■ Conservation Reserve Enhancement Program ■ Emergency Forest Restoration Program ■ Emergency Conservation Program ■ Farmable Wetlands Program ■ Grassland Reserve Program ■ Source Water Protection Program ■ Voluntary Public Access and Habitat Incentive Program
CEPD also coordinates FSA’s activities under the Secretary’s People’s Garden Initiative.