the constancy of acid values in a series of 227 peptic ulcer cases studied by repeated gastric...
TRANSCRIPT

THE CONSTANCY OF ACID VALUES IN A SERIES OF 227 PEPTIC UL CER CASES STUDIED BY REPEATED GASTRIC ANALYSES
SAMUEL MORRISON, M. D. AND MAURICE
O U R I N T E R E S T in this problem was stimulated by the fact that acid values in an individual may
not fluctuate to any marked degree over a period of years. The fluctuations we have found are variable but tend to remain within the limits of the graded original acid values. The impression is gained from a review of the literature that acid values vary from time to time and that these fluctuations are marked and do not tend to return to their original level after adequate treatment. Contrary to this prevailing opinion, we have found that the acid values, in spite of the variable fuctuations noted from time to time, tend to return to fairly constant values as judged by numerous gastric analysis tests performed in the same individual over many years. In our study, it appears that the acid values for a large nmnber of individuals tend to return to a previously determined level with little fluctuation in repeated tests. For this reason, this study is designed to direct attention to the constancy of acid values; it further emphasizes the importance of repeated gastric analyses performed over many years for this type of study suggests a reconsideration of the mechanism by which any individual's acid level seems to be char- acteristic and in many instances, constant for that in- dividual.
Much objective information needs to be collected on acid gradation so that an appraisal may be made of the partly erroneous conception that acid secretion is easily influenced in any individual patient. Further- more, a single gastric analysis may not clearly por- tray the patient's acid status. Repeated tests over a period of time are essential for the proper evaluation of acid values.
In reviewing the literature, the importance of a gastric analysis is predicated on the ability of the stomach to secrete hydrochloric acid. Although this may be basic and is of first importance, consideration has not been given to the acid value curve on repeated tests over a period of time.
In the evaluation of gastric analyses, we must bear in mind many factors which influence gastric secretion. Some of these are environmental inflnences, neuropsy- chiatric factors, various drugs and of course, food. As one example, both in theory and also in practice, it is widely held that the gastric acidity is permanently influenced by antacids. There is reason to doubt that this belief is actually supportable in many patients. In many patients the degree of acidity cannot be cor- related with the activity of the ulcer. Cases could be cited in which low acidities are associated with ulcer symptoms and high acidities with remission of symp- toms indicating that other factors than acidity alone are responsible for the activity of the ulcer and the production of acidity.
Gradations of acid values are colnmonly observed in repeated gastric analyses. For the most part, these
Submitted Feb. 6, 1953.
FELDMAN, M.D., Baltimore, Maryland
variable gradations should be considered as a normal phenomenon of the gastric secretory phase, and should be discounted in the consideration of the grading of acid values since they do not fall within the significant limits. It must be pointed out here, that the acid values obtained in gastric analysis are approximate ones and often vary widely within normal limits. The acid value curve of repeated tests as stressed in our study is of more value than the results obtained in a single test. Variations in acid values in gastric analysis tests are known to occur from hour to hour and from day to night, as a result of various stimuli. There are also variations in different people and in the same indi- vidual from time to time. For this reason one should not rely upon the single test nor on the different variables that may be found on repeated tests, as long as the acid values followed the graded norm ac- cording to the graded chart presented subsequently.
Most statistics on gastric acidities have been cor- related with age but not in the same patient who had repeated titrations as he grew older. In a study based on 227 patients, we were impressed with the observa- tion that a considerable number have the same degree of acid value on repeated tests over many years.
Symptoms are often not paralleled by the degree of acidity. Patients may have high acid values with symp- toms; these symptoms may disappear with the use of antacids. Later the same patients may have the same high degree of acidity without symptoms. Some of the patients occasionally have no symptoms with high acid values and contrarily have symptoms with lower acidity indicating that other factors are operating. Pa- tients with symptoms correlated with elevated acid values and an ulcer may have the same acid values but no symptoms when the ulcer heals. It appears from the tables that the greatest number of constant hyperacidities are in the 1st degree hyperacid cate- gories.
Of our 227 cases, there were 183 males and 44 fe- males. The ages ranged from 19 to 78, the majority being in the second and fourth decades. Table 1 pre- sents the cases according to age.
TABLE I
]0-20 5
20-30 55
30-40 75
40-50 54
50-60 22
60-70 9
70-80 1
Not specified 6
cases
Total 227 Cases
251
2 5 2 CONSTANCY OF A c r e IN PEPTIC U L C E R
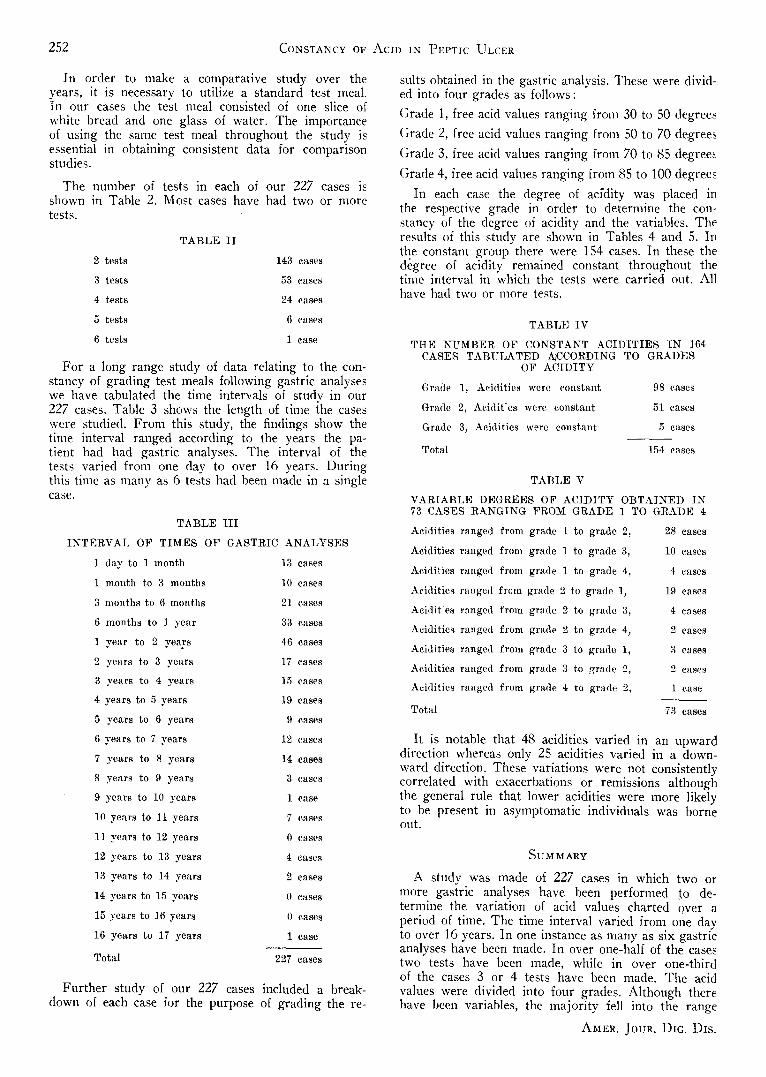
In order to make a comparative study over the years, it is necessary to utilize a standard test meal. In our cases the test meal consisted of one slice of white bread and one glass of water. The importance of using the same test meal throughout the study is essential in obtaining consistent data for comparison studies.
The number of tests in each of our 227 cases is shown in Table 2. Most cases have had two or more tests.
T A B L E I I
2 tes t s 143 cases
3 tes t s 53 eases
4 tes t s 24 eases
5 tes t s 6 eases
6 t e s t s i ease
For a long range study of data relating to the con- stancy of grading test meals following gastric analyses we have tabulated the time intervals of study in our 227 cases. Table 3 shows the length of time {he cases were studied. From this study, the findings show the time interval ranged according to the years the pa- tient had had gastric analyses. The interval of the tests varied from one day to over 16 years. During this time as many as 6 tests had been made in a single case.
T A B L E I I I
I N T E R V A L OF T I M E S OF G A S T R I C A N A L Y S E S
1 day to 1 m o n t h 13 cases
1 m o n t h to 3 m o n t h s 10 cases
3 m o n t h s to 6 m o n t h s 21 cases
6 m o n t h s to ] year 33 cases
1 yea r to 2 years 46 cases
2 yea r s to 3 years 17 cases
3 years to 4 years 15 cases
4 years to 5 years 19 cases
5 years to 6 years 9 cases
6 years to 7 years 12 cases
7 yea r s to 8 yea r s 14 cases
8 years to 9 yea r s 3 cases
9 yea r s to 10 yea r s 1 case
10 yea r s to 11 years 7 cases
11 years to 12 yea r s 0 cases
12 years to 13 years 4 cases
13 yea r s to 14 yea r s 2 cases
14 yea r s to 15 years 0 cases
15 years to 16 yea r s 0 cases
16 yea r s to 17 yea r s 1 case
Tota l 227 cases
Further study of our 227 cases included a break- down of each case for the purpose of grading the re-
sults obtained in the gastric analysis. These were divid- ed into four grades as follows:
Grade 1, free acid values ranging from 30 to 50 degrees
Grade 2, free acid values ranging from 50 to 70 degrees
Grade 3, free acid values ranging from 70 to 85 degree~
Grade 4, free acid values ranging from 85 to 100 degrees
In each case the degree of acfdity was placed in the respective grade in order to determine the con- stancy of the degree of acidity and the variables. The results of this study are shown in Tables 4 and 5. In the constant group there were 154 cases. In these the degree of acidity remained constant throughout the time interval in which the tests were carried out. All have had two or more tests.
T A B L E IV
T H E N U M B E R OF C O N S T A N T A C I D I T I E S I N 164 CASES T A B U L A T E D A~CCORDING TO G R A D E S
OF A C I D I T Y
Grade 1, Acidi t ies were cons t an t
Grade 2, Ac id i t ' e s were cons t an t
Grade 3, Acidi t ies were cons t an t
To ta l
98 eases
51 cases
5 eases
154 cases
T A B L E V
V A R I A B L E D E G R E E S OF A C I D I T Y O B T A I N E D I N 73 CASES R A N G I N G F R O M G R A D E 1 TO G R A D E 4
Acidi t ies r anged f rom grade 1 to g rade 2, 28 cases
Acidi t ies r anged f rom grade 1 to g rade 3, 10 cases
Acid i t ies r anged f rom grade 1 to grade 4, 4 cases
Acid i t ies r anged f rom grade 2 to g rade 1, 19 cases
Ac id i t ' e s r anged f rom grade 2 to g rade 3, 4 cases
Acid i t ies r anged f rom grade 2 to g rade 4, 2 cases
Acidi t ies r anged f rom grade 3 to g rade 1, 3 cases
Acidi t ies r anged f rom grade 3 to g rade 2, 2 cases
Acidi t ies ranged f rom grade 4 to g rade 2, 1 case
To ta l 73 eases
It is notable that 48 acidities varied in an upward direction whereas only 25 acidities varied in a down- ward direction. These variations were not consistently correlated with exacerbations or remissions although the general rule that lower acidities were more likely to be present in asymptomatic individuals was borne out.
S U M M A R Y
A study was made of 227 cases in which two or more gastric analyses have been performed ~;o de- termine the variation of acid values charted Qver a period of time. The time interval varied from one day to over 16 years. In one instance as many as six gastric analyses have been made. In over one-half of the cases two tests have been made, while in over one-third of the cases 3 or 4 tests have been made. The acid values were divided into four grades. Although there have been variables, the majority fell into the range
A M E R . JOUR. DIG. DIS .

DIAGNOSIS OF GASTRIC ULCER 253
of 1st and 2nd degree acidities. It is of interest to point out that of the 227 cases, there were 154 or 67.8 per cent in whom the acid values were constant over the observation period. In the remaining 73 cases, there were variable gradations of acidity. The literature does not lead one to believe that acid values often
tend to be constaht. On file other hand, it is generally thought that acid values are responsive to various agents and this is true within limits. However, the present study would indicate tha~ the acid values tend to return to their previous levels.
11 E. Chase St., Baltimore, Md.
GASTRIC ULCER: ITS DIAGNOSIS AND DIFFERENTIATION BY TROSCOPIC AND ROENTGENOLOGICAL EXAMINATION
L. L. t~ARDT, M. D., F. STEIGMANN,
D E S P I T E T H E great advances in roentgenological technics and in gastroscopic procedures during the
past two decades, the differentiation between malig- nant and benign ulceration of the stomach is not al- ways possible. Moreover, a gastric lesion itself is occasionally missed during an x-ray examination but seen during gastroscopy or vice versa. At times, too, a lesion is suggested by one or the other procedure, or by both, but no definitive diagnosis can be made. Such occurrences have led to a pessimistic attitude in some circles as to the diagnostic value of some of these newer technics. I t is, therefore, of practical value to periodically evaluate the help the clinician may get from x-ray and gastroscopy in the diagnosis and differential diagnosis of gastric lesions.
In this paper, we will discuss mainly the vahle of x-ray and gastroscopy in the diagnosis and in the dif- ferentiation of gastric ulcerations when either method is used alone or both methods are used together. Possible errors in each method and their causes will be presented and suggestions for avoiding them will be made.
~{ATERIAL AND METHOD
The material studied consisted of 203 cases of gastric ulceration culled from several thousand cases of gastro-intestinal disease seen in a large charity hospital and in private practice. All of them had both x-ray and gastroscopic studies and the diagnosis of gastric ulceration was made by either one of the two or by both methods. Only the initial examination was considered in the preparation of the tables and dis- cussion of results. Findings on repeat examination (either on x-ray or gastroscopy) are discussed later. Seventy-two of the patients from this group underwent surgery so that, in these, the accuracy of diagnosis as to presence and type of lesion was determined. The remainder of the patients were observed clinically for a period of time (one to five years) which we believed to be long enough to indicate the accuracy of the initial diagnosis as to the benign or malignant character.
RESULTS
Findinq of Lesion: In the 131 patients who were treated only medically, the diagnosis of a gastric ul- cerative lesion was made in 69 (52.67%) by both
From the Oastroseopy Clinic and Department of Internal Medicine, Cook County HOspital, the Departments of In- ternal Medicine, Stritch School of Medicine, Loyola Uni- versity and College of Medicine, University of Illinois, Chi- cago, Illinios.
Aided by a Grant from the Hnrdt Foundation. Subnfitted Feb. 12, 1953.
GAS-
M. D. AND a . WEISS, m . D., Chicago, Ill.
x-ray and gastro>:copy. In 42 of theln the diagnosis of the ulcerative lesion was made only by gastroscopy but not by x-ray and in 20, 1) 3, x-ray only (Table 1).
TABLE I
(!OMPARISON (~F X-RAY AN]) GASTROSCOPY AS TO RECO(~NIT[ON OF PRESENCE OF ULCER
Diagnosed by Diagnose:l by Diagnosed l~y x-ray only Gastroscopy only both
No. Perceat No. Percent No. Percent Total
Medcnl 2(1 15. ~ 42 32.0 69 52.76 131
Surgie,qI 1l 15.5 19) 26.8 41 57.7 71
2O2 ~-
~Not included is one case in which ulcer was not diagnosed either by x-ray or gastroseopy.
"}-In three of these ulcer was not proved on surgery: Sur- gery was performed beyond six weeks after gastroscopie di- agnosis in two cases. Gas~roenterostomy was performed in one ease and presence or absence of ulcer wqs not reported.
ii1 72 patients who were treated surgically, the diag- nosis of a gastric ulceration was made in 41 of them by both x-ray and gastroscopy. In 19, the lesion was diagnosed only by gastroscopy but not by x-ray, and in 11, it was diagnosed only by x-ray. This would sug- gest that in 61 patients of this group of 202, the lesion would have been missed if gastroscopy weren't done, while in ,3l, the lesion would have been missed if no x-ray and only gastroscopy alone were done.
Difjerentiation of the Ulcerative Lesion: Considering the value of x-ray examination and of gastroscopy in diagnosing the nature of a gastric lesion, i.e., whether benign or malignant, the following results are ob- tained. Of 56 cases which were proven benign on histo- logical examination, 20 were reported as benign on x-ray examination. Nineteen were reported as malig- nant and in 17, no commitment was made in 22 (Table 2). In only 26 was there an agreement of the char-
TABLE II
DESCRIPTION OF ULCER BY X-RAY AND GASTRO- SCOPY IN 56 CASES PROVED BENIGN ON SURGERY
Benign Malignant Undetermined No. Percent No. Percent No. Percent Tota(
X-ray 20 35.7 19 34.0 :17 30.3 56
Gastroscopy 22 39.3 12 21.4 22 39.3 56
SFPTEMBER, 1953