the continued evolution of deli prepared - ecrm continued evolution of deli prepared ... nielsen...
TRANSCRIPT

Co
pyr
igh
t ©
20
17
Th
e N
iels
en
Co
mp
an
y. C
on
fid
en
tia
l an
d p
rop
rie
tary
.
1Copyright © 2017 The Nielsen Company. Confidential and proprietary.
Nielsen Fresh Growth & Strategy Team
The Continued Evolution of Deli Prepared
Presented by Matt Lally
Co
pyr
igh
t ©
20
17
Th
e N
iels
en
Co
mp
an
y. C
on
fid
en
tia
l an
d p
rop
rie
tary
.
2
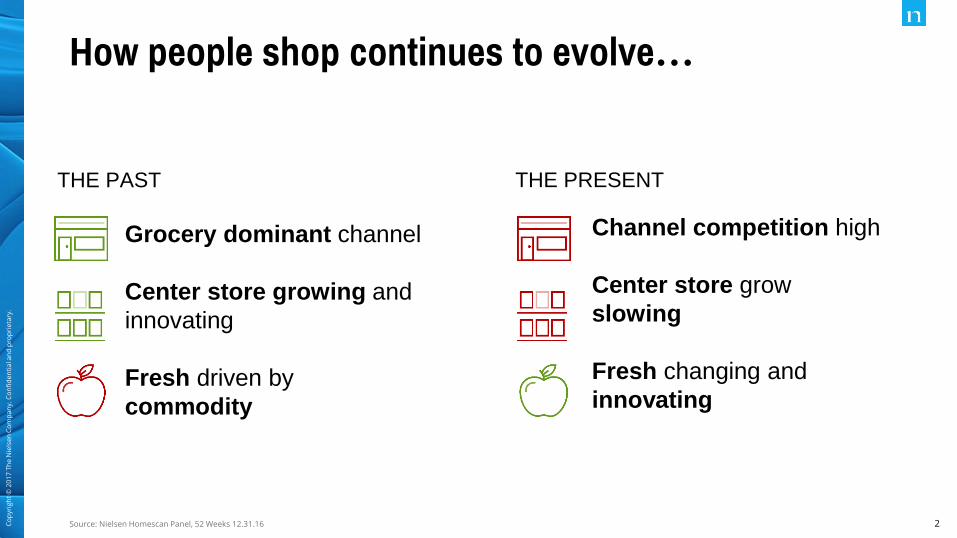
How people shop continues to evolve…
Source: Nielsen Homescan Panel, 52 Weeks 12.31.16
Grocery dominant channel
Center store growing and
innovating
Fresh driven by
commodity
Channel competition high
Center store grow
slowing
Fresh changing and
innovating
THE PRESENTTHE PAST
Co
pyr
igh
t ©
20
17
Th
e N
iels
en
Co
mp
an
y. C
on
fid
en
tia
l an
d p
rop
rie
tary
.
3
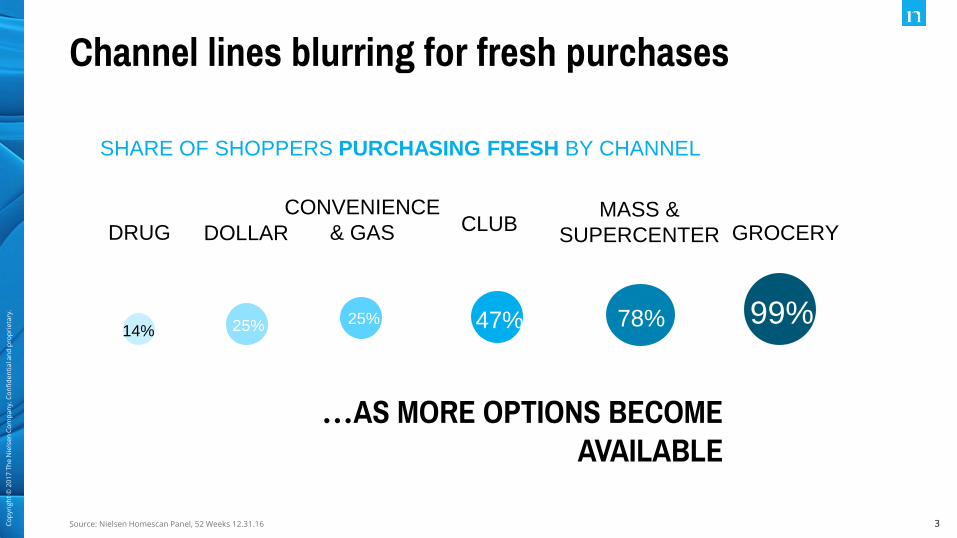
Channel lines blurring for fresh purchases
Source: Nielsen Homescan Panel, 52 Weeks 12.31.16
…AS MORE OPTIONS BECOME
AVAILABLE
SHARE OF SHOPPERS PURCHASING FRESH BY CHANNEL
MASS &
SUPERCENTERCLUB GROCERY
99%
CONVENIENCE
& GAS
14%
DRUG
78%47%25%25%
DOLLAR

Co
pyr
igh
t ©
20
17
Th
e N
iels
en
Co
mp
an
y. C
on
fid
en
tia
l an
d p
rop
rie
tary
.
4
Deli & deli prepared are growing faster than
traditional departments
Source: Nielsen Freshfacts, 52 weeks ending 7/1/17, Nielsen Homescan, 52 Weeks Ending 7/1/17
Deli$25B99.5% penetration+3.2% Trips vs. YA
Deli Prepared$15B (60%)96.2% penetration+5.1% Trips vs YA
Dollars Volume
-1.2% +1.6%
1.7% +1.1%
+2.0% +2.0%
+1.3% +1.6%
+1.0% -2.2%
+3.2%$
+2.7% lbs
Produce
Meat
Deli
Bakery
Seafood

Co
pyr
igh
t ©
20
17
Th
e N
iels
en
Co
mp
an
y. C
on
fid
en
tia
l an
d p
rop
rie
tary
.
5
The consumer is demanding changes
Source: Nielsen FreshFacts, 52 weeks ending 12/31/16; Power of Fresh Prepared; FMI/210 Analytics
3.3 Mood/craving
3.2 Speed/time
3.0 Cost/value for money
2.3 Variety
2.3 Nutrition/healthy options
1.1 Ambiance
Out of House Dinner Decision Drivers
Center Store
Time & assembly
required for a meal at home
Perimeter
Focusing on health but still
doing the cooking
Grocerants
Delegating the cooking but can
eat in-store or at home
Restaurants
Delegating the cooking &
there for the experience
Flat/Declining Slowly Growing Growing Growing
-0.1% vs. YAGO
+3.4% CAGR
$145B$325B $30B $480B
+1.0% vs. YAGO
+4% vs.
YAG
Products Closer to the Point of Consumption are Growing

Co
pyr
igh
t ©
20
17
Th
e N
iels
en
Co
mp
an
y. C
on
fid
en
tia
l an
d p
rop
rie
tary
.
6
Restaurants and QSR’s continue to innovate
Source: Nielsen Out-of-Home Dining Trends Report, August 2016
+4% vs.
YAG
1 2
3 4
Store Makeovers New and Innovative Products
Expanded Offerings Digital & Advertising
But also around Health & Wellness…
Fancy a drink?

Co
pyr
igh
t ©
20
17
Th
e N
iels
en
Co
mp
an
y. C
on
fid
en
tia
l an
d p
rop
rie
tary
.
7
Consumers are changing where they spend their
food dollars
Notes: Based on food sales from monthly and annual data in Census Retail Trade, available at: http://www.census.gov/retail/
Food sales exclude alcoholic beverages as well as home production, donations, and supplied and donated foods; food sales data are not seasonally adjusted.
Data Sources: USDA ERS Food Expenditure Series; US EIA Monthly U.S. Regular All Formulations Retail Gas Prices – prices include all taxes
44%
46%
48%
50%
52%
54%
56%
2003 2004 2005 2006 2007 2008 2009 2010 2011 2012 2013 2014 2015 2016YTDJune
Do
llar
Sh
are
of
Fo
od
S
ale
s
Food At home Food Away from home

Co
pyr
igh
t ©
20
17
Th
e N
iels
en
Co
mp
an
y. C
on
fid
en
tia
l an
d p
rop
rie
tary
.
8
Hand-in-hand: Total store and fresh success
Source: Nielsen, 52 Weeks Ending 12.31.16
1 2 3 4 5 6 7HIGH FRESH VELOCITY RETAILERS LOW FRESH VELOCITY RETAILERS
To
tal fo
od
$
sa
les p
er
sto
re
FRESH SHARE OF
TOTAL FOOD DOLLARS
TOTAL FOOD DOLLAR GROWTH
27%
49%
+4%
+1%

Co
pyr
igh
t ©
20
17
Th
e N
iels
en
Co
mp
an
y. C
on
fid
en
tia
l an
d p
rop
rie
tary
.
9
Deli has grown its share of fresh through diversifying
Source: Nielsen FreshFacts, 52 weeks ending 12/31/16
14%
Deli Share in Low Fresh
Velocity Retailers
Deli Share in High Fresh
Velocity Retailers
29%

Co
pyr
igh
t ©
20
17
Th
e N
iels
en
Co
mp
an
y. C
on
fid
en
tia
l an
d p
rop
rie
tary
.
10
Some retailers have evolved more than others, but
anyone can win if strategy executed correctly
Source: Nielsen FreshFacts, 52 weeks ending 12/31/16
Low Fresh Velocity
Retailers
High Fresh Velocity
Retailers
Fried ChickenSandwiches Pizza Deli Sushi Salad BarsRice Bowls
Deli share +3 points
vs. prior year

Co
pyr
igh
t ©
20
17
Th
e N
iels
en
Co
mp
an
y. C
on
fid
en
tia
l an
d p
rop
rie
tary
.
11Copyright © 2017 The Nielsen Company. Confidential and proprietary.
How can Deli Prepared differentiate to
stand out in the shopper’s mind when it’s
time for a meal?

Co
pyr
igh
t ©
20
17
Th
e N
iels
en
Co
mp
an
y. C
on
fid
en
tia
l an
d p
rop
rie
tary
.
12
1. Play across the spectrum
Convenience MulticulturalsHealth & Wellness
Co
pyr
igh
t ©
20
17
Th
e N
iels
en
Co
mp
an
y. C
on
fid
en
tia
l an
d p
rop
rie
tary
.
13
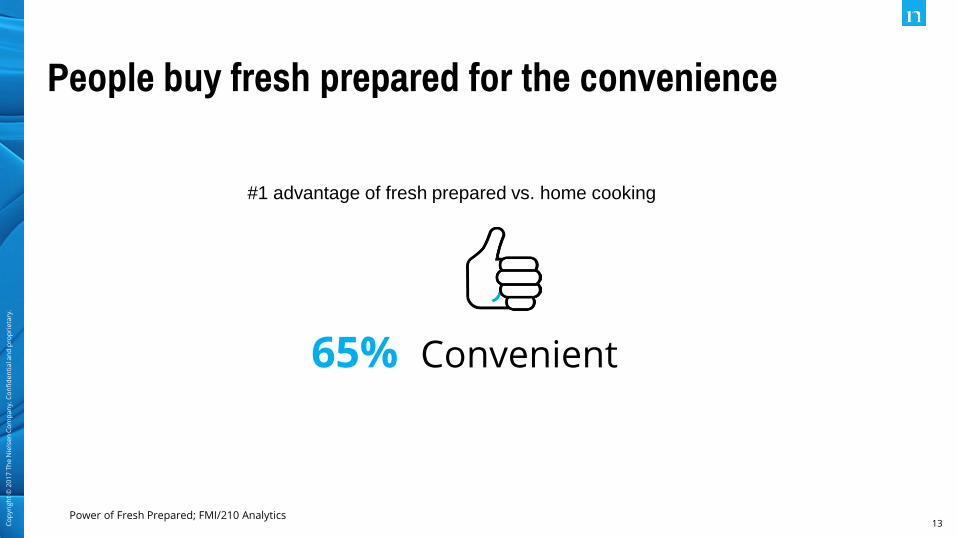
People buy fresh prepared for the convenience
Power of Fresh Prepared; FMI/210 Analytics
65% Convenient
#1 advantage of fresh prepared vs. home cooking

Co
pyr
igh
t ©
20
17
Th
e N
iels
en
Co
mp
an
y. C
on
fid
en
tia
l an
d p
rop
rie
tary
.
14
Prioritize speed and think beyond ready to eat
Source: Nielsen Out-of-Home Dining Trends Report, August 2016
Some consumers may be pressed for time but still enjoy cooking or desire more control over the
ingredients that go into their meals. Retailers should look for ways to better serve
these consumers.
For consumers who are just looking for a quick meal, retailers should make it easy for consumers to get in and out quickly – with the deli near the front of the store or adding separate checkouts.
Co
pyr
igh
t ©
20
17
Th
e N
iels
en
Co
mp
an
y. C
on
fid
en
tia
l an
d p
rop
rie
tary
.
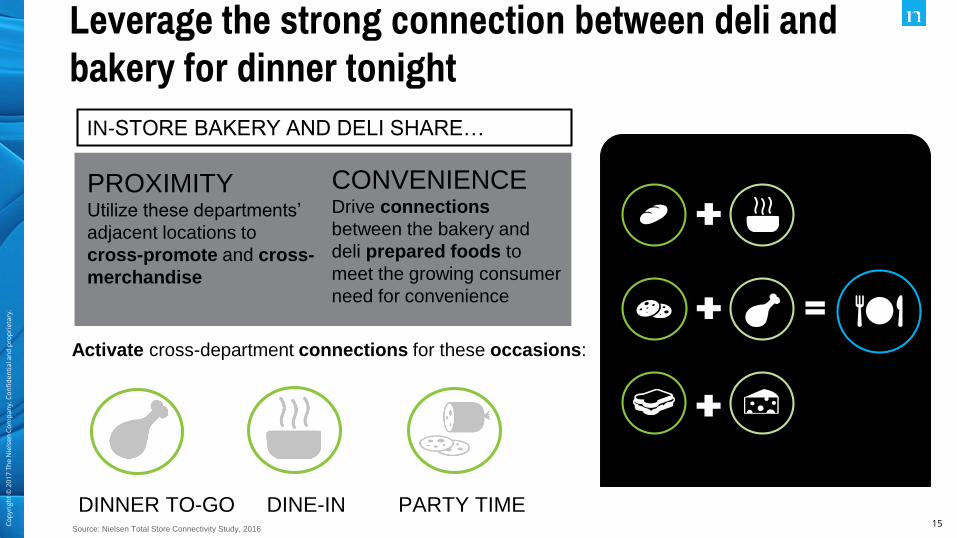
15Source: Nielsen Total Store Connectivity Study, 2016
Leverage the strong connection between deli and
bakery for dinner tonight
DINE-INDINNER TO-GO PARTY TIME
IN-STORE BAKERY AND DELI SHARE…
PROXIMITYUtilize these departments’
adjacent locations to
cross-promote and cross-
merchandise
CONVENIENCEDrive connections
between the bakery and
deli prepared foods to
meet the growing consumer
need for convenience
Activate cross-department connections for these occasions:

Co
pyr
igh
t ©
20
17
Th
e N
iels
en
Co
mp
an
y. C
on
fid
en
tia
l an
d p
rop
rie
tary
.
16
Emphasize Health & Wellness
Source: Nielsen Out-of-Home Dining Trends Report, August 2016
Consumers also want fresher, more healthful items. Retailers should consider
expanding their array of better-for-you options, including those with special dietary
needs.

Co
pyr
igh
t ©
20
17
Th
e N
iels
en
Co
mp
an
y. C
on
fid
en
tia
l an
d p
rop
rie
tary
.
17
People don’t view fresh prepared as the healthiest option
25% Healthy/nutritious
Power of Fresh Prepared; FMI/210 Analytics
#1 disadvantage of fresh prepared vs. home cooking

Co
pyr
igh
t ©
20
17
Th
e N
iels
en
Co
mp
an
y. C
on
fid
en
tia
l an
d p
rop
rie
tary
.
18
How, not if, will menu labeling impact sales?
4%
Rotisserie
Chicken
SandwichesPizza Salads
2%
Q2 2016 – Q1 2017 Q2 2017
Deli Prepared Dollar Growth
Source: Nielsen FreshFacts

Co
pyr
igh
t ©
20
17
Th
e N
iels
en
Co
mp
an
y. C
on
fid
en
tia
l an
d p
rop
rie
tary
.
19
The healthy “Halo” of Kale can be seen across
the store
Dairy
DeliMeat
Frozen
No
n fo
od
HB
CGroceryA
lcoh
olic
Be
ve
rage
Bakery
RxFloristGeneral Merch
Produce
Seafood
SALTY SNACKS
+74%
DELI DIP+136%
VITAMINS/SUPPLEMENTS
+589%
ACROSS THE STORE PRODUCTS WITH KALE GREW DOLLARS BY 22% FROM YAGO
BABYFOOD+22%
SINGLE FROZEN ENTREES
+8%
68different
consumable categories have Kale across the
store
Source: Nielsen Product Insider, powered by Label Insight, 52 weeks ending 07/29/2017
Source (Kale Icon): http://www.ripenear.me/produce/axe-handles-farm/kale
Co
pyr
igh
t ©
20
17
Th
e N
iels
en
Co
mp
an
y. C
on
fid
en
tia
l an
d p
rop
rie
tary
.
20
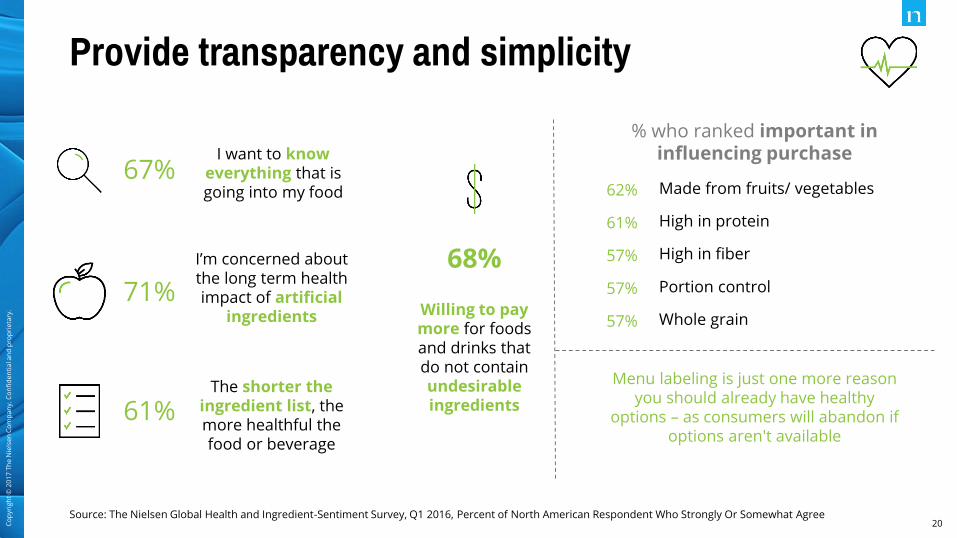
Provide transparency and simplicity
Source: The Nielsen Global Health and Ingredient-Sentiment Survey, Q1 2016, Percent of North American Respondent Who Strongly Or Somewhat Agree
71%
67%
61%The shorter the
ingredient list, the more healthful the food or beverage
I want to know everything that is going into my food
I’m concerned about the long term health impact of artificial
ingredients
68%
Willing to pay more for foods and drinks that do not contain undesirable ingredients
% who ranked important in influencing purchase
62%
61%
57%
57%
57%
Made from fruits/ vegetables
High in protein
High in fiber
Portion control
Whole grain
Menu labeling is just one more reason you should already have healthy
options – as consumers will abandon if options aren't available

Co
pyr
igh
t ©
20
17
Th
e N
iels
en
Co
mp
an
y. C
on
fid
en
tia
l an
d p
rop
rie
tary
.
21
Cater to the diverse population
Source: Nielsen State of the Hispanic Consumer Report: The Hispanic Market Imperative, American Communities Survey (2014), U.S. Census Bureau * Excludes American Indian, Alaska Native, Hawaiian & Other Pacific Islanders
In 5 Years, The U.S population will grow by:
Hispanic 6.8M
Asian American 2.3M
African American 1.8M
Non-Hispanic White 1.0M
(in Millions)
Almost 1 in 3 Americans
consume foods that contain multicultural
flavors at least once a week
32% of all Americans would pay
more for a brand that understands Multicultural needs

Co
pyr
igh
t ©
20
17
Th
e N
iels
en
Co
mp
an
y. C
on
fid
en
tia
l an
d p
rop
rie
tary
.
22
SHARE OF DOLLARS FROM
MULTICULTURAL SHOPPERS
Source: Nielsen Freshfacts 52 Weeks Ending 7/1/2017; Nielsen xAOC 52 Weeks Ending 7/1/17 (upc only)
Multicultural influence evident across the store
+23%DOLLARS VS YAGO
+20%DOLLARS VS YAGO
+7%DOLLARS VS YAGO
Chorizo
Deli Sushi
Guacamole
+16% Total Store Dollar
Growth of Multi-cultural Flavored Products

Co
pyr
igh
t ©
20
17
Th
e N
iels
en
Co
mp
an
y. C
on
fid
en
tia
l an
d p
rop
rie
tary
.
23
2. Sustain growth through constant innovation
Source: Nielsen Freshfacts, Stable Stores Calendar years 2012-2016
Dollar Change Volume Change Impressions Change
Deli Prepared
4.1% 2.8% 3.7%
5.0% 3.8% 4.2%
5 Year CAGR
5 Year CAGR
Deli

Co
pyr
igh
t ©
20
17
Th
e N
iels
en
Co
mp
an
y. C
on
fid
en
tia
l an
d p
rop
rie
tary
.
24
Get the right product mix
Source: Nielsen Out-of-Home Dining Trends Report, August 2016
AND?OR?
Not all retailers can or should provide such a broad array. For some, it may be sufficient
to offer consumers an easier, more upscale alternative to what they can make at home.

Co
pyr
igh
t ©
20
17
Th
e N
iels
en
Co
mp
an
y. C
on
fid
en
tia
l an
d p
rop
rie
tary
.
25
Demographic preferences evident, critical you cater
to the core shopper

Co
pyr
igh
t ©
20
17
Th
e N
iels
en
Co
mp
an
y. C
on
fid
en
tia
l an
d p
rop
rie
tary
.
26
TOP REASONS FOR PURCHASING A MEAL KIT:
3. Focus on meal solutions to create a destination
46%
45%
37%
36%
34%
Saves time on meal planning
Short prep and cook time
Saves time on grocery shopping
Enables me to try new recipes
Healthy recipes
Source: Harris Poll® conducted online, in English, within the United States; adults who have purchased a meal kit in the past 12 monthsSource (Size of Meal Kit Industry): Packaged Facts (https://www.packagedfacts.com/about/release.asp?id=3892)
1 IN 4 U.S. ADULTS HAVE
PURCHASED A MEAL KIT IN THE PAST 12 MONTHS
Meal Kit industry tops
$1.5B

Co
pyr
igh
t ©
20
17
Th
e N
iels
en
Co
mp
an
y. C
on
fid
en
tia
l an
d p
rop
rie
tary
.
27
Health perceptions a key difference in meal kits
from grocery competition
81%Of meal kit purchasers
believe meal kit dinners are
healthierthan prepared foods from
the local grocery store
IN STORE MEAL KIT* SALES:
$80.6 million
+6.7% compared to YAGO
41% of consumers would prefer to purchase
a meal kit in-store vs 26% for delivery and
10% from a restaurant
Source: Harris Poll® conducted online, in English, within the United States; adults who have purchased a meal kit in the past 12 months; Nielsen Freshfacts 52 Weeks Ending 12/31/2016

Co
pyr
igh
t ©
20
17
Th
e N
iels
en
Co
mp
an
y. C
on
fid
en
tia
l an
d p
rop
rie
tary
.
28
Retailers can reach key consumers and meet their
needs with in-store meal kitsFactors important to in-store meal
kit purchasersMeal Kit Shoppers
Source: Harris Poll® conducted online, in English, within the United States
42%
47%
57%
Low Cost
Availability inGrocery Stores
Time Savingson Planning Meals
Income $70,000+
Millennials
Male
Children in the Home

Co
pyr
igh
t ©
20
17
Th
e N
iels
en
Co
mp
an
y. C
on
fid
en
tia
l an
d p
rop
rie
tary
.
29
Meal kits expand beyond typical dinner occasions
Source: Harris Poll® conducted online, in English, within the United States between November 2 and November 4, 2016 among 2,037 adults aged 18+
OF MILLENNIALS WOULD PREFER TO MAKE THANKSGIVING DINNER FROM A MEAL KIT28%
• Holiday Kits
• Breakfast Kits
• Brunch Kits
• Party/Entertaining Kits
• Kid’s Birthday Party Kit
• Wine & Dine Kits
UNIQUE OPPORTUNIES TO DRIVE NEW OCCASIONS TO MEAL KITS
16%
28%23%
11%7% 6%
Total 18-34 35-44 45-54 54-64 65+

Co
pyr
igh
t ©
20
17
Th
e N
iels
en
Co
mp
an
y. C
on
fid
en
tia
l an
d p
rop
rie
tary
.
30
Meal kits provide a convenient, curated experience
Keep shoppers
coming to your store
Provide a fast and
convenient option
Take away from
restaurant visits
Continue to boost deli
prepared sales
Encourages shoppers to
experiment with new ingredients
Co
pyr
igh
t ©
20
17
Th
e N
iels
en
Co
mp
an
y. C
on
fid
en
tia
l an
d p
rop
rie
tary
.
31
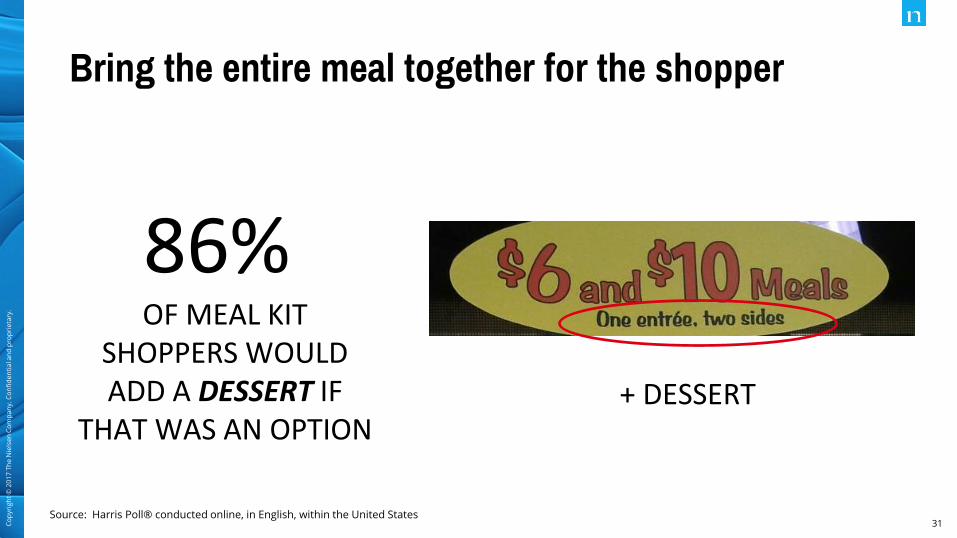
Bring the entire meal together for the shopper
OF MEAL KIT SHOPPERS WOULD ADD A DESSERT IF
THAT WAS AN OPTION
86%
+ DESSERT
Source: Harris Poll® conducted online, in English, within the United States

Co
pyr
igh
t ©
20
17
Th
e N
iels
en
Co
mp
an
y. C
on
fid
en
tia
l an
d p
rop
rie
tary
.
32
This concept could apply to any deli station
Source: Store photo

Co
pyr
igh
t ©
20
17
Th
e N
iels
en
Co
mp
an
y. C
on
fid
en
tia
l an
d p
rop
rie
tary
.
33
In order to stand out to consumers who are eating
outside the home more and more…
1. Play across the spectrum
2. Sustain growth through constant innovation
3. Focus on meal solutions, create a destination

Co
pyr
igh
t ©
20
17
Th
e N
iels
en
Co
mp
an
y. C
on
fid
en
tia
l an
d p
rop
rie
tary
.
34Copyright © 2017 The Nielsen Company. Confidential and proprietary.