the continuous work-history sample: the first 12 … first 12 years of the continuous work-history...
TRANSCRIPT

The Continuous Wont-Hi.Uory Sample: The Fifvt 12 Years
by JACOB PERLMAN *
What proportion of the Nation’s workers continue in employ- ment, year in and year out? Do relatively more men than women shift back and forth between employment in industry or com- merce and other employment? How many workers are employed every quarter in the year?
To answer these and other questions, important in any study of the national economy, the Bureau of Old-Age and Survivors Insurance in 1941 began tabulating data of this type, based on a continuous work-history sample of workers covered by old-age and survivors insurance. Data for the years 1937 through 1948 are now available and are summarized in the following pages.
M ANY of the workers in jobs covered under old-age and survivors insurance in 1948
had been employed steadily during the program’s flrst 12 years-from 1937 to 1948, inclusive. They made up a segment of the labor force totaling 11.8 million, or one-third the es- timated number of covered jobs as measured by average monthly covered employment in 1948 and almost one- fifth of the average monthly total paid civilian employment in the United States in that year.
The steadily employed group was predominantly male: women em- ployees represented less than one- fifth of the total. The median age of these workers was 46.2 years in 1948, as many as 38 percent being 50 years of age and over and 14 percent at least 60 years old. Not only did the persons in this group work at some time in every year, but the great majority were employed in practically every quarter of each year. Their median cumulative wage credits for the entire period amounted to nearly $24,000, or an average of almost $2,000 a year.’ These and other sum- mary data on continuity of employ- ment and earnings are now avail- --
* Old-Age and Survivors Insurance Research Liaison Ofllcer, Division of Research and Statistics, Of&e of the Commissioner.
1 Because taxes were then collected only on wages up to $3,000 a year, the figures based on “total” wages for the period would be even higher.
Bulletin, April 1951
able from the tabulations covering the first 12 years of the continuous work-history sample of the Bureau of Old-Age and Survivors Insurance.
Nature of the Data The opportunity to develop work-
history statistics on a mass basis presented itself with the passage of the Social Security Act in 1935, under which there was set up a system of continuous reporting by employers and the recording by the Bureau of Old-Age and Survivors Insurance of quarterly wage information concern- ing employees in the industrial and commercial establishments covered by the program. The data, for the most part, are based on actual rec- ords maintained by the employers. Utilizing this information, the Bureau of Old-Age and Survivors Insurance originated the continuous work-his- tory sample in 1941.2 The flrst tabula- tions covered the 4-year period from 1937 to 1940, and the tabulations have been extended annually to cover the additional years. It should be pointed out that the data thus far include only segments of the working life cycles of individuals, but eventually the tabulations will cover the com-
“For a more technical description of the sample, see “The Continuous Work History Sample Under Old-Age and Sur- vivors Insurance,” by Jacob Perlman and Benjamin Mandel, Social Security Bulle- tin, February 1944; “OASI Earnings Sta- tistics and Their Uses,” by B. J. Mandel. MonthEy Labor Review, April 1950.
plete work history of persons from the time they enter covered employment until retirement or death.
The current continuous work-his- tory sample tabulations include 1 per- cent of all social security accounts established. The selections to the sample are made on the basis of digits in the account number. Once in- cluded, the account remains in the sample, which is augmented each year by accounts of those entering covered employment for the first time. Various tests have indicated that the sampling error in the continuous work-history sample approximates that which would result from a ran- dom selection of account numbers.
There are a number of limitations connected with the continuous work- history sample that must be kept in mind in analyzing the data. The prin- cipal limitations are due to the exist- ence of “multiple” accounts, the difli- culty of identifying all deceased and retired workers, the necessity of bas- ing the tabulations only on informa- tion posted before a cut-off date, the limited coverage of employments un- der the program, and the legal re- striction on the amount of wages that are taxable.
A number of individuals have taken out more than one account number, especially during the early years of the program. Some of these “mul- tiples” have been identiiled, while others are still unknown. When a “multiple” becomes known, no attempt is made to combine the person’s wage records until he applies for benefits. In recent years, however, careful scrutiny in issuing account numbers has kept the number of new “mul- tiples” to a minimum. Thus, the con- tinuous work-history sample tabula- tions are based on accounts and not on individuals, although, for most practical purposes, the difference be- tween the two is believed to be so in- significant that the data may be con- sidered as representing individual workers.
3
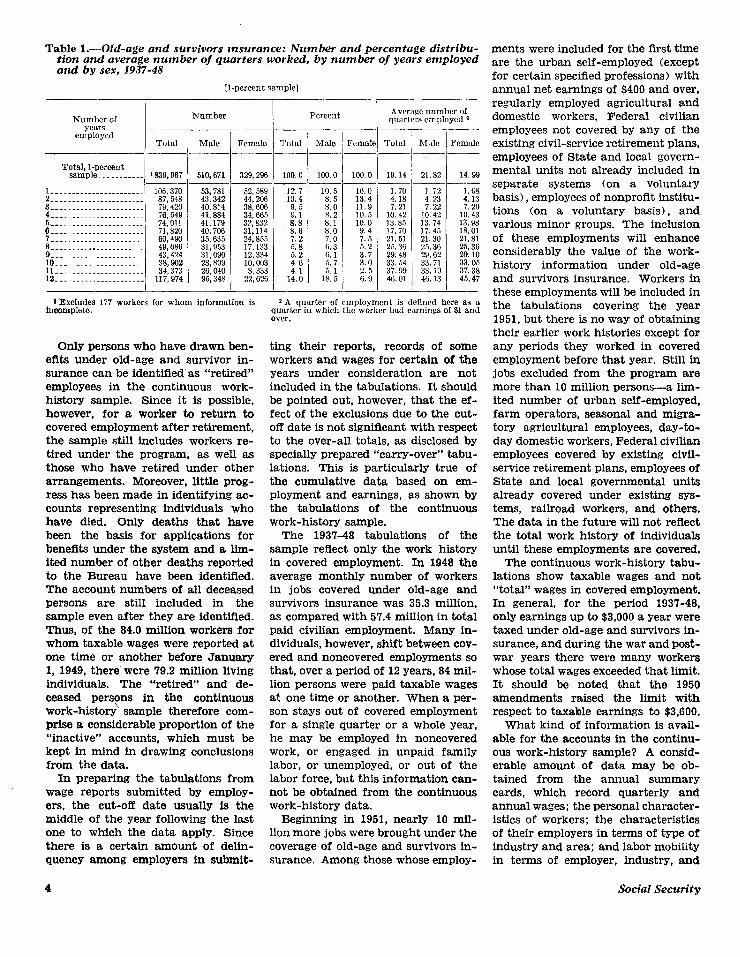
Table l.-Old-age and survivors msurance: Number and percentage distribu- tion and average number of quarters worked, by number of years employed and by sex, 1937-48
[l-percent sample]
Number
Total Male
Number of years
employed
Total, l-percent sample.. ._____ 1839,967
--
:::::::::::::~:::::::::: 106.370 87,548
3---..--------.--------- 79.420 4-_...--.....-.--._---.. 76,549
_ _ _ _ _ _ _ _ _ ~-:::II::::::::---.-----
74,011
7: ___________ --- _______. 71,820 60,490
a__-------...--...---..- 49,086 Q__-.._-_-..-----------. 43,424 IO---..---...-.-.-.----. 38,902 ll--..~~~.~----...~~~~~~ 34,373 12 ___.______ -__--- ______ 117,974
510,671 --
53,781 43,342 40,814 41,384 41,179 40,706 35,635 31,953 31,090 25,899 26,040 95,348
Femsle
329,296
52,589 44,206 38,606 34,665 32,832 31,114 24,855 17,133 12,334 10,003 8,333
22,626
fi Excludes 177 workers for whom information is incomplete.
*A quarter of employment is defined here as B auarter in which the worker had earnines of $1 and over.
Only persons who have drawn ben- eflts under old-age and survivor in- surance can be identified as “retired” employees in the continuous work- history sample. Since it is possible, however, for a worker to return to covered employment after retirement, the sample still includes workers re- tired under the program, as well as those who have retired under other arrangements. Moreover, little prog- ress has been made in identifying ac- counts representing individuals who have died. Only deaths that have been the basis for applications for beneAts under the system and a lim- ited number of other deaths reported to the Bureau have been identified. The account numbers of all deceased persons are still included in the sample even after they are identified. Thus, of the 84.0 million workers for whom taxable wages were reported at one time or another before January 1, 1949, there were 79.2 million living individuals. The “retired” and de- ceased persons in the continuous work-history sample therefore com- prise a considerable proportion of the “inactive” accounts, which must be kept in mind in drawing conclusions from the data.
ting their reports, records of some workers and wages for certain of the years under consideration are not included in the tabulations. It should be pointed out, however, that the ef- fect of the exclusions due to the cut- off date is not signiilcant with respect to the over-all totals, as disclosed by specially prepared “carry-over” tabu- lations. This is particularly true of the cumulative data based on em- ployment and earnings, as shown by the tabulations of the continuous work-history sample.
In preparing the tabulations from wage reports submitted by employ- ers, the cut-off date usually is the middle of the year following the last one to which the data apply. Since there is a certain amount of delin- quency among employers in submit-
The 1937-48 tabulations of the sample reflect only the work history in covered employment. In 1948 the average monthly number of workers in jobs covered under old-age and survivors insurance was 35.3 mlllion, as compared with 57.4 million in total paid civilian employment. Many in- dividuals, however, shift between cov- ered and noncovered employments so that, over a period of 12 years, 84 mil- lion persons were paid taxable wages at one time or another. When a per- son stays out of covered employment for a single quarter or a whole year, he may be employed in noncovered work, or engaged in unpaid family labor, or unemployed, or out of the labor force, but this information can- not be obtained from the continuous work-history data.
Beginning in 1951, nearly 10 mil- lion more jobs were brought under the coverage of old-age and survivors in- surance. Among those whose employ-
4
Percent
100.0
12.7 10.4 9. 5
ii 816 7.2 5.8 5.2 4. B 4.1
14.0
_- Male
100.0
10.5 8.5 8.0 8.2 8.1 8.0 7.0 6.3 6.1 5.7 5. 1
18.5
1
.-
-
- !
knab
100.0 19.14 21.82
16.0 1.70 13.4 4.18 11.9 7.21 10.5 10.42 10.0 13.85 9.4 17.70 7.5 21.51 5. 2 25.36 3.7 29.48 3.0 33.54 2. 5 37.99 6.9 46.01
1.72 4.23 7.22
10.42 13.74 17.45 21.30 25.36 $1 g 38.19 46.13
Average number of qunrtws employed 2
Total
-
Female
14.99
1.68 4.13 7.20
10.43 13.98 18.01 21.81 25.36 29.10 33.05 37.38 45.47
ments were included for the first time are the urban self-employed (except for certain specified professions) with annual net earnings of $400 and over, regularly employed agricultural and domestic workers, Federal civilian employees not covered by any of the existing civil-service retirement plans, employees of State and local govern- mental units not already included in separate systems (on a voluntary basis), employees of nonprofit institu- tions (on a voluntary basis), and various minor groups. The inclusion of these employments will enhance considerably the value of the work- history information under old-age and survivors insurance. Workers in these employments will be included in the tabulations covering the year 1951, but there is no way of obtaining their earlier work histories except for any periods they worked in covered employment before that year. Still in jobs excluded from the program are more than 10 million persons-a lim- ited number of urban self-employed, farm operators, seasonal and migra- tory agricultural employees, day-to- day domestic workers, Federal civilian employees covered by existing civil- service retirement plans, employees of State and local governmental units already covered under existing sys- tems, railroad workers, and others. The data in the future will not reflect the total work history of individuals until these employments are covered.
The continuous work-history tabu- lations show taxable wages and not “total” wages in covered employment. In general, for the period 1937-48, only earnings up to $3,000 a year were taxed under old-age and survivors in- surance, and during the war and post- war years there were many workers whose total wages exceeded that limit. It should be noted that the 1950 amendments raised the limit with respect to taxable earnings to $3,600.
What kind of information is avail- able for the accounts in the continu- ous work-history sample? A consid- erable amount of data may be ob- tained from the annual summary cards, which record quarterly and annual wages: the personal character- istics of workers; the characteristics of their employers in terms of type of industry and area; and labor mobility in terms of employer, industry, and
Social Security

geographical changes. By adding the data for each year to similar figures accumulated for previous years, it is possible to develop a picture over the years showing employment and earn- ings patterns, cumulative wages, cum- ulative employment in terms of quar- ters and years worked, and labor mo- bility. Thus far, however, the con- tinuous work-history tabulations have been limited, for the most part, to serve specific uses under the program -that is, to reflect the number of workers insured and their potential benefits-but it is hoped that future tabulations will afford a basis for more general uses of the data, especially as regards industry changes and other mobility data.
Table 2.-Old-age and survivors insurance: Percentage distribution of workers, by number of quarters and years employed, 1937-48
[l-percent sample]
Number of quar- ters with earn-
Percentage distribution of workers by specified number of years employed
._-._. I___._- I______ j . .._.. I._____ I_- _.-_ j ._____ I._ -... j -...__ I.----._ 6.9 54.2 _._____ 6.5 27.4 19.0 4.4 12.4 21.6 3.8 6.0 19.1 3.3 _____. 17.6 3.2 _____ 11.8 2.9 __ _ _ _. 6.9 2.9 _--___ 4.0 2.7 _ -- - _ _ _ _ _ ___ 2.7 _-.___ _____ 2.6 __.._. .____ 2.5 _.___. ___._
.__.__ .- _.._ ______ ) _ _. _ _ - _ _ _. _ - - - - - 5.6-e.-.. ______ _- ___. ___.__ I_____. ..____I ___... _...._ _______ 9. 7 1.7 ______ ____.. I ._____ ___... ._____ __--__ --.._. ----- __
11.9 t:;
.5 ___-.. ______ ___... ..____ __--.. --..__ ------_ 14.0 1.2 .l _______-_._. .._____---._--____-----_- 13.7 7.8 2.1 :: .l _._.__ ______ _---__ ..____ _---- _- 12.6 9.4 3.5 .____ __--__-...__------_ 13.3 10.3 4.7 1.3
:f (2) .l (2) ___-__- ._._________
9.3 11.4 6. 1 1.9 .4 _- ..__ _______ 6.1 11.4 7. 5 2.6 - 3.8 10.6 8.7 3.6 I:; .3 (2) (2) (2)
Economic Background, 1937-48 Before analyzing the work history
data for 1937-48, it is essential to look at the economic background of these 12 years. In general, this period rep- resented two extremes-the first part including the end of the depression of the thirties and the remainder cov- ering the relatively prosperous war and postwar years.
Unemployment declined from nearly 11 million in 1937 to less than 4 mil- lion at the end of 1941, when war pro- duction began to get under way. In 1937 and 1938 there was a depression within a depression, which was fol- lowed by some recovery in 1939, but it took the war to lift the economy out of the depression altogether. The depression was particularly hard on the very young and the very old work- ers, the former finding it difficult to get a footing in the labor market and the latter being forced out because of age discrimination in hiring.
2.4 ___.__.___________ 11.4 2.4 ___._ ._____ ._____ 8.0 2.3 ___-__ .____. ______ 5.1 2.2 _--___ ______ ----_. 3.6 2.1 ______ ._____ _____ _-____ 2.1 _---_. .____ ----_- --___ _ 2.0 _.____ _____ ..__ -. _____ _ 1.9 ___.. ._____ ______ _- ____ 1.8 __..__ ______ ____ _. ._____ . 1.8 ______ _____ ______ _____ _ _. 1.7 _ -. _ _ _ _ _ _ _ __ - -- - _ _ ____ _ -. 1.6. ___________,______ _______.
9.6 10. i 10.6 9.7 9.8 7.3 5. 1 2.9
.--__ ..__ ..___
4.6 5.5 6.8 8.0 9. 1 9.7 9.5 9.0 9.9 7.7
3”::
1.7 .5 2. 1 .7 2.8 1.0 3.6 1.3 4.5 1.8 5.6 2.3 6.3 2. 9 7. 5 3.8 8.0 4.4 9.0 5.2 8.8 6.4 8.8 6.9
1.5 ________.._.__ _______________..___ 11.3 7.5 1.5 _-____ ___.._ --.___ .____ _ --_.__ -.___. 8.3 8. 7 1.4 _.____ .__.__ ---___ ._____ ----__ -.__ _- 5.5 8.7 1.3 _-____ ____ -. ---.__ ._____ --____ -.___. 3.6 8.6 1.2.. ____________._______________ ____.____._ 10.1 1.2 _-____ ___.._ --____ ______ --____ -____. ----.. 8.5 1.2 _-.___ ____._ ---.__ _____ _ --____ .-__ _. ----.. 6.2 1.1 ______ ____ _- -----_ _____. -__-__ _____- -----. 3.8 l.l_-____ _____. --_--. _____ _ --_-__ .-___. -----. --_--- 1.0 __-___ ______ --____ ______ --_-__ .___._ -----. --_--- 1.0 ______ ___.__ --____ _____ _ ----__ .-___. ---... -._--- l.l______ ___-.-I .-_.__ ______ --____ ..___. --.... .._--.
.9 ___________________________ _ ________.._________.-..... 12.1 6.9
.Q ______ ._____ _____. ._____ _____. ___-__ ..____ ____.. . . . .._ 8.3 8.6
.8 ______ ._____ ______ _- ____ ______ _.____ ._____ __._.. __.._. 5.9 9.4
.9 ______ ______ _____ _.____ _____. ______ ._____ ____._ --..__ 4.3 10.2
.8 ______ ______ ______ ._____ ______ __.-__ ______ ______ __._ __ ______ 12.3
.8 ___-__ ._____ _____. ______ ______ _.._ __ _____. ______ __._._ _.____ 9.2
.8 ______ ____ __ ______ ______ ______ _- .___ _____. __.___ ._____ ..---- 7.1
.Q ______ ______ ____ -- _____ _____ __..__ ____.. __._.. . ..___ ______ 6.3
.Q _L____ _____. ______ ._____ _____. . . ..__ ______ __.___ ..____ _.____ ______ 1.1 __.___ ______ ---_-- --_--_ ------ ._-.__ ______ ______ . ..___ ._---- _----- 1.8 ______ ______ ______ ______ ______ ____ __ ____ -. __.___ ______ ______ ______ 7.1_____. _____. _ --___._____-----.-________._. 1. ..___,__________-___-___
,- 1 Excludes 177 workers for whom information is incomplete. ’ Less than 0.01 percent.
The period from 1942 to 1948. be- cause of war and postwar activities, was one of high employment. Unem- ployment dropped to the lowest levels ever reached in the history of the country. What unemployment re- mained was largely frictional. It was easy for anyone to obtain a job, whether he was young or old, male or female, a marginal or normal worker. Most of the young men, however, were soon drafted into the armed forces; since many of them did not return un- til 1946, gaps were created in their civilian work histories. The older workers once more found a place in
the labor market, and even the very old and other marginal employees ob- tained jobs and added years of em- ployment to their work histories. Lastly, many women of all ages were drawn into the labor force to meet the demands of a tight labor market. Some of these women left employ- ment during the postwar years, while others continued to work. The prog- nostications for mass unemployment following the cessation of hostilities were not fulfilled, and the relatively high level of employment was main- tained during the years 1946,1947, and 1948.
Even in normal times there is con-
siderable mobility of the working population, which affects the work his- tory of individuals. Persons con- stantly move in and out of the labor force, between employment and un- employment within the labor force, and, when employed, from occupa- tion to occupation, from employer to employer, from one industry to an- other, and from one locality to an- other. This mobility not only deter- mines their employment patterns, but it also affects their earnings patterns. In the early ages, workers dovetail em- ployment with school attendance, and after finishing school they may have intermittent employment until they
Bulletin, April 1951 5

get a firm foothold in the labor mar- ket. Many women who go to work stay in employment until they get married, then retire to raise a family, and sometimes return to the labor market later. Furthermore, many women who stay at home also combine their household activities with part- time jobs or seasonal work. Mention already has been made of the inter- mittency of work by older workers caused by technological changes and restrictive hiring policies of employ- ers. There must be added the effect of disability, retirement, or death on the work history of individuals.
It should be pointed out that, al- though many persons worked exclu- sively in industrial and commercial establishments covered under old-age and survivors insurance, there were also many others who shifted be- tween covered and noncovered indus- tries. This was especially true during and after the war. In the war years, for example, many workers shifted into covered employment from agri- culture, domestic work, and other noncovered occupations, while others moved out of covered employment to work for the Federal Government. During the postwar years, on the
other hand, this shift was reversed, with many workers moving from cov- ered employment back into agricul- ture and other noncovered occupa- tions, while there was a fairly large- scale exodus out of the Federal Gov- ernment into covered employment.
Duration of Covered Employ- ment
The in-and-out movement in cov- ered employment results in consider- able variation among workers in the duration of their covered employ- ment, as shown in table 1, which clas- sifies the individuals who worked at one time or another from 1937 through 1948 by the number of years in which they earned some wage credits.
In terms of the number of years with some wage credits, the largest group numerically is that composed of individuals who worked in every year of the period. It will be remem- bered that this group numbered 11.8 million persons, constituting 14 per- cent of all workers with taxable wages during 1937-48. If it had not been for the interruption in the covered em- ployment of many individuals as the result of inductions into the armed forces, this number would have been
considerably larger. By contrast, the next largest group-lo.6 million work- ers, or 13 percent of the total-con- sisted of those who were employed only during a single year within this period. Most of these workers consti- tute the fringe element in covered em- ployment, although many of the l- year workers who were employed dur- ing 1948 no doubt continued in cov- ered employment in succeeding years. Except for the la-year workers, the number of persons decreases gradu- ally as the duration of employment increases; those who worked 11 years out of the entire period amounted to 3.4 million, or 4 percent of the total.
Relatively more women than men worked short periods of time during the U-year span from 1937 to 1948. As many as 16 percent of the women with taxable wages during the period worked only 1 year, as against 11 per- cent of the men. In fact, the propor- tion of women exceeded that for men for each duration of employment of 7 years or less; the totals amounted to 79 percent for women and 58 per- cent for men. On the other hand, the proportion of men exceeded that for women for each duration of employ- ment above 7 years. The greatest dif-
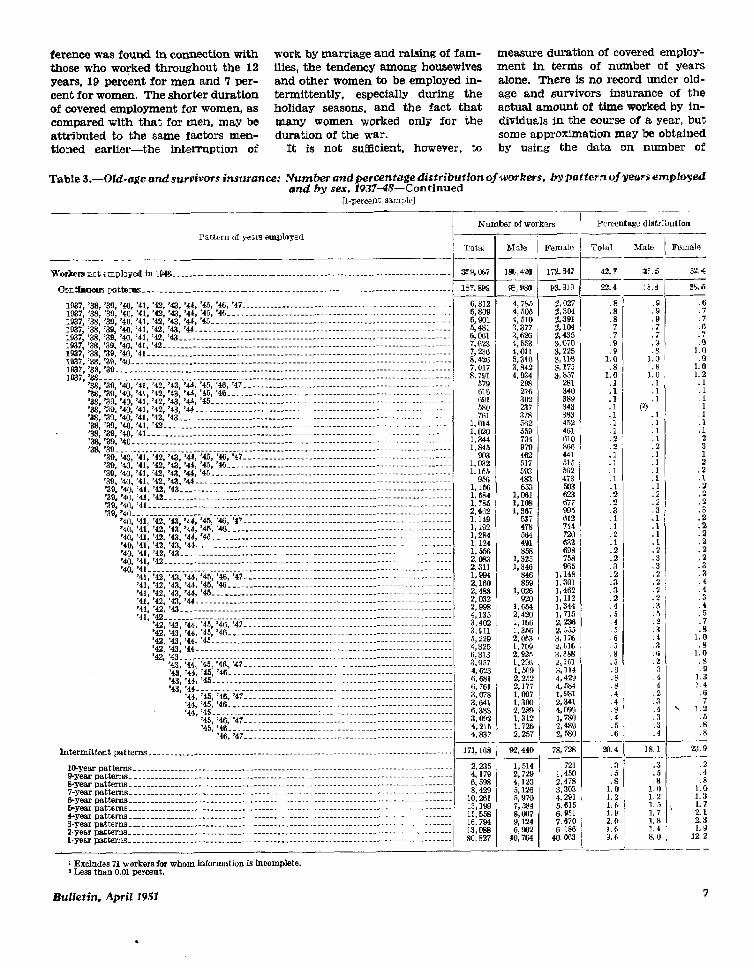
Table 3.-Old-age and survivors insurance: Number andpercentage distribution of workers, bypattern of years employed and by sex, 193748
[l-percent sampio]
I Number of workers Percentage distribution
Pattern of years employed / Total ( Male / Female ( Total ( Male Female
Totsl,l-percentsample--..- _________._ _______ _______ _.- ..___.._. -- ______.__________. ___...__ Il840,073 1 510,732 / 329,341 1 100.0 100.0 1
~- Intermlttentpatterns.-....-----..-----.-.------------------------------..---------.------------- 189,091 1 139,630 / 49,i
l-yesrpatterns--....-.......-.-.-.......----.--..--.-----.-..................-.........-.-.....-. / 13.003 j 12,529 1 25,532 1 3.0 2.5 ______
See footnotes at end of table.
28.8
6.9 .6
1:: 1.9
E 2.7 2. 1 2.5 2.9
1.3 1.2 1.3 1.4 1.5 1.9 2.1 1.9 1.5 .Q
6 Social Security
ference was found in connection with those who worked throughout the 12 years, 19 percent for men and 7 per- cent for women. The shorter duration of covered employment for women, as compared with that for men, may be attributed to the same factors men- tioned earlier-the interruption of
work by marriage and raising of fam- ilies, the tendency among housewives and other women to be empIoyed in- termittently, especial& during the holiday se&sons, and the fact that many women worked only for the duration of the war.
If is not sufEcient. however, to
measure duration of covered employ- ment in terms of number of years alone. There is no record under old- age and survivors insurance of the actual amount of time worked by in- dividuals in the course of & year, but some approximation may be obtained by using the data on number of
Table 3 .--Old-age and survivors insurance: Number undpercentage distrihtion and by sex, 1937-S-Continued
I - _- Total Male Female -~
172,647 WAY13
zl 389 343 383 452 461 610
E 515 562 4i3 503
Et 095 012 714 rx 633 698
is
lW7, ‘33, ‘39, ‘40, ‘41, ‘42, ‘43, ‘44, ‘43, ‘46, ‘47 ____________________--.. _______._ _ ____... . . .._ . . . .__ 1517, ‘88, ‘39, ‘40, ‘41, ‘42, ‘4s, ‘44, ‘45, ‘4fL __ ____________________-..---------. i -.---......--... .-- I&37, ‘88, ‘39, ‘40, ‘41, ‘42, ‘43, ‘44, ‘45- _. _- _._________________________________i____-.-.-..-... ---- IEe7, ‘$3, ‘39, ‘40, ‘41, ‘42, ‘43, ‘44- - _ - __ _ _. . __-----_ __-- ----. -- . . ----. ..-. . ---- -. -. -. ---. 1837,‘38,‘39,‘40,‘41,‘~,‘43 ___-_______________----.----------.-.-..-------- *--- ----..---... ---- 1837,‘38,‘39,‘40,‘41,‘4a--- ____-._____________.-----------------.-...-------- --.---.... -.-.---- 1937, ‘38, 39, ‘40, ‘41__________ i ____________________-~~~~~~.~~~....~~~~~~-~~~,-----.---.--...---. Ig37.‘38,‘39,‘40~-.~-~~~----~-~~~-~.-~~~~~-~.-----~-~~.-~--~.~-~...~~~.~.~-~~--.--.......-..-..- 1937,‘38, ‘80 ________________________________________---------..--.---.------ ------- ----- ------- IE%37,‘33 ___._._____________________________ ____._____._____.__.________ .___-----.__._..-..----
‘83, 30, ‘40, ‘41, ‘42, “43, ‘44, ‘45, ‘46, ‘47 _______________ _L_.____ --.- _____--..._____.....---- ‘38,‘30,t40,‘41,‘42,‘43,‘c(,‘45,’46 ____________________--.-----....---- <------- --.. --.---.- ‘LB, ‘39, ‘40, ‘41. ‘42, ‘43, ‘4h, ‘45_ _. _ ___ ____________ _ __-_-__ _ ___ _ _--- _ ____ --. . ___. _. . ..-. ‘38, ‘39, ‘40, ‘41, ‘42,‘43, ‘4d _____.___________ _________ ._____._. --- _____-....e---..-... --.. ‘38, ‘39, ‘40, ‘41, ‘42, ‘43 ___.________________--------.--..--.-----. ---- ___---.-..__.._....-.. ‘38, ‘39. ‘40,‘41, ‘42 ___.____________________________ -...- _______._. _____-.-_._....._._...-. ‘38.‘39. ‘4o.W ______________ _ __________ _ ___________ -..- _.___. ._._____....___.._..-.--....
‘40: -- _ ---________ --- - ___________________--~.~~.----~...~~~~~~~-------------------- :%! -..----‘.---...-‘---,--- _ ..__________________---.-.-- ____-- ______-.....-.-..-. ------ I:845 ‘.$Q ‘41, ‘42, ‘43, ‘46, 45, ‘46, ‘47-m. ___________________. _________....___._..-----.-. 003 ‘40, ‘41, ‘42, ‘43, ‘44, ‘43, ‘46- _ _ _____________.__.___---...-.--------.. ---..-. .----... 1,032 ‘40, ‘41, ‘42, ‘43, ‘44, ‘45. __ ________________...__ __ ___-_.- ______:-. . . --... -. ---. 1.155 ‘43, ‘41, ‘42, ‘4&W ___._____ _ _____________.___ _ ___._ _.-- .______.....-----_ _ _.--.... 9.56 ‘40, ‘41, ‘42. ‘43--- _____ __________ _ _______ __....___ ___.___ .____._.. .------- _ . . .--.-. 1,X6 ‘.Kl, ‘41,‘ti _..._______.._______.---. ____.._..._ _ ____. -._.- _____.~~~~~~.---...~.... l.S.4 ‘40, ‘41______________.._____________ -____.__ . ..______ -_.- .___.__.....--.--. _.._ ..-. 1.7% ‘40 _________________ ____________---________ ______._...__.._. _.--------..-.- _ ..-. 2,652 ‘40, ‘41, ‘42, ‘43, ‘41, ‘45, ‘46. ‘47 ____________._________ --_- ____.__.-._.. -....-.-. ..-- 1.149 340, ‘41, ‘42, ‘43, ‘44, ‘45, ‘46- __ _____________ _._ .___ __ _.- .___ __.. _ -_.___ _. . __ __-._ _ 1,192 ‘40. ‘41, ‘42, ‘43, ‘4.4, ‘46-m. ___L________________---.-.-.-----------.-----... .---- ---- 1.264 ‘40, 141, ‘42, ‘43, ‘44--. .__________--______..~~~~.-...-..-----~-.--.---.-... .---- ---- 1,124 ‘40. ‘41.‘42. ‘43 ___._____________________ ________ -.._ ______.. __-. - ---.._.. _ -.-- --- 1,556 ‘40;‘41;‘42: ____________________--------.-----..-. -- _..._ .._.._.--.-.....- _ .-...-. I
$32
2: 160 /
2E 4: 510 3,377 3,626 4,533 4,011 5.310 3,842 4,934
298 276 302 237 378 x12 xl9 734
it
‘E
1,E I, 108 1%;
478
z
1,:: 1,346
846 L14b s59 1,301
1,026 1.462 920 1,112
i% I:166
1,344 1, il.5 2,236
1.3w 2, I&5
f:g i 3,176 2. 616 2.925 3.3a3 1.m 2,751 i2% 3,114
2: 17i z2 ;$.f. ! I: 981
2:289 2,341 4,098 1,312 1, iso 1.m 2,439 2,257 2,580
2L.4
:i .S ,i .i
:: 1.0
1::
:: .1
::
::
:2”
:: .l .l .l 2
.2
:i
:‘z
:4
:i .2
:i
:Z .5 .4 5
:s
:i .s
:i .a
1:
:i
::
20.4
1:
1:: 1.2
:; :i .7
1::
1:: 1.2 .l
:: ,l .1 1
:1
:Z
:i .2 .1
:Z
1:
I;
:i
:3”
::
:i
1:
:i 1.0 .8
1.0 .s .9
1.3 1.4 .6 .i
‘41, ‘42, ‘#,‘# ______ _ ______________________ _ . .._..__._..___.__._....._....___. i ‘41, ‘42.‘43 ___.________________----------...-...--.--.- _.__ --.-.._.._ e--e----!
;:g
‘41; ‘42_-.~-_~~..~~~~~.~~~~-~~---~~~~-~~~~~~~--.~~.~~.~..~.~--..-.-~.~.~.--..--l 4: 135 ‘42, ‘43, “44. ‘45, %6, ‘47- _ _______ ____ -._ ._.._. _..__.. ____...._. _ 3,492 ‘42, ‘43, ‘44. ‘45, ‘46 ______________.._.__.-...-..-....-. -_ ---.-.-.-._ _ --..... 3,911 ‘42,‘48, ‘44,‘45 ____ _ ______________ ______ .._.._. -_ ._.__.--...-.._._..-..-. i 5,225 ‘45 ‘48, ‘44 ._____________________________ -_._ .-_. _.____._._.._...__.._. --- 4,325
6,313 ~.i?+“& ‘4!5,‘46,‘47 _________ __- ____._..___ - __...._.____________________: 3,957 ‘43, ‘44, ‘45, ‘46--. ____________________-.-----.-.-.--------...-.----.--- ‘A?.‘&,‘45 ________.___________--.-.-..--. __._._.. _ .~.~-~~.._...~~...~ I
4,623 6.331 6,761 3, G78 3,641 6,388 3.092 4.215
40, 4,-.-.----..----...-....--.--.....-..-.....-..-.-...-- 4. s37
Intermittentpatterns.--.-.---.----------...---.--.--.-...---.....--.---..-.-------.-.---.--- 171,168
10-J”earpetterns~~..~~...~..~~~.~~..~~~~~~~~~~~~-~~~~~.~.~.~.~.~--...~~~-~-..~~~~~........~~.... 2,235 *yearpattems~~..~~~~~~.~~~~~.~~.~~~~.~~~~~~~~~~~~~.~~~....~..-..~~.~.---.~.~~~~~.....~.~~.... 4,178 E-yesrpsttems~~~.~~~~~~~.~~~~~~.~~~~~~~.~~~-~~~~~~~.~~~~~.~~-.--~.~-~...~-~~~~~.~.~....~~~--.~ 6,598 7-yearpsttems~~...~~~~~~~.~~..~.~~~.~~.~~~.~~~~~.~.-~.~~.~.~--~~-..~...-~....~.~......~~~~--.. 8.428 6-yearpatterns~~.~.~~~~.~~~~~.~~~~..~~~~~~~.~~~~~~~-.~~~-~~.~.-.~~..~-..~~-~~.~.~.~.....~~~--.- lO.!m 6-Yempatt.ems _________________._ * _________________. -_ ______ I . ..__. -_- .._____._........_--- ----. 13,LBS 4-yeupattmLs~~~ _.__________________----... ._______.-____._... -..-..---- ___... _ .-...... _ ----- 15,553 3-yearpa!tems ____.__________________ _ _____.. _________________.__--......---. _ __._ -- _.._______, 16, ?M 2-yeerpattmm _-______________ I .-_-_-____._.__________________ -.- .___ . . .___._._..._..._. --- 13,@3.8 1Tt?arpattems _-_____ _ _.______________.___-. -__- __-__________ ___._. --.- .._____.....__._..- ---- so, 827
.2
:i .?
.8
.4
:: .2
::
:; .3 . ::
\ 1.2 5
.3
.4 :i --
IS. 1 23.9 ~___-
1: :: .S .a
1.0 1.0 1.2 1.3 1.5 ., 1.7 1.7 1.8 I
2 1 as
1.4 1. Y 8.0 12.2
_I-
_-
.-
.- 92.440 1 78,728
1,514 2,729 4.120 5,126 5,970 7,584
9%
4$%
-I- 721
1,450 2.478
:%z j.615 6.951 7.670 fi 186
40, Qxi
1.6 1.9 2.0
I I.6 3.6
- 1 Excludes 71 workers for whom information is incomplete. 1 Less than 0.01 percent.
.

quarters worked.3 The average num- ber of quarters worked ranged from 1.70 for persons employed in only 1 year to as much as 46.01 for those who worked every year during the period. It will be seen that the aver- age number of quarters worked per year rose with each increase in num- ber of years of employment. Thus, the l-year workers averaged less than 2 quarters for the year, the 4-year workers about 2 l/2 quarters, the 8- year workers more than 3 quarters, and the la-year workers nearly 4 quarters a year. There was little dif- ference between male and female workers in the average number of quarters worked.
The extent to which individuals worked throughout the years during which they were employed may be seen further from the data shown in table 2, which presents a percentage distribution of workers, classified ac- cording to the number of quarters worked for each duration of covered employment.
According to these data, if a person worked steadily every year during the la-year period, the chances are great that he will have worked every quar- ter during the 12 years. Thus, of the la-year employees, as many as 52 per- cent worked during every quarter in each of the 12 years. Thirteen per- cent missed only 1 quarter during the entire period, and 98 percent of the total worked 3 or more quarters a Year. Even among the ll-year em- ployees, however, there were some whose attachment to the covered la- bor force was nominal, as evidenced by the fact that a few of them worked as little as 1 quarter during each of the 12 years in covered employment.
On the other hand, if an individual worked only 1 year in covered employ- ment, the chances are that he will have worked only in 1 quarter during the year. Thus, as many as 54 per- cent of the l-year workers were em- ployed only in a single quarter dur- ing the year. About 2’7 percent worked 2 quarters; 12 percent, 3 quarters; and only 6 percent, during every quarter in the year. This distribution emphasizes the casual attachment to the covered
3A quarter of employment is defined here as a quarter in which the worker had earnings of 81 or more.
labor force of most persons with only 1 year of employment. It must be pointed out, however, that some of the l-year workers took jobs in 1948 and undoubtedly continued in covered em- ployment.
There was no such concentration in the number of quarters worked by persons who had 2-11 years of em- ployment. The 6-year workers, for example, were employed from as little as a single quarter a year to every quarter during *that period. There were 7 percent who worked 6-11 quar- ters; about 38 percent, 12-17 quarters; 51 percent, 18-23 quarters; and only 4 percent, as many as 24 quarters, or every quarter during the 6 years. Even the ll-year workers showed relatively little concentration in the number of quarters worked. Less than 1 percent worked from 11 to 21 quar- ters; about 12 percent, between 22 and 32 quarters; and the remainder, 33 or more quarters. The largest concen- tration-12.3 percent-consisted of those who worked 41 quarters. Only 6.3 percent worked during every quar- ter in the period.
Pattern of Covered Employ- ment
The work experience of individuals with wage credits during 1937-48 may also be summarized in terms of pat- tern of employment; table 3 shows the distribution of workers by type of pat- tern of years employed during the pe- riod.
An examination of this distribution indicates that the majority of the workers under the program are con- tinuously employed in covered indus- tries. Thus, of the 48.1 million work- ers in 1948, as many as 26.6 million, or well over half, had 2 or more years of employment that were consecu- tive. The largest group numerically was also that with employment dur- ing every one of the years in the pe- riod: this group constituted nearly half of those with continuous pat- terns. Of the remaining workers em- ployed in 1948, 18.9 million had in- termittent patterns of 2 or more years -that is, they worked in years that were not all consecutive. The inter- ruptions in continuous employment were short for many workers-for ex- ample, for the more than 2 million lvho worked for 11 years out of the
ll-year period. Many other Persons with intermittent patterns would have had continuous employment had they not been drawn into the armed forces: their continuity of employ- ment may thus have been interrupted from 1 to 5 years. Lastly, there were 2.6 million individuals with l-year patterns who had worked in 1948 for the first time, and a large proportion of them undoubtedly continued in covered employment.
Even among the workers who left covered employment before 1948, the majority were continuously employed in covered industries for 2 or more years consecutively. Thus, of the 35.9 million workers with wage credits who were not employed in 1948, as many as 18.8 million, or more than half, had continuous patterns of 2 years or more. By contrast, 17.1 million had intermittent patterns. As many as 8.1 million worked in covered employ- ment for only 1 year: these workers constituted a fringe element in cov- ered employment.
The effect of the war and Postwar prosperity on employment is shown by the data for some of the continu- ous patterns. For workers with tax- able wages in 1948, a.s well as those not employed in that year, the number of individuals in the continuous pat- terns beginning in 1941 or later is larger than the number in continuous patterns that began in 1938, 1939, or 1940. This fact seems to indicate that the war demand for workers was met by many persons who had not been in covered employment before 1941; some of them were unemployed in- dividuals who had been looking for work but not finding it, others were attracted into the labor force by higher wages and other factors, and still others shifted from noncovered to covered employment.
Generally speaking, relatively more men than women had long continuous patterns. Workers in the continuous patterns starting in 1940 or earlier, who were still employed in 1948, in- cluded 22 percent of all the men with wage credits during 1937-48 but only 9 percent of the women. On the other hand, the pmportion who had con- tinuous patterns that began in 1941 or later, and who still had employment in 1348, amounted to only 12 percent for men and 20 percent for women.
8 Social Secus it y
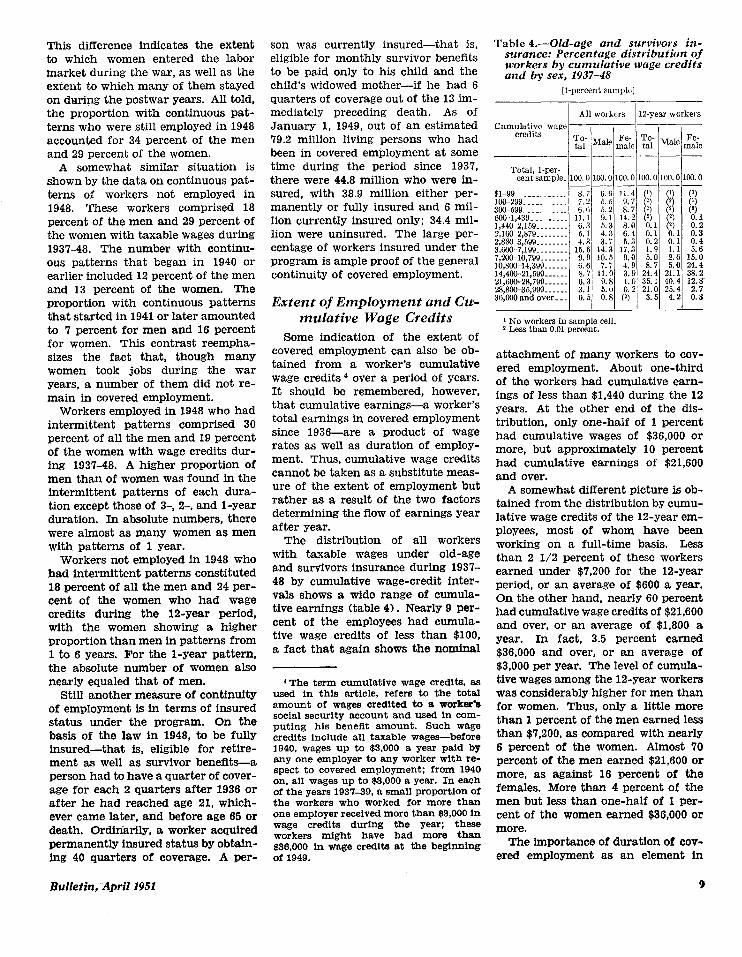
This difference indicates the extent son was currently insured-that i.s, Table 4.-Old-age and survivors in- to which women entered the labor eligible for monthly survivor benefits smance: Percentage distribution of market during the war, as well as the to be paid only to his child and the workers by cumulative wage credits
and by sex, 193748 extent to which many of them stayed child’s widowed mother-if he had 6 [l-percent sample] on during the postwar years. All told, quarters of coverage out of the 13 im- the proportion with continuous Pat- mediately preceding death. As of All workers 12-year workers
terns who were still employed in 1948 January 1, 1949, out of an estimated cum~l~;~ wage accounted for 34 percent of the men 79.2 million living persons who had ;ll- ‘Male ztie T$ Male ,“ie and 29 percent of the women. been in covered employment at some ______-__~--
A somewhat similar situation is time during the period since 1937, Total, l-per- shown by the data on continuous pat- there were 44.8 million who were in- cent sample. loo. 0 100.0 100.0 100.0 100.0 100.0
terns of workers not employed in -~~__-
sured, with 38.9 million either per- $l-QQK .__________ 8.i 6.9 11.4 0)
1948. These workers comprised 18 manently or fully insured and 6 mil- loo-299 . .._ _ ______ 7.2 5.5 9.7 (:) ii] ii/ 300-599...-. ..____ 6.0 5.2 8.7 (9
percent of the men and 29 percent of lion currently insured only; 34.4 mil- 60+1,439 ___._____ 11. 1 9. 1 14.2 (2) (2) 0.1
the women with taxable wages during 1,440-2,159.. ______ 6.3 5.3 8.0 0.1 (V 0.2
lion were uninsured. The large per- Z,lGo-2,879 ________ 5.1 4.3 6.4 0.1 0.1 0.3
1937-48. The number with continu- centage of workers insured under the 2,88&3,599 ________ 4.3 3.7 5.3 0.2 0.1 0.4 3,600-7,199 ________ 15.6 14.3 17.3 1.9 1.1 6.6
ous patterns that began in 1940 or program is ample proof of the general 7,XW10,799 _______ 9.9 10.5 9.0 5.0 2.6 15.0 10,800-14,399 ______ 6.6 7.7 4.9 8.7 5.0 24.4
earlier included 12 percent of the men continuity of covered employment. 14,400-21,599 ______ 8.7 11.9 3.9 24.4 21.1 38.2
and 13 percent of the women. The 21,6W-28,799 ______ 0.3 9.8 1.0 35.1 40.4 12.8’ 28,80+35,999 ______ 3.1 5.0 0.2 21.0 25.4 2.7
proportion with continuous patterns ~~~~~~ oj ~~~~~~~~~~ and cum 36,000and over--. 0.5 0.8 (9 3.5 4.2 0.3
that started in 1941 or later amounted mulative Wage Credits * No workers in sample cell. to 7 percent for men and 16 percent 2 Less than 0.01 percent.
for women. This contrast reempha- Some indication of the extent of
sizes the fact that, though many covered employment can also be ob- tained from a worker’s cumulative
attachment of many workers to cov- women took jobs during the war ered employment. About one-third years, a number of them did not re- wage credits 4 over a period of years. of the workers had cumulative earn- main in covered employment. It should be remembered, however,
that cumulative earnings-a worker’s ings of less than $1,440 during the 12
Workers employed in 1948 who had total earnings in covered employment t ‘b t.
years. At the other end of the dis- intermittent patterns comprised 30 ri u ion, only one-half of 1 percent percent of all the men and 19 percent since 1936-are a product of wage h d a cumulative wages of $36,000 or of the women with wage credits dur- rates as well as duration of employ- more, but approximately 10 percent ing 1937-48. A higher proportion of merit. Thus, cumulative wage credits had cumulative earnings of $21,600 men than of women was found in the cannot be taken as a substitute meas- and over. intermittent patterns of each dura- ure of the extent of employment but A somewhat different picture is ob- tion except those of 3-, 2-, and l-year rather as a result of the two factors tained from the distribution by cumu- duration. In absolute numbers, there determining the flow of earnings Year lative wage credits of the la-year em- were almost as many women as men after year.
The distribution of all workers ployees, most of whom have been
with patterns of 1 Year. working on a full-time basis. Less Workers not employed in 1948 who with taxable wages under old-age than 2 l/2 percent of these workers
had intermittent patterns constituted and survivors insurance during 1937- 48 by cumulative wage-credit inter-
earned under $7,200 for the la-year 18 percent of all the men and 24 per- period, or an average of $600 a year. cent of the women who had wage vals shows a wide range of cumula- On the other hand, nearly 60 percent credits during the la-year period, tive earnings (table 4). Nearly 9 per- had cumulative wage credits of $21,600 with the women showing a higher cent of the employees had cumula-
tive wage credits of less than $100, and over, or an average of $1,800 a
proportion than men in patterns from year. In fact, 3.5 percent earned 1 to 6 years. For the l-year pattern, a fact that again shows the nominal $36,000 and over, or an average of the absolute number of women also $3,000 per year. The level of cumula- nearly equaled that of men. 4 The term cumulative wage credits, as tive wages among the la-year workers
Still another measure of continuity used in this article, refers to the total was considerably higher for men than of employment is in terms of insured amount of wages credited to a worker’s for women. Thus, only a little more status under the program. On the
social security account and used in com- puting his beneflt amount. Such wage than 1 percent of the men earned less
basis of the law in 1948, to be fully credits include all taxable wages-before than $7,200, as compared with nearly insured-that is, eligible for retire- 1940, wages up to $3,000 a year paid by 6 percent of the women. Almost 70 ment as well as survivor benefits-a any one employer to any worker with re- percent of the men earned $21,600 or person had to have a quarter of cover- spect to covered employment: from 1940
on, all wages up to $3,000 a year. In each more, as against 16 percent of the age for each 2 quarters after 1936 or of the years 1937-39, a small proportion of females. More than 4 percent of the after he had reached age 21, which- the workers who worked for more than men but less than one-half of 1 per- ever came later, and before age 65 or one employer received more than 63,000 in cent of the women earned $36,000 or death. Ordinarily, a worker acquired wage credits during the year; these more.
workers might have had more than permanently insured status by obtain- $36,000 in wage credits at the beginning The importance of duration of cov- ing 40 quarters of coverage. A per- of 1949. ered employment as an element in
Bulletin,-April 1951 9
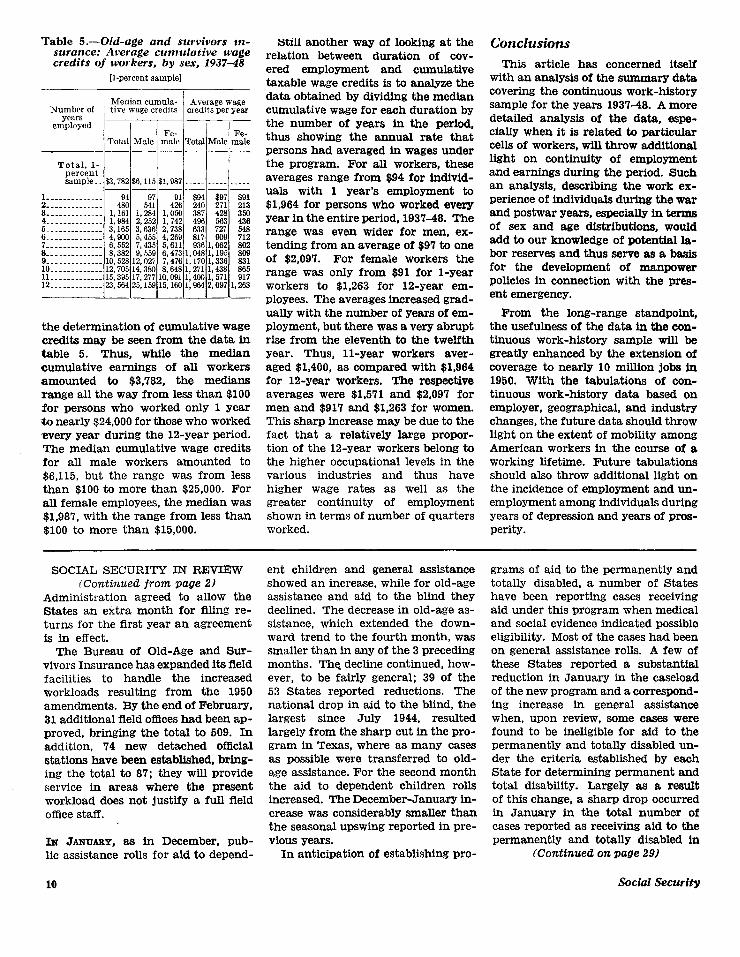
Table S.-Old-age and survivors m- surance: Average cumulative wage credits of workers, by sex, 1937-48
[l-percent sample]
Median cumula- Number of
A4verage wage tive wage credits credits per year
years __ employed
Fe- Fe- Total Male male Total Male male
---_____-
Total, l- percent eamp!e.. $3,782 56,115 $1,987 _.__. _____ _____
l-____------.__ 9487--r&--G-G 2 ___-_- _ ------_ 480 541 426 240 271 213 3 -___-- _ ----.__ 1,161 1,284 1,050 387 428 356 4 . ..___________ 1,984 2,252 1,742 496 563 436 6.. .___________ 3,165 3,636 2,738 633 727 648 6 _..___________ 4,900 5,455 4,269 817 909 712 7-u.. __________ 6,562 7,435 5,611 9361,062 802 8 ______________ 8,382 9,559 6,4731,0481,195 809 9 ___. _ .________ 10,5%12,027 7,4761,1701,336 331 10 __.____._.___ 12,70514,380 8,6481,2711,438 865 ll...___ ..~~.~~15,39517,27710,0911,4@61,571 917 12 . .._____.____ ~,56425,15915,1601,9642,0971,263
the determination of cumulative wage credits may be seen from the data in table 5. Thus, while the median cumulative earnings of all workers amounted to $3,782, the medians range all the way from less than $100 for persons who worked only 1 year to nearly $24,000 for those who worked every year during the la-year period. The median cumulative wage credits for all male workers amounted to $6,115, but the range was from 1eSS than $100 to more than $25,000. For all female employees, the median was $1,987, with the range from less than $100 to more than $15,000.
Stiii another way of looking at the relation between duration of cov- ered employment and cumulative taxable wage credits is to analyze the data obtained by dividing the median cumulative wage for each duration by the number of years in the period, thus showing the annual rate that persons had averaged in wages under the program. For all workers, these averages range from $94 for individ- uals with 1 year’s employment to $1,964 for persons who worked every year in the entire period, 193748. The range was even wider for men, ex- tending from an average of $97 to one of $2,097. For female workers the range was only from $91 for l-year workers to $1,263 for la-year em- ployees. The averages increased grad- ually with the number of Years of em- ployment, but there was a very abrupt rise from the eleventh to the twelfth year. Thus, 11-year workers aver- aged $1,400, as compared with $1,964 for la-year workers. The respective averages were $1,571 and $2,097 for men and $917 and $1,263 for women. This sharp increase may be due to the fact that a relatively large propor- tion of the la-year workers belong to the higher occupational levels in the various industries and thus have higher wage rates as well as the greater continuity of employment shown in terms of number of quarters worked.
Conclusions
This article has concerned itself with an analysis of the summary data covering the continuous work-history sample for the years 193748. A more detailed analysis of the data, espe- cially when it is related to particular cells of workers, will throw additional light on continuity of employment and earnings during the period. Such an analysis, describing the work ex- perience of individuals during the war and postwar years, especially in terms of sex and age distributions, would add to our knowledge of potential la- bor reserves and thus serve as a basis for the development of manpower policies in connection with the pres- ent emergency.
From the long-range standpoint, the usefulness of the data in the con- tinuous work-history sample will be greatly enhanced by the extension of coverage to nearly 10 million jobs in 1950. With the tabulations of con- tinuous work-history data based on employer. geographical, and industry changes, the future data should throw light on the extent of mobility among American workers in the course of a working lifetime. Future tabulations should also throw additional light on the incidence of employment and un- employment among individuals during years of depression and years of pros- perity.
SOCIAL SECURITY IN REVIEW (Continued from page 2)
Administration agreed to allow the States an extra month for filing re- turns for the first year an agreement is in effect.
The Bureau of Old-Age and Sur- vivors Insurance has expanded its field facilities to handle the increased workloads resulting from the 1950 amendments. By the end of February, 31 additional fleld oillces had been ap- proved, bringing the total to 509. In addition, 74 new detached ofilcial stations have been established, bring- ing the total to 87; they will provide service in areas where the present workload does not justify a full Aeld omce staff.
IN JANUARY, as in December, pub- lic assistance rolls for aid to depend-
10
ent children and general assistance showed an increase, while for old-age assistance and aid to the blind they declined. The decrease in old-age as- sistance, which extended the down- ward trend to the fourth month, was smaller than in any of the 3 preceding months. The decline continued, how- ever, to be fairly general; 39 of the 53 States reported reductions. The national drop in aid to the blind, the largest since July 1944, resulted largely from the sharp cut in the pro- gram in Texas, where as many cases as possible were transferred to old- age assistance. For the second month the aid to dependent children rolls increased. The December-January in- crease was considerably smaller than the seasonal upswing reported in pre- vious years.
In anticipation of establishing pro-
grams of aid to the permanently and totally disabled, a number of States have been reporting cases receiving aid under this program when medical and social evidence indicated possible eligibility. Most of the cases had been on general assistance rolls. A few of these States reported a substantial reduction in January in the caseload of the new program and a correspond- ing increase in general assistance when, upon review, some cases were found to be ineligible for aid to the permanently and totally disabled un- der the criteria established by each State for determining permanent and total disability. Largely as a result of this change, a sharp drop occurred in January in the total number of cases reported as receiving aid to the permanently and totally disabled in
(Continued on page 29)
Social Security