the contribution made by beer to the european economy · the contribution made by beer to the ......
TRANSCRIPT

The Contribution made by Beer to the European Economy
THE CONTRIBUTION MADE BY BEER TO THE EUROPEAN ECONOMY
Employment, value added and tax -Full report, European & country chapters- Amsterdam, January 2006 Ernst & Young Netherlands Regioplan Policy Research Nieuwezijds Voorburgwal 35 1012 RD Amsterdam Tel.: 020 - 5315315 Fax : 020 - 6265199

The Contribution made by Beer to the European Economy

The Contribution made by Beer to the European Economy
LIST OF CONTENTS Preface ..............................................................................................................................1 Key messages on the economic impact of beer...................................................................3 1 High spin-off effects on employment ...........................................................................5 2 Productivity and value added .......................................................................................9 3 Tax and excise revenues important to state finance ...................................................13 4 World market leaders, SMEs and microbreweries .....................................................15 5 Austria .......................................................................................................................17 6 Belgium ......................................................................................................................25 7 Cyprus .......................................................................................................................33 8 Czech Republic...........................................................................................................39 9 Denmark .....................................................................................................................47 10 Estonia .......................................................................................................................55 11 Finland .......................................................................................................................61 12 France .......................................................................................................................69 13 Germany .....................................................................................................................77 14 Greece .......................................................................................................................85 15 Hungary ......................................................................................................................91 16 Ireland .......................................................................................................................97 17 Italy .....................................................................................................................105
The Contribution made by Beer to the European Economy
18 Latvia .....................................................................................................................113 19 Lithuania...................................................................................................................119 20 Luxembourg .............................................................................................................125 21 The Netherlands........................................................................................................131 22 Poland .....................................................................................................................139 23 Portugal.....................................................................................................................147 24 Slovakia ....................................................................................................................155 25 Slovenia ....................................................................................................................163 26 Spain .....................................................................................................................169 27 Sweden .....................................................................................................................177 28 United Kingdom .......................................................................................................185 29 Bulgaria ....................................................................................................................193 30 Croatia .....................................................................................................................199 31 Romania....................................................................................................................205 32 Turkey .....................................................................................................................211 33 Norway .....................................................................................................................217 34 Switzerland ...............................................................................................................225 Annex I: validation of results - methodology & data used .............................................231 Annex II: how most important variables are estimated...................................................233 Annex III: Glossary.........................................................................................................235

The Contribution made by Beer to the European Economy 1
PREFACE The Brewers of Europe commissioned a study on the economic impact of the brewing sector. Ernst & Young have conducted this study in the period of April to December 2005 and we are proud to present herewith the main results. The economic impact of the brewing sector has been analysed and described at both the level of Europe as a whole and at the level of in-dividual countries. The study has focused on the 25 member states of the enlarged European Union (EU-25) and also on Norway, Switzerland, Croatia, Bulgaria, Romania and Turkey. In this, the full report, we present the results at both the European and the national level; for a summary of the main results at the European level we refer to the summary report on Europe. The economic impact of the brewing sector has been described in terms of employment due to the production and sale of beer, the contribution to the European economy in terms of va-lue added and in terms of tax revenues collected by national governments. In the study we have distinguished between the direct and indirect impacts of the brewing sector, with the lat-ter describing both the impact on supply sectors to the brewing sector and the impact of the sale of beer on the retail and hospitality sectors. The report therefore gives some measure of the contribution that the brewing sector is making to the EU’s aims, within the Lisbon Strategy, of ensuring a more dynamic and stronger EU economy in the future. Conducting this study at the scale of Europe has only been possible with the help of the na-tional associations for the brewing sector. Individual brewing companies have been an im-portant source of information as well and we would like to thank both national associations and brewing companies for their commitment to this study. Professor Carl Koopmans from the University of Amsterdam, Faculty of Economics, has also commented on the methodolo-gy used and we would like to thank him for sharing his knowledge on economic impact ana-lysis with us. The study has been conducted by a team of economic researchers from Regioplan Policy Re-search, subsidiary of Ernst & Young Netherlands, consisting of Marco Mosselman, Remco Meijer and Herbert ter Beek. Amsterdam, January 2006 Herbert ter Beek Project manager Regioplan Policy Research, Ernst & Young Netherlands [email protected]

The Contribution made by Beer to the European Economy 2

The Contribution made by Beer to the European Economy Key messages 3
KEY MESSAGES ON THE ECONOMIC IMPACT OF BEER
Europe’s brewing sector contributes substantially to productivity, employment and the Euro-pean economy’s competitiveness. The direct economic impact of the breweries constitutes only a small fraction of their total economic impact. The following are some key messages to illustrate the employment effect: • European breweries provide jobs for 164,000 employees, while 2.6 million jobs can be
attributed to the brewing sector. • Each brewery job is matched by two jobs in the supplying sectors. Some 342,000 supply-
sector employees owe their jobs to beer. • Sale of beer in the hospitality sector and through retailers generates considerable employ-
ment: a total of 2.1 million jobs in pubs, restaurants and shops. Of these more than 1.9 million are in the hospitality sector.
For the European Union (EU-25) it is estimated that of all those employed (194.4 million in 2004) around 1.2 percent owe their jobs directly or indirectly to the production and consump-tion of beer. The total employment effect of the brewing sector is then comparable to the to-tal employment of countries such as Slovakia, Finland or Denmark (2.2 to 2.6 million jobs). In terms of productivity and the value added impact of breweries: • The total contribution of the brewing sector to the European economy in terms of value
added is 57.5 billion euros. • Some 21 percent of this is generated directly by the brewing sector (12 billion euros).
Supply sectors (20 percent), hospitality sector (56 percent) and retail (3 percent) account for the rest.
• The total production value of European breweries is 34 billion euros, generating an eco-nomic impulse of 22 billion euros for the supplying sectors.
• The largest fraction of these euros spent on supplied goods and services concerns purcha-ses made in the services sector (including marketing and media). The 9.8 billion euros spent on services generates some 100,000 jobs in the services sector.
• The indirect economic impact of the brewing sector on agriculture is very significant; the 3.9 billion euros spent on agricultural products generate around 147,000 jobs in this sec-tor.
• Consumers spend an estimated 125 billion euros on beer annually, of which some 72 per-cent is spent in the hospitality sector.
• European breweries produce 416 million hectolitres beer, of which 23 million hectolitres is exported to outside Europe.

The Contribution made by Beer to the European Economy Key messages 4
A total contribution to the European economy of 57.5 billion euros in terms of value added can be compared to the gross domestic product of the Polish or Austrian economy in the last quarter of 2004. The total gross domestic product (GDP) of the European Union (EU-25) is some 10,354 billion euros in 2004, meaning that the contribution made to the European eco-nomy by the brewing sector is around 0.55 percent of total GDP. National governments receive a total of 39 billion euros in tax revenues from the production and sale of beer. VAT revenues paid by consumers are the most important revenue source at around 19 billion euros. Excise revenues equal 10.5 billion euros and corporate taxes are esti-mated at almost 900 million euros. Direct personal taxes paid by workers are estimated at 8.4 billion euros. A total of 39 billion euros in tax revenues is comparable to the total government consumption expenditure of Spain in the first quarter of 2005 (defined as the value of goods and services produced by the Spanish government and all goods and services purchased by the Spanish government from market producers). It represents more than the total annual government ex-penditure of countries such as Finland or Poland (estimated at around 34 billion euros). In addition to employment, value added and tax revenues for governments, the brewing sec-tor also generates other benefits to the European economy. Brewing companies are very ac-tive in sponsoring all kinds of cultural and sports events. Brewing companies are concerned about the well-being of the local communities in which they work, also investing in working conditions of their employees. Furthermore in many countries in Europe, salaries in the bre-wing sector are high when compared to most other sectors. Investigating these other benefits to the European economy, some of which are difficult to quantify, has not been part of the Ernst & Young study. This economic impact study covers 30 countries in Europe. Included are the 25 member sta-tes of the European Union1 and also Norway, Switzerland, Croatia, Bulgaria, Romania and Turkey.
***
1 Malta has not been included because of difficulties in obtaining data.

The Contribution made by Beer to the European Economy Employment 5
1 HIGH SPIN-OFF EFFECTS ON EMPLOYMENT
European breweries provide jobs for around 164,000 workers. However, this direct employ-ment represents only a slight fraction of the total employment impact of 2.6 million jobs. For each job offered in the brewing sector, one job is generated in retail, two in the supplying sectors and almost twelve in the hospitality sector.
160,500 164,000
342,000
1,935,000
Direct effect (employment in brewing sector)
Indirect effect(employment at brewers’ suppliers)
Retail
Total employment impact due to production and sale of beer: 2.6 million jobs
160,500 164,000
342,000
1,935,000
160,500 164,000
342,000
1,935,000
Direct effect
Indirect effect(employment at brewers’ suppliers)
Hospitality sector
Retail
Total employment impact due to production and sale of beer: 2.6 million jobs
160,500 164,000
342,000
1,935,000
160,500 164,000
342,000
1,935,000
Direct effect (employment in brewing sector)
Indirect effect(employment at brewers’ suppliers)
Retail
Total employment impact due to production and sale of beer: 2.6 million jobs
160,500 164,000
342,000
1,935,000
160,500 164,000
342,000
1,935,000
Direct effect
Indirect effect(employment at brewers’ suppliers)
Hospitality sector
Retail
Total employment impact due to production and sale of beer: 2.6 million jobs
Jobs in the brewing sector are spread across Europe, with concentrations of direct employ-ment to be found in Germany and the United Kingdom, followed by a number of Central and Eastern European countries such as Poland, the Czech Republic and Romania.
Direct employment: 164,000 jobs
20%
13%
9%6%5%5%
5%3%
3%3%3%2%
23%
GermanyUnited KingdomPolandCzech RepublicRomaniaSpainNetherlandsBelgiumFranceSwedenDenmarkAustriaOther countries
Direct employment: 164,000 jobs
20%
13%
9%6%5%5%
5%3%
3%3%3%2%
23%
GermanyUnited KingdomPolandCzech RepublicRomaniaSpainNetherlandsBelgiumFranceSwedenDenmarkAustriaOther countries

The Contribution made by Beer to the European Economy Employment 6
The production of beer by breweries is only possible because various sectors provide the necessary goods and services, ranging from barley, hops and malt to energy and transpor-tation capacity, and including a variety of industrial products and services. Some 342,000 jobs in these supplying sectors can be attributed to the production of beer:
0 50,000 100,000 150,000 200,000 250,000 300,000 350,000 400,000 (jobs)
Indirectemployment
Agriculture Utilities Packagingindustry
Equipmentand other industries
Transport Media andmarketing
Otherservices
43.1%
2%
12.4%
4.5%
8.6% 11.7% 17.8%
0 50,000 100,000 150,000 200,000 250,000 300,000 350,000 400,000 (jobs)
Indirectemployment
Agriculture Utilities Packagingindustry
Equipmentand other industries
Transport Media andmarketing
Otherservices
0 50,000 100,000 150,000 200,000 250,000 300,000 350,000 400,000 (jobs)
Indirectemployment
Agriculture Utilities Packagingindustry
Equipmentand other industries
Transport Media andmarketing
Otherservices
43.1%
2%
12.4%
4.5%
8.6% 11.7% 17.8%
The brewing sector purchases goods and services from supplying sectors worth 22 billion euros. Almost 45 percent of the total purchases made by European breweries involve the ser-vices sectors (including marketing and media):
0 5,000 10,000 15,000 20,000 25,000 (million euro)
Purchases made 17.4% 16.3%
8.2%
9.7% 13.9% 30.6%
Agriculture Utilities Packagingindustry
Equipment and other industries
Transport Media andmarketing
Other services
3.9%
0 5,000 10,000 15,000 20,000 25,000 (million euro)
Purchases made 17.4% 16.3%
8.2%
9.7% 13.9% 30.6%
Agriculture Utilities Packagingindustry
Equipment and other industries
Transport Media andmarketing
Other services
3.9%
The charts above show that the agricultural sector receives some 18 percent of the breweries’ total expenditures on supplies. Agriculture also generates 43 percent of the indirect employ-ment. The explanation is that turnover and labour costs per worker are relatively low in the agricultural sector. A one million euro impulse in the agricultural sector generates around 38 jobs, whereas the same impulse into marketing and media or other services generates 10 jobs. In addition to the direct and indirect impact of the brewing sector, the number of jobs created by the sale of beer in the hospitality and retail sectors exhibits a far greater effect. More than 1.9 million jobs in the hospitality sector can be attributed to the sale of beer, with another

The Contribution made by Beer to the European Economy Employment 7
160,500 jobs in retail. For countries where the on-trade segment of the beer market is relati-vely important, employment in the hospitality sector tends to be relatively high. Examples are Ireland, Spain, Portugal, the United Kingdom and Slovenia with over 60 percent of beer being sold in pubs and restaurants. The largest fraction of total jobs in the hospitality sector related to beer sales is however found in Germany:
Employment in the hospitality sector: 1,935,000 jobs
21%
19%
10%6%6%
5%
3%3%3%3%3%3%
2%
13%
GermanyUnited KingdomSpainItalyPortugalPolandFranceNetherlandsRomaniaBelgiumCzech RepublicTurkeyIrelandOther countries
Employment in the hospitality sector: 1,935,000 jobs
21%
19%
10%6%6%
5%
3%3%3%3%3%3%
2%
13%
GermanyUnited KingdomSpainItalyPortugalPolandFranceNetherlandsRomaniaBelgiumCzech RepublicTurkeyIrelandOther countries

The Contribution made by Beer to the European Economy Employment 8

The Contribution made by Beer to the European Economy Productivity and value added 9
2 PRODUCTIVITY AND VALUE ADDED
The direct, indirect and induced contribution of the brewing sector to the European economy is considerable. The total economic contribution from the production and sale of beer in Europe is around 57.5 billion euros:
Value added due to production and sale of beer: 57.5 billion euro
1.811.95
11.3
32.5
Breweries
Supplying sectors
Hospitality industry
Retail
Value added due to production and sale of beer: 57.5 billion euro
1.811.95
11.3
32.5
Breweries
Supplying sectors
Hospitality industry
Retail This total of 57.5 billion euros value added is generated by 2.6 million employees working for the breweries, in supplying sectors and in the hospitality and retail sectors. Average value added per employee is therefore some 22,000 euros a year. Value added per European brewe-ry employee is far higher, averaging some 73,000 euros a year, illustrating European brewe-ries’ high productivity. The average brewery productivity in terms of value added per employee is also much higher than the average productivity in other industrial sectors such as packaging and equipment. European breweries together produce almost 416 million hectolitres of beer. Some 55 million hectolitres are exported (around 13 percent of total beer production), illustrating the fact that the beer market is very much an international one. However consumers in many countries also prefer to drink domestically, and locally, brewed beers. European beer is appreciated worldwide, which explains why almost 23 million hectolitres are exported to countries out-side Europe with the United States the most important target market. Exports are especially important for countries such as Denmark, the Netherlands, Belgium and Ireland where the percentage of exports compared to total domestic beer production lies between 47 and 57 percent. The strong export position of these countries is partly explained by the fact that these are home to some of the world’s largest brewing companies. Beer ex-

The Contribution made by Beer to the European Economy Productivity and value added 10
ports however involve not only the larger brewing companies. To illustrate: of all 48 profes-sional breweries in the Czech Republic only 5 do not export:
0%
10%
20%
30%
40%
50%
60%
Den
mar
k
Net
herla
nds
Bel
gium
Irel
and
Luxe
mbu
rg
Esto
nia
Portu
gal
Ger
man
y
Fran
ce
Gre
ece
Italy UK
Aus
tria
Turk
ey
Slov
akia
Finl
and
Lith
uani
a
Spai
n
Pola
nd
Exports as a percentage of total domestic beer production
European average
0%
10%
20%
30%
40%
50%
60%
Den
mar
k
Net
herla
nds
Bel
gium
Irel
and
Luxe
mbu
rg
Esto
nia
Portu
gal
Ger
man
y
Fran
ce
Gre
ece
Italy UK
Aus
tria
Turk
ey
Slov
akia
Finl
and
Lith
uani
a
Spai
n
Pola
nd
Ger
man
y
Fran
ce
Gre
ece
Italy UK
Aus
tria
Turk
ey
Slov
akia
Finl
and
Lith
uani
a
Spai
n
Pola
nd
Exports as a percentage of total domestic beer production
European average
The size of the European market is estimated at around 124 billion euros (including VAT). Almost three-quarters of the market is covered by beer consumption in pubs and restaurants. In terms of volume the retail channel is however more important (off-trade market). Of total European consumption of around 392 million hectolitres, it is estimated that over 57 percent is purchased in supermarkets and other retail outlets.
167
225
0
50
100
150
200
250
Volume (million hl) Value (billion euro)
On trade Off trade
0
50
100
150
200
250
million hl billion euro
167
89.9
225
34.5
0
50
100
150
200
250
Volume (million hl) Value (billion euro)
On trade Off trade
0
50
100
150
200
250
million hl billion euro
167
225
0
50
100
150
200
250
Volume (million hl) Value (billion euro)
On trade Off trade
0
50
100
150
200
250
million hl billion euro
167
89.9
225
34.5
0
50
100
150
200
250
Volume (million hl) Value (billion euro)
On trade Off trade
0
50
100
150
200
250
million hl billion euro

The Contribution made by Beer to the European Economy Productivity and value added 11
With a total production volume of 392 million hectolitres, Europe is the world’s most impor-tant beer producer, followed by China and the United States (around 250 and 230 million hectolitres respectively). Europe is also the number one producer of malting barley, malt and hops. Around 50 percent of global hops production is of European origin. Germany is by far the most important hops producing country, followed by Poland and the Czech Republic. The United States accounts for some 29 percent of global hops production2:
29% 6%
4%
11% 18%
3%
0 20,000 40,000 60,000 80,000 100,000
hop production (mton)
Germany Czech Republic Poland Rest of Europe America Asia Rest of world
29%29% 6%
4%
11% 18%
3%
0 20,000 40,000 60,000 80,000 100,000
hop production (mton)
Germany Czech Republic Poland Rest of Europe America Asia Rest of world
29%
Europe also leads the world in malting barley production, with some 55 percent of the global output being produced in Europe. France, the United Kingdom and Germany are major pro-ducers of the barley malt and malt in Europe3:
malting barley (tons)
3,300
2,4201,650
1,420
800
420
1,970
malt (tons)
1,750
1,360
1,350700
480
460
2,035FranceUnited KingdomGermanyDenmarkCzech RepublicSweden
Rest of Europe
BelgiumSpain
11,980,000 tons 8,135,000 tons
malting barley (tons)
3,300
2,4201,650
1,420
800
420
1,970
malt (tons)
1,750
1,360
1,350700
480
460
2,035FranceUnited KingdomGermanyDenmarkCzech RepublicSweden
Rest of Europe
BelgiumSpain
11,980,000 tons 8,135,000 tons
2 Joh. Barth & Sohn, The Barth Report: Hops, June 2004. 3 According to statistics of Euromalt (November 2005).

The Contribution made by Beer to the European Economy Productivity and value added 12

The Contribution made by Beer to the European Economy Tax and excise revenues 13
3 TAX AND EXCISE REVENUES IMPORTANT TO STATE FINANCE
The financial revenues for European governments arising from the production and sale of beer are extremely substantial. Taxes paid by breweries, beer consumers and employees to-gether total around 39 billion euros a year.
Total tax and excise revenues: 38.8 billion euros
530
7,900
5,300
10,500
890
13,700
Excise
Corporate tax
VAT on trade
VAT off trade
Personal direct tax
Personal direct tax other
Total tax and excise revenues: 38.8 billion euros
530
7,900
5,300
10,500
890
13,700
530
7,900
5,300
10,500
890
13,700
Excise
Corporate tax
VAT on trade
VAT off trade
Personal direct tax
Personal direct tax other
The most important source of European government revenues is VAT. European consumers pay an average 18 percent Value Added Tax (VAT) on their beer consumption. VAT reve-nues are therefore estimated at 19 billion euros a year for home and hospitality sector con-sumption put together. Excise revenues also contribute significantly to national treasuries with around 10.5 billion euros being collected annually in excise duties. Due to relatively high excise duties per hectolitre of beer produced, countries such as the United Kingdom, Ireland, Norway, Finland and Sweden are amongst the top ranked in Europe in terms of excise revenues. Another source of government revenue is the personal direct taxes paid by brewery em-ployees and those people in the supplying sectors, in retail and in the hospitality sector whose jobs can be attributed to beer. These personal direct employees’ taxes total over 8.3 billion euros.

The Contribution made by Beer to the European Economy Tax and excise revenues 14

The Contribution made by Beer to the European Economy World market leaders, SMEs, microbreweries 15
4 WORLD MARKET LEADERS, SMEs AND MICROBREWERIES
The brewing sector is one of the few in which several European-based companies are amongst the leading companies in the world. European beer brands are sold worldwide, either produced in Europe and exported, or manufactured abroad under licence or by subsi-diaries of European brewing companies. There are also many very dynamic and innovative small and medium sized companies (SMEs) and microbreweries. Germany alone has over 1,250 breweries, while in countries such as Belgium, the United Kingdom, the Czech Republic, Poland, Austria, the Netherlands, France, Lithuania and Romania the brewing sector landscape is highly diverse with 45 or more breweries per country. The number of European breweries can be estimated at more than 2,800, but this figure is constantly changing as microbreweries spring up across the European landscape. In many countries the number of breweries is growing fast; in Austria for example the figure has soared 60 breweries in 1980 to over 140 today. In the brewing sector many companies combine traditions that are often centuries old with modern technology and innovative market approaches and consumers appreciate this combi-nation of innovative technology and tradition. Beer brands are among the most popular brands in many European countries, with many consumers having strong loyalty towards lo-cal, regional or national brands. Employees also value the brewing sector, as one with relati-vely high productivity per employee and therefore good conditions in terms of wages and other labour conditions. Brewing companies are also very active in local communities, sup-porting many clubs and events, and on a national and global level through the sponsorship of major sports competitions and clubs. Brewers also take their social responsibility very se-riously, contributing, through financing and other support, to campaigns to tackle drink dri-ving and other forms of misuse of their products.

The Contribution made by Beer to the European Economy World market leaders, SMEs, microbreweries 16

The Contribution made by Beer to the European Economy Austria 17
5 AUSTRIA: ECONOMIC IMPACT OF BEER
5.1 Highlights on economic impact
The economic impact of the brewing sector on the Austrian economy is substantial: • Direct employment connected to the Austrian breweries is estimated to be 4,100 jobs. • Employment in supplying sectors is very important with a total number employed in these
sectors because of the brewing sector of around 4,060. • The impact on the hospitality sector is also huge, with around 30,000 people earning a li-
ving in this sector due to beer sales. • In retail another 2,500 jobs can be attributed to beer sales. • Government also benefits from the production and sale of beer. Excise revenues, VAT
revenues and personal direct taxes paid by brewery employees and workers in other sec-tors whose jobs can be attributed to ‘beer’ (especially the hospitality sector, retail and the supplying sectors) together amount to some 825 million euros a year.
The total employment effect is thus estimated to be 41,000 jobs.
Total employment because of beer: 41,000 jobs
direct effect (breweries)
indirect effect (suppliers)
hospitality industry
retail
10%
10%
74%
6%
Total employment because of beer: 41,000 jobs
direct effect (breweries)
indirect effect (suppliers)
hospitality industry
retail
10%
10%
74%
6%
All these jobs generated through the production and sale of beer contribute substantially to the Austrian economy in terms of value added. Total value added generated by the brewing sector in Austria and all economic activities within the supply, hospitality and retail sectors generated due to the production and sale of beer is estimated at 1.4 billion euros:

The Contribution made by Beer to the European Economy Austria 18
49
367
221
761
Value added due to production and sale of beer: 1,400 million euros
Breweries
Supplying sectors
Hospitality industry
Retail
49
367
221
761
49
367
221
761
Value added due to production and sale of beer: 1,400 million euros
Breweries
Supplying sectors
Hospitality industry
Retail
Value added due to production and sale of beer: 1,400 million euros
Breweries
Supplying sectors
Hospitality industry
Retail The share of the brewing sector in overall value added due to production and sale of beer equals 27 percent, which is much higher than the share of the brewing sector in total employ-ment due to beer. An important explanation for this is the high productivity of employees in the brewing sector compared to sectors such as retail and hospitality in terms of value added.
***

The Contribution made by Beer to the European Economy Austria 19
5.2 Market and industry structure, trends and developments
The production of beer in Austria, measured in hectolitres, has not changed significantly in recent years. In 2000 total production amounted to 8.75 million hl, in 2003 it was slightly higher with a volume of 8.89 million hl, and the first estimate for 2004 shows production fal-ling to 8.67 million hl. Beer exports and beer imports show a different pattern, with exports currently 0.58 million hl, where it has been as high as 1 million hl in 1994. Imports show a steady increase and now amount to more than 0.555 million hl4:
Key variables Millions hectolitres5 Illustration
• Production 8.89 Level of production is stable in recent years
• Exports 0.46 Around 32 percent is exported to Italy (in 2001)
• Imports 0.55
• Consumption 8.98 Constant level, as with production
• Draught
• Home consumption 65% The percentage of beer sold on-trade has slightly fallen since 1994 (from 36 to 35 percent)6
The number of breweries has increased since 1980, from 59 breweries then to 143 today. Ma-ny are small (‘microbreweries’). If the smallest breweries are not counted, there are 61 bre-weries in Austria7: Category Number of production units Estimated market share < 50,000 hl per year 112 < 20,000 hl
9 with 20-50,000 hl 1.8% 3.5%
50,000 – 100,000 per year 6 3.8% 100,000 – 500,000 per year 9 21.7% 500,000 – 1,000,000 per year 1,000,000 – 2,500,000 per year
7 with 500-1,500,000 hl 69.2%
2,500,000 – 5,000,000 per year > 5,000,000 per year The market share of the larger breweries, measured in the volume of beer sold in hl, has in-creased significantly, from 43.5 percent in 1980 to 69.2 percent at the moment. The brewing company with the largest market share has a market share of 53 percent. This brewing com-pany is part of one of the major European brewing companies since 2003. There are two runners up, both with a market share of around 9 percent (750-800,000 hl a year). 4 Verband der Brauereien Österreichs, Statistische Daten über die österreichische Brauwirtschaft: 1980-2004, 2004. 5 Data shown is for 2003. 6 In 2001 the market share of casks was 31 percent. 7 Verband der Brauereien Österreichs.

The Contribution made by Beer to the European Economy Austria 20
The economic impact of the brewing sector is influenced by the following trends, develop-ments and characteristics of the Austrian economy:
Brewing sector internal characteristics Context in which the brewing sector operates • Consumers are loyal to their local beer (brand
and type of beer) • Beer consumption per capita is high (109
litres) from a European perspective (only in the Czech Republic and in Germany is avera-ge consumption per head higher)
• Average production of the professional brewe-ries (excluding the microbreweries) amounts to 142,000 hl a year
• Austria has a well developed cluster of sup-plying sectors to the brewing sector, so that even though the country is relatively small, a large proportion of purchases by breweries are made domestically
5.3 Direct effect of brewing sector
Brewing sector turnover for 2004 was € 880 million8. The industry employs some 4,250 workers (of whom 4,100 work for the 61 ‘professional’ breweries).
0
1
2
3
4
5
6
7
8
9
10
output of which exports
millions hl
0
100
200
300
400
500
600
700
800
900
1,000
supplies
valueadded
euro (mln.)
0
500
1,000
1,500
2,000
2,500
3,000
3,500
4,000
4,500
employment
0
100
200
300
400
500
600
700
800
900
euro (mln.)
VAT
excise
Taxes paidby workers
0
1
2
3
4
5
6
7
8
9
10
output of which exports
millions hl
0
1
2
3
4
5
6
7
8
9
10
output of which exports
millions hl
0
100
200
300
400
500
600
700
800
900
1,000
supplies
valueadded
euro (mln.)
0
500
1,000
1,500
2,000
2,500
3,000
3,500
4,000
4,500
employment
0
500
1,000
1,500
2,000
2,500
3,000
3,500
4,000
4,500
employment
0
100
200
300
400
500
600
700
800
900
euro (mln.)
VAT
excise
Taxes paidby workers
0
100
200
300
400
500
600
700
800
900
euro (mln.)
VAT
excise
Taxes paidby workers
The sector generated € 367 million of added value, plus an additional € 206 million in excise duties (in 2003). Tax revenues from the production and consumption of beer are estimated at around 825 mil-lion euros. At around 450 million euros, VAT revenues are the largest fraction of these tax revenues for the Austrian government (around 300 million euros arises from the on-trade sale of beer). Excise revenues are estimated at 206 million euros and the remaining fraction of tax revenues (187 million euros) consists of personal direct taxes paid by employees of the 8 Estimate based on Ottakringer Brauerei: € 73.5 million euros turnover in 2004 with 751.3 million hl sold. For 2002 Eurostat presents a production value for Austrian breweries of 886 million and a value added of 367 million euros.

The Contribution made by Beer to the European Economy Austria 21
brewing sector and workers in other sectors whose jobs can be attributed to the production and consumption of beer (i.e. in supplying sectors and in the hospitality sector and in retail). With total production value of 880 million euros, around 58.6 percent is spent on goods and services delivered by supplying sectors, so that these supplying sectors benefit from the brewing sector (the indirect effect of the brewing sector). 5.4 Economic impact of breweries on suppliers of goods and services
In 2003 Austrian brewers spent an estimated € 515 million on purchased goods and services9. Based on data from one of the Austrian breweries and input-output data from Statistik Austria), it is estimated that the largest fraction of purchases made by the Austrian breweries in sectors such as utilities, transport, packaging industry and services is made domestically. For agricultural products and other industrial products the fraction of imports from abroad is higher. The largest proportion of total employment generated by the brewing sector in the supplying sectors consists of employment in the agricultural sector, followed closely by the services sectors (including media and marketing). The impact on agriculture is estimated using the ratio between total turnover and the total labour force in this sector (respectively 4.8 billion euros and 161,000 workers), so that with a domestic stimulus of 30 million in agriculture, it can be estimated that the brewing sector generates around 1,000 jobs in agriculture. The following table depicts the indirect employment effect of the brewing sector on supply sectors. The table shows that the brewing sector induces around 4,060 jobs in the supply sec-tors.
9 Source: Eurostat.

The Contribution made by Beer to the European Economy Austria 22
Sectors Stimu-lus
Stimulus for the Austrian economy
Personnel costs10 Labour costs per employee
(mln. €) % (mln. €) % of stimu-lus
(mln. €) (in €)
Number of em-ployees
• Agriculture 67 45% 30 1,001• Utilities 18 100% 18 16% 3 64,452 46• Packaging industry 74 75% 56 21% 12 42,408 276• Equipment +other 12 30% 4 21% 1 42,408 18• Transport 62 95% 58 25% 15 39,132 374• Media, marketing 177 75% 133 25% 33 59,376 561• Services + other 103 85% 87 25% 22 59,376 367Total 513 387 2,641Primary impact as % of total impact 65%Total indirect effect of brewing sector 4,064
Total employment generated in the supplying sectors is estimated at around 4,060 jobs. The indirect employment effect is split up as follows: Indirect employment
0 500 1,000 1,500 2,000 2,500 3,000 3,500 4,000 4,500
Agriculture
Utilities
Packaging Media, marketing
TransportationEquipment
Services
Indirect employment
0 500 1,000 1,500 2,000 2,500 3,000 3,500 4,000 4,500
Agriculture
Utilities
Packaging Media, marketing
TransportationEquipment
Services
10 Personnel costs as a percentage of total output of industries and labour costs per employee are obtained from Eurostat data.

The Contribution made by Beer to the European Economy Austria 23
5.5 Retail and hospitality sectors
In 2004, around 35 percent of the total beer volume was sold through on-trade outlets. The remaining 65 percent was sold off-trade.
Hospitality sector
Estimating the proportion of total employment in the hospitality sector attributable to the brewing sector: • Around 35 percent of beer consumption in Austria occurs in the hospitality sector. • This means 3 million hl are sold by Austrian pubs, restaurants and the like. • The average consumer price of beer sold on-trade in Austria is estimated at around 6
euros per litre (including VAT), so that total consumer spending on beer (including VAT) is estimated at 1.8 billion euros.
• With a VAT tariff of 20 percent, this results in total consumer spending on beer of around 1.5 billion euros (excluding VAT).
• With an average turnover per employee in the hospitality sector (excluding VAT) of € 50,900, this means some 29,950 people are employed in the hospitality sector due to beer sales.
Retail
The employment impact of beer sales on retail can be similarly assessed: • Around 65 percent of total beer sales in Austria is beer sold off-trade in supermarkets and
other retail outlets. • This means 5.8 million hl of beer are sold off-trade in Austria. • The average consumer price of beer sold off-trade in Austria is estimated at 1.36 euros
per litre (including VAT), so that total consumer spending on beer (including VAT) is es-timated at around 800 million euros.
• With a VAT tariff of 20 percent, this results in total consumer spending on beer of around 660 million euros (excluding VAT).
• With an average turnover per employee in the hospitality sector (excluding VAT) of € 261,200, this means some 2,520 people are employed in the hospitality sector through beer sales.
***

The Contribution made by Beer to the European Economy Austria 24

The Contribution made by Beer to the European Economy Belgium 25
6 BELGIUM: ECONOMIC IMPACT OF BEER
6.1 Highlights of economic impact
The economic impact of the Belgian brewing sector can be expressed as follows: • Belgium is an important beer country containing many breweries of various sizes pro-
ducing a wide range of beer types. • Belgian breweries also export a substantial volume; with 50 percent of its beer exported.
Belgium ranks third in Europe, just behind Denmark and the Netherlands. • The direct employment in Belgian breweries is estimated at 6,025 jobs. • Although Belgium is a relatively small European country, because there is a well-
developed cluster of brewing sector suppliers a large proportion of brewers’ goods and services purchases are made in Belgium, benefiting Belgian suppliers in a range of sectors and creating around 5,425 jobs.
• Because more than half of the beer consumed in Belgium is sold on-trade (in pubs), the brewing sector generates important effects for the hospitality sector, where it generates 50,875 jobs. Beer sold in supermarkets generates another 1,250 jobs.
• Belgium’s government also benefits from beer, with excise revenues amounting to 207 million euros and a total of 700 million euros in VAT collected on beer sales (in the hos-pitality sector and retail). The employment generated raises another 375 million euros for the Belgian government in direct personal taxes.
Overall, the production and consumption of beer in Belgium generates some 63,575 jobs:
Total employment due to production and sale of beer: 63,575 jobs
9%
9%
80%
2%
Direct effect (breweries)
Indirect effect (suppliers)
Hospitality sector
Retail
Total employment due to production and sale of beer: 63,575 jobs
9%
9%
80%
2%
Direct effect (breweries)
Indirect effect (suppliers)
Hospitality sector
Retail All these jobs that are generated through the production and sale of beer contribute substan-tially to the Belgian economy in terms of value added. Total value added generated by the

The Contribution made by Beer to the European Economy Belgium 26
Belgian brewing sector, and all economic activities within the supply sectors and in the hos-pitality sector and retail generated through the production and sale of beer, is estimated at 2.1 billion euros:
25
665
403
1,007
Value added due to production and sale of beer: 2,100 million euros
Breweries
Supplying sectors
Hospitality industry
Retail
25
665
403
1,007
25
665
403
1,007
Value added due to production and sale of beer: 2,100 million euros
Breweries
Supplying sectors
Hospitality industry
Retail
Because value added per employee in the Belgian brewing sector is relatively high (around 115,000 euros a year), the share of the brewing sector in total value added generated through the production and sale of beer is larger than its share in total employment arising from beer.

The Contribution made by Beer to the European Economy Belgium 27
6.2 Industry and market structure, trends and developments
Belgian Brewers have a long tradition in brewing a range of beer types. A specific charac-teristic of the Belgian beer landscape is its diversity. Although lager forms the largest pro-portion of total beer consumption (with 71 percent), also other unique beer styles such as Amber, Abbey, Trappist, White, Gueuze, Fruit beer or Strong Blond beer and several other regional specialities are popular. Belgian brewers export increasing volumes, mainly within Europe, with France and the Netherlands as their largest export markets. Beer exports are im-portant to the Belgian brewing sector, given that some 50 percent of total production is exported11, so that exports have become a significant economic factor for the brewing sector:
Key variables Millions hectolitres Illustration
• Production 17.4 Production has increased by 18 percent since 2000 (in 2000 total production was 14.7 million hl)
• Exports 8.7 Exports have increased by more than 50 percent since 2000 (with exports in 2000 of 5.5 million hl)
• Imports 1.0 Imports of German beers are rising.
• Consumption 9.7
• Home consumption 44.1% Home consumption is increasing, on-trade decreasing (as a percentage of total consumption)
The economic impact of the brewing sector is influenced by the following trends, develop-ments and characteristics of the Belgian economy: Brewing sector internal characteristics Context of the brewing sector • Beer consumption is decreasing in Belgium • Exports are rising and around 50 percent of all
beer produced is now exported (exports are more than compensating for the decreasing domestic consumption)
• The Belgian brewing sector is both fragmen-ted and concentrated, with over a hundred ac-tive breweries. Apart from a few larger bre-wing companies an important number of me-dium sized and small breweries remains. Complementarity between large and small is a key word for the Belgian brewing sector.
• Per capita consumption is still relatively high from a European perspective
11 In the rest of Europe only countries such as Denmark, the Netherlands and Ireland exhibit such a high ratio of ex-ports to total production.

The Contribution made by Beer to the European Economy Belgium 28
6.3 Direct effect of the brewing sector
Total direct employment in Belgian breweries is around 6,025 employees. The value of total beer production can be estimated at 1.4 billion euros and value added generated by the Bel-gian breweries at 665 million euros (around 45 percent of total production value)12.
0
2
4
6
8
10
12
14
16
18
20
output of which exports
millions hl
0
200
400
600
800
1,000
1,200
1,400
1,600
supplies
valueadded
euro (mln.)
0
1,000
2,000
3,000
4,000
5,000
6,000
employment euro (mln.)
0
200
400
600
800
1,000
1,200
1,400
VAT
excise
Taxes paidby workers
0
2
4
6
8
10
12
14
16
18
20
output of which exports
millions hl
0
2
4
6
8
10
12
14
16
18
20
output of which exports
millions hl
0
200
400
600
800
1,000
1,200
1,400
1,600
supplies
valueadded
euro (mln.)
0
200
400
600
800
1,000
1,200
1,400
1,600
supplies
valueadded
euro (mln.)
0
1,000
2,000
3,000
4,000
5,000
6,000
employment
0
1,000
2,000
3,000
4,000
5,000
6,000
employment euro (mln.)
0
200
400
600
800
1,000
1,200
1,400
VAT
excise
Taxes paidby workers
euro (mln.)
0
200
400
600
800
1,000
1,200
1,400
VAT
excise
Taxes paidby workers
Tax revenues are also important, with total excise revenues on beer generating 200 million euros. Beer sold in pubs and cafes means VAT revenues of 585 million euros are generated. Beer sales in supermarkets and other off-trade outlets generate another 115 million euros in VAT. It is also estimated that Belgian brewery employees pay some 34 million euros in per-sonal and direct tax and that workers in the supply sectors, in the hospitality sector and in retail holding jobs attributable to beer sales pay another 340 million euros in personal direct tax. Total tax revenues arising from beer are thus estimated at 1.82 billion euros. The fraction of total production value that remains within the breweries as value added is relatively high in Belgium. One explanation is that that there are many small Belgian breweries, and in general the ratio of value added to total production value tends to be higher for smaller breweries.
12 See also Federaal Planbureau, Een economische analyse van de productie en distributie van alcoholische dranken, working paper 20-03, November 2003 (An economic impact analysis of the production and distribution of alcoholic beverages).

The Contribution made by Beer to the European Economy Belgium 29
6.4 Economic impact of breweries on suppliers of goods and services
With around 52.5 per cent of Belgian breweries’ total production value spent on suppliers, these suppliers benefit from the brewing sector: Sectors Stimu-
lus13 Stimulus for Belgium
Personnel costs14 Labour costs per employee
(mln. €) % (mln. €) % of stimu-lus
(mln. €) (in €)
Number of em-ployees
• Agriculture15 110 85% 94 1,083• Utilities 37 100% 37 6.8% 3 45,600 54• Packaging industry 92 60% 55 14.7% 8 38,940 213• Equipment 92 60% 55 14.7% 8 38,940 213• Transport 74 95% 70 24.0% 17 34,800 476• Media, marketing 74 80% 59 25.8% 15 52,800 288• Services 257 95% 244 25.8% 64 52,800 1,197Total 735 614 3,526First round impact as % of total impact 65%Total indirect effect of brewing sector 5,424
The largest proportion of supplies is purchased from the services sector, along with signifi-cant spending on industrial products, agricultural produce and transport. Because the propor-tion of imports in Belgian brewers’ purchases is higher for industrial products than for ser-vices, this further stimulates the relative economic impact of the brewing sector on the Bel-gian services sector. It is estimated that around 5,425 employees in the Belgian supply sectors owe their jobs to the brewing sector:
13 Split of total purchases made by Belgian breweries based on a combination of data sources: one questionnaire from a Belgian brewery, Input-Output food and beverage data for Belgium and insights into European patterns of pur-chases made by breweries. 14 Personnel costs as a percentage of total output of industries and labour costs per employee obtained from Eurostat data. 15 For the impact of the brewing sector on agriculture we have used the industry ratio of total turnover to total employment in FTEs (i.e. 6.3 billion euros with 72,000 FTEs) to go from the stimulus in agriculture because of ‘beer’ (i.e. 94 million euros) to resulting employment (about 1,080 FTEs after one round).

The Contribution made by Beer to the European Economy Belgium 30
0 1,000 2,000 3,000 4,000 5,000 6,000
Indirect employment
Agriculture
Utilities
Packaging Media, marketing
TransportationEquipment
Services
0 1,000 2,000 3,000 4,000 5,000 6,000
Indirect employment
Agriculture
Utilities
Packaging Media, marketing
TransportationEquipment
Services
6.5 Retail and hospitality sectors
More than half of all beer consumed is sold by the hospitality sector16: 55.9 percent is sold by pubs and restaurants and the other 44.1 percent is bought by consumers via retail. Belgium has some 45,660 firms in the hospitality sector, providing jobs to 144,700 employees17 18. Around 18,900 of these firms are pubs and cafes, with the number of pubs decreasing in recent years (from 21,800 in 2000 to 18,900 in 2003).
Hospitality sector
Our approach to estimate employment in the hospitality sector attributable to the brewing sector, takes the volume of beer sold in the hospitality sector as a percentage of total beer consumption in Belgium as its starting point: • Around 56 percent of beer consumption in Belgium occurs in the hospitality sector. • This means 5.34 million hl are sold by Belgian pubs, restaurants and the like.
16 Source: Belgian Brewers, www.beerparadise.be, 23 June 2004. 17 Source: Belgian Brewers, Accijnzen op bier (Excise on beer), May 2005. Figures are based on De Tijd, 19 February 2005, data for 2002). 18 Another report indicates there are 55.000 firms in the hospitality sector in Belgium, with 145,000 employees. Some 86 percent of this employment is connected to restaurants. Source: Federaal Planbureau, Analyse du secteur Horeca, Decembre 2004. This study explains that total restaurant production value is 25 per cent dependent on the sales of drinks (while 56 percent of restaurant production value is created by selling food).

The Contribution made by Beer to the European Economy Belgium 31
• Around 70.9 percent of consumption is lager, with an average pub consumer price of 1.42 euros per 25 cl. Per litre this means that consumers pay around 5.68 euros, so that total consumer spending on lager is 2.15 billion euros.
• Around 29.1 percent of consumption is of special beers (e.g. Trappist, Abbey, Amber, Gueuze, White, Strong Blond or Fruit beer), with an average pub consumer price of 2.52 euros per 33 cl. Per litre this means consumers pay 7.56 euros, so that total consumer spending on special beers is 1.17 billion euros.
• Total turnover arising from beer sales in the Belgian hospitality sector can thus be estima-ted at some 3.3 billion euros (2.8 billion euros excluding VAT).
• Turnover in the Belgian hospitality sector per employee, excluding VAT, is 54,700 euros a year19.
• Total employment in the Belgian hospitality sector arising from beer sales is 50,875 jobs.
Retail
This approach can also be used to estimate employment arising from retail beer sales: • Around 44 percent of beer consumption in Belgium is of beer sold by retail outlets. • Around 4.3 million hl are thus bought in Belgian supermarkets at an average price of 1.55
euros per litre. Total consumer spending on beer in Belgian supermarkets is thus estima-ted at 665 million euros (including VAT; 549 million euros excluding VAT).
• Average turnover per employee in Belgian retail is estimated at 435,800 euros a year (ex-cluding VAT), so that some 1,260 employees in retail owe their jobs to the sales of beer.
***
19 Eurostat, statistics on turnover per persons employed in services (‘hospitality sector’).

The Contribution made by Beer to the European Economy Belgium 32

The Contribution made by Beer to the European Economy Cyprus 33
7 CYPRUS: ECONOMIC IMPACT OF BEER
7.1 Highlights of the economic impact
The most important characteristics of the Cypriot beer market are: • A consolidated market with two breweries. • Tourism accounts for a major part of all beer consumption as more tourists come to
Cyprus than the entire Cypriot population. • Cypriot breweries employ 770 people (FTE). • Because of goods and services bought in supplying sectors, additional indirect employ-
ment is generated of around 149 employees. In the hospitality sector 2,241 people owe their jobs to the brewing sector. In retail this figure is 143 people. The Cypriot brewing sector generates a total indirect employment of 3,303 jobs.
• Tax revenues for the Cypriot government from the beer sector are approximately 8.4 mil-lion euros in excise, 18 million euros in VAT and 4 million euros in direct personal taxes paid by workers. Total tax revenues amount to approximately 30.4 million euros.
Total employment due to the production and sale of beer is depicted below:
5%
23%
68%
4%
Total employment due to production and sale of beer: 3,300 jobs
Direct effect (breweries)
Indirect effect (suppliers)
Hospitality sector
Retail
5%
23%
68%
4%
Total employment due to production and sale of beer: 3,300 jobs
Direct effect (breweries)
Indirect effect (suppliers)
Hospitality sector
Retail
Total employment due to production and sale of beer: 3,300 jobs
Direct effect (breweries)
Indirect effect (suppliers)
Hospitality sector
Retail The economic contribution of the brewing sector in terms of value added is estimated at so-me 75 million euros. The largest contribution comes from the hospitality sector, where many jobs can be attributed to the sale of beer. Tourism plays a vital role in this. Almost 75 percent of total value added generated due to the production and sale of beer originates from the hos-pitality sector:

The Contribution made by Beer to the European Economy Cyprus 34
5 12
3
56
Value added due to production and sale of beer: 75 million euros
Breweries
Supplying sectors
Hospitality industry
Retail
5 12
3
56
5 12
3
56
Value added due to production and sale of beer: 75 million euros
Breweries
Supplying sectors
Hospitality industry
Retail
Value added due to production and sale of beer: 75 million euros
Breweries
Supplying sectors
Hospitality industry
Retail
***

The Contribution made by Beer to the European Economy Cyprus 35
7.2 The brewing sector: market structure, trends and developments
Cyprus is one of Europe’s smallest beer markets, having just two breweries. Beer consump-tion was around 47 litres per capita in 1997, although this figure is distorted significantly due to the high influx of tourists, which assumes a market volume of approximately 0.35 million hectolitres.20 In 2004 the market grew to a consumption of around 0.39 million hectolitres. About 2 million litres beer were imported and 1 million litres were exported. Local produc-tion in 2004 was around 38 million litres. Because of its geographical situation as an island, many resources used for brewing have to be imported. Only utilities (e.g. water, electricity), transport, storage and pallets are purcha-sed on the island21. Almost all other resources are bought from the European mainland. The economic impact of the brewing sector is influenced by the following trends, develop-ments and characteristics of the Cypriot economy:
Brewing sector internal characteristics Context in which the brewing sector operates • Two industrial breweries. • Imported beer brands as well as locally bre-
wed beers on the market. • Exports to Greece among others.
• Tourism generates an important quantity of consumers in the local beer market.
7.3 The direct effect of the brewing sector
The brewing companies had approximately 770 direct job positions in 2004.22 The indirect employment impact of the Cypriot brewing sector on suppliers of goods and services domestically is estimated at 149 jobs. The realised production value of both breweries together is estimated at 41.4 million euros, of which approximately 29 million euros is spent on supplying sectors, mainly abroad.23 This means that the Cypriot breweries together realise about 12 million euros value added: 20 Source: Carlsberg Annual report 1997-1998 21 Information obtained from the questionnaire survey. 22 Source: expert interviews. 23 Based on country comparison data analysis.

The Contribution made by Beer to the European Economy Cyprus 36
millions hl euro (mln.) employment euro (mln.)
0
5
10
15
20
25
30
35
40
45
supplies
valueadded
0
100
200
300
400
500
600
700
800
900
0
5
10
15
20
25
30
35Personal
VAT
excise
euro (mln.) employment euro (mln.)
0
0.05
0.1
0.15
0.2
0.25
0.3
0.35
0.4
Output Of which exports0
5
10
15
20
25
30
35
40
45
supplies
valueadded
0
100
200
300
400
500
600
700
800
900
0
5
10
15
20
25
30
35
Personaldirect taxl
VAT
excise
millions hl euro (mln.) employment euro (mln.)
0
5
10
15
20
25
30
35
40
45
0
5
10
15
20
25
30
35
40
45
supplies
valueadded
0
100
200
300
400
500
600
700
800
900
0
100
200
300
400
500
600
700
800
900
0
5
10
15
20
25
30
35
0
5
10
15
20
25
30
35Personal
VAT
excise
euro (mln.) employment euro (mln.)
0
0.05
0.1
0.15
0.2
0.25
0.3
0.35
0.4
0
0.05
0.1
0.15
0.2
0.25
0.3
0.35
0.4
Output Of which exports0
5
10
15
20
25
30
35
40
45
supplies
valueadded
0
100
200
300
400
500
600
700
800
900
0
5
10
15
20
25
30
35
0
5
10
15
20
25
30
35
Personaldirect taxl
VAT
excise
7.4 Economic impact of brewing sector on suppliers of goods and services
Because around 70 percent of total Cypriot brewery production value is estimated to be spent on suppliers, breweries have an important economic impact on supplying sectors: Sectors Stimu-
lus Stimulus for the Cypriot economy
Personnel costs24 Labour costs per employee
(mln. €) % (mln. €) % of stimu-lus
(mln. €) (in €)
Number of em-ployees
• Agriculture 6 0% 0 8% 0.09 31,200 0• Utilities 1 100% 1 16% 0.07 16,824 3• Packaging industry 9 5% 0 16% 0.05 16,824 4• Equipment +other 3 10% 0 22% 0.19 23,892 3• Transport 1 100% 1 25% 1.51 26,856 8• Media, marketing 6 95% 6 25% 0.61 26,856 56• Services + other 3 70% 2 8% 0.09 31,200 23Total 29 97First round impact as % of total impact 65%Total indirect effect of brewing sector 149
Note: For the impact of the brewing sector on agriculture, we have used the industry ratio of total turnover to total employment in FTE to go from the stimulus in agriculture because of ‘beer’ to resulting employment.
24 Personnel costs as a percentage of total output of industries and labour costs per employee are obtained from Eurostat data.

The Contribution made by Beer to the European Economy Cyprus 37
Total indirect employment due to the production of beer is depicted below:
0 20 40 60 80 100 120 140 160
Indirect employment
Utilities
PackagingEquipment
Transportation Media, marketing
Other service
0 20 40 60 80 100 120 140 1600 20 40 60 80 100 120 140 160
Indirect employment
Utilities
PackagingEquipment
Transportation Media, marketing
Other service
7.5 Retail and hospitality sectors
In Cyprus 60 percent of beer sales occur through the hospitality sector. The other 40% is in the retail market.
Hospitality sector
Estimating employment in the retail sector due to the sale of beer: • About 40 percent of the total Cyprus beer consumption is beer sold by supermarkets and
other retail companies. • With an average consumer price of 1.58 euros (incl. VAT) per litre25, total consumer
spending on retail beer is estimated at 24.6 million euros. • Because the annual turnover per employee is estimated at 150,300 euros, this means that
around 143 people owe their jobs to the sale of retail beer.
Retail
Employment in the hospitality sector due to the sale of beer can be similarly assessed: • Around 60 percent of beer consumption in Cyprus occurs in the hospitality sector. • This means that 0.23 million hl are sold by Cypriot pubs, restaurants and the like.
25 Estimated beer price by EY, as real prices fluctuate and beer in different price ranges is available.

The Contribution made by Beer to the European Economy Cyprus 38
• The average consumer price of beer is around 2.50 euros per consumption (of 50 cl.).26 This leads to an estimate of about 101.7 million euros (excl. VAT) spent by consumers on beer in pubs and restaurants.
• The turnover per employee in the Cypriot hospitality sector is 45,400 euros annually.27 • Total employment in the Cypriot hospitality sector because of beer sold thus equals some
2,241 employees.
***
26 Estimated beer price by EY, as real prices fluctuate and beer in different price ranges is available. 27 Source: Country comparison analysis based on Eurostat, Turnover per persons employed in services (2001).

The Contribution made by Beer to the European Economy Czech Republic 39
8 CZECH REPUBLIC: ECONOMIC IMPACT OF BEER
8.1 Highlights on economic impact
The economic impact of the brewing sector on the Czech economy is substantial: • The direct economic impact of the Czech breweries on employment is estimated to be
8,600 jobs. • More jobs are created because of goods and supplies purchased by breweries in supplying
sectors (almost 13,900 jobs). • In the hospitality sector some 49,000 jobs can be attributed to the brewing sector and in
retail around 5,000 employees hold jobs related to beer sales. • The total employment effect of Czech breweries on the national economy is around
76,000 jobs. • The Czech government benefits from taxes received due to the production and consump-
tion of beer. Total VAT revenues are estimated at 240 million euros and personal direct taxes paid by employees of the Czech breweries and of workers in the supplying sectors and the hospitality and retail sectors whose jobs can be attributed to beer are estimated at 66 million euros.
The employment effect of the Czech brewing sector on the national economy is depicted as follows:
11%
18%
64%
7%
Total employment due to production and sale of beer: 76,000 jobs
direct effect (breweries)
indirect effect (suppliers)
hospitality industry
retail
11%
18%
64%
7%
Total employment due to production and sale of beer: 76,000 jobs
direct effect (breweries)
indirect effect (suppliers)
hospitality industry
retail The total contribution to the Czech economy in terms of value added due to the production and sale of beer is estimated at 830 million euros. The hospitality sector and the brewing

The Contribution made by Beer to the European Economy Czech Republic 40
sector themselves are responsible for around 35 percent of total value added due to the production and consumption of beer.
16
307
209
298
Value added due to production and sale of beer: 830 million euros
Breweries
Supplying sectors
Hospitality industry
Retail
16
307
209
298
16
307
209
298
Value added due to production and sale of beer: 830 million euros
Breweries
Supplying sectors
Hospitality industry
Retail
Value added due to production and sale of beer: 830 million euros
Breweries
Supplying sectors
Hospitality industry
Retail
***

The Contribution made by Beer to the European Economy Czech Republic 41
8.2 Market and industry structure, trends and developments
The Czech Republic can call itself the ‘home of beer’, especially where lager (‘pilsen’, beer brewed according to the Bohemian tradition) is concerned. Beer has been produced for centu-ries in Pilsen, Budejovice (Budvar) and other towns. An important moment in history for the Czech brewing sector was the fall of communism in 1988. Since then many Czech breweries have been privatised and/or bought by foreign brewing companies. Thanks to the globally re-nowned Czech beer tradition and reputation, some of these breweries have increased produc-tion substantially. Some Czech breweries operate at a large scale, also exporting a large frac-tion of their production.
Key variables Millions hectolitres Illustration
• Production 18.8
• Exports 2.7 Czech breweries are exporting to many countries (for example: Budvar brewery exports 45 percent of its pro-duction)
• Imports 0.2
• Consumption 17.9
• Draught 47%
• Home consumption <53% Bottled beer and canned beer account for 46% and 4% respectively28. Some of these beers are also sold on-trade, so home consumption will be less than 53 percent.
The Czech Republic market leader is one of the major brewing companies in Europe and the owner of the largest Czech brewing company which consists of three breweries, in Plzen, Nosovice and Velke Popovice. The market share of this company is estimated to be at least 45 percent29. This group produced over 9 million hectolitres in 2003 (in 2000: 7.7 million hl), of which some 1.5 million hectolitres are exported (exports have tripled since 2000). Their main brand is also produced in other neighbouring countries, such as Poland. The number two in the Czech beer market, also part of one of the major European bewing companies, posesses an estimated market share of 14.2 percent30 (with the largest brewery of this group producing around 1.2 million hl). One state-owned brewery has an annual produc-tion of around 1.1 million hectolitres of which over 500,000 hectolitres are exported (45 per-cent).
28 Source Ceský svaz pivovaru a sladoven. 29 Alan Clark and Gary D. Leibowitz (SABMiller), SABMiller Europe: Overview and prospects, October 26, 2004. 30 Interbrew, 2003 Annual Report.

The Contribution made by Beer to the European Economy Czech Republic 42
Category Number of production units Breweries < 50,000 hl per year Numerous 50,000 – 100,000 per year Pivovar Cerná Hora (founded in 1530), 100,000 – 500,000 per year 24 Bernard Pivo31, Havlíckuv Brod, Pivovar
Holba, Pivovar Hostan, Krakonos, Krásné Brezno, Pivovar Litovel, Louny, Budejovi-cký Mest anský Pivovar, Náchod, Nym-burk, Platan, Strakonice, Svijany.
500,000 – 1,000,000 per year 3 Pivovar Branik, Krusovice, Starobrno 1,000,000 – 2,500,000 per year 4 Budejovický Budvar, Radegast Staropra-
men, Pivovar Velké Popovice. 2,500,000 – 5,000,000 per year > 5,000,000 per year 1 Plzenský Prazdroj-Gambrinus The economic impact of the brewing sector is influenced by the following trends, develop-ments and characteristics of the Czech economy:
Brewing sector internal characteristics Context in which the brewing sector operates • Large number of large, medium scale and
small (brewing pub) breweries, creating a very diverse beer landscape
• Some very modern and large scale breweries together with smaller not yet modernised bre-weries
• Medium scale regional breweries face difficult times with declining production and overcapa-city
• Some 20 breweries have closed since the fall of communism, but more smaller breweries (brewing pubs and microbreweries) have ope-ned since
• SABMiller, InBev and Heineken have inves-ted in Czech beer market shares
• Many Czech breweries have still their own malting facilities
• Czech Republic leads in per capita beer con-sumption (160 litres per person)
• Because of the good reputation of Czech beer, some breweries have good opportunities for exporting (all large scale breweries and many medium scale breweries currently export)
8.3 Direct effect of the brewing sector
Total direct employment connected to the Czech breweries is estimated at 8,600 jobs32.
31 Belgian brewer Duvel-Moortgat is a strategic partner owning fifty percent of the shares. 32 Source: Ceský svaz pivovaru a sladoven.

The Contribution made by Beer to the European Economy Czech Republic 43
0
2
4
6
8
10
12
14
16
18
20
output of which exports
millions hl
0
100
200
300
400
500
600
700
800
supplies
valueadded
euro (mln.)
0
1.000
2.000
3.000
4.000
5.000
6.000
7.000
8.000
9.000
10.000
employment
0
100
200
300
400
500
600
euro (mln.)
VAT
excise
Taxes paidby workers
0
2
4
6
8
10
12
14
16
18
20
output of which exports
millions hl
0
2
4
6
8
10
12
14
16
18
20
output of which exports
millions hl
0
100
200
300
400
500
600
700
800
supplies
valueadded
euro (mln.)
0
100
200
300
400
500
600
700
800
supplies
valueadded
euro (mln.)
0
1.000
2.000
3.000
4.000
5.000
6.000
7.000
8.000
9.000
10.000
employment
0
1,000
2,000
3,000
4,000
5,000
6,000
7,000
8,000
9,000
10,000
employment
0
100
200
300
400
500
600
euro (mln.)
VAT
excise
Taxes paidby workers
0
100
200
300
400
500
600
euro (mln.)
VAT
excise
Taxes paidby workers
0
2
4
6
8
10
12
14
16
18
20
output of which exports
millions hl
0
2
4
6
8
10
12
14
16
18
20
output of which exports
millions hl
0
100
200
300
400
500
600
700
800
supplies
valueadded
euro (mln.)
0
100
200
300
400
500
600
700
800
supplies
valueadded
euro (mln.)
0
1.000
2.000
3.000
4.000
5.000
6.000
7.000
8.000
9.000
10.000
employment
0
100
200
300
400
500
600
euro (mln.)
VAT
excise
Taxes paidby workers
0
100
200
300
400
500
600
euro (mln.)
VAT
excise
Taxes paidby workers
0
2
4
6
8
10
12
14
16
18
20
output of which exports
millions hl
0
2
4
6
8
10
12
14
16
18
20
output of which exports
millions hl
0
100
200
300
400
500
600
700
800
supplies
valueadded
euro (mln.)
0
100
200
300
400
500
600
700
800
supplies
valueadded
euro (mln.)
0
1.000
2.000
3.000
4.000
5.000
6.000
7.000
8.000
9.000
10.000
employment
0
1,000
2,000
3,000
4,000
5,000
6,000
7,000
8,000
9,000
10,000
employment
0
100
200
300
400
500
600
euro (mln.)
VAT
excise
Taxes paidby workers
0
100
200
300
400
500
600
euro (mln.)
VAT
excise
Taxes paidby workers
0
100
200
300
400
500
600
euro (mln.)
VAT
excise
Taxes paidby workers
Total production value of Czech breweries is estimated at 734 million euros. 42 percent of total production value is value added for breweries; the remaining 58 percent benefits sup-pliers. The VAT revenues for the Czech treasury are estimated at 240 million euros (around 150 million euros due to the sales of beer on-trade in pubs and restaurants). Another 64 mil-lion euros is received by the Czech government in personal direct taxes paid by employees of breweries and other workers whose jobs can be attributed to the production and sale of beer (i.e. in supplying sectors and in the hospitality and retail sectors). 8.4 Economic impact of breweries on suppliers of goods and services
Because the Czech breweries spend 425 million euros on supplied goods and services, sup-plying sectors benefit substantially from the brewing sector. Sectors Stimu-
lus Stimulus for the Czech economy
Personnel costs33 Labour costs per employee
(mln. €) % (mln. €) % of stimu-lus
(mln. €) (in €)
Number of em-ployees
• Agriculture 98 95% 93 3,713• Utilities 38 100% 38 8% 3 8,532 356• Packaging industry 90 70% 63 13% 8 6,384 1,316• Equipment +other 21 98% 21 13% 3 6,384 439• Transport 64 100% 64 16% 10 6,468 1,553• Media, marketing 94 95% 89 18% 16 12,132 1,345• Services + other 21 95% 20 18% 4 12,132 306Total 427 389 9,027Primary impact as % of total impact 65%Total indirect effect of brewing sector 13,888
33 Personnel costs as a percentage of total output of industries and labour costs per employee are obtained from Eurostat data.

The Contribution made by Beer to the European Economy Czech Republic 44
Note: Turnover per work unit in the agricultural industry is 25,100 euros, so that with a stimulus of 93 million euros into Czech agriculture companies, the employment effect on this industry can be estimated at more than 3,710 jobs (the primary impact). Total employment generated in supplying sectors is almost 13,900 jobs. Generated indirect employment is split up as follows:
0 2,000 4,000 6,000 8,000 10,000 12,000 14,000 16,000
Agriculture
Utilities
Packaging Media, marketingTransportation
Equipment Services
Indirect employment
0 2,000 4,000 6,000 8,000 10,000 12,000 14,000 16,000
Agriculture
Utilities
Packaging Media, marketingTransportation
Equipment Services
Indirect employment
8.5 Retail and hospitality sector
The most important economic impact of the brewing sector involves the benefits to the hos-pitality sector through beer.
Hospitality sector
Estimating the economic impact of the brewing sector on the hospitality sector: • Around 50 percent of total beer consumption in the Czech Republic is beer sold on-trade
in pubs and restaurants. • With an average consumer price of 1.07 euros per litre (including VAT), this means that
around 960 million euros is spent in the Czech Republic on beer in the hospitality sector (including VAT). Total spending excluding VAT is thus around 805 million euros (using a VAT tariff of 19 percent).
• Average turnover excluding VAT of employees working for the hospitality sector is 16,500 euros.

The Contribution made by Beer to the European Economy Czech Republic 45
• Almost 48,800 employees in the hospitality sector can thus be attributed to the brewing sector.
Retail
The economic impact of the brewing sector on retail is estimated using the same methodolo-gy: • Around 50 percent of total beer consumption in the Czech Republic is beer sold off-trade
in supermarkets and other retail outlets. • With an average consumer price of 0.61 euros per litre (including VAT), this means that
almost 550 million euros is spent in the Czech Republic on beer in the hospitality sector (including VAT). Total spending excluding VAT is thus around 460 million euros (using a VAT tariff of 19 percent).
• Average turnover excluding VAT of employees working for the hospitality sector is 92,000 euros.
• Therefore almost 5,000 retail employees can be attributed to the brewing sector.
***

The Contribution made by Beer to the European Economy Czech Republic 46

The Contribution made by Beer to the European Economy Denmark 47
9 DENMARK: ECONOMIC IMPACT OF BEER34
9.1 Highlights of economic impact
The economic impact of the brewing sector can be expressed as follows: • On a global scale, Danish brewers produce 96.9 million hectolitres of beer annually. Do-
mestic production is 8.5 million hectolitres. Domestic beer sales are 4.9 million hectolitres annually.
• The world’s fifth-largest brewery is a Danish company. • The Danish brewing sector is an intensive export sector. Exports are almost as high as do-
mestic consumption and exceed half of the domestic production. • Denmark has relatively high private imports from Germany • The market consists of few large breweries, a number of medium sized breweries and a
large and increasing number of micro- and pub breweries. • The beer sector creates some 28,500 full-time jobs of which 4,150 are in the breweries,
3,200 with suppliers and 22,200 jobs in the retail and hospitality sectors. • Beer-related VAT, excise and income tax revenues amount to some 800 million euros. The employment effects of the brewing sector are depicted below:
15%
11%
68%
6%
Total employment due to production and sale of beer: 28,500 jobs
Direct effect (breweries)
Indirect effect (suppliers)
Hospitality sector
Retail
15%
11%
68%
6%
Total employment due to production and sale of beer: 28,500 jobs
Direct effect (breweries)
Indirect effect (suppliers)
Hospitality sector
Retail The contribution of the brewing sector to the Danish economy can also be expressed in terms of value added. Total value added of the Danish brewing sector and value added generated by
34 Values were calculated using a conversion rate of € 1 = 7.45 Danish kroner.

The Contribution made by Beer to the European Economy Denmark 48
firms in the supply, hospitality and retail sectors due to the production and sale of beer amounts to around 1.0 billion euros:
Value added due to production and sale of beer: 1,040 million euro
Breweries
Supplying sectors
Hospitality industry
Retail
427
219
334
61
Value added due to production and sale of beer: 1,040 million euro
Breweries
Supplying sectors
Hospitality industry
Retail
Value added due to production and sale of beer: 1,040 million euro
Breweries
Supplying sectors
Hospitality industry
Retail
427
219
334
61
427
219
334
61
The share of the brewing sector in overall value added arising from the production and sale of beer is estimated at 32 percent. This is far more than the share of direct employment connected to breweries as a fraction of total employment arising from the production and sale of beer (15 percent). An important explanation is that productivity in terms of value added per employee in the Danish brewing sector is relatively high compared to other sectors.
***

The Contribution made by Beer to the European Economy Denmark 49
9.2 The brewing sector: market structure, trends and developments
Danish brewers produced 96.9 million hectolitres of beer in 2004, of which 8.5 million hec-tolitres were brewed inside Denmark35. According to official statistics, domestic consump-tion is some 96 litres per person per year. However substantial private imports and exports influence this figure. Key variables Million hectolitres Illustration • Production > 8.5 This figure includes only the domestic production by
the members of the Danish Bryggeriforeningen. The to-tal figure is higher.
• Exports 4.9 4.2 official exports plus an estimated 0.7 private exports• Imports 1.9 0.4 official imports plus an estimated 1.5 private im-
ports • Consumption 5.6 4.9 official sales plus some 0.8 net private imports. • Draught 13% 13% of 4.8 million hectolitres official sales. This exclu-
des private imports and exports. • Home consumption 75% 75% of 4.9 million hectolitres official sales. This exclu-
des private imports and exports Source: The Brewers of Europe, Bryggeriforeningen, Danish National Statistics Agency and own cal-culations There are 42 breweries in Denmark, including 3 national brewers, 5 middle size brewers and a substantial number of traditional, micro- and pub-breweries. The larger brewers are also particularly active in the soft drinks and mineral water markets. Some brewing companies al-so own their own malting plants. The number of micro- and pub-breweries is growing an-nually. The total volume of beer bought inside Denmark is declining, following the general Western European trend. One explanation is that domestic beer sales are under high pressure from pri-vate imports. Another reason is the shift from beer to spirits, following a substantial lowering of the spirits excise duties in 2003. Private alcoholic beverage imports and exports play an important role throughout Scandinavia due to relatively large consumer price differences, lar-gely because of lower VAT and excise rates in Germany36. Estimates of the volume of priva-te imports from Germany to Denmark vary from one-fifth to one-third of the total beer con-sumption.
35 Source: Danish Brewers’ Association (Bryggeriforeningen) and Danish National Statistics Agency. 36 Source: Konkurrensestyrelse (2001), Priser og avancer i grænsehandelen med øl og sodavand

The Contribution made by Beer to the European Economy Denmark 50
9.3 The direct effect of the brewing sector
When considering direct effects, two issues are generally important: employment and value added. Danish breweries employ some 5,000 personnel, 4,150 of them performing beer-rela-ted activities. The middle sized breweries each employ around 50 workers. These numbers are relatively low because many processes have been automated and services have been out-sourced (benefiting supplying sectors and thus contributing to the indirect effect of the bre-wing sector). Value added generated by Danish brewing companies inside Denmark and due to the production of beer is estimated at € 334 million37. This figure is lower than total value added generated by Danish brewing companies with brewing activities (estimated at some € 590 million), because of international activities and non beer activities such as soft drinks production and distribution (value added generated with non beer activities is estimated at so-me € 300 million).
0
1
2
3
4
5
6
7
8
9
output of which exports
millions hl
0
100
200
300
400
500
600
700
800
900
supplies
valueadded
euro (mln.)
0
500
1,000
1,500
2,000
2,500
3,000
3,500
4,000
4,500
employment euro (mln.)
0
100
200
300
400
500
600
700
800
900
Direct tax employees
VAT
Excise
0
1
2
3
4
5
6
7
8
9
output of which exports
millions hl
0
1
2
3
4
5
6
7
8
9
output of which exports
millions hl
0
100
200
300
400
500
600
700
800
900
supplies
valueadded
euro (mln.)
0
100
200
300
400
500
600
700
800
900
supplies
valueadded
euro (mln.)
0
500
1,000
1,500
2,000
2,500
3,000
3,500
4,000
4,500
employment
0
500
1,000
1,500
2,000
2,500
3,000
3,500
4,000
4,500
employment euro (mln.)
0
100
200
300
400
500
600
700
800
900
Direct tax employees
VAT
Excise
Another direct effect is tax revenue. There are several types of taxes, including excises and VAT. The applicable VAT rate is 25%. In the European Union there are no member states with higher VAT rates for beer; the Danish VAT rate is much higher than the applicable VAT rate in neighbouring Germany. Danish annual VAT revenues from beer sales are esti-mated at € 375 million. Although excise levels were lowered by 12.7% in January 2005, Danish excise levels are still higher than the EU average (€ 34.09 per hectolitre of beer at 5% ABV. This compares to € 29.17 in the EU). Especially, excise rates are much higher than in the neighbouring Germa-ny (€ 9.45). Total 2004 excise revenues from beer were an estimated 1,363 million Danish kroner38 (€ 184 million).
37 Source: Estimate by Ernst & Young on the basis of the questionnaire used for this study and publicly available sources such as Eurostat statistics using country comparisons to extrapolate. 38 Source: Danish Ministry of Taxation.

The Contribution made by Beer to the European Economy Denmark 51
Denmark also has an excise on beer containers. Danish breweries pay a packaging tax for each bottle they fill for the Danish market. The packaging tax is a flat rate tax dependent on the size of the container. The most common container sizes are 25 cl. and 33 cl. For these containers, the tax is DKK 0.10 per container. Given that Danish brewers sell around 3.8 mil-lion hectolitres of beer packaged in bottles or cans in their home market, the revenues from this excise on beer containers can be estimated at an additional € 20 million. Environmental taxes, including energy and water taxes and corporate taxes from beer compa-nies, are difficult to determine. Corporate taxes are especially difficult to measure since the three dominant brewers also have other activities and profits cannot always be directly assig-ned to single activities. In 2004 the three largest brewers – together holding a market share of some 90% – paid a total sum of 647 million Danish kroner (€ 87 million, source: annual re-ports) on corporate tax. As noted, this includes taxed profits from other activities (such as soft drinks or food products), exported products and consolidated activities in other coun-tries. A third direct effect is of great importance, namely the brewers’ contributions to culture, cha-rity and social activities. It is worth mentioning here the Carlsberg and Tuborg Foundations as solid contributors to cultural and social activities. 51% of Carlsberg shares are held by the Carlsberg Foundation. The foundation is governed by a board, appointed by the Danish Science Board. The Carlsberg Foundation has substantial annual revenues from dividends, which it invests in art, science, sports and other projects benefiting society. Another direct effect of the Danish brewing sector is on the return logistics sector. Dansk Re-tursystem A/S handles return logistics of beer and soft drinks in Denmark. The company em-ploys some 100 workers and has a net turnover of DKK 223 million. 9.4 The economic impact of breweries on suppliers of goods and services
The major proportion of goods and services is sourced domestically. All major brewers have their own water wells and most of the malt is purchased from Danish malters. Besides the economic impact of the domestic beer production on suppliers, it is worth men-tioning that Denmark is one of the world’s largest malt and malting barley exporters. In 2003, Danish companies exported some 1 million tonnes of malting barley and 151.5 thou-sand tonnes of malt39. The economic impact of this industry is enormous. Though malt pro-
39 Source: e-malt.

The Contribution made by Beer to the European Economy Denmark 52
ducers themselves employ no more than 300 personnel, many more Danish farmers produce malting barley that is transformed into brewing malt. Sectors Stimu-
lus Stimulus for the Danish economy
Personnel costs40 Labour costs per employee
(mln. €) % (mln. €) % of stimu-lus
(mln. €) (in €)
Number of em-ployees
• Agriculture 81 75% 61 545• Utilities 39 100% 39 5% 2 53,088 40• Packaging industry 121 70% 85 23% 19 42,960 445• Equipment 66 40% 26 23% 6 42,960 140• Transport 76 100% 76 18% 14 47,340 295• Media, marketing 105 100% 105 30% 32 55,764 565• Services 13 100% 13 30% 4 55,764 70Total 501 2,100Primary impact as % of total impact 65%Total indirect effect of brewing sector 3,200
Source: Own calculations on the basis of National Statistics and Eurostat Total indirect employment connected to the supplying sectors is depicted below:
Indirect employment
0 500 1,000 1,500 2,000 2,500 3,000 3,500
Agriculture Utilities
PackagingEquipment
Transportation Media, marketing
Other service
Indirect employment
0 500 1,000 1,500 2,000 2,500 3,000 3,500
Agriculture Utilities
PackagingEquipment
Transportation Media, marketing
Other service
40 Source: Eurostat (also for labour costs per employee).

The Contribution made by Beer to the European Economy Denmark 53
9.5 Retail and hospitality sectors
Danish breweries do business directly with the retailers. There are few beer wholesalers; only customers with special requirements are serviced through wholesalers. Other retailers are supplied directly by the breweries, who also distribute other brands than their own. Some 75 percent of Danish beer41 is distributed through the off-trade sector (supermarkets, shops and convenience stores). The remaining 25% is distributed through the on-trade channel. The off-trade sector is dominated by a few large supermarket chains and is characterised by increa-sing price competition. The average price thus differs substantially between the retailing and on-trade channels. Where the average price in the off-trade channel lies somewhere around 10 Danish kroner per litre (€ 1.62, including VAT), the average price in the on-trade channel is around 70 kroner per litre (€ 9.68, including VAT).42 According to the Danish competition authorities, average beer price lies at 97% of a comparison group of 9 EU-countries43.
Hospitality sector
Employment arising from beer sales in the hospitality sector is estimated at 19,600 jobs: • 25 percent of registered beer consumption takes place in the hospitality sector. • This means that some 1.22 million hl are sold by Danish pubs, restaurants and the like. • For the purpose of this calculation, we have estimated the average consumer price of a
litre of beer in the hospitality sector at 7.75 euros per litre (excl. VAT). This means that consumers spend 945 million euros (excl. VAT) on beer in pubs and restaurants.
• Turnover per employee in the Danish hospitality sector is 48,000 euros a year. • Total employment in the Danish hospitality sector can be calculated by dividing the turn-
over of beer by the average turnover per employee. The employment in the hospitality sector attributable to beer thus equals 19,600 employees.
Retail
The importance of the brewing sector for retail can be similarly assessed: • About 75 percent of total beer consumption is home consumption. • With an average consumer price of 1.30 euros per litre (excluding VAT), total consumer
expenditure on retail beer is estimated at 570 million euros.
41 Source: AC Nielsen. 42 These prices are estimates of the average prices in the on-trade and the off-trade channels. In reality, prices vary considerably depending on many different factors including the size of the container or glass, the type of establishment and the location. Prices are based on ACNielsen figures and are in line with our own observations and the publication by Konkuransestyrelse (2001), Priser og avancer i grænsehandelen med øl og sodavand. 43 Source: www.ks.dk/publikationer/konkurrenceredegoerelsen/kr2005/kap02.htm, table 2.5

The Contribution made by Beer to the European Economy Denmark 54
• Because turnover per employee is estimated at 347,500 euros, this means 1,600 people owe their jobs to the sale of retail beer.
***

The Contribution made by Beer to the European Economy Estonia 55
10 ESTONIA: ECONOMIC IMPACT OF BEER
10.1 Highlights of economic impact
The economic impact of the brewing sector can be expressed as follows: • Domestic production of beer within Estonia amounted to some 1 million hectolitres in
2004. Domestic consumption is also around 1 million hectolitres. • 94 percent of the beer volume is sold through shops. • Extensive private exports to Sweden and Finland are included in these retail sales. • Though a small economy, Estonia retains the majority of the stimulus from the brewing
sector. • Direct employment in breweries amounts to some 760 FTEs. • In addition, some 1,120 full-time jobs at suppliers, 1,100 jobs in the hospitality sector and
840 jobs in retail are directly dependent on beer. • Excise and VAT revenues are estimated at 19 and 18 million euros per year respectively. The employment effects of the brewing sector are depicted below:
20%
29%29%
22%
Total employment due to production and sale of beer: 3,800 jobs
Direct effect (breweries)
Indirect effect (suppliers)
Hospitality sector
Retail
20%
29%29%
22%
Total employment due to production and sale of beer: 3,800 jobs
Direct effect (breweries)
Indirect effect (suppliers)
Hospitality sector
Retail
The contribution of the brewing sector to the Estonian economy can also be expressed in terms of value added. Total value added of the brewing sector in Estonia and value added ge-nerated by firms in the supply, hospitality and retail sectors arising from the production and sale of beer amounts to around 41 million euros:

The Contribution made by Beer to the European Economy Estonia 56
Value added due to production and sale of beer: 41 million euro
Breweries
Supplying sectors
Hospitality industry
Retail
7
9
22
4
Value added due to production and sale of beer: 41 million euro
Breweries
Supplying sectors
Hospitality industry
Retail
Value added due to production and sale of beer: 41 million euro
Breweries
Supplying sectors
Hospitality industry
Retail
7
9
22
4
7
9
22
4
The share of the brewing sector in overall value added arising from the production and sale of beer is estimated at 53 percent. This is far more than the share of direct employment con-nected to breweries as a fraction of total employment arising from the production and sale of beer (26 percent). An important explanation is that productivity in terms of value added per employee in the Estonian brewing sector is very high compared to other sectors.
***

The Contribution made by Beer to the European Economy Estonia 57
10.2 The brewing sector: market structure, trends and developments
Estonian brewers produced 1.044 million hectolitres of beer in 2004. An additional 60 thousand hectolitres were imported, mainly from Finland (60% of all imports), Ukraine and Russia. 160 thousand hectolitres of beer were exported, mainly to Finland, Latvia and Li-thuania. Statistics on private exports to Finland and Sweden are not available but may account for hundreds of thousands of hectolitres. Since privately exported beer is bought within the country, this volume appears in statistics as domestic ‘consumption’. Key variables Million hectolitres Illustration
• Production 1.0 7 breweries
• Exports 0.2 Estonia is not a major beer exporting country, as growth can still be realised domestically
• Imports 0.06 Heineken accounts for about 50 percent of imported beer
• Consumption c. 1.0
• Home consumption 6% This is relatively low
Source: Association of Estonian Breweries, own estimates The Estonian brewing sector is highly concentrated. 92.4% of total domestic production is produced by the three larger brewers. The leader has a market share of 41.6%. Beside these three biggest players, there are four smaller (local) breweries producing the remaining 7.6% of domestic beer. There is also a small number of brewery-pubs, whose figures are not inclu-ded in the official statistics but are estimated to be insignificant. With an average sales value of approximately € 60 per hectolitre, the value of domestic production totals € 63 million (ex-brewery sales value). Factors that influence the impact of the brewing sector on the Estonian economy are: Brewing sector internal characteristics Context in which the brewing sector operates • Introduction of a packaging refund system will
lead to additional jobs and possibly an increa-se in the value added by the brewing sector
• Estonia’s recent membership of the European Union induced a sharp rise in private exports to Finland
10.3 The direct effect of the brewing sector
The Estonian brewing sector employs 764 personnel, of which some 500 jobs are directly re-lated to the brewing of beer. The rest of the employment is linked to other beverages, such as soft drinks.

The Contribution made by Beer to the European Economy Estonia 58
The 2004 turnover of the Estonian brewing sector from sales of products and services was some € 63 million (ex-brewery sales value). Of this, 14% (€ 9 million) went to raw materials, 19% (€ 12 million) was additional materials purchased and 24% (€ 15 million) was outsour-ced services. Total value added by the brewing sector was around € 22 million44:
0
0.2
0.4
0.6
0.8
1
1.2
output of which exports
millions hl
0
10
20
30
40
50
60
70
supplies
valueadded
euro (mln.)
0
100
200
300
400
500
600
700
800
900
employment euro (mln.)
5
10
15
20
25
30
35
40
45
Direct taxemployees
VAT
Excise
0
0.2
0.4
0.6
0.8
1
1.2
output of which exports
millions hl
0
0.2
0.4
0.6
0.8
1
1.2
output of which exports
millions hl
0
10
20
30
40
50
60
70
supplies
valueadded
euro (mln.)
0
10
20
30
40
50
60
70
supplies
valueadded
euro (mln.)
0
100
200
300
400
500
600
700
800
900
employment
0
100
200
300
400
500
600
700
800
900
employment euro (mln.)
5
10
15
20
25
30
35
40
45
Direct taxemployees
VAT
Excise
euro (mln.)
5
10
15
20
25
30
35
40
45
Direct taxemployees
VAT
Excise
Another substantial direct effect of the brewing sector involves taxes and excises paid. Ex-cise levels in Estonia are € 0.037 per alcohol degree per litre. At an estimated average strength of 5% per litre, the total Estonian excise revenues amount to some € 18.5 million per year. VAT is 18%. Considering that the total turnover (including VAT) equals € 117.5 million, we can calculate the Estonian VAT revenues from beer sales at € 17.9 million. 10.4 The economic impact of breweries on suppliers of goods and services
Estonian breweries spend some € 41 million annually on purchased goods and services. Due to the small and open economy, only € 26 million of this expenditure is made domestically. In particular, it is agricultural raw materials which are imported. The domestic expenditures of the Estonian breweries induce some 1,121 jobs in various sectors. The agricultural sector, the manufacturing industry and the service sector all profit from the expenditures of the brewing sector.
44 Source: Eurostat.

The Contribution made by Beer to the European Economy Estonia 59
Sectors Stimu-lus
Stimulus for the Estonian economy
Personnel costs45 Labour costs per employee
(mln. €) % (mln. €) % of stimu-lus
(mln. €) (in €)
Number of em-ployees
• Agriculture 8 30% 2 219• Utilities 2 100% 2 9% 0 6,360 28• Packaging industry 16 50% 8 16% 1 4,980 259• Equipment +other 0 20% 0 16% 0 4,980 0• Transport 6 80% 5 11% 1 6,468 82• Media, marketing 5 95% 5 21% 1 12,132 84• Services + other 3 95% 3 21% 1 12,132 56Total 41 26 728Primary impact as % of total impact 65%Total indirect effect of brewing sector 1,120
Source: Own calculations on the basis of National Statistics and Eurostat The indirect employment impact of the brewing sector is depicted below:
0 200 400 600 800 1,000 1,200
Agriculture
Utilities
Packaging Media, marketing
Transportation
Equipment Services
Indirect employment
0 200 400 600 800 1,000 1,2000 200 400 600 800 1,000 1,200
Agriculture
Utilities
Packaging Media, marketing
Transportation
Equipment Services
Indirect employment
45 Personnel costs as a percentage of total output of industries and labour costs per employee are obtained from Eurostat data.

The Contribution made by Beer to the European Economy Estonia 60
10.5 Retail and hospitality sectors
Hospitality sector
The economic impact of the breweries on the hospitality sector is estimated at some 1,100 jobs: • Around 6 percent of beer consumption in Estonia takes place in the hospitality sector.
This means that 60,000 hectolitres are sold by Estonian pubs, restaurants and the like. • The consumer price of beer is about 2.91 euros per litre (excl. VAT) 46, so that consumers
are estimated to spend 17.4 million euros (excl. VAT) on beer in pubs and restaurants. • Turnover per employee in the Estonian hospitality sector is 15,900 euros a year. • Total employment in the Estonian hospitality sector arising from beer sold thus equals
1,100 full-time employees.
Retail
The importance of the brewing sector for retail can be similarly assessed: • About 94 percent of total beer consumption is beer sold by supermarkets and other retail
companies.47 This equals an amount of 940,000 hectolitres. • With an average consumer price of 0.87 euros per litre (excl. VAT), total consumer ex-
penditure on retail beer is estimated at 82 million euros (excl. VAT). • Because turnover per employee is estimated at 97,000 euros, this means 840 employees in
retail outlets owe their jobs to beer sales.
***
46 The prices in this paragraph are estimates of the average prices in the on-trade and off-trade channels. In reality, prices vary considerably, depending on many different factors including the size of the container or glass, the type of establishment and the location. 47 Though the majority of beer (94%) sold in Estonia is through shops, this may not be representative of the con-sumption pattern of the average Estonian. A lot of the beer sold through shops is private exports to Finland and Sweden.

The Contribution made by Beer to the European Economy Finland 61
11 FINLAND: ECONOMIC IMPACT OF BEER
11.1 Highlights of economic impact
The economic impact of the brewing sector can be expressed as follows: • Total annual production of beer in Finland in 2004 was 4.6 million hectolitres. • The Finnish beer market is rather consolidated with three of Finland's fifteen breweries
controlling around 95 percent of the market. • In 2003, Finnish breweries employed 2,904 personnel, of which 2,300 jobs were related
to beer activities. • Suppliers of the beer sector employ another 4,500 full-time jobs, while the retail and
hospitality sectors employ 2,600 and 10,100 full-time jobs respectively. • In 2004, excise revenues from beer were € 410 million, and VAT revenues from beer
were around € 380 million. The employment effects of the brewing sector are depicted below:
12%
23%
52%
13%
Total employment due to production and sale of beer: 19,500 jobs
Direct effect (breweries)
Indirect effect (suppliers)
Hospitality sector
Retail
12%
23%
52%
13%
Total employment due to production and sale of beer: 19,500 jobs
Direct effect (breweries)
Indirect effect (suppliers)
Hospitality sector
Retail The contribution of the brewing sector to the Finnish economy can also be expressed in terms of value added. Total value added of the brewing sector in Finland and value added generated by firms in the supply, hospitality and retail sectors arising from the production and sale of beer amounts to around 726 million euros:

The Contribution made by Beer to the European Economy Finland 62
Value added due to production and sale of beer: 726 million euro
Breweries
Supplying sectors
Hospitality industry
Retail
55
223
236
212
Value added due to production and sale of beer: 726 million euro
Breweries
Supplying sectors
Hospitality industry
Retail
Value added due to production and sale of beer: 726 million euro
Breweries
Supplying sectors
Hospitality industry
Retail
55
223
236
212
The share of the brewing sector in overall value added arising from the production and sale of beer is estimated at 31 percent. This is far more than the share of direct employment con-nected to breweries as a fraction of total employment arising from the production and sale of beer (14 percent) and a reason for this is that the productivity in the brewing sector, expres-sed in value added per employee, is relatively high.
***

The Contribution made by Beer to the European Economy Finland 63
11.2 The brewing sector: market structure, trends and developments
The Finnish alcoholic drinks sector is highly regulated. One of the most important characte-ristics of the Finnish beer market is the high level of excise duties. For beers over 2.8% alco-hol by volume, the excise rate is € 19.45 per %-point per hectolitre. The rate was lowered 32% after accession of the new member states to the European Union. Despite the relatively high taxes, Finns consume approximately 84 litres of beer per person, which is above the EU average. This is partly due to substantial private imports from (tax-free) ferries and from Es-tonia. Private imports are estimated to be as large as 10% of the total beer consumption in Finland48. In 2004, the total annual production of beer in Finland amounted to 4.6 million hectolitres. Consumption was slightly higher at 4.9 million hectolitres. Key variables Million hectolitres Illustration
• Production 4.6 • Exports 0.2 • Imports 0.7 318 thousand hl registered imports and an
estimated 385 thousand hl private imports • Consumption 4.9 208 thousand hectolitres are tax-free sales on fer-
ries and aircraft • Home consumption 77.6% 73.8% is sold through retail, 3.8% is sold through
Alko shops and 22.4% is sold through hospitali-ty49
Source: The Brewers of Europe, Panimoliitto, STTV and own calculations Though Finland has 15 breweries (including micro breweries), the market is dominated by two large companies that produce over 40% of the total production volume. The third-largest brewery has a 12.0% market share. With the four members of the national brewery association (Panimoliito) producing 96% of the national beer sales, the supply side of the market is highly concentrated. The largest Finnish brewers also produce soft drinks, long drinks, cider and mineral water. The alcoholic drinks sector is highly regulated. Many restrictions are applied to manufac-turing, distribution and advertising. Alcohol, except for low-alcohol beer, is sold only through state-owned Alko outlets. Although taxes on alcohol are high, the 2004 budget lowe-red them by about one-third.
48 6.6% is purchased in the Baltic states; 3.5% is purchased on board ferries and taken back to Finland. Source: The Brewers of Europe. 49 Source: National Product Control Agency for Welfare and Health (STTV).

The Contribution made by Beer to the European Economy Finland 64
11.3 The direct effect of the brewing sector
Direct effects are not easily available since Finnish brewers also produce mineral water and soft drinks. In 2003, the total Finnish ‘beer, mineral waters and soft drinks’ sector: • had a gross production value of € 728 million • of which 18.2% (€ 133 million) was spent on raw materials • 35.9% (€ 262 million) was value added (of which € 223 million from the production of
beer, source: Eurostat) • 13.3% (€ 97 million) was spent on salaries • employed 2,904 employees, of which 1,634 were ‘workers’, and 1,270 ‘office jobs’50 Beer constitutes roughly 48% of the volume produced by the members of the Finnish Federa-tion of the Brewing and Soft Drinks Industry (Panimoliitto). Other products are cider, soft drinks, long drinks and mineral water. Beer also constitutes roughly half of the ‘beer, mineral waters and soft drinks’ volume consumed. We thus estimate that roughly half of the em-ployees and half of the value added of the total sector comes from beer. The Finnish brewing sector employs an estimated 2,904 employees, of which 2,300 are rela-ted to beer activities.
0
0,5
1
1.5
2
2.5
3
3.5
4
4.5
5
Output Of which exports
millions hl
0
100
200
300
400
500
600
supplies
valueadded
euro (mln.)
0
500
1,000
1,500
2,000
2,500
employment euro (mln.)
0
100
200
300
400
500
600
700
800
900
1.000Direct taxemployees
VAT
Excise
0
0,5
1
1.5
2
2.5
3
3.5
4
4.5
5
Output Of which exports
millions hl
0
0,5
1
1.5
2
2.5
3
3.5
4
4.5
5
Output Of which exports
millions hl
0
100
200
300
400
500
600
supplies
valueadded
euro (mln.)
0
100
200
300
400
500
600
supplies
valueadded
euro (mln.)
0
500
1,000
1,500
2,000
2,500
employment
0
500
1,000
1,500
2,000
2,500
employment euro (mln.)
0
100
200
300
400
500
600
700
800
900
1.000Direct taxemployees
VAT
Excise
euro (mln.)
0
100
200
300
400
500
600
700
800
900
1.000Direct taxemployees
VAT
Excise
Finland has relatively high excise and VAT rates. In 2004 excise rates on beer were lowered to € 19.45 per %-point for alcoholic beverages with over 2.8% alcohol. In 2005, the beer ex-cise tax rate is € 0.97 per litre of beer (at 5% ABV). In 2004, excise revenues from beer amounted to € 410 million51.
50 Source: Finnish Food and Drink Industries’ Federation. 51 Source: Panimoliitto.

The Contribution made by Beer to the European Economy Finland 65
The VAT rate for beer is 22%. Based on the total sales of beer, the market shares of the retail and hospitality sectors, and their average consumer prices, we estimate VAT revenues from beer accounted for some € 380 million. On average, excise and VAT account for 52% of the retail price of a regular beer. For promo-tions, this could be as much as 90-100% of the retail price. Data on the amount of corporate taxes paid by Finnish brewers is not available. 11.4 Economic impact of breweries on suppliers of goods and services
The Finnish beer sector spends € 335 million on goods and services annually. The main part of this amount is spent in the agricultural sector and the manufacturing sectors. In total, the Finnish brewing sector induces some 4,500 jobs with suppliers of goods and services. This number is the lower boundary for the indirect employment from the brewing sector52. Sectors Stimu-
lus Stimulus for the Finnish economy
Personnel costs53 Labour costs per employee
(mln. €) % (mln. €) % of stimu-lus
(mln. €) (in €)
Number of em-ployees
• Agriculture 54 89% 48 1,625• Utilities 26 98% 26 9% 2 41,196 55• Packaging industry 81 83% 67 16% 10 35,832 290• Equipment 44 83% 37 16% 6 35,832 160• Transport 51 98% 50 22% 11 36,420 305• Media, marketing 70 86% 60 32% 19 45,000 425• Services 9 86% 7 32% 2 45,000 55Total 335 2,920Primary impact as % of total impact 65%Total indirect effect of brewing sector 4,500
Source: Own calculations on the basis of National Statistics and Eurostat The indirect impact of the brewing sector on supply sectors is depicted below:
52 The Finnish brewers’ association Panimoliito has estimated that 5,000 to 6,000 jobs in the agricultural sector alone depend on the brewing sector. They also estimate that 1,000 to 1,500 jobs in transportation are linked to breweries. 53 Personnel costs as a percentage of total output of industries and labour costs per employee are obtained from Eurostat data.

The Contribution made by Beer to the European Economy Finland 66
0 1,000 2,000 3,000 4,000 5,000
Agriculture
Utilities
Packaging Media, marketing
Transportation
Equipment Services
Indirect employment
0 1,000 2,000 3,000 4,000 5,000
Agriculture
Utilities
Packaging Media, marketing
Transportation
Equipment Services
Indirect employment
11.5 Retail and hospitality sectors
The Finnish beer market is growing, with total consumption and per capita consumption rising steadily. Growth was quite substantial in 2004. This was a result of fierce price compe-tition in the retail sector, but a lowering of the excise duties may also have reduced the need for Finns to buy their beer abroad. Finnish breweries have recently invested in their brewe-ries and R&D facilities, resulting in modern production assets. The Finnish state has a mono-poly on retail sales of wine, spirits and beer with more than 4.7% alcohol. High excise duties, combined with a price war in the retail channel result in a high competitive pressure on beer sales through the hospitality channel. Finland has 9,021 licensed restaurants, 6,996 retail outlets, and 443 government monopoly Alko shops (the only place where drinks with 4.7% or more alcohol may be sold). The hospi-tality sector sells 22.4% of the domestic beer sales volume, retail outlets sell 73.8%, and Al-ko shops sell the remaining 3.8% (mainly strong beers). After the excise duty rate reduction, beer in a bar costs somewhere between € 8.75 and € 11.25 per litre (including VAT), whereas the average price of a beer in the retail channel lies around € 2.85 per litre54. In the hospitality sector, VAT and excise make up some 28% of the price of beer. In the retail channel this fraction is around 52% of the consumer price55. The relatively low market share of the hospitality sector is due to the large difference in price between the sales channels. Supermarkets sell beer at prices only a fraction higher than the
54 These figures are estimates. In reality prices may vary considerably. We have used these average prices only for calculating some effects of the brewing sector on the economy. 55 Source: Own calculations, based amongst others on Office of the Revenue Commissioners, Statistics Report 2003.

The Contribution made by Beer to the European Economy Finland 67
excise tariffs. Hence, a recent excise reduction (March 2004) led to lower retail prices, whereas beer prices in the hospitality sector remained stable. The low market share of the hospitality sector is also reflected in the packaging: only 18.3% of the domestic beer volume is sold as draught beer, whereas 73.5% is sold in bottles and 8.3% is sold in cans.
Hospitality sector
Employment arising from the sales of beer in the hospitality sector is estimated at just over 10,000 jobs: • Around 22.4 percent of beer consumption in Finland takes place in the hospitality
channel. • This means that 979,000 hl are sold by Finnish pubs, restaurants and the like. • The consumer price of beer is about 8.20 euros per litre (excl. VAT), so that consumers
are estimated to spend 820 million euros (excl. VAT) on beer in pubs and restaurants. • Average turnover per employee in the Finnish hospitality sector equals 80,800 euros a
year. • From this we can deduce that total employment in the Finnish hospitality sector because
of beer sales is 10,100 employees.
Retail
The importance of the brewing sector for retail can be similarly assessed: • About 77.6 percent of total beer consumption is of beer sold by supermarkets and other
retail companies. • With an average consumer price of 2.34 euros per litre, total consumer expenditure on
retail beer is estimated at 920 million euros. • Because turnover per employee is estimated at 355,800 euros, this means 2,600 people
owe their jobs to the sales of retail beer.
***

The Contribution made by Beer to the European Economy Finland 68

The Contribution made by Beer to the European Economy France 69
12 FRANCE: ECONOMIC IMPACT OF BEER
12.1 Highlights of the economic impact
The most important characteristics of the French beer market are: • France has a consolidated beer market with three large brewers and many medium sized
and small breweries. • France is the world’s main malt exporter. • French breweries employ 5,000 personnel (FTEs). • Because of goods and services bought in supplying sectors, additional indirect employ-
ment of around 15,220 employees is generated. In the hospitality sector 65,960 personnel owe their jobs to the brewing sector. In retail this is 5,475 staff. The French brewing sec-tor generates total indirect employment of 91,650 jobs.
• Tax revenues for the French government arising from the production and sale of beer is estimated at around 1,800 million euros (292 million euros excise, 1,176 million euros VAT and 326 million euros on direct personal taxes paid by workers).
The employment impact of the brewing sector is depicted below:
5%
17%
72%
6%
Total employment due to production and sale of beer: 91,650 jobs
Direct effect (breweries)
Indirect effect (suppliers)
Hospitality sector
Retail
5%
17%
72%
6%
Total employment due to production and sale of beer: 91,650 jobs
Direct effect (breweries)
Indirect effect (suppliers)
Hospitality sector
Retail The total contribution to the French economy in terms of value added due to production and sale of beer is estimated at 3.7 billion euros. The hospitality sector is responsible for around 50 percent of total value added because of beer. Value added per employee, however, is very high in the French brewing sector, reflecting its high productivity.

The Contribution made by Beer to the European Economy France 70
Therefore the share of the brewing sector in total value added generated due to production and sale of beer is higher than its share in total employment due to production and sale of beer:
186 644
988
1,886
Value added due to production and sale of beer: 3,700 million euros
Breweries
Supplying sectors
Hospitality industry
Retail
186 644
988
1,886
186 644
988
1,886
Value added due to production and sale of beer: 3,700 million euros
Breweries
Supplying sectors
Hospitality industry
Retail
***

The Contribution made by Beer to the European Economy France 71
12.2 The brewing sector: market structure, trends and developments
The production of beer in France was 16.8 million hectolitres in 2004. Total consumption was 20.2 million hectolitres.56 Beer consumption in France per capita is relatively low com-pared with other European countries. As a producer of beer France is fifth in Europe. In 2004 French breweries exported 1,973 million hectolitres. Around 5,395 million hectoli-tres were imported. There are 13 industrial production units for beer in France. Some 150 small producers of arti-sanal beers are also established across France. Their production volumes vary from 300 to 30,000 hl per year. 57 Key variables Millions hectolitres Illustration • Production 16.8 13 (industrial) breweries and around 150 producers of
artisanal beers. • Exports 1.97
• Imports 5.39
• Consumption 20.2
• Draught58 4
• Home consumption 72% 23.9% of production in France is in kegs, 63.7% bottles among which 4.7% returnable small bottles, and 12.2% cans
Source: Brasseurs de France French production of beer decreased by 7.3% in 2004, while imports of beer grew by 6.2%. Exports declined by 3.5% in the same year. The gross consumption decreased by 4.5% in 2004. Reasons given for the declining market are the lack of good weather (sun hours) in spring and summer, severe competition from producers of mineral waters and soft drinks, and the shift in preferences of young people towards sweeter mixed drinks. The French beer market is concentrated. Two brewing companies, both belonging to one of the major five brewing companies in Europe, together represent around three-quarters of the French beer market. A third brewing company, also part of one of the major brewing compa-nies in Europe, has a market share of 9% and ranks third.59
56 Source: Brasseurs de France. 57 Source: Brasseurs de France. 58 Production delivered in kegs. 59 Sources: Annual report 2004 of this brewing company.

The Contribution made by Beer to the European Economy France 72
Some large brewing companies have their own distribution systems with strong positions in the wholesale beer market. The economic impact of the brewing sector is influenced by the following trends, develop-ments and characteristics of the French economy: Brewing sector internal characteristics Context in which the brewing sector operates • Market is dominated by two brewers who to-
gether have a market share of approx. 75%. The three largest brewers represent almost 85% of the market.
• France has a large group of artisanal producers of beer in small quantities.
• Retail is by far the largest sales channel for beer (72% of total sales volume).
• Several large and small brewers have their own distribution system.
• Closed economy. Many resources are availa-ble (and bought) in France.
• Increasing imports of beer. • France is the world’s main malt exporter.
The large average size of French breweries is illustrated below: 60
Production units in hectolitres Number of production units < 50,000 hl per year 1 professional and 150 small producers of artisanal
beers 50,000 – 100,000 per year 1 100,000 – 500,000 per year 3 500,000 – 1,000,000 per year 1 1,000,000 – 2,500,000 per year 6 2,500,000 – 5,000,000 per year - > 5,000,000 per year 1 12.3 The direct effect of the brewing sector
The brewing companies had approximately 5,000 direct job positions in 2004.61 French bre-weries together realise a production value of 2.2 billion euros, of which approximately 1.59 billion euros is spent on the supplying sectors.62 This means the French breweries together realise 0.643 billion euros value added:
60 Source: Brasseurs de France. 61 Source: Brasseurs de France. 62 Analysis of gathered data from Brasseurs de France, questionnaires and Eurostat.

The Contribution made by Beer to the European Economy France 73
euro (mln.) euro (mln.)employment
0
1,000
2,000
3,000
4,000
5,000
6,000
0
500
1,000
1,500
2,000
2,500
valueadded
supplies
millions hl
0
2
4
6
8
10
12
14
16
18
Output Of which exports0
200
400
600
800
1,000
1,200
1,400
1,600
1,800
2,000Personal direct tax
VAT
excise
euro (mln.) euro (mln.)employment
0
1,000
2,000
3,000
4,000
5,000
6,000
0
500
1,000
1,500
2,000
2,500
0
500
1,000
1,500
2,000
2,500
valueadded
supplies
millions hl
0
2
4
6
8
10
12
14
16
18
Output Of which exports
millions hl
0
2
4
6
8
10
12
14
16
18
Output Of which exports0
200
400
600
800
1,000
1,200
1,400
1,600
1,800
2,000Personal direct tax
VAT
excise
The stimulus of 1.59 billion euros on the supply sectors generates important economic bene-fits for these sectors. France is an important producer of raw materials for the worldwide bre-wing sector. The French barley sector provides some 60,000 job positions (i.e. 52,000 barley producers and 8,000 employees)63. For the barley sector 17% of their turnover is earned through sales to brewers64. A rough calculation indicates that at least 10,200 jobs (17% of 60,000) are directly related to the worldwide brewing sector. 105 farmers also produce hops of which an important part is for the brewing sector65. The malt industry employs another 659 personnel. Almost 72% of their production was exported in 2003, including to breweries world wide66. 12.4 The economic impact of breweries on suppliers of goods and services
French breweries spend around 71.2 percent of total production value generated on suppliers, thus exercising an important economic impact on these supplying sectors:
63 Source: Brasseurs de France 64 Source: AGPB, Céréaliers de France, lettre d’information de l’AGPB no. 127 octobre 2000. 65 Source: Brasseurs de France/Oniflhor 66 Source: Brasseurs de France/Ministère de l’Agriculture EAE Agreste SCEES.

The Contribution made by Beer to the European Economy France 74
Sectors Stimu-lus
Stimulus for the French economy
Personnel costs67 Labour costs per employee
(mln. €) % (mln. €) % of stimu-lus
(mln. €) (in €)
Number of em-ployees
• Agriculture68 177 95% 168 0 2,839• Utilities 69 100% 69 19% 13 40,980 314• Packaging industry 557 80% 446 15% 67 38,568 1,733• Equipment +other 36 65% 23 15% 4 38,568 91• Transport 175 100% 175 28% 49 31,152 1,573• Media, marketing 177 98% 174 32% 56 53,940 1,030• Services + other 398 98% 390 32% 125 53,940 2,315Total 1,589 9,894Primary impact as % of total impact 65%Total indirect effect of brewing sector 15,222
Source: Own calculations on the basis of National Statistics and Eurostat The largest proportion of supplies is purchased from the packaging industry, with further sig-nificant spending on services, transport, media and marketing and agricultural products. Accumulating all generated indirect employment within the different sectors the total indirect primary effect is 15,222 job positions.
0 2,000 4,000 6,000 8,000 10,000 12,000 14,000 16,000
Agriculture
Utilities
Packaging Media, marketing
Transportation
Equipment Services
Indirect employment
0 2,000 4,000 6,000 8,000 10,000 12,000 14,000 16,0000 2,000 4,000 6,000 8,000 10,000 12,000 14,000 16,000
Agriculture
Utilities
Packaging Media, marketing
Transportation
Equipment Services
Indirect employment
67 Personnel costs as a percentage of total output of industries and labour costs per employee are obtained from Eurostat data. 68 For the impact of the brewing sector on agriculture, we have used the industry ratio of total turnover to total employment in FTE (i.e. 56.5 billion euros with 953,129 FTE) to go from the stimulus in agriculture because of ‘beer’ (i.e. 168 million euros) to resulting employment (2,839 FTE after one round).

The Contribution made by Beer to the European Economy France 75
12.5 Retail and hospitality sectors
In France 72 percent of beer sales are through the retail market. The other 28 percent occur in the hospitality sector.
Hospitality sector
Retail employment arising from beer sales is estimated at almost 5,500 jobs: • About 72 percent of the total beer consumption in France is beer sold by supermarkets
and other retail companies. • This means that 14.5 million hl is sold by supermarkets and other retail companies. • With an average consumer price of 1.40 euros (incl. VAT) per litre69, total consumer
spending on beer in retail is estimated at 1.7 billion euros (excl. VAT). • Because the annual turnover per employee is estimated at 311,000 euros, this means that
5,475 people owe their jobs to retail beer sales.
Retail
Employment in the hospitality sector arising from beer can be similarly assessed: • Around 28 percent of French beer consumption occurs in the hospitality sector. • This means 5.7 million hl are sold by French pubs, restaurants and the like. • The average consumer price of beer is around 9.08 euros per litre (including VAT).70 This
leads to an estimate of 4.3 billion euros (VAT not included) spent by consumers on beer in pubs and restaurants.
• The turnover per employee in the French hospitality sector is 65,100 euros a year.71 • Total employment in the French hospitality sector arising from beer sales is thus around
65,960 employees.
*** 69 Source: Institut National de la Statistique. 70 Source: Institut National de la Statistique. 71 Source: Eurostat, Turnover per person employed in services (2001).

The Contribution made by Beer to the European Economy France 76

The Contribution made by Beer to the European Economy Germany 77
13 GERMANY: ECONOMIC IMPACT OF BEER
13.1 Highlights of the economic impact
The economic impact of the brewing sector in Germany can be expressed as follows: • Germany is the leading country in Europe for the production and consumption of beer
(with a total production of 106 million hl and consumption of 95.5 million hl). • The direct employment in German breweries is 33,400 FTEs. • The brewing sector generates important indirect effects on the supply sectors; it is estima-
ted that 49,000 jobs in these sectors can be attributed to the brewing sector (the sales of beer), with the services sectors and agriculture benefiting most.
• In addition to these direct and indirect effects, the hospitality sector and retail also benefit from beer sales. In the hospitality sector 429,000 jobs can be attributed to beer sales and in retail 38,000 people owe their jobs to beer sales.
• The government also benefits from the brewing sector, with excise revenues amounting to 787 million euros, total VAT revenues from German beer consumption estimated at 4.1 billion euros (2.6 billion on-trade and 1.5 billion off-trade) and personal direct taxes paid by people whose jobs are attributable to beer estimated at 2.6 billion euros. Total tax reve-nues for the German government are therefore estimated at 7.5 billion euros.
The employment effect of the brewing sector can be depicted as follows:
Total employment due to production and sale of beer: 549,600 jobs
6%9%
78%
7%
Direct effect (breweries)
Indirect effect (suppliers)
Hospitality industry
Retail
Total employment due to production and sale of beer: 549,600 jobs
6%9%
78%
7%
Direct effect (breweries)
Indirect effect (suppliers)
Hospitality industry
Retail
The contribution of the brewing sector to the German economy can also be expressed in terms of value added. Total value added of the German brewing sector and value added ge-

The Contribution made by Beer to the European Economy Germany 78
nerated by firms in supplying sectors and in the hospitality and retail sectors due to the pro-duction and sale of beer amounts to around 15.1 billion euros:
Value added due to production and sale of beer: 15,100 million euro
616 2,729
3,2108,576
Breweries
Supplying sectors
Hospitality industry
Retail
Value added due to production and sale of beer: 15,100 million euro
616 2,729
3,2108,576
616 2,729
3,2108,576
Breweries
Supplying sectors
Hospitality industry
Retail The share of the brewing sector in overall value added arising from the production and sale of beer is estimated at 18 percent. This is far more than the share of direct employment con-nected to breweries as a fraction of total employment arising from the production and sale of beer (6 percent). An important explanation for this is the fact that productivity in terms of va-lue added per employee in the German brewing sector is relatively high when compared to other sectors.
***

The Contribution made by Beer to the European Economy Germany 79
13.2 Industry and market structure, trends and developments
Germany produces by far the highest volume of beer of all European countries. With around 106.2 million hectolitres brewed annually, Germany accounts for about 26 percent of all European beer production (EU-25 and Norway, Switzerland, Bulgaria, Romania, Croatia and Turkey). Germany also has the largest number of breweries in Europe, with the majority pro-ducing less than 50,000 hl a year72. At the moment there are 1,274 breweries, with 1,076 pro-ducing less than 50,000 hl and 50 producing more than 500,000 hl. Also Germany has the highest export volume of all European countries:
Key variables Millions hectolitres Illustration • Production 106.2 In 1995 production volume was 116,9 million hl and
since then production volume has decreased steadily. • Exports 13.7 More than 75 percent of total exports is exported to
other European countries • Imports 3.1 About 45 percent of this is imported from Denmark
• Consumption 95.5 69 percent lager (‘pils’)
• Home consumption < 76.9 19.5 percent of German beer is draught (64.9 percent returnable bottles and 15.6 percent non-returnable bott-les and cans)
Characteristic of the German beer market is that ‘Germans drink German beer’, predominant-ly beer produced in their home region. Only 3.1 million hectolitres is imported. Exports of German beer account for 13.7 million hl, making Germany the largest beer exporting country in Europe, followed closely by the Netherlands. Germany is also by far the largest beer mar-ket with a consumption of 95.5 million hl (triple the size of the Spanish beer market, which ranks third within the European Union, and about 60 percent bigger than the UK beer mar-ket). German per capita consumption is relatively high in a European perspective with around 116 litres of beer consumed (only per capita consumption in the Czech Republic and Ireland are higher). The German beer market is relatively fragmented, with many local breweries operating on a small scale (1,076 breweries produce less than 50,000 hl a year). The largest brewing compa-nies produce up to 10 million hl and some are meanwhile part of larger international groups. Roughly fifty percent of all breweries in Germany are in Bavaria, with more than a hundred breweries in Baden-Württemberg and Nordrhein-Westfalen. The average size of breweries, particularly in Bavaria, is therefore relatively small.
72 Source of data: Deutscher Brauer-Bund, 24. Statistischer Bericht 2003, November 2003.

The Contribution made by Beer to the European Economy Germany 80
Factors influencing the impact of the brewing sector on the German economy are73: Brewing sector internal characteristics Context in which the brewing sector operates • Majority of breweries are relatively small • Some strong international brands, resulting in
sizable exports • Strong competition for market share • Premium brands losing ground to lower-price
brands
• German beer market is stagnating with decli-ning domestic consumption
• Beer pubs under pressure, trendy lifestyle pubs and restaurants with lower beer sales rising
• German breweries spend relatively large part of purchases on supplies in their own country
• Labour costs are relatively high in comparison with breweries in other countries
13.3 Direct effect of the brewing sector
The direct economic impact of the brewing sector is substantial, with 33,400 employees. The total German brewery production value is 8.4 billion euros, of which 5.7 billion euros is spent on suppliers (67.5 percent). German breweries generate a total value added of about 2.7 billion euros:
0
20
40
60
80
100
120
output of which exports
millions hl
0
5,000
10,000
15,000
20,000
25,000
30,000
35,000
40,000
employment
0
1,000
2,000
3,000
4,000
5,000
6,000
7,000
8,000
9,000
supplies
valueadded
euro (mln.)
0
1,000
2,000
3,000
4,000
5,000
6,000
7,000
8,000
taxes paid by workers
VAT
excise
euro (mln.)
0
20
40
60
80
100
120
output of which exports
millions hl
0
20
40
60
80
100
120
output of which exports
millions hl
0
5,000
10,000
15,000
20,000
25,000
30,000
35,000
40,000
employment
0
5,000
10,000
15,000
20,000
25,000
30,000
35,000
40,000
employment
0
1,000
2,000
3,000
4,000
5,000
6,000
7,000
8,000
9,000
supplies
valueadded
euro (mln.)
0
1,000
2,000
3,000
4,000
5,000
6,000
7,000
8,000
9,000
supplies
valueadded
euro (mln.)
0
1,000
2,000
3,000
4,000
5,000
6,000
7,000
8,000
taxes paid by workers
VAT
excise
euro (mln.)
0
1,000
2,000
3,000
4,000
5,000
6,000
7,000
8,000
taxes paid by workers
VAT
excise
euro (mln.)
Taxes paid are also substantial, with excise (‘Biersteuer’) amounting to 787 million euros in 2004 and VAT on beer consumption estimated at around 4.1 billion euros (an estimated 2.6 billion euros through sales of beer on-trade, the remaining 1.5 billion euros in VAT revenues through beer sales via supermarkets and other retail firms). Brewery employees pay another 156 million euros in personal direct tax and other workers involved in the production and sale of beer generate another 2.4 billion in tax revenues. Total tax revenues are thus estima-ted at 7.5 billion euros.
73 See also Ernst & Young Germany, Breweries 2015: ways out of the crisis, the future of brewing in Germany – a scenario, May 2003.

The Contribution made by Beer to the European Economy Germany 81
13.4 Economic impact of breweries on suppliers of goods and services
The total spending by breweries on supplied goods and services is 5.7 billion euros. This spending generates important economic activities in sectors such as the services sector, agri-culture, transport, equipment and the packaging industry. Sectors Stimu-
lus74 Stimulus for Germany75
Personnel costs76 Labour costs per employee
(mln. €) % (mln. €) % of stimu-lus
(mln. €) (in €)
Number of em-ployees
• Agriculture77 992 78.3% 774 11,796• Utilities78 170 98.5% 168 10% 17 57,780 290• Packaging industry 425 85% 361 21% 76 45,228 1,678• Equipment 567 85% 482 21% 101 56,976 2,238• Transport 618 87% 538 26% 140 42,672 3,276• Media, marketing79 522 90% 469 28% 131 45,228 2,307• Services 2,376 90% 2.138 28% 599 56,976 10,508Total 5,670 4.930 32,094First round impact as % of total impact 65%Total indirect effect of brewing sector 49,376
Indirect employment generated by the German breweries reaches almost 50,000 employees. Of total indirect employment of around 49,400 jobs, some 19,715 are working in the services sector80 (including media and marketing). Indirect employment effects on agriculture are also high (with beer providing around 18,150 jobs81):
74 The split of total spending by breweries in supplying sectors is based on data from German breweries, collected by the Deutsche Brauer-Bund, and interpreted by Ernst & Young. 75 Percentages based on an Input-Output table for Germany, especially data for the food and beverage industry 76 Personnel costs as a percentage of total output of industries and labour costs per employee are obtained from Eurostat data. 77 For estimating the (primary) employment effect on agriculture, Eurostat data has been used. In Germany 592,000 agricultural ‘work units’ together produce over 38 billion euros of production value; the stimulus into the domestic agriculture sector of 774 million euros thus has an estimated impact of almost 12,000 agricultural ‘work units’. 78 German breweries paid 180 million euros in 2001 for energy ( energy use is declining). 79 In 2002 the total media expenditure of German breweries (beer brands) (‘Werbeinvestitionen’) amounted to 347 million euros. Including other types of marketing expenditure, the total German brewery media and marketing expenditure is estimated at 522 million euros. 80 If 65 percent equals 10,508 plus 2,307, then 100 percent equals 19,715. 81 If 65 percent equals 11,796, then 100 percent equals 18,150.

The Contribution made by Beer to the European Economy Germany 82
Indirect employment effects are illustrated below:
0 10,000 20,000 30,000 40,000 50,000 60,000
Agriculture
Utilities
Packaging Media, marketing
TransportationEquipment
Services
Indirect employment
0 10,000 20,000 30,000 40,000 50,000 60,000
Agriculture
Utilities
Packaging Media, marketing
TransportationEquipment
Services
Indirect employment
13.5 Retail and hospitality sectors
The German hospitality sector comprises 245,000 firms, of which around 47,000 are hotels and the like, 133,000 are restaurants and 56,000 are pubs (‘getränkeorientierte Gaststätten’)82. The hospitality sector provides jobs to 1 million employees, with 321,000 working for hotels, 83,000 in catering firms and 598,000 in restaurants or pubs. Total spending of consumers in restaurants and pubs (including fast food restaurants) amounts to 41 billion euros83.
Hospitality sector
For this study the employment arising from beer sales in the hospitality sector is estimated as follows: • Of total beer consumption in Germany an estimated 23.9 million hl are sold by the hospi-
tality sector (assuming 25 percent of total beer consumption in Germany is through the hospitality sector).
• The consumer price of one litre of beer sold in the hospitality sector is around 8 euros.
82 Source: DeHoGa Bundesverband und Statistisches Bundesamt. 83 Source: CMA and Foodservice, 2003 (equivalent to Eurostat estimate).

The Contribution made by Beer to the European Economy Germany 83
• Total turnover in the hospitality sector because of the sales of beer can be estimated at 19.1 billion euros (including VAT) and 16.5 billion euros (excl. VAT, using a VAT tariff of 16 percent).
• Turnover per employee in the German hospitality sector is 38,400 euros (excl. VAT)84. • Thus total employment in the hospitality sector arising from beer sales can be estimated
as 429,000 jobs.
Retail
Using the same approach to employment arising from beer sales in supermarkets and other retail firms produces the following: • Assuming that 75 percent of German beer consumption is of beer sold by retail, this
means that 71.6 million hl of beer are sold off-trade. • With an average consumer price of beer in supermarkets and other retail stores at 1.5
euros per litre, this means German consumers spend 10.7 billion euros on retail beer (9.3 excl. VAT).
• Eurostat statistics show that the average turnover excluding VAT per retail and wholesale employee is 243,500 euros a year, so that the estimated employment arising from German retail beer sales is 38,000 jobs.
***
84 Source: Eurostat.

The Contribution made by Beer to the European Economy Germany 84

The Contribution made by Beer to the European Economy Greece 85
14 GREECE: ECONOMIC IMPACT OF BEER
14.1 Highlights of the economic impact
The economic impact of the brewing sector can be expressed as follows: • The beer market in Greece is consolidated with a production volume of about 4 million
hectolitres. The market leader has an 80% market share. • Consumption by tourists accounts for approximately 16% of all beer consumption. • Greek breweries provide 1,800 job positions directly. • Because of goods and services bought in the supplying sectors, additional indirect em-
ployment of around 2,400 employees is generated. • In the Greek hospitality sector some 35,550 jobs can be attributed to the sale of beer and
in the retail sector this figure is around 1,275. • The total impact of the brewing sector in terms of direct and indirect employment can be
estimated as high as approximately 41,030 employees. • Tax revenues for the Greek government from the beer sector are approximately 50 million
euros in excise, 239 million euros in VAT and 66 million euros in direct personal taxes paid by workers. The total tax revenues amount to around 355 million euros.
Total employment due to the production and sale of beer is depicted below:
4% 6%
87%
3%
Total employment due to production and sale of beer: 41,030 jobs
Direct effect (breweries)
Indirect effect (suppliers)
Hospitality sector
Retail
4% 6%
87%
3%
Total employment due to production and sale of beer: 41,030 jobs
Direct effect (breweries)
Indirect effect (suppliers)
Hospitality sector
Retail
Total employment due to production and sale of beer: 41,030 jobs
Direct effect (breweries)
Indirect effect (suppliers)
Hospitality sector
Retail The total contribution to the Greek economy in terms of value added due to the production and sale of beer is estimated at 635 million euros. The hospitality sector is responsible for some two-thirds of total value added because of beer, reflecting the economic importance of this sector for both the brewing sector and for the Greek economy as a whole.

The Contribution made by Beer to the European Economy Greece 86
15 81
112
427
Value added due to production and sale of beer: 635 million euros
Breweries
Supplying sectors
Hospitality industry
Retail
15 81
112
427
15 81
112
427
Value added due to production and sale of beer: 635 million euros
Breweries
Supplying sectors
Hospitality industry
Retail
Value added due to production and sale of beer: 635 million euros
Breweries
Supplying sectors
Hospitality industry
Retail
***

The Contribution made by Beer to the European Economy Greece 87
14.2 The brewing sector: market structure, trends and developments
Greece is one of Europe’s smaller beer markets and has a slightly declining market. Total production is around 4 million hl. and beer sales are 3.9 million hl. (non-alcoholic beer and beer containing < 0.5% by volume of alcohol represent a very small volume). Consumption per capita is around 36 litres a year85. The beer consumption by approximately 12 million foreign tourists per year is estimated at 16% of the total and any fluctuation in the number and/or duration of their visit influences the volumes of beer consumed in Greece each year (in a population of 11 million inhabitants).
Key variables Millions hectolitres Illustration
• Production 4.08 5 breweries.
• Exports 0.364
• Imports 0.189
• Consumption 3.905
• Draught 8%
• Home consumption 35% 65% of beer sales is on-trade (via 75,000 outlets).
For many years one of the major European brewing companies, with its Athenian Brewery, has been the leader in Greece with a market share of 80 percent. Other market players are Mythos Brewery which ranks number two with an estimated market share of 10%, Hellenic Breweries of Atalanti with an estimated market share of 4% and the microbrewery Macedo-nian Thrace Brewery S.A..86 The economic impact of the brewing sector is influenced by the following trends, develop-ments and characteristics of the Greek economy:
Brewing sector internal characteristics Context in which the brewing sector operates • Consolidated market with a market leader ha-
ving 80 percent of the market. • Declining market. • New market entries occurred at the end of the
nineties, stimulating competition. • Several imported brands (6 percent market
share).
• Growing economy in Greece. • Since the euro’s introduction (2004) the on-
trade beer price has increased substantially which probably caused decreasing market vo-lume.
85 Source: Scottish & Newcastle press release 2002 (2002-03-05). 86 Source: Greek Brewers Association.

The Contribution made by Beer to the European Economy Greece 88
14.3 The direct effect of the brewing sector
The brewing companies provided employment to 1,800 personnel in 2004.87 The breweries together realise an estimated turnover of 270 million euros, of which approximately 189 mil-lion euros is spent in the supplying sectors. This means that the Greek breweries together rea-lise 81 million euros value added:
0
50
100
150
200
250
300
euro (mln.)
supplies
valueadded
supplies
valueadded
0
50
100
150
200
250
300
350
400
0
50
100
150
200
250
300
350
400
euro (mln.)
VAT
excise
VAT
excise
Personaldirect tax
employment
0
200
400
600
800
1.000
1,200
1,400
1,600
1,800
2,000
millions hl
0
0.5
1
1.5
2
2.5
3
3.5
4
4.5
Output Of which exports0
50
100
150
200
250
300
euro (mln.)
supplies
valueadded
supplies
valueadded
0
50
100
150
200
250
300
0
50
100
150
200
250
300
euro (mln.)
supplies
valueadded
supplies
valueadded
0
50
100
150
200
250
300
350
400
0
50
100
150
200
250
300
350
400
0
50
100
150
200
250
300
350
400
euro (mln.)
VAT
excise
VAT
excise
Personaldirect tax
employment
0
200
400
600
800
1.000
1,200
1,400
1,600
1,800
2,000
employment
0
200
400
600
800
1.000
1,200
1,400
1,600
1,800
2,000
millions hl
0
0.5
1
1.5
2
2.5
3
3.5
4
4.5
Output Of which exports
millions hl
0
0.5
1
1.5
2
2.5
3
3.5
4
4.5
Output Of which exports The tax revenues are also important, with total excise revenues on beer of 50 million euros. With beer sold in pubs and cafes, VAT revenues are generated amounting to about 203 mil-lion euros. Beer sales in supermarkets and other off-trade outlets generate another 36 million euros in VAT revenues. It can also be estimated that employees working for the Greek bre-weries together pay some 3 million euros in personal and direct tax and that workers in sup-plying sectors, in the hospitality sector and in retail who hold a job attributable to the sales of beer, pay another 63 million euros in personal direct tax. The total tax revenues arising from beer are thus estimated at 355 million euros. 14.4 The economic impact of breweries on suppliers of goods and services
Because 70 percent of the total production value of Greek breweries is spent on suppliers, breweries have an important economic impact on supplying sectors:
87 Source: The Brewers of Europe.

The Contribution made by Beer to the European Economy Greece 89
Sectors Stimu-lus88
Stimulus for the Greek economy
Personnel costs89 Labour costs per employee
(mln. €) % (mln. €) % of stimu-lus
(mln. €) (in €)
Number of em-ployees
• Agriculture90 18 35% 6 357• Utilities 7 100% 7 8% 1 30,228 18• Packaging industry 62 65% 40 16% 6 17,196 373• Equipment +other 14 65% 9 16% 1 17,196 87• Transport 27 100% 27 22% 6 24,648 238• Media, marketing 34 95% 33 25% 8 29,880 273• Services + other 27 95% 26 25% 7 29,880 218Total 189 1,563Primary impact as % of total impact 65%Total indirect effect of brewing sector 2,405
The largest proportion of supplies is purchased from the packaging industry, with further sig-nificant spending on media and marketing, transport and services.
0 500 1,000 1,500 2,000 2,500 3,000
Agriculture
Utilities
Packaging Media, marketing
TransportationEquipment Services
Indirect employment
0 500 1,000 1,500 2,000 2,500 3,000
Agriculture
Utilities
Packaging Media, marketing
TransportationEquipment Services
Indirect employment
88 Percentages-based country comparison analysis. 89 Personnel costs as a percentage of total output of industries and labour costs per employee are obtained from Eurostat data. 90 For the impact of the brewing sector on agriculture, we have used the industry ratio of total turnover to total em-ployment in FTE (i.e. 9.1 billion euros with 518,500 FTE) to go from the stimulus in agriculture because of ‘beer’ (i.e. 6 million euros) to resulting employment (357 FTE after one round).

The Contribution made by Beer to the European Economy Greece 90
14.5 Retail and hospitality sectors
In Greece 35 percent of beer sales occur through the retail channel. Another 65 percent finds its way to the consumer through the hospitality sector.91
Hospitality sector
Estimating employment in the retail sector attributable to the brewing sector: • About 35 percent of the total Greek beer consumption is beer sold by supermarkets and
other retail companies. • With an average consumer price of 1.67 euros (incl. VAT) per litre92, total consumer
spending on retail beer is estimated at 191.8 million euros (excl. VAT). • Because the annual turnover per employee is estimated at 150,300 euros, this means that
1,276 people owe their jobs to the sales of retail beer.
Retail
Employment in the hospitality sector generated by the brewing sector can be similarly assessed: • Around 65 percent of Greek beer consumption occurs in the hospitality sector. • This means that 2.5 million hl are sold by Greek pubs, restaurants and the like. • The estimated consumer price of beer is about 5 euros per litre, so that consumers are esti-
mated to spend 1.06 billion euros (excluding VAT) on beer in pubs and restaurants. • Turnover per employee in the Greek hospitality sector is 30,000 euros a year. • Total employment in the Greek hospitality sector because of beer sales is thus 35,550 em-
ployees. 93
***
91 Retail channel consists of supermarkets, hypermarkets and cash & carry shops. 92 Estimated beer price by EY, as real prices fluctuate and beer in different price ranges is available. 93 In 2004 1,028,100 people were employed in the trade, restaurants and hotels sector. Source: National Statistical Services of Greece, Greece in figures, 2005

The Contribution made by Beer to the European Economy Hungary 91
15 HUNGARY: ECONOMIC IMPACT OF BEER
15.1 Highlights on economic impact
The economic impact of the brewing sector on the Hungarian economy is substantial: • The direct effect of the brewing sector on employment is 2,460 jobs. • Because Hungarian brewers purchase goods and services from other sectors, 14,155 more
jobs are created in these sectors. • In the Hungarian hospitality sector some 29,000 jobs can be attributed to beer sales and in
retail another 3,720 employees owe their jobs to beer sales. • The total economic impact of the brewing sector on employment is estimated to be 49,200
jobs. • The Hungarian government also benefits from the brewing sector and receives an estima-
ted 374 million euros from the production and sale of beer. Excises amount to 110 million euros and VAT revenues are estimated at 207 million euros (this covers the whole beer production process, not only the breweries). Workers contribute another 57 million euros in personal direct taxes (this covers employees of breweries and other workers in the hos-pitality sector, retail and supplying sectors whose jobs can be attributed to ‘beer’).
The employment effect of the Hungarian brewing sector on the national economy is depicted as follows:
Total employment because of beer: 49,180 jobs
direct effect (breweries)
indirect effect (suppliers)
hospitality industry
retail
5%
29%
58%
8%
Total employment because of beer: 49,180 jobs
direct effect (breweries)
indirect effect (suppliers)
hospitality industry
retail
5%
29%
58%
8%
In Hungary the productivity in terms of value added per employee is relatively high in the brewing sector. The high productivity reflects the fact that in recent years the brewing sector has invested heavily in modernising breweries, also because of international companies entering the Hungarian brewing sector. This is the main explanation for the fact that the

The Contribution made by Beer to the European Economy Hungary 92
brewing sector accounts for only a small fraction of the total number of jobs attributable to the production and sale of beer, but is generating more than 35 percent of total value added due to the production and sale of beer. The total contribution of the brewing sector to the Hungarian economy (directly and indirectly), is estimated at around 410 million euros:
10
147
155
98
Value added due to production and sale of beer: 410 million euros
Breweries
Supplying sectors
Hospitality industry
Retail
10
147
155
98
10
147
155
98
Value added due to production and sale of beer: 410 million euros
Breweries
Supplying sectors
Hospitality industry
Retail
Value added due to production and sale of beer: 410 million euros
Breweries
Supplying sectors
Hospitality industry
Retail
***

The Contribution made by Beer to the European Economy Hungary 93
15.2 Market and industry structure, trends and developments
Hungary is a traditional beer-producing country, although wine is also another traditional al-coholic beverage. The first commercial brewery in Hungary was established in 1845 (by Pe-ter Schmidt), followed shortly by other breweries, some of which are still active today. In 2004 total beer consumption was 7.8 million hectolitres: Key variables Millions hectolitres Illustration • Production 7.0 • Exports 0.06 Exports are increasing slightly, but not yet significant • Imports 0.96 Imports have increased sharply in recent years (in 2002
total imports were 210,000 hl), because German breweries used their overcapacity in canning lines to increase exports to Central and Eastern Europe
• Consumption 7.0 • Draught 14% 14% of total beer sales is beer in kegs (draught), 50% is
returnable bottles and some 35% is canned beer94 • Home consumption
In Hungary three brewing companies are engaged in fierce competition to become market leader95. These companies are all part of major European brewing companies. Total sales of the leading three brewing companies in Hungary are estimated at between 2.0 and 2.3 million hl, so that the market shares of these groups amount to 30 to 33 percent. The number four position in the Hungarian beer market is (founded in 1848) is majority-owned by an Austrian brewing company. The economic impact of the brewing sector is influenced by the following trends, develop-ments and characteristics of the Hungarian economy: Brewing sector internal characteristics Context in which the brewing sector operates • Strong competition in recent years, also be-
cause of cheap imports of beer from Germany.96
• Perceptible decline of cheap beer imports in 2005.
• Many of the larger Hungarian breweries are owned by international brewing companies.
• International brewing companies have inves-ted heavily in modernising the Hungarian bre-weries, thereby improving productivity.
• Hungarian beer consumers drink an average volume from a European perspective (around 70 litres per capita annually).
• Price sensitivity of consumers; consumer beer quality consciousness is still low priority.
• In 2004 the consumer price in off-trade shops declined. In 2005 the average price of half a litre of beer has remained practically the same for bottles (130-140 HUF97) while the average price of canned products has increased slightly to approximately 145 HUF per half litre.
94 Association of Hungarian Brewers (AHB), Annual Report 2004. 95 Business Hungary.Com, Kester Eddy, Beer trouble: local brewers hope product fee will slash the flood of cheap imports, January 2005. 96 Because of a change in German environmental policy, introducing a deposit fee on cans to stimulate the reduction of rubbish, German breweries were facing underused canning lines when consumers switched from cans to bottles. The German breweries then decided to increase the export of canned beer, especially to countries in Central and Eas-tern Europe, affecting local breweries in these countries. 97 Exchange rate used: 1 euro = 253 HUF.

The Contribution made by Beer to the European Economy Hungary 94
15.3 Direct effect of the brewing sector
Total direct employment at Hungarian breweries has dropped in recent years and now stands at around 2,850 jobs98. In the first half of 2004, for example, one of the major breweries an-nounced a 17 percent cut in its workforce (124 redundancies, employment decreasing to 634 personnel) and another brewing company also announced a jobs cut of 48 staff (total employ-ment was 650 jobs). The total production value of Hungarian breweries is estimated at 517 million euros99 and about 28.4 percent (i.e. 152 million euros) of it stays within the Hungarian brewing compa-nies as value added, while the remaining 71.6 percent (370 million euros100) benefits supply-ing firms:
0
1
2
3
4
5
6
7
output of which exports
millions hl
0
100
200
300
400
500
600
supplies
valueadded
euro (mln.) employment
0
500
1,000
1,500
2,000
2,500
3,000
0
50
100
150
200
250
300
350
400
VAT
excise
Taxes paidby workers
euro (mln.)
0
1
2
3
4
5
6
7
output of which exports
millions hl
0
1
2
3
4
5
6
7
output of which exports
millions hl
0
100
200
300
400
500
600
supplies
valueadded
euro (mln.)
0
100
200
300
400
500
600
supplies
valueadded
euro (mln.) employment
0
500
1,000
1,500
2,000
2,500
3,000
employment
0
500
1,000
1,500
2,000
2,500
3,000
0
50
100
150
200
250
300
350
400
VAT
excise
Taxes paidby workers
euro (mln.)
0
50
100
150
200
250
300
350
400
VAT
excise
Taxes paidby workers
euro (mln.)
Total tax revenues for the Hungarian government are substantial, with excise revenues in 2004 of 110 million euros, total VAT revenues from beer estimated at 207 million euros101 and direct personal taxes paid by workers whose jobs can be attributed to beer totalling 57 million euros (this covers not only employees of the Hungarian breweries, but also workers in the hospitality, retail and supplying sectors). The Association of Hungarian Brewers also states in its Annual Report that the breweries pay some 5.7 million euros in corporate taxes at the national level and 4.6 million euros at the lo-cal level. Other wage-related taxes paid by the breweries are estimated at 14.4 million euros and import duties at 0.22 million euros.
98 According to the Annual Report of the Association of Hungarian Brewers. 99 Eurostat data. 100 This value, originating from Eurostat, does not correspond with the Annual Report 2004 of the Association of Hungarian Brewers because of different definitions of total purchases made by breweries. 101 These VAT revenues cover the entire chain of production, from agricultural products to pubs and restaurants sel-ling beer to consumers. Therefore this estimate does not correspond with the reported € 65 million VAT paid by the breweries in Hungary (Annual Report 2004), as this only covers ‘non-reclaimable taxes only’, to be paid by the breweries).

The Contribution made by Beer to the European Economy Hungary 95
15.4 Economic impact of breweries on suppliers of goods and services
Because the Hungarian breweries spend € 370 million on supplied goods and services, sup-plying sectors benefit substantially from the brewing sector. Sectors Stimu-
lus Stimulus for the Hungarian economy
Personnel costs102 Labour costs per employee
(mln. €) % (mln. €) % of stimu-lus
(mln. €) (in €)
Number of em-ployees
• Agriculture103 65 90% 60 5,573• Utilities 13 100% 13 8% 1 9,132 133• Packaging industry 121 50% 78 11.5% 9 6,432 1,365• Equipment +other 28 50% 18 11.5% 2 6,432 318• Transport 23 90% 23 22.1% 4 7,488 576• Media, marketing 67 100% 67 18.2% 10 13,908 688• Services + other 54 100% 54 18.2% 8 13,908 548Total 370 313 9,201Primary impact as % of total impact 65%Total indirect effect of brewing sector 14,155
Total employment generated in supplying sectors is split up as follows:
0 2,000 4,000 6,000 8,000 10,000 12,000 14,000 16,000
Agriculture
Utilities
Packaging Media, marketing
Transportation
Equipment Services
Indirect employment
0 2,000 4,000 6,000 8,000 10,000 12,000 14,000 16,000
Agriculture
Utilities
Packaging Media, marketing
Transportation
Equipment Services
Indirect employment
102 Personnel costs as a percentage of total output of industries and labour costs per employee are obtained from Eurostat data. 103 Turnover per work unit in the agricultural sector is low at € 10,724 a year. Because the brewing sector generates a stimulus of 60 million euros into agriculture, this results in 5,573 jobs in the agricultural sector.

The Contribution made by Beer to the European Economy Hungary 96
15.5 Retail and hospitality sector
The most important economic impact of the brewing sector concerns the benefits to the hos-pitality sector from beer sales.
Hospitality sector
Estimating the economic impact of the brewing sector on the hospitality sector: • It is assumed that 47.5 percent of total beer consumption in Hungary is beer sold by the
hospitality sector. • With an average price per litre of € 1.80, this means that consumer spending on beer in
the hospitality sector is € 599 million (including VAT; excluding VAT consumers spen-ding amounts to € 479 million, using a 25 percent VAT tariff).
• With an average turnover of € 16,600 per employee excluding VAT, this means 28,850 employees in the Hungarian hospitality sector owe their jobs to the brewing sector.
Retail
Employment arising from the sale of retail beer can be similarly assessed: • Assuming that 52.5 percent of total consumption is beer sold off-trade in retail, this
means some 3.7 million hl of beer are sold via retail. • With an estimated consumer price of € 1.19 a litre (including VAT) and a VAT tariff of
25 percent, total consumer spending on beer in supermarkets and other retail firms amounts to € 350 million (ex VAT).
• Because average turnover (ex VAT) of employees in retail in Hungary is € 94,000, this results in 3,720 jobs in retail that may be attributed to beer sales.
***

The Contribution made by Beer to the European Economy Ireland 97
16 IRELAND: ECONOMIC IMPACT OF BEER
16.1 Highlights of the economic impact
The economic impact of the brewing sector can be expressed as follows: • In 2004, Irish brewers produced 8.1 million hectolitres of beer. 47% of this was exported. • Irish brewers employ 2,020 personnel. • With suppliers, 8,300 fulltime jobs depend on beer; retail and hospitality outlets employ
42,300 due to the sale of beer. • The bulk is still consumed in pubs. However, the smoking ban in public places has acce-
lerated the previously apparent trend from on-trade towards off-trade channels. • A shift in consumer preferences from stout to lager. • Private consumption is shifting increasingly from beer to wine. • Government revenues from VAT and excise amount to 990 million euros. The employment effects of the brewing sector are depicted below:
Total employment due to production and sale of beer: 52,500 jobs
4%
16%
78%
2%
Direct effect (breweries)
Indirect effect (suppliers)
Hospitality sector
Retail
Total employment due to production and sale of beer: 52,500 jobs
4%
16%
78%
2%
Direct effect (breweries)
Indirect effect (suppliers)
Hospitality sector
Retail
The contribution of the brewing sector to the Irish economy can also be expressed in terms of value added. Total value added of the brewing sector in Ireland and value added generated by firms in supplying sectors and in hospitality and retail sectors arising from the production and sale of beer amounts to around 2.4 billion euros:

The Contribution made by Beer to the European Economy Ireland 98
49 360
342
1,626
Value added due to production and sale of beer: 2.4 billion euros
Breweries
Supplying sectors
Hospitality sector
Retail
49 360
342
1,626
49 360
342
1,626
Value added due to production and sale of beer: 2.4 billion euros
Breweries
Supplying sectors
Hospitality sector
Retail
The share of the brewing sector in overall value added arising from the production and sale of beer is estimated at 15 percent. This is far more than the share of direct employment con-nected to breweries as a fraction of total employment due to the production and sale of beer (4 percent). An important explanation for this is the fact that productivity in terms of value added per employee in the Irish brewing sector is relatively high compared to other sectors.
***

The Contribution made by Beer to the European Economy Ireland 99
16.2 The brewing sector: market structure, trends and developments
There are 3 major brewing groups in Ireland, which together have 7 plants. These 3 groups hold a combined market share of 99%. The other 1% is divided amongst a number of micro breweries104. In total, Irish brewers produce some 8.1 million hectolitres of beer, of which 3.4 million hectolitres are exported. The market leader holds a 74% market share. On the basis of an estimated average sales value of € 110 per hectolitre of beer, we estimate the total market value of the Irish production of beer at some € 900 million. Key variables Million hectolitres Illustration
• Production 8.1
• Exports c. 3.8 Estimate
• Imports c. 0.8 Estimate
• Consumption 5.2
• Draught 75%
• Home consumption 19%
Source: Irish Brewers Association (IBA), Office of the Revenue Commissioners, own calculations The Irish beer market is mature and highly competitive. Beer is the most popular alcoholic beverage, but in recent years market growth has slowed. In its annual report over the year 2004, Heineken described a market decline of 3% for that year. The IBA detects a 2% decli-ne. This decline can (at least partly) be attributed to the shift from drinking beer in pubs, to drinking wine at home. The main trend within the declining beer market is the shift from stout (and ale) to lager. In the year 2004, lager accounted for 53% of total beer volume in Ireland, with 39% for stout and 8% for ale (source: Interbrew market report 2004). The most important political development of recent years was the smoking ban in public pla-ces, including bars and restaurants. As of 2005, domestic production and exports are expec-ted to rise as a result of a major relocation to Ireland of brewing capacity for the UK market. 16.3 The direct effect of the brewing sector
In 2004 Irish brewers employed 2,020 people. This personnel relates entirely to activities involving the brewing of beer. From Eurostat we know that the brewing sector adds 360 mil-lion euros of value to the Irish economy. Unfortunately national statistics about the Irish bre-wing sector are unavailable because of confidentiality issues. 104 Source: The Irish Brewers’ Association (IBA).

The Contribution made by Beer to the European Economy Ireland 100
0
1
2
3
4
5
6
7
8
9
Output Of which exports
millions hl
0
100
200
300
400
500
600
700
800
900
supplies
valueadded
euro (mln.)
0
500
1,000
1,500
2,000
2,500
employment euro (mln.)
0
200
400
600
800
1,000
1,200Direct taxemployees
VAT
Excise
0
1
2
3
4
5
6
7
8
9
Output Of which exports
millions hl
0
100
200
300
400
500
600
700
800
900
supplies
valueadded
euro (mln.)
0
500
1,000
1,500
2,000
2,500
employment euro (mln.)
0
200
400
600
800
1,000
1,200Direct taxemployees
VAT
Excise
The main excise duty rate for beer in 2004 is € 19.87 per hectolitre percent of alcohol (50% refunding for small producers). In 2004, total excise revenues on beer (domestic production and imports) amounted to € 458 million. VAT on beer sales totalled € 533 million. 16.4 The economic impact of breweries on suppliers of goods and services
Based on the total value of Irish brewers’ production of € 1,200 million, and average pur-chasing expenses of 45% of the total market value (which is a conservative estimate), we ar-rive at a total estimated ‘stimulus’ of the Irish brewing sector of € 540 million. Sectors Stimu-
lus Stimulus for Ireland
Personnel costs105 Labour costs per employee
(mln. €) % (mln. €) % of stimu-lus
(mln. €) (in €)
Number of em-ployees
• Agriculture106 162 92% 149 4,540• Utilities 14 100% 14 15% 2 51,612 40• Packaging industry 54 30% 16 8% 1 32,628 40• Equipment 32 30% 10 8% 1 32,628 25• Transport 81 88% 71 17% 12 36,096 335• Media, marketing 108 40% 43 21% 9 39,312 230• Services 89 40% 36 21% 7 39,312 190Total 540 339 33 5,400Primary impact as % of total impact 65%Total indirect effect of brewing sector 8,300
105 Personnel costs as a percentage of total output of industries and labour costs per employee are obtained from Eurostat data. 106 Spending on agricultural raw materials is relatively high in Ireland. This is due to the fact that traditional Irish beers require more malt per hectolitre than lagers.

The Contribution made by Beer to the European Economy Ireland 101
As the table above shows, almost 85 percent of the economic impact of the brewing sector on suppliers in terms of jobs is concentrated in the agricultural sector. There are three important explanations for this: • It is estimated that around 30 percent of the total amount spent by brewing companies on
goods and services from supplying sectors is spent in the agricultural sector, whereas for most of the Western European countries this percentage normally lies around 15 percent.
• According to the IBA, almost all the malt used in the Irish brewing sector is produced in-side Ireland. For other supplies due to the open character of the Irish economy, a much higher fraction of the amount of money spent by brewing companies is spent abroad.
• Average labour productivity in Irish agriculture is relatively low compared to other Wes-tern European countries. A million euros spent by brewing companies in the Irish agricul-tural sector therefore generates more agricultural jobs than a million euros spent on agri-cultural products in most other Western European countries.
Indirect employment effects are illustrated below: Indirect employment
0 1,000 2,000 3,000 4,000 5,000 6,000 7,000 8,000 9,000
Agriculture Utilities
Packaging
Equipment
Transportation
Media, marketing
Other service
Indirect employment
0 1,000 2,000 3,000 4,000 5,000 6,000 7,000 8,000 9,000
Agriculture Utilities
Packaging
Equipment
Transportation
Media, marketing
Other service
0 1,000 2,000 3,000 4,000 5,000 6,000 7,000 8,000 9,000
Agriculture Utilities
Packaging
Equipment
Transportation
Media, marketing
Other service
16.5 Retail and hospitality sectors
Pubs are the dominant outlet channel for beer in Ireland. 74.5% of beer is sold on draught, 4.6% in returnable bottles, 4.1% in non-returnable bottles and 16.8% in cans. In the packaged trade, supermarkets account for the majority of the volume sold. The on-trade channel ac-counts for as much as 81% of the total beer volume consumed, which equals some 4.2 mil-lion hectolitres. The take-home market accounts for the other 19% (approx. 1 million hecto-litres), but this share has been growing over a number of years as a result of expanding UK supermarket chains. On the basis of an average beer price of € 3.60 – 3.90 per litre, the IBA

The Contribution made by Beer to the European Economy Ireland 102
values the Irish beer market at € 3.5 billion. Though the share of pubs is large, consumption of beer in pubs is down some 7% this year. This fall is due to the ban on smoking in public places including pubs and restaurants (favouring home consumption over pub consumption) and due to the shift away from beer towards wine. According to the Office of the Revenue Commissioners, Ireland had 9,731 licensed pubs, plus 796 specialised on-trade beer retailers in 2003. However, the number of on-trade outlets is falling, with more pubs closing than opening. In 2003 licences of these establishments ge-nerated some € 7.6 million of government revenues. Price differences of beer are huge, ranging from € 3.43 per litre of lager in the off-trade chan-nel, to as much as € 11.80 for bottled lager on-trade (2004 prices)107. According to the Office of the Revenue Commissioners, bar prices of stout and lager have increased between 5 and 7% a year since 2000. The table below shows these increasing prices for 2003 and 2004. No-te the declining price for off-trade lager. This results from competitive actions by supermar-ket chains to attract consumers. A logical result of the increasing price gap between lager and stout will be a further shift towards lager beers. Average consumer price per litre 2003 2004
• Off-trade Stout € 4.32 € 4.36 Lager € 3.53 € 3.43
• On-trade Draught Stout € 5.95 € 6.14 Draught Lager € 6.61 € 6.80 Draught Ale € 6.04 € 6.24 Bottled Lager € 11.52 € 11.80
Source: Central Statistics Office Ireland (CSO)
Hospitality sector
Employment arising from beer sales in the hospitality sector is estimated at 41,100 jobs: • Around 81 percent of beer consumption in Ireland takes place in the hospitality sector. • This means 4.2 million hl are sold by Irish pubs, restaurants and the like. • The consumer price of beer is about 5.25 euros per litre (excl. VAT), so that consumers
are estimated to spend 2.2 billion euros (excl. VAT) on beer in pubs and restaurants. 107 The prices in this paragraph are estimates of the average prices in the on-trade and off-trade channels. In reality, prices vary considerably, depending on many different factors including the size of the container or glass, the type of establishment and the location.

The Contribution made by Beer to the European Economy Ireland 103
• Turnover per employee in the Irish hospitality sector is 53,900 euros a year. • Total employment in this sector arising from the sale of beer is 41,100 employees108.
Retail
The importance of the brewing sector for retail can be similarly assessed: • About 19 percent of total beer consumption is beer sold by retail outlets. • With an average consumer price of 3.30 euros per litre (excluding VAT), total consumer
spending on beer in retail is estimated at 330 million euros. • Because turnover per employee is estimated at 265,000 euros, this means 1,200 people
working in the retail sector owe their jobs to the brewing sector.
*** 108 These figures are likely to decrease as the smoking ban leads to declining beer sales in the on-trade channel, and the closing down of pubs

The Contribution made by Beer to the European Economy Ireland 104

The Contribution made by Beer to the European Economy Italy 105
17 ITALY: ECONOMIC IMPACT OF BEER
17.1 Highlights of the economic impact
The most important characteristics of the Italian beer market are: • The volume of the Italian beer market is around 17.2 million hectolitres. Italian brewers
produced 13.35 million hectolitres. There are 16 production units within Italy. 27 percent of the beer consumed is imported.
• Consumption has declined in recent years, while since 2000 the market growth has been around 5%.
• The Italian breweries employ 2,700 personnel directly. • The estimated indirect employment generated is relatively large with 7,550 jobs in sup-
plying sectors, 119,150 jobs in the hospitality sector and 4,490 jobs in retail. The total in-direct employment is 133,900 job positions in Italy.
• Italian government tax revenues from the beer sector are approximately 274 million euros in excise, 1,487 million euros in VAT and 606 million euros in direct personal taxes paid by workers. Total tax revenues are approximately 2,367 million euros.
The total employment impact of beer is depicted below:
6% 2%
89%
3%
Total employment due to production and sale of beer: 133,900 jobs
Direct effect (breweries)
Indirect effect (suppliers)
Hospitality sector
Retail
6% 2%
89%
3%
Total employment due to production and sale of beer: 133,900 jobs
Direct effect (breweries)
Indirect effect (suppliers)
Hospitality sector
Retail The total contribution to the Italian economy in terms of value added arising from the pro-duction and sale of beer is estimated at 3 billion euros. The hospitality sector is responsible for around 75 percent of total value added because of beer. The share of the brewing sector in total value added that can be attributed to the production and sale of beer is estimated at al-most 9 percent. This is much higher than the share of the brewing sector in total employment

The Contribution made by Beer to the European Economy Italy 106
arising from the production and sale of beer, reflecting the relatively high productivity of the Italian brewing sector and its employees.
63 260
396
2,276
Value added due to production and sale of beer: 3,000 million euros
Breweries
Supplying sectors
Hospitality industry
Retail
63 260
396
2,276
63 260
396
2,276
Value added due to production and sale of beer: 3,000 million euros
Breweries
Supplying sectors
Hospitality industry
Retail
Value added due to production and sale of beer: 3,000 million euros
Breweries
Supplying sectors
Hospitality industry
Retail
***

The Contribution made by Beer to the European Economy Italy 107
17.2 The brewing sector: market structure, trends and developments
The Italian breweries together produced 13.35 million hectolitres of beer in 2004, which is slightly less than in 2003 (production of 13.6 million hectolitres).109 Consumption also decli-ned slightly, from 17.4 to 17.2 million hectolitres, mainly because of an increase in excise (rising by 14 percent) and weather conditions. From a more long-term perspective the Italian beer market is growing, with a rise in production of 5 percent since 2000. Italian breweries exported 850,000 hectolitres in 2004 and 4.8 million hectolitres were imported.
Key variables Millions hectolitres Illustration
• Production 13.35 Increase of 5 percent compared to 2000.
• Exports 0.85 Relatively few exports (6.4 percent of production)
• Imports 4.8 27% of the beer consumed in Italy is imported
• Consumption 17.2
• Home consumption 49%
According to the 2004 annual report of the Italian Brewers Association, Italy operated 16 do-mestic production units in 2004 of which eleven were operated by three of the major five brewing companies in Europe. Meanwhile, in 2005 14 production units and one bottling unit remain. Category Number of production units < 50,000 hl per year 1 50,000 – 100,000 per year - 100,000 – 500,000 per year 2 500,000 – 1,000,000 per year 4 1,000,000 – 2,500,000 per year 5 2,500,000 – 5,000,000 per year 2 > 5,000,000 per year - Source: AssoBirra. The largest brewing company in Italy has a market share of 34 percent. The runner up fol-lows with approximately 25 percent110. The other five brewers have market shares varying from 0.1 percent to 8.4 percent. In 2003 the three largest brewers together held a 67 percent market share. The economic impact of the brewing sector is influenced by the following trends, develop-ments and characteristics of the Italian economy:
109 Source: Associazione degli Industriali della Birra e del Malto (AssoBirra), Annual Report 2004. 110 Source: SABMiller, press release 23rd February 2005.

The Contribution made by Beer to the European Economy Italy 108
Brewing sector internal characteristics Context in which the brewing sector operates
• Per capita beer consumption is low in Italy (29 litres per inhabitant in 2004)
• Scale of breweries is large with average pro-duction of 835,000 hl per location in 2004 (al-though not as high as in countries such as Spain)
• Italian breweries are among the most efficient in Europe, with an average production of 4,900 hl a year per employee (only exceeded by Portugal and Ireland).
• Excise tax rates were increased in 2004 by 13.6%, resulting in a drop in consumption, and again in 2005 by 23.9% generating a further decrease in consumption.111
17.3 The direct effect of the brewing sector
Total direct employment by Italian breweries lies around 2,700 employees. The value of total beer production can be estimated at 1.2 billion euros and value added generated by the Italian breweries at 260 million euros (approximately 21 percent of total production value). This means that supplying sectors benefit from purchased goods and services to a value of 960 million euros.
Of which exports0
2
4
6
8
10
12
14
Output
millions hl euro (mln.)employment
0
500
1,000
1,500
2,000
2,500
3,000
euro (mln.)
0
200
400
600
800
1,000
1,200
1,400
valueadded
supplies
0
500
1,000
1,500
2,000
2,500
Personal direct tax
excise
VAT
Of which exports0
2
4
6
8
10
12
14
Output
millions hl
Of which exports0
2
4
6
8
10
12
14
Output
millions hl euro (mln.)employment
0
500
1,000
1,500
2,000
2,500
3,000
employment
0
500
1,000
1,500
2,000
2,500
3,000
0
500
1,000
1,500
2,000
2,500
3,000
euro (mln.)
0
200
400
600
800
1,000
1,200
1,400
valueadded
supplies
0
500
1,000
1,500
2,000
2,500
Personal direct tax
excise
VAT
111 Source: Associazione degli Industriali della Birra e del Malto (AssoBirra).

The Contribution made by Beer to the European Economy Italy 109
17.4 The economic impact of breweries on suppliers of goods and services
Of the total production value of Italian breweries, around 79 percent is spent on suppliers, so that breweries exercise an important economic impact on supplying sectors: Sectors Stimu-
lus112 Stimulus for the Italian economy
Personnel costs113 Labour costs per employee
(mln. €) % (mln. €) % of stimu-lus
(mln. €) (in €)
Number of em-ployees
• Agriculture114 92 60% 55 1,494• Utilities 24 100% 24 9% 2 44,028 49• Packaging industry 241 96% 231 14% 32 31,776 1,018• Equipment +other 96 90% 87 14% 12 31,776 381• Transport 103 99% 102 21% 21 35,208 608• Media, marketing 170 94% 160 19% 30 53,412 568• Services + other 236 94% 221 19% 42 53,412 786Total 963 4,906Primary impact as % of total impact 65%Total indirect effect of brewing sector 7,548
The largest proportion of supplies is purchased from the packaging industry, with further sig-nificant spending on services, media and marketing and transport. Based on the combination of data from the brewing sector in Italy itself and data available from the most recent Italian Input-Output table115, it is estimated that indirect employment arising from the supplied goods and services purchased by Italian breweries is around 7,548 employees in the sup-plying sectors.
112 Percentages based on data obtained from Italian breweries and checked with Input/Output data (food and bevera-ge). 113 Personnel costs as a percentage of total output of industries and labour costs per employee are obtained from Eurostat data. 114 For the impact of the brewing sector on agriculture, we have used the industry ratio of total turnover to total em-ployment in FTE (i.e. 41.8 billion euros with 1,128,000 FTE) to go from the stimulus in agriculture because of ‘beer’ (i.e. 55 million euros) to resulting employment (1,494 FTE after primary round). 115 Source: Istat (I/O table for 1992).

The Contribution made by Beer to the European Economy Italy 110
0 1,000 2,000 3,000 4,000 5,000 6,000 7,000 8,000
Agriculture
Utilities
Packaging Media, marketing
Transportation
Equipment Services
Indirect employment
0 1,000 2,000 3,000 4,000 5,000 6,000 7,000 8,000
Agriculture
Utilities
Packaging Media, marketing
Transportation
Equipment Services
Indirect employment
The analysis shows that agriculture, the packaging industry and the services sector benefit most from the indirect impact of Italian breweries. The impact is relatively substantial becau-se a high percentage of goods and services purchased by the breweries is purchased in Italy itself.116 117 17.5 Retail and hospitality sectors
Markets for the retail and catering industry in Italy are more balanced than those in other Southern European countries, as around 51 percent is sold by the catering industry and another 49 percent via the retail channel.118
Hospitality sector
Many jobs in the Italian hospitality sector can be attributed to the sale of beer: • 51 percent of beer consumption in Italy occurs in the hospitality sector. • This means 8.8 million hl are sold by Italian pubs, restaurants and the like. • The consumer price of beer is about 3.50 euros a ‘pinta’ (a pint is 0.473 litres) 119, so that
consumers pay around 8.75 per litre of beer (incl. VAT) in the hospitality sector. 116 For all supplying sectors it is estimated that more than 80 percent of supplies sourced by breweries are bought in Italy. Only for agriculture is the percentage lower, also because some of the five major European breweries are ope-rating in Italy, and for agricultural products these firms exercise an international perspective. The impact of the bre-wing sector on agricultural employment in Italy is therefore relatively low from an international perspective. 117 The Italian Input Output table for 1992 shows that for the food and beverage industry, 24 percent of supplies was bought outside Italy (import). 118 Source: Associazione degli Industriali della Birra e del Malto 2004 119 Concerm estimated beer price by EY, as real prices fluctuate and beer in different price ranges is available.

The Contribution made by Beer to the European Economy Italy 111
• Total turnover in the Italian hospitality sector arising from beer sales is thus estimated at 6.4 billion euros (excl. VAT).
• Turnover per employee in the Italian hospitality sector is 54,000 euros a year.120 • Total employment in the Italian hospitality sector because of beer sales thus equals
119,146 personnel.
Retail
Employment in retail arising from beer sales can be similarly assessed: • About 49 percent of total Italian beer consumption is beer sold by supermarkets and other
retail companies. • With an average consumer price of 1.43 euros (incl. VAT) per litre121, total consumer
spending on retail beer is estimated at 1.2 billion euros (excl. VAT). • Because the annual turnover per employee is estimated at 222,300 euros, this means that
4,490 personnel owe their jobs to the sale of retail beer.
*** 120 Eurostat, statistics on turnover per persons employed in services (‘hospitality sector’). 121 Concerm estimated beer price by EY, as real prices fluctuate and beer in different price ranges is available.

The Contribution made by Beer to the European Economy Italy 112

The Contribution made by Beer to the European Economy Latvia 113
18 LATVIA: ECONOMIC IMPACT OF BEER
18.1 Highlights of economic impact
The economic impact of the brewing sector can be expressed as follows: • Latvian beer production totalled 1,343,000 hectolitres. Consumption was 1,332,000 hec-
tolitres, of which 80% was sold through shops. • A significant share of the retail sales is private exports to Sweden and Finland. • Latvian brewers employ some 1,500 personnel, with another 5,000 in supplying sectors;
3,500 full-time jobs depend on beer sales in the retail and hospitality sectors. • VAT, excise revenues and direct taxes paid by workers whose jobs are generated due to
the production and sale of beer amount to some 40 million euros annually, VAT being the most important source of revenues for government (almost 20 million euros annually).
The total employment effects of the brewing sector are depicted below:
15%
50%
21%
14%
Total employment due to production and sale of beer: 10,000 jobs
Direct effect (breweries)
Indirect effect (suppliers)
Hospitality sector
Retail
15%
50%
21%
14%
Total employment due to production and sale of beer: 10,000 jobs
Direct effect (breweries)
Indirect effect (suppliers)
Hospitality sector
Retail
Total employment due to production and sale of beer: 10,000 jobs
Direct effect (breweries)
Indirect effect (suppliers)
Hospitality sector
Retail The contribution of the brewing sector to the Latvian economy can also be expressed in terms of value added. Total value added of the brewing sector in Latvia and value added ge-nerated by firms in the supply, hospitality and retail sectors arising from the production and sale of beer amounts to around 62 million euros:

The Contribution made by Beer to the European Economy Latvia 114
Value added due to production and sale of beer: 62 million euro
Breweries
Supplying sectors
Hospitality industry
Retail
3
3520
4
Value added due to production and sale of beer: 62 million euro
Breweries
Supplying sectors
Hospitality industry
Retail
Value added due to production and sale of beer: 62 million euro
Breweries
Supplying sectors
Hospitality industry
Retail
3
3520
4
The share of the brewing sector in overall value added arising from the production and sale of beer is estimated at 56 percent. This is far more than the share of direct employment con-nected to breweries as a fraction of total employment arising from the production and sale of beer (17 percent). The relatively high productivity in the Latvian brewing sector in terms of value added per employee is an important explanation for this.
***

The Contribution made by Beer to the European Economy Latvia 115
18.2 The brewing sector: market structure, trends and developments
Latvian beer production totalled 1,343,000 hectolitres in 2004. Beer is still brewed in a very traditional way in Latvia. The average value of a hectolitre of beer is approximately € 71. Hence, the total ex-brewery value of the products amounted to some € 95 million. Domestic producers held a combined market share of 91% in 2004, according to the State Revenue Service (although part of this domestic ‘production’ is imported from abroad and only bottled in the country). The four largest breweries have a combined market share of some 70 percent, more than half of which (36%) is for the market leader. Key variables Million hectolitres Illustration
• Production 1.3 Beer production for 2005 is expected to be lower due to increasing imports of cheap Russian and Ukrainian beer.
• Exports 0.1 • Imports122 0.1 • Consumption123 1.3 • Home consumption 80% Estimate Source: State Revenue Service Excise Goods Board Economic development is expected to have a large impact on the beer and soft drinks sectors. Latvia is still one of the poorest EU countries, but its economy is also one of the fastest gro-wing. Both the beer sector and the hospitality sector are likely to profit from the economic growth. An important trend within the Latvian market is the increasing market share of cheap impor-ted beers. The Latvian Brewers’ Association forecasts that domestic Latvian brewers will lose further market share to imports from Russia and Ukraine. 18.3 The direct effect of the brewing sector
The Latvian brewing sector employs some 1,500 personnel, the majority associated with bre-wing beer. Other activities performed by the brewers include the production of other bevera-ges, transportation and wholesaling. The brewing sector achieves a value added of some € 35 million124.
122 Source: State Revenue Service Excise Goods Board. 123 Source: State Revenue Service Excise Goods Board. 124 Source: Eurostat

The Contribution made by Beer to the European Economy Latvia 116
0
0.2
0.4
0.6
0.8
1
1.2
1.4
1.6
Output Of which exports
millions hl
0
10
20
30
40
50
60
70
80
90
100
supplies
valueadded
euro (mln.)
0
200
400
600
800
1,000
1,200
1,400
1,600
employment euro (mln.)
0
5
10
15
20
25
30
35
40
45Direct taxemployees
VAT
Excise
0
0.2
0.4
0.6
0.8
1
1.2
1.4
1.6
Output Of which exports
millions hl
0
0.2
0.4
0.6
0.8
1
1.2
1.4
1.6
Output Of which exports
millions hl
0
10
20
30
40
50
60
70
80
90
100
supplies
valueadded
euro (mln.)
0
200
400
600
800
1,000
1,200
1,400
1,600
employment euro (mln.)
0
5
10
15
20
25
30
35
40
45Direct taxemployees
VAT
Excise
euro (mln.)
0
5
10
15
20
25
30
35
40
45Direct taxemployees
VAT
Excise
Important other economic effects are the tax revenues. VAT revenues from beer are estima-ted at € 19 million annually. Excise revenues amount to some € 13 million at an average rate of € 9.10 per hectolitre. 18.4 The economic impact of breweries on suppliers of goods and services
We estimate that Latvian breweries spend some € 60 million annually on raw materials, goods and services. This stimulus leads to 5,010 jobs in various sectors. This employment stimulus trickles down, mainly to the agricultural sector. Latvia has a population of only 2.3 million which makes some packaging types not economi-cally feasible, e.g. metal cans. One thus will not find local beer or beverages in cans. PET bottles are the most important liquid packaging for the beverage industry. The main suppliers are in Estonia, Lithuania and some other EU countries. The beer and beverages industry cur-rently imports all glass bottles from abroad, mainly from Sweden125.
125 Source: Strategis.

The Contribution made by Beer to the European Economy Latvia 117
Sectors Stimu-lus
Stimulus for the Latvian economy
Personnel costs126 Labour costs per employee
(mln. €) % (mln. €) % of stimu-lus
(mln. €) (in €)
Number of em-ployees
• Agriculture 20 40 8 2,305• Utilities 7 100 7 20 1 6,540 210• Packaging industry 7 0 0 0 0 3,936 110• Equipment +other 2 50 1 16 0 3,936 35• Transport 5 100 5 16 1 5,784 145• Media, marketing 17 100 17 22 4 9,276 405• Services + other 2 100 2 22 0 9,276 40Total 60 3,255Primary impact as % of total impact 65%Total indirect effect of brewing sector 5,000
Source: Own calculations on the basis of National Statistics and Eurostat Indirect employment effects are illustrated below:
0 1,000 2,000 3,000 4,000 5,000 6,000
Agriculture
Utilities
Packaging Media, marketing
Transportation
Equipment
Services
Indirect employment
0 1,000 2,000 3,000 4,000 5,000 6,000
Agriculture
Utilities
Packaging Media, marketing
Transportation
Equipment
Services
Indirect employment
126 Personnel costs as a percentage of total output of industries and labour costs per employee are obtained from Eurostat data.

The Contribution made by Beer to the European Economy Latvia 118
18.5 Retail and hospitality sectors
Hospitality sector
The approach to estimate employment in the hospitality sector dependent on beer takes turn-over of beer in pubs and restaurants as a starting point: • We estimate that around 20 percent of beer consumption in Latvia occurs in the hospitali-
ty sector. • This means 260,000 hectolitres are sold by Latvian pubs, restaurants and the like. • The consumer price of beer is about 0.92 euros per litre (excl. VAT)127, so that consumers
are estimated to spend 23 million euros (excl. VAT) on beer in pubs and restaurants. • Turnover per employee in the Latvian hospitality sector is 11,100 euros a year. • Total employment in the Latvian hospitality sector attributable to beer thus equals 2,100
employees.
Retail
Similarly, the approach for the retail sector is as follows: • We estimate that 80% of beer consumed is sold through shops. • At an average retail price (excluding VAT) of 0.85 euros, the estimated sales value equals
90 million euros (excluding VAT). • The average annual turnover per employee in the retail sector is 63,000 euros. Hence beer
sales through retail outlets provides 1,400 full-time jobs.
***
127 The prices in this paragraph are estimates of the average prices in the on-trade and off-trade channels. In reality, prices vary considerably, depending on many different factors including the size of the container or glass, the type of establishment and the location.

The Contribution made by Beer to the European Economy Lithuania 119
19 LITHUANIA: ECONOMIC IMPACT OF BEER128
19.1 Highlights of the economic impact
The economic impact of the brewing sector can be expressed as follows: • Lithuanian brewers brewed 2.8 million hectolitres of beer in 2004, of which 3.7% was ex-
ported. • Direct employment at Lithuanian breweries is 2,750 employees. • Indirect employment through beer production amounts to 5,900 full-time jobs with
suppliers, 3,750 jobs in the hospitality sector and 3,200 jobs in retail outlets. • The Lithuanian government has substantial revenues from beer, amounting to 70 million
euros. The employment effects of the brewing sector are depicted below:
18%
38%
24%
20%
Total employment due to production and sale of beer: 15,600 jobs
Direct effect (breweries)
Indirect effect (suppliers)
Hospitality sector
Retail
18%
38%
24%
20%
Total employment due to production and sale of beer: 15,600 jobs
Direct effect (breweries)
Indirect effect (suppliers)
Hospitality sector
Retail The contribution of the brewing sector to the Lithuanian economy can also be expressed in terms of value added. Total value added of the brewing sector in Lithuania and value added generated by firms in the supply, hospitality and retail sectors arising from the production and sale of beer amounts to around 129 million euros:
128 Where applicable, an exchange rate was applied of € 1 = 3.45 litai

The Contribution made by Beer to the European Economy Lithuania 120
Value added due to production and sale of beer: 129 million euro
Breweries
Supplying sectors
Hospitality industry
Retail
10
47
66
7
Value added due to production and sale of beer: 129 million euro
Breweries
Supplying sectors
Hospitality industry
Retail
Value added due to production and sale of beer: 129 million euro
Breweries
Supplying sectors
Hospitality industry
Retail
10
47
66
710
47
66
7
The share of the brewing sector in overall value added arising from the production and sale of beer is estimated at 51 percent. This is far more than the share of direct employment connected to breweries as a fraction of total employment arising from the production and sale of beer (22 percent). An important explanation is that productivity in terms of value added per employee in the Lithuanian brewing sector is very high compared to other sectors.
***

The Contribution made by Beer to the European Economy Lithuania 121
19.2 The brewing sector: market structure, trends and developments
Lithuanian brewers produced 2.8 million hectolitres in 2004. Of this 3.7 percent is exported. In the same year, per capita beer consumption was 81.2 litres. Some 88 percent of beer is consumed at home.
Key variables Million hectolitres Illustration
• Production 2.8 Lithuania has 87 licensed breweries.
• Exports 0.1 Imports are rising fast. In 2004, 105% more beer was imported than in 2003.
• Imports 0.2 In 2004, exports were up 43% from 2003.
• Consumption 2.8 Per capita beer consumption is 81.2 litres.
• Home consumption 88%
There are 87 licensed breweries in Lithuania, but only six of these produce more than 50,000 hectolitres per year. The nine largest breweries, sharing 90% of the market, have formed the Lithuanian Breweries Association. Brewing sector internal characteristics Context in which the brewing sector operates
• Relatively small companies • Home consumption is the dominant way of
consuming beer
• Accession to EU in 2004 • High growth of both imports and exports • Premium segments starting to develop
19.3 The direct effect of the brewing sector
According to Eurostat data, Lithuanian breweries have an annual turnover of some € 180 million. Of this € 66 million is value added at factor cost and € 113 million is expendi-tures on goods and services. According to Eurostat, the brewing sector employs some 2,750 beer brewing personnel. 400 workers are also associated with other beverages. Excise revenues make up € 32 million129. VAT revenues from beer amount to € 38 million and personal direct taxes paid by employees whose jobs can be attributed to the production and sale of beer are estimated at around 12 million euros annually.
129 Source: The Brewers of Europe

The Contribution made by Beer to the European Economy Lithuania 122
millions hl euro (mln.) employment euro (mln.)
0
0.5
1
1.5
2
2.5
3
Output Of which exports0
20
40
60
80
100
120
140
160
180
200
supplies
value added
0
500
1,000
1,500
2,000
2,500
3,000
0
10
20
30
40
50
60
70
80
90Direct taxemployees
VAT
Excise
millions hl euro (mln.) employment euro (mln.)
0
0.5
1
1.5
2
2.5
3
Output Of which exports0
0.5
1
1.5
2
2.5
3
Output Of which exports0
20
40
60
80
100
120
140
160
180
200
supplies
value added
0
20
40
60
80
100
120
140
160
180
200
supplies
value added
0
500
1,000
1,500
2,000
2,500
3,000
0
500
1,000
1,500
2,000
2,500
3,000
0
10
20
30
40
50
60
70
80
90Direct taxemployees
VAT
Excise
0
10
20
30
40
50
60
70
80
90Direct taxemployees
VAT
Excise
19.4 Economic impact of breweries on suppliers of goods and services
The agriculture, media and services sectors benefit most from the expenditures of the bre-wing sector. However, of the € 113 million spent only € 16 million turns into personnel costs within the country. Sectors Stimu-
lus Stimulus for the Lithuanian economy
Personnel costs130 Labour costs per employee
(mln. €) % (mln. €) % of stimu-lus
(mln. €) (in €)
Number of em-ployees
• Agriculture 23 50 11.5 1,825• Utilities 5 100 5 10 0.5 6,060 80• Packaging industry 5 50 2.5 15 0.375 4,536 85• Equipment +other 13 100 13 17 2.21 5,592 85• Transport 4 50 2 15 0.3 4,536 380• Media, marketing 23 100 23 20 4.6 9,012 510• Services + other 40 100 40 20 8 9,012 880Total 113 97 16 3,840Primary impact as % of total impact 65%Total indirect effect of brewing sector 5,900
Source: Own calculations on the basis of National Statistics and Eurostat As the above table shows, 3,840 jobs at suppliers to the brewing sector depend on the bre-wing sector. This is called the first round or primary indirect effect. Normally, the primary effect is only 65% of the total indirect effect, since suppliers also purchase goods and out-
130 Personnel costs as a percentage of total output of industries and labour costs per employee are obtained from Eurostat data.

The Contribution made by Beer to the European Economy Lithuania 123
source services. Hence the total indirect employment effect of the Lithuanian brewing sector is estimated at 5,900 jobs. Indirect employment effects are illustrated below:
0 1,000 2,000 3,000 4,000 5,000 6,000 7,000
Agriculture
Utilities
Packaging Media, marketing
Transportation
Equipment
Services
Indirect employment
0 1,000 2,000 3,000 4,000 5,000 6,000 7,000
Agriculture
Utilities
Packaging Media, marketing
Transportation
Equipment
Services
Indirect employment
19.5 Retail and hospitality sectors
88 percent of the beer volume (2.5 million hectolitres) is sold through shops. The remaining 12 percent (340,000 hectolitres) finds its way to the consumer through pubs, bars and restau-rants. The average price of a litre of beer in the off-trade channel varies from 2.50 litai (€ 0.72) for beer in plastic bottles, to 3.40 litai (€ 0.99) for beer in glass bottles. The average price for a litre of beer in the on-trade channel is around 4.00 litai (€ 1.16).131
Hospitality sector
The approach to estimate employment in the hospitality sector attributable to the brewing sector, takes the beer sales turnover of pubs and restaurants as a starting point: • Around 12 percent of beer consumption occurs in the hospitality sector. • This means that 340,000 hl are sold by pubs, restaurants and the like. • The consumer price of beer is about 0.98 euros per litre (excl. VAT), so that consumers
are estimated to spend 33 million euros on beer in pubs and restaurants. • Turnover per employee in the Lithuanian hospitality sector is 9,000 euros a year.
131 The prices in this paragraph are estimates of the average prices in the on-trade and off-trade channels. In reality, prices vary considerably, depending on many different factors including the size of the container or glass, the type of establishment and the location.

The Contribution made by Beer to the European Economy Lithuania 124
• Total employment in the Lithuanian hospitality sector because of beer sales is thus 3,750 employees.
Retail
The importance of the brewing sector for retail in terms of jobs can be similarly assessed: • 2.5 million hectolitres of beer are sold by supermarkets and other retail companies. • With an average consumer price of 0.72 euros per litre (excluding VAT), total consumer
spending on retail beer is estimated at 215 million euros. • Because turnover per employee is estimated at 57,400 euros, this means 3,200 people owe
their jobs to the sale of retail beer.
***

The Contribution made by Beer to the European Economy Luxembourg 125
20 LUXEMBOURG: ECONOMIC IMPACT OF BEER
20.1 Highlights of economic impact
The economic impact of the brewing sector on the Luxembourg economy is substantial: • Direct employment connected to Luxembourg’s breweries is 350 jobs. • Luxembourg’s supply sectors benefit because of brewery purchases and this results in 220
jobs with Luxembourg suppliers. • The hospitality sector also benefits from beer sales. It is estimated that 1,765 jobs can be
attributed to beer sales. • Another 45 retail jobs are attributable to beer sales. • In total this means 2,380 Luxembourg jobs can be attributed to the brewing sector and
beer sales. • The Luxembourg government also benefits from the brewing sector, as it receives some
22 million euros because of VAT (most of it through beer consumed in pubs and restau-rants: 18 million euros), an additional 3.6 million euros through excise and an estimated 8 million euros through personal direct taxes paid by employees of the Luxembourg brewe-ries and workers in the hospitality sector, retail and supplying sectors who owe their job to beer production and consumption.
The total employment effect of the Luxembourg breweries is summarised below:
15%
9%
74%
2%
Total employment due to production and sale of beer: 2,380 jobs
direct effect (breweries)
indirect effect (suppliers)
hospitality industry
retail
15%
9%
74%
2%
Total employment due to production and sale of beer: 2,380 jobs
direct effect (breweries)
indirect effect (suppliers)
hospitality industry
retail The 2,380 jobs attributable to the production and sale of beer contribute substantially to the Luxembourg economy. In terms of value added the economic contribution arising from the
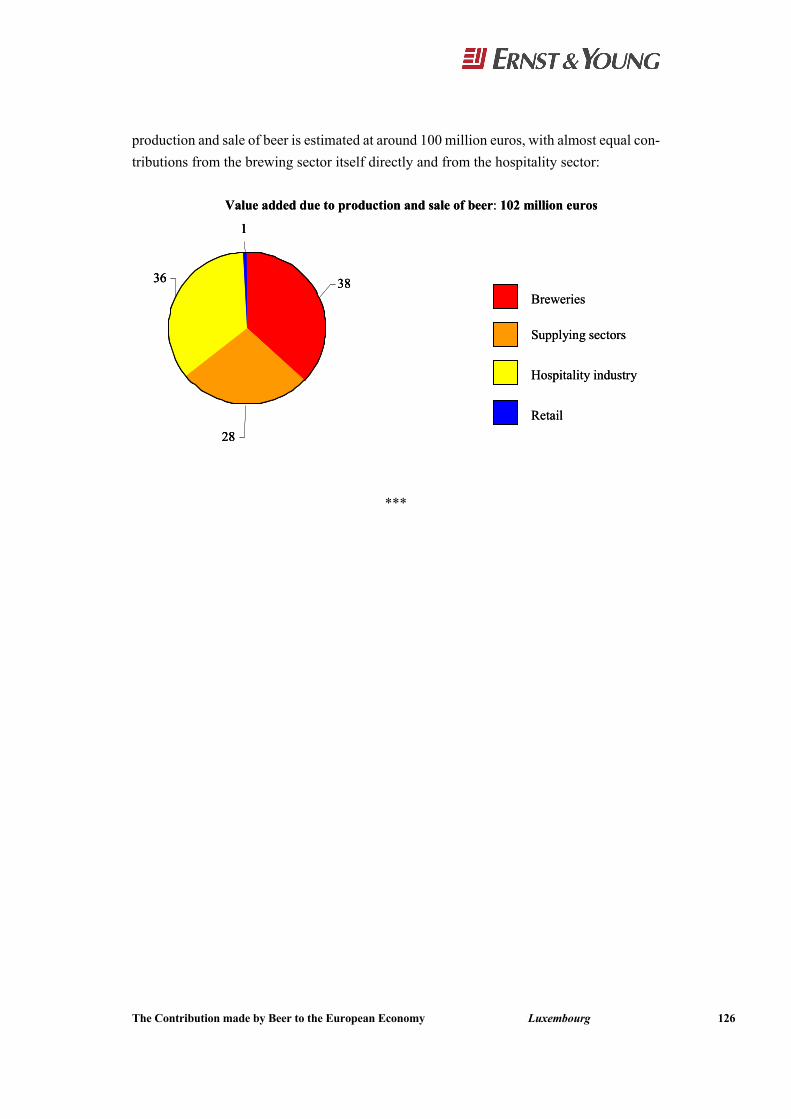
The Contribution made by Beer to the European Economy Luxembourg 126
production and sale of beer is estimated at around 100 million euros, with almost equal con-tributions from the brewing sector itself directly and from the hospitality sector:
1
38
28
36
Value added due to production and sale of beer: 102 million euros
Breweries
Supplying sectors
Hospitality industry
Retail
1
38
28
36
1
38
28
36
Value added due to production and sale of beer: 102 million euros
Breweries
Supplying sectors
Hospitality industry
Retail
***

The Contribution made by Beer to the European Economy Luxembourg 127
20.2 Market and industry structure, trends and developments
Luxembourg is one of Western Europe’s smallest countries and beer markets, but it is home to a reasonable number of breweries given its size. Luxembourg hosts six breweries, some of them small scale. Together these breweries produce almost 400,000 hl a year:
Key variables Millions hectolitres Illustration
• Production 0.39 Production has decreased from 0.44 mln hl in 2000 (production peaked at 0.8 mln hl in 1976)
• Exports 0.08
• Imports 0.18
• Consumption 0.37
• Draught 55.1% In 2002 total consumption of 383,327 hl was divided between draught (211,000 hl), bottles (142,000, 38%) and cans (29,930, 7.6%)
• Home consumption <44.9% Main source: Statistics provided by the Fédération des Brasseurs Luxembourgeois to The Brewers of Europe
The largest brewing company and Luxembourg’s market leader is part of an international brewing company. This Luxembourg subsidiary has a production volume of 250,000 hl and a market share of around 41.4 percent (the rest of its production is exported). The runner-up in the Luxembourg beer market has an annual production of 168,000 hl: Category Number of production units < 50,000 hl per year 4 50,000 – 100,000 per year 1 100,000 – 500,000 per year 2 500,000 – 1,000,000 per year 1,000,000 – 2,500,000 per year 2,500,000 – 5,000,000 per year > 5,000,000 per year The economic impact of the brewing sector is influenced by the following trends, develop-ments and characteristics of the Luxembourg economy:
Brewing sector internal characteristics Context in which the brewing sector operates
• For a relatively small country there are quite a few breweries
• Two breweries dominate the Luxembourg beer market in terms of production volume
• In 2000 two of the largest brewing companies merged and the level of consolidation in the Luxembourg beer market increased substan-tially
• Beer consumption is stagnating, although per capita consumption is relatively high and com-parable to that in countries such as Belgium and Denmark
• Per capita consumption has decreased from 109 litres in 1999 to less than 98 litres

The Contribution made by Beer to the European Economy Luxembourg 128
20.3 Direct effect of the brewing sector
The brewing sector provides jobs to some 350 employees. Total production value of the Luxembourg breweries is estimated at 90 million euros, of which 38 million euros remains within the brewing companies as value added:
0
0.05
0,1
0.15
0,2
0.25
0,3
0.35
0,4
0.45
output of which exports
millions hl
0
10
20
30
40
50
60
70
80
90
100
supplies
valueadded
euro (mln.)
0
50
100
150
200
250
300
350
400
employment
0
5
10
15
20
25
30
35
40
taxes paidby workers
VAT
excise
euro (mln.)
0
0.05
0,1
0.15
0,2
0.25
0,3
0.35
0,4
0.45
output of which exports
millions hl
0
0.05
0,1
0.15
0,2
0.25
0,3
0.35
0,4
0.45
output of which exports
millions hl
0
10
20
30
40
50
60
70
80
90
100
supplies
valueadded
euro (mln.)
0
10
20
30
40
50
60
70
80
90
100
supplies
valueadded
euro (mln.)
0
50
100
150
200
250
300
350
400
employment
0
50
100
150
200
250
300
350
400
employment
0
5
10
15
20
25
30
35
40
taxes paidby workers
VAT
excise
euro (mln.)
0
5
10
15
20
25
30
35
40
taxes paidby workers
VAT
excise0
5
10
15
20
25
30
35
40
taxes paidby workers
VAT
excise
euro (mln.)
Tax revenues arising from the production and consumption of beer is also important. Excise revenues amount to 3.6 million euros, VAT revenues of beer sold in pubs (on-trade) is esti-mated at 18 million euros and VAT on beer sold in supermarkets (off-trade) at 4 million euros. The government also benefits through personal direct taxes paid by brewery emplo-yees and those who owe their jobs to the production or sale of beer in the supplying sectors and in hospitality and retail. The government receives another 8 million euros in personal di-rect taxes. The breweries exercise a substantial effect on the supply sectors through the 53 million euros spent by breweries on a range of goods and services necessary for brewing. Given the size of Luxembourg, a high proportion of these purchases comes from abroad. 20.4 Economic impact of breweries on suppliers of goods and services
This 53 million euros generates economic activity in various sectors, with the service sectors benefiting most:

The Contribution made by Beer to the European Economy Luxembourg 129
Sectors Stimu-lus
Stimulus for Luxembourg
Personnel costs132 Labour costs per employee
(mln. €) % (mln. €) % of stimulus
(mln. €) (in €)
Number of em-ployees
• Agriculture133 7 15% 1 17• Utilities 2 75% 1 10% 0,1 62,052 2• Packaging industry 8 20% 2 18% 0,3 37,380 7• Equipment 1 20% 0 18% 0,0 37,380 1• Transport 6 50% 3 21% 0,7 43,248 15• Media, marketing 11 70% 7 35% 2,6 70,968 37• Services 18 70% 13 35% 4,5 70,968 63Total 53 27 143First round impact as % of total impact 65%Total indirect effect of brewing sector 220
Total employment generated in supplying sectors is divided as follows:
0 50 100 150 200 250
Agriculture
Utilities
Packaging
Media, marketing
Transportation
Equipment
Services
Indirect employment
0 50 100 150 200 250
Agriculture
Utilities
Packaging
Media, marketing
Transportation
Equipment
Services
Indirect employment
20.5 Retail and hospitality sectors
Hospitality sector
The economic impact of the brewing sector on the hospitality sector is estimated as follows:
132 Personnel costs as a percentage of total output of industries and labour costs per employee are obtained from Eurostat data. 133 The average turnover per agricultural work unit in Luxembourg is 61,662 euros. With a impulse arising from the production of beer of 1.0 million euros, this means that 17 people are working in the agricultural sector whose jobs can be attributed to the brewing sector (primary effect).

The Contribution made by Beer to the European Economy Luxembourg 130
• On-trade beer sales make up 55 percent of total beer sales and therefore equal 205,100 hl. • With an average consumer price of 6.66 euros per litre (including VAT), this means con-
sumers spend 136 million euros on beer in the hospitality sector (including VAT). Excluding VAT, consumers spend an estimated 118 million euros.
• Average turnover per employee in the Luxembourg hospitality sector is 67,300 euros, so that 1,755 jobs in the hospitality sector can be attributed to the brewing sector.
Retail
Employment in retail attributable to beer sales can be similarly estimated: • Because the percentage of off-trade in total beer consumption is 45 percent in Luxem-
bourg, this means that off-trade beer consumption amounts to about 169,000 hl. • With an average retail beer price of 1.64 euros per litre it is estimated that total retail beer
consumption is 27.5 million euros including VAT (excluding VAT, using a 15 percent tariff, consumer spending on beer amounts to 23.9 million euros).
• Average turnover (ex VAT) in the Luxembourg wholesale and retail sector is estimated by Eurostat at 526,400 euros. Using this average turnover provides an estimate of em-ployment in retail arising from beer sales: 45 jobs.
***

The Contribution made by Beer to the European Economy The Netherlands 131
21 THE NETHERLANDS: ECONOMIC IMPACT OF BEER
21.1 Highlights of the economic impact
The economic impact of the brewing sector can be expressed as follows: • The Netherlands is the number one beer-exporting country in Europe (about 54 percent of
total 23.8 million hl beer production is exported). • Partly as a result, direct employment by Dutch breweries is 7,500 jobs. • The brewing sector generates important indirect effects within supply sectors. It is estima-
ted that 12,035 supply industry jobs can be attributed to the brewing sector (beer sales), with the services sectors benefiting most.
• Alongside these direct and indirect effects, the hospitality sector and retailers benefit through beer sales. More than 57,000 jobs in the hospitality sector can be attributed to beer, while in retail some 2,700 people owe their jobs to beer sales.
• The total employment impact is thus 79,475 jobs. • The government also benefits from the brewing sector, receiving some 1.3 billion euros in
taxes and excises. Excise revenues amount to 325 million euros, VAT collected on beer (sold in the hospitality sector and through retailers) is estimated at almost 665 million euros, while revenues from direct personal taxes paid by Dutch brewery employees, their suppliers and in hospitality and retail add up to some 310 million euros.
The employment impact of the brewing sector is depicted below:
Total employment due to production and sale of beer: 76,475 jobs
direct effect (breweries)
indirect effect (suppliers)
hospitality industry
retail
9%
15%
73%
3%
Total employment due to production and sale of beer: 76,475 jobs
direct effect (breweries)
indirect effect (suppliers)
hospitality industry
retail
9%
15%
73%
3%
All these jobs generated through the production and sale of beer contribute substantially to the Dutch economy in value added terms. The total value added generated by the Dutch

The Contribution made by Beer to the European Economy The Netherlands 132
brewing sector and all economic activities within supplying sectors and in the hospitality sec-tor and retail arising from the production and sale of beer is estimated at 2.7 billion euros:
Value added due to production and sale of beer: 2,710 million euros
64
770
677
1,196
Breweries
Supplying sectors
Hospitality industry
Retail
Value added due to production and sale of beer: 2,710 million euros
64
770
677
1,196
64
770
677
1,196
Breweries
Supplying sectors
Hospitality industry
Retail
The brewing sector share in overall value added arising from the production and sale of beer is 28 percent, which is far higher than the brewing sector share in total employment arising from beer. A significant explanation for this is the high productivity of brewing sector em-ployees.
***

The Contribution made by Beer to the European Economy The Netherlands 133
21.2 Industry and market structure, trends and developments
The Dutch brewing sector produces 23.8 million hectolitres of beer annually (in 2004), of which 54 percent is exported (12.9 million hectolitres).
Key variables Millions hectolitres Illustration
• Production 23.8 14 breweries with a production > 10,000 hl annually (11 with a production over 50,000 hl)
• Exports 12.9 United States by far most important export country
• Imports 1.3
• Consumption 12.1 Mainly lager (93 percent in 2004)
• Home consumption 67%
Together with Germany, the Netherlands is Europe’s (and the world’s) largest beer exporting country, and ranks fourth in production (only behind Germany, the United Kingdom and Spain). The Dutch brewing sector is well established and encompasses several international players. The Netherlands is home to one of the world’s largest brewing companies (Heine-ken). The largest brewery in the Netherlands, belonging to this brewing company, produces 10 million hectolitres a year of which 60 percent is exported. In addition to this there are three other brewing companies with an important market share. One of these companies has an annual production of 2.0 million hectolitres for the domestic market, while also exporting 2.7 million hectolitres. Another company has recently built a new brewery (investing 227 million euros, resulting in a brewery with a capacity of 3.2 million hectolitres a year). The third biggest operator on the Dutch market is one of the major five European brewing compa-nies and produces some strong local brands whilst also selling lager and special beers produ-ced in Belgium. Although the largest Dutch beer manufacturers operate internationally, some medium and smaller breweries possess a strong regional consumer base. An example being an indepen-dent brewery in the south of the Netherlands, with a company policy of buying ingredients within the home region. Such breweries have a relatively large economic impact on their ho-me areas. Factors that influence the impact of the brewing sector on the Dutch economy are:

The Contribution made by Beer to the European Economy The Netherlands 134
Brewing sector internal characteristics Context in which the brewing sector operates
• Typical market structure with one market lea-der with 50 percent of the market and three other strong players each with up to 15 percent of the market
• These larger breweries have a strong interna-tional orientation
• Larger breweries are among the most efficient in Europe
• Low-price segment is growing at the expense of the premium segment
• Outsourcing non-core activities (such as trans-port)
• Dutch beer market is stagnating • Netherlands is a relatively small and open
country, thus importing a substantial propor-tion of supplies
• Strong pressure on supermarket beer pricing, because supermarkets are subject to strong competition
21.3 Direct effect of the brewing sector
The direct brewing sector economic impact covers more than 7,500 employees who together produce beer worth over 2.5 billion euros, so it is fair to say that the direct economic benefit of the brewing sector on the Dutch economy is significant.
0
5
10
15
20
25
Output of which exports
millions hl
0
500
1,000
1,500
2,000
2,500
3,000
euro (mln.)
supplies
valueadded
0
1,000
2,000
3,000
4,000
5,000
6,000
7,000
8,000
employment
0
200
400
600
800
1,000
1,200
1,400
VAT
excise
other
euro (mln.)
0
5
10
15
20
25
Output of which exports
millions hl
0
5
10
15
20
25
Output of which exports
millions hl
0
500
1,000
1,500
2,000
2,500
3,000
euro (mln.)
supplies
valueadded
0
500
1,000
1,500
2,000
2,500
3,000
euro (mln.)
supplies
valueadded
0
1,000
2,000
3,000
4,000
5,000
6,000
7,000
8,000
employment
0
1,000
2,000
3,000
4,000
5,000
6,000
7,000
8,000
employment
0
200
400
600
800
1,000
1,200
1,400
VAT
excise
other
euro (mln.)
Another substantial direct effect of the brewing sector concerns taxes and excises paid by beer brewers and consumers. In 2004 excises reached 325 million euros and total VAT in-come for the Dutch government was estimated at 665 million euros. Personal direct taxes paid by employees of the brewing sector and by others whose jobs can be attributed to ‘beer’ (in retail and hospitality sectors and in the sectors supplying goods and services to the brewe-ries) add up to another 310 million euros. The Dutch breweries together achieved an estimated 2.5 billion euros in turnover. About 30 percent of total turnover stays within these firms as value added (770 million euros). Value added equals total reward for production factors used: labour costs, interest paid and profits made.

The Contribution made by Beer to the European Economy The Netherlands 135
21.4 Economic impact of breweries on goods and services suppliers
With 30 percent of the value of the output produced staying within the firm as value added, the other 70 percent of 2.5 billion euros in total turnover accrues to a number of suppliers. This stimulus of 1.8 billion euros has significant economic impact on sectors outside the bre-wing sector, most substantially on the services sector: Sectors Stimulus Stimulus for
the Netherlands134
Personnel costs135 Labour costs per employee
(mln. €) % (mln. €) % of stimu-lus
(mln. €) (in €)
Number of em-ployees
• Agriculture136 261 50%137
131 1,378
• Utilities 108 97.5% 105 11% 12 53,556 216• Packaging industry 108 58% 63 26% 16 38,940 418• Equipment 108 44% 48 26% 12 38,940 317• Transport 153 61% 93 36% 34 39,204 857• Media,
marketing138 207 80% 166 30% 50 52,212 952
• Services 855 75% 641 30% 192 52,212 3,684Total 1,800 1,246 7,072First round impact as % of total impact 65%Total indirect effect of brewing sector 12,035
Half of all the indirect employment generated by the brewing sector is within the services sector. Other substantial effects are seen in media and marketing, transport and agriculture. The total first round employment effect of the brewing sector on supplying sectors is over 7,000 employees. As this primary effect can be estimated at about 65 percent of the total impact, the total impact will be about 12,035 jobs.
134 Percentages based on Input-Output tables for the Netherlands and data obtained from two Dutch breweries. 135 Personnel costs as a percentage of total industry output and labour costs per employee are obtained from Eurostat data. 136 Average turnover per agricultural worker is estimated at some 95,000 euros a year (based on a total agricultural labour force of 200,100 and a total net turnover of 18.9 billion euros a year), so that with a domestic agricultural stimulus of 131 million euros some 1,375 jobs are generated in this sector. 137 The largest brewing company in the Netherlands, for one, imports much of its malt from Belgium. 138 Media and marketing expenditure of the total Dutch alcohol production industry was estimated at 273 million euros in 2003 (HCM Communications). Some 75 percent of this is spent by producers of low-alcohol drinks (beer and premixed drinks). Media and marketing expenditure is rising steadily.

The Contribution made by Beer to the European Economy The Netherlands 136
Indirect employment effects are illustrated below:
0 2,000 4,000 6,000 8,000 10,000 12,000 14,000
Agriculture
Utilities
Packaging Media, marketing
TransportationEquipment Services
Indirect employment
0 2,000 4,000 6,000 8,000 10,000 12,000 14,000
Agriculture
Utilities
Packaging Media, marketing
TransportationEquipment Services
Indirect employment
21.5 Retail and hospitality sectors
Hospitality sector
The economic impact of the breweries on the hospitality sector is assessed as follows: • About 33 percent of all beer consumed in the Netherlands is sold by the hospitality sector
(on-trade), which means almost 4 million hl is sold on-trade. • The average consumer price of beer in Dutch pubs and restaurants is estimated at 8 euros
a litre (including VAT), so that total consumer spending on beer in the hospitality sector is 3.2 billion euros (including VAT).
• Net consumer spending on beer is thus estimated at 2.7 billion euros (using a 19 percent VAT tariff).
• With an average hospitality turnover of 46,900 euros (excluding VAT) per person, this results in 57,240 hospitality sector jobs attributable to beer sales.
Retail
The importance of the brewing sector for retail can be similarly assessed: • Around 67 percent of total beer consumption (8.1 million hl) in the Netherlands is beer
sold by supermarkets and other retail outlets.

The Contribution made by Beer to the European Economy The Netherlands 137
• With an average consumer price of 1.20 euros per litre (including VAT), total retail con-sumer spending on beer is estimated at 970 million euros. Total consumer spending ex-cluding VAT is thus 817 million euros.
• With turnover per employee estimated at 302,000 euros (excluding VAT), this means 2,707 people owe their jobs to retail beer sales.
***

The Contribution made by Beer to the European Economy The Netherlands 138

The Contribution made by Beer to the European Economy Poland 139
22 POLAND: ECONOMIC IMPACT OF BEER139
22.1 Highlights of the economic impact
The economic impact of the brewing sector can be expressed as follows: • Direct employment connected to the Polish breweries is estimated at 15,000 jobs. • Employment in the supplying sectors is important with a total number of full-time jobs
arising from the brewing sector of around 56,200. • The impact on the hospitality sector is also huge, with around 91,200 people (full-time
jobs) earning a living in this sector because of beer sales. In the retail sector, 23,700 full-time jobs depend on beer sales.
• The total employment effect is thus estimated to be 186,000 FTEs. • There is a high degree of concentration: 3 companies hold a combined market share of
around 85 percent. • Some significant limitations on beer advertising. • Beer prices substantially higher than in neighbouring countries. • Annual government revenues from excise and VAT on beer amount to € 1.2 billion. The employment effects of the brewing sector are depicted below:
8%
30%
49%
13%
Total employment due to production and sale of beer: 186,000 jobs
Direct effect (breweries)
Indirect effect (suppliers)
Hospitality sector
Retail
8%
30%
49%
13%
Total employment due to production and sale of beer: 186,000 jobs
Direct effect (breweries)
Indirect effect (suppliers)
Hospitality sector
Retail The contribution of the brewing sector to the Polish economy can also be expressed in terms of value added. Total value added of the brewing sector in Poland and value added generated
139 In this chapter values have been converted from zlotys to euros, using a conversion rate of € 1 = 4.52 zloty.

The Contribution made by Beer to the European Economy Poland 140
by firms in the supply, hospitality and retail sectors due to the production and sale of beer amounts to around 2.0 billion euros:
Value added due to production and sale of beer: 2.0 billion euro
Breweries
Supplying sectors
Hospitality industry
Retail
99
958
563
383
Value added due to production and sale of beer: 2.0 billion euro
Breweries
Supplying sectors
Hospitality industry
Retail
Value added due to production and sale of beer: 2.0 billion euro
Breweries
Supplying sectors
Hospitality industry
Retail
99
958
563
383
99
958
563
383
The share of the brewing sector in overall value added arising from the production and sale of beer is estimated at 48 percent. This is far more than the share of direct employment con-nected to breweries as a fraction of total employment arising from the production and sale of beer (9 percent). An important explanation is that productivity in terms of value added per employee in the Polish brewing sector is relatively high compared to other sectors.
***

The Contribution made by Beer to the European Economy Poland 141
22.2 The brewing sector: market structure, trends and developments
The Polish beer sector is a highly dynamic one, with a rapid growth in beer production over the past 15 years. This growth is the result of a consumer preference shift away from vodka and towards beer. In 1990 Polish brewers brewed 11.4 million hectolitres of beer. In the 1990s production volume grew by 6 to 14 % per year. Production thus almost tripled to 29.2 million hectolitres of beer in 2004. The current growth is mainly in the low-priced segments of the beer market, but the premium segment is also growing, though at a slower pace. The consumption of beer, measured in litres per capita, is now more or less in line with the EU average, but is still below the average of the neighbouring countries. Growth is thus ex-pected to continue. Different patterns of imports and exports have emerged since EU acces-sion, according to the official GUS140 statistics. Formal imports have increased by 4 percent since accession, while exports have surged by around 250 percent to over 600 thousand hec-tolitres (May 2004-May 2005)141 and growing:
Key variables Million hectolitres Illustration • Production 29.2 Production volume has tripled since 1990
• Exports 0.6 In 2004 Polish breweries exported 609 thousand hecto-litre (in 2003: 198 thousand hectolitres).
• Imports 0.2 In 2004 total official imports amounted 182 thousand hectolitres (in 2003: 190 thousand hectolitres).
• Consumption 28.8 Slight increase compared to 2003 (28,4 million hl).
• Draught 10-12% Around 54 percent of total consumption in the second quarter of 2005 concerned bottled beer, 36 percent cans and the remaining 10 percent (in 2003: 11%) was kegs.
• Home consumption 73%
Though the sales volume is divided among 65 brewing companies, the market is highly con-solidated. After certain foreign investors decided to abandon the Polish beer market because of insufficient profitability, it is now dominated by three companies. These have a combined market share of almost 85 percent. Smaller producers often hold a strong position in their own local or regional markets, although this strong position is not reflected in their national market shares.142 The economic impact of the brewing sector is influenced by the following trends, develop-ments and characteristics of the Polish economy:
140 The Central Statistical Office of Poland. 141 Source: Browary Polskie (Polish Brewers Association), Statystyka Branzowa, 2005. 142 Source: Electronic Journal of Polish Agricultural Universities, volume 7, no. 2 (data for 2003).

The Contribution made by Beer to the European Economy Poland 142
Brewing sector internal characteristics Context in which the brewing sector operates
• Production has tripled since 1990 • Consumer preferences shifting from vodka to
beer (despite cut in vodka excise) • Foreign brewing companies have invested in
Polish breweries and now control a large share of the total beer market
• Production per employee in the brewing sector is increasing because of modernisation of bre-weries, but still relatively low (with around 1,950 hl per employee a year)
• The government promised to reduce excise on beer by 25 percent prior to Poland’s accession to the EU, but this promise has not yet been realised.143
• Polish incomes are gradually increasing, sti-mulating spending behaviour
• Despite rising wages, Polish labour costs are still (very) low compared by Western Euro-pean standards
• Imports and exports especially have risen sin-ce Poland became a member of the European Union.
22.3 The direct effect of the brewing sector
The brewing sector turnover for 2002 was € 2.1 billion. The industry employs some 15,000 workers (of whom nearly 10,000 are at the three largest companies). The sector generated € 958 million of added value. Direct effects in terms of profits are dominated by the three main players. Together the three major brewers have a combined profit of 769 million zlotys (€ 170 million), which represents 75 percent of the total profits in the Polish brewing sector144. The larger companies are parti-cularly profitable as many smaller brewers face financial problems.
143 Excise tax reduction was negotiated with the government prior to Poland’s accession. As result the Ministry of Finance increased the preferential rates on beer produced by small breweries (with production up to 200,000 hl per year) by 25%. It was also recommended to monitor any negative consequences of excise tax differences with neigh-bouring countries. These might trigger a substantial increase in private import and cross-border purchasing. (Source: Browary Polskie). 144 Source: Polish Brewers Association.

The Contribution made by Beer to the European Economy Poland 143
euro (mln.)millions hl
0
5
10
15
20
25
30
35
Output Of which exports
euro (mln.)
0
500
1,000
1,500
2,000
2,500
supplies
value added
employment
0
2,000
4,000
6,000
8,000
10,000
12,000
14,000
16,000
0
200
400
600
800
1,000
1,200
1,400 Direct taxemployees
VAT
Excise
euro (mln.)millions hl
0
5
10
15
20
25
30
35
Output Of which exports
millions hl
0
5
10
15
20
25
30
35
Output Of which exports
euro (mln.)
0
500
1,000
1,500
2,000
2,500
supplies
value added
euro (mln.)
0
500
1,000
1,500
2,000
2,500
supplies
value added
employment
0
2,000
4,000
6,000
8,000
10,000
12,000
14,000
16,000
employment
0
2,000
4,000
6,000
8,000
10,000
12,000
14,000
16,000
0
200
400
600
800
1,000
1,200
1,400 Direct taxemployees
VAT
Excise
Direct taxemployees
VAT
Excise
Another substantial direct effect of the brewing sector involves taxes and excises paid by the breweries and beer consumers. In 2004 excise duties were 495 million euros and total VAT income for the government is estimated at 727 million euros. 22.4 The economic impact of breweries on suppliers of goods and services
In 2002 Polish brewers spent a total of € 1,084 million on purchased goods and services145. As breweries’ output volumes have increased more than 10% since then, this amount is likely to have risen. Since Poland is a very large country, the majority of the required products and services are produced within the country’s borders. On average, 92 cents of each euro spent on goods and services, is spent domestically. The indirect effect of the brewing sector on other sectors in the country is thus considerable146. The following tables present the outcome of the input/output analysis. The tables show that the brewing sector induces 56,200 jobs in supplying sectors:
145 Source: Eurostat. 146 In fact, economic research by Kompania Piwowarska indicates that each job at a brewery supports approximately 20 jobs with suppliers.

The Contribution made by Beer to the European Economy Poland 144
Sectors Stimu-lus
Stimulus for the Polish economy
Personnel costs147 Labour costs per employee
(mln. €) % (mln. €) % of stimu-lus
(mln. €) (in €)
Number of em-ployees
• Agriculture 190 40% 76 0 15,035• Utilities 37 99% 38 20% 8 10,068 765• Packaging industry 354 77% 274 22% 60 7,188 8,500• Equipment +other 82 77% 64 22% 14 7,188 1,980• Transport 66 94% 63 32% 20 8,688 2,345• Media, marketing 197 92% 182 28% 51 11,748 4,400• Services + other 155 92% 143 28% 40 11,748 3,500Total 1084 838 193 36,515Primary impact as % of total impact 65%Total indirect effect of brewing sector 56,200
Total employment generated in supplying sectors is split up as follows:
0 10,000 20,000 30,000 40,000 50,000 60,000
Agriculture
Utilities
Packaging Media, marketing
Transportation
Equipment Services
Indirect employment
0 10,000 20,000 30,000 40,000 50,000 60,000
Agriculture
Utilities
Packaging Media, marketing
Transportation
Equipment Services
Indirect employment
22.5 Retail and hospitality sectors
In 2004, 50 percent of the beer sales was sold in glass bottles, 37 percent in cans, and 12 per-cent in kegs. In the first quarter of 2005 a shift was visible from kegs to cans, indicating a shift from on-trade to off-trade. In 2004, 27 percent of the total beer volume was sold
147 Personnel costs as a percentage of total output of industries and labour costs per employee are obtained from Eurostat data.

The Contribution made by Beer to the European Economy Poland 145
through some 50,000 on-trade outlets148. The remaining 73 percent was sold through the off-trade channel, mainly independent retailers. Distribution channels (2004) Average retail
price per litre (incl. VAT) 149
Market share (volume)
Turnover on beer
(incl. VAT)
On-trade € 2.07 27% 40% Off-trade € 1.15 73% 60% Total 28.8 million hl € 4.024 billion
Hospitality sector
Estimating the share of total employment in the hospitality sector attributable to the brewing sector: • Around 27 percent of beer consumption in Poland occurs in the hospitality sector. • This means 7.8 million hectolitres are sold through Polish pubs, restaurants and the like. • According to the Polish Brewers the average consumer price for beer in the hospitality
sector is € 1.70 per litre (excl. VAT) and this leads to a total on-trade beer turnover in the hospitality sector of € 1.3 billion (excl. VAT).
• With average turnover per person employed at € 14,500, this means that some 91,200 people are employed in the hospitality sector because of beer sales.
Retail
The importance of the brewing sector for retail can be similarly assessed: • About 73 percent of total beer consumption is beer sold by supermarkets and other retail
companies. • With an average consumer price of € 0.94 per litre (excl. VAT), total consumer expendi-
ture on retail beer is estimated at € 1,980 million. • Because turnover per employee is estimated at € 83,700, this means that 23,700 people
owe their jobs to the sale of retail beer.
***
148 Source: Polish Brewers. 149 The prices in this paragraph are estimates of the average prices in the on-trade and off-trade channels. In reality, prices vary considerably, depending on many different factors including the size of the container or glass, the type of establishment and the location.

The Contribution made by Beer to the European Economy Poland 146

The Contribution made by Beer to the European Economy Portugal 147
23 PORTUGAL: ECONOMIC IMPACT OF BEER
23.1 Highlights of the economic impact
The economic impact of the brewing sector can be expressed as follows: • Portuguese breweries employ about 2,206 staff (FTE). • Because of goods and services bought in supplying sectors, additional indirect employ-
ment is generated of around 7,193 employees. • In the Portuguese on-trade some 111,083 employees can be attributed to the sales of beer.
In off-trade around 1,809 individuals owe their jobs to beer sales. • The total impact of the brewing sector in terms of employment can thus be estimated to
be up to 122,291 employees. • Portuguese tax revenues from the beer sector are approximately 84 million euros in exci-
se, 626 million euros in VAT and 164 million euros in direct personal taxes paid by wor-kers. The total tax revenues are around 874 million euros.
2% 6%
91%
1%
Total employment due to production and sale of beer: 122,300 jobs
Direct effect (breweries)
Indirect effect (suppliers)
Hospitality sector
Retail
2% 6%
91%
1%
Total employment due to production and sale of beer: 122,300 jobs
Direct effect (breweries)
Indirect effect (suppliers)
Hospitality sector
Retail The total contribution to the Portuguese economy in terms of value added arising from the production and sale of beer is estimated at 1.5 billion euros. The hospitality sector is respon-sible for more than 75 percent of total value added because of beer, reflecting the economic importance of this sector for both the brewing sector and the Portuguese economy as a who-le. Value added per employee is relatively high in the Portuguese brewing sector compared to others (only in the utilities sector is value added per employee higher than in the brewing sector), reflecting its high productivity, so that the share of the breweries in total value added

The Contribution made by Beer to the European Economy Portugal 148
generated is greater than the previously-presented share for total employment due to the pro-duction and sale of beer:
14 146
142
1,189
Value added due to production and sale of beer: 1,490 million euros
Breweries
Supplying sectors
Hospitality industry
Retail
14 146
142
1,189
Value added due to production and sale of beer: 1,490 million euros
Breweries
Supplying sectors
Hospitality industry
Retail
Value added due to production and sale of beer: 1,490 million euros
Breweries
Supplying sectors
Hospitality industry
Retail
***

The Contribution made by Beer to the European Economy Portugal 149
23.2 The brewing sector: market structure, trends and developments
Total beer production in Portugal was 7.4 million hectolitres in 2004. Total consumption is 6.3 million hectolitres (which is 61.7 litres per inhabitant).150 Portuguese breweries exported 1.3 million hl in 2004, while importing 1.189 million hectolitres. Production is increasing due to the rising export of Portuguese brands, mainly to countries with significant groups of Portuguese immigrants and Portuguese-speaking countries in Africa, along with Spain.
Key variables Millions hectolitres Illustration
• Production 7.4 Total production has been rising from 6.4 million hl in 2000 to 7.4 million hl today (14% increase)
• Exports 1.3 Most important countries importing Portuguese beer are the Portuguese-speaking countries in Africa and other countries with sizable communities of Portuguese immigrants, and Spain.
• Imports 0.1 • Consumption 6.3 • Draught 20% • Home consumption 34% With six brewing companies in the country (two large companies and another four smaller firms) the Portuguese beer market is somewhat concentrated. Within the Portuguese borders there are 8 production units. The largest brewer has three plants. The others each have one production unit. There is fierce competition between the two largest brewers for market sha-re, partly through competition on prices. This has forced them to develop an efficient produc-tion process to achieve the lowest possible cost price. According to the Portuguese Brewers’ Association (APCV) the production units are technically up-to-date while some brewers are still in the process of further modernisation. The Portuguese beer market is a closed one which is difficult to enter although no regulatory entry barriers exist. The main reason is Portuguese beer consumers’ loyalty to their own na-tional brands. According to the APCV several foreign brewers have attempted to enter the lo-cal market in recent years by introducing their own brands, but none has succeeded in gai-ning an important market share. The economic impact of the brewing sector is influenced by the following trends, develop-ments and characteristics of the Portuguese economy:
150 10,148,259 inhabitants (censos de INE, 2001), source: APCV

The Contribution made by Beer to the European Economy Portugal 150
Brewing sector internal characteristics Context in which the brewing sector operates
• Highly concentrated market, with the two lar-gest companies holding a 95 percent market share.
• Volume of beer produced per employee avera-ges 3,354 hl a year.
• Fierce competition between two major bre-wing companies, also resulting in price com-petition.
• Efficient production facilities (modern brewe-ries, relatively large scale).
• Most of the beer consumed in Portugal is from the on-trade market (66 percent).
• Labour costs in Portugal are relatively low from a (Western) European perspective.
• Because Portugal is a relatively small country, one expects that a relatively large fraction of supplies purchased by breweries would be im-ported; however for the food and beverage in-dustry as a whole more than 75 percent of pur-chased supplies are bought in Portugal.151
The large average size of Portuguese breweries is illustrated below152:
Production units in hectolitres Number of production units < 50,000 hl per year 1 50,000 – 100,000 per year 1 100,000 – 500,000 per year 3 500,000 – 1,000,000 per year 1,000,000 – 2,500,000 per year 2 2,500,000 – 5,000,000 per year 1 > 5,000,000 per year 23.3 The direct effect of the brewing sector
The brewing companies offered employment to 2,206 personnel in 2004.153 The production value of Portuguese breweries in 2004 can be estimated at 466 million euros (in 2002 pro-duction value was 410 million euros). Around 30 percent of production value stays within the breweries as value added, which means that 70 percent of total value produced is transferred to supplying firms in various sectors, approximately 320 million euros. This means that the Portuguese breweries together realise 146 million euros value added:
151 Source: Departamento de Prospectiva e Planeamento, Sistema integrado de matrizes de Input-Output para Portugal de 1995, a precos correntes e a preços de 1999, Lisboa, 2004. 152 Source: APCV (Portuguese Brewers’ Association). 153 Source: APCV (Portuguese Brewers’ Association)

The Contribution made by Beer to the European Economy Portugal 151
0
50
100
150
200
250
300
350
400
450
500
millions hl euro (mln.) employment euro (mln.)
0
1
2
3
4
5
6
7
8
Output Of which exports
supplies
valueadded
0
100
200
300
400
500
600
700
800
900
1,000
Personal direct tax
VAT
excise
50
1,000
1,500
2,000
2,500
00
50
100
150
200
250
300
350
400
450
500
millions hl euro (mln.) employment euro (mln.)
0
1
2
3
4
5
6
7
8
Output Of which exports0
1
2
3
4
5
6
7
8
Output Of which exportsOutput Of which exports
supplies
valueadded
0
100
200
300
400
500
600
700
800
900
1,000
Personal direct tax
VAT
excise
Personal direct tax
VAT
excise
50
1,000
1,500
2,000
2,500
0
23.4 The economic impact of breweries on suppliers of goods and services
Of the total production value of Portuguese breweries around 70 percent is spent on sup-pliers, so that breweries exercise an important economic impact on supplying sectors: Sectors Stimu-
lus154 Stimulus for the Portuguese economy
Personnel costs155 Labour costs per employee
(mln. €) % (mln. €) % of stimu-lus
(mln. €) (in €)
Number of em-ployees
• Agriculture 29 92% 27 2,350• Utilities 6 100% 6 8% 1 22,212 22• Packaging industry 62 84% 52 16% 8 11,880 706• Equipment +other 22 64% 14 16% 2 11,880 188• Transport 27 100% 27 22% 6 20,796 284• Media, marketing 40 75% 30 25% 8 28,944 261• Services + other 133 75% 100 25% 25 28,944 864Total 320 247 4,675Primary impact as % of total impact 65%Total indirect effect of brewing sector 7,193
Source: Own calculations on the basis of National Statistics and Eurostat
154 Percentages based on country data comparison analysis and checked with Input/Output data for food and bevera-ge. 155 Personnel costs as a percentage of total output of industries and labour costs per employee are obtained from Eurostat data.

The Contribution made by Beer to the European Economy Portugal 152
The largest proportion of supplies is purchased from the services sector, while there is also significant spending on packaging, media and marketing and agricultural produce. For the impact of the brewing sector on agriculture, we have used the industry ratio of total turnover to total employment in FTE (i.e. 5.8 billion euros with 508,000 FTE) to go from the stimulus in agriculture because of ‘beer’ (i.e. 27 million euros) to resulting employment (2,350 FTE after primary round). Total indirect impact of the brewing sector is estimated to be 7,200 employees:
0 1,000 2,000 3,000 4,000 5,000 6,000 7,000 8,000
Agriculture
Utilities
Packaging Media, marketing
Transportation
Equipment Services
Indirect employment
0 1,000 2,000 3,000 4,000 5,000 6,000 7,000 8,000
Agriculture
Utilities
Packaging Media, marketing
Transportation
Equipment Services
Indirect employment
23.5 Retail and hospitality sectors
34 percent of Portugal’s beer sales occur through the off-trade channel. Another 66 percent finds its way to the consumer through the on-trade channel.
Hospitality sector
The employment due to the sale of beer in the Portuguese hospitality sector is estimated at over 110,000 jobs: • Around 66 percent of beer consumption in Portugal occurs on-trade. • This means 4.16 million hl are sold by Portuguese pubs, restaurants and the like. • The average consumer price of beer is about 9.76 euros per litre (local brands, including
VAT) 156, so that consumers are estimated to spend 3.4 billion euros on beer in pubs and restaurants.
156 Estimated by EY, as beer prices fluctuate and beer in different price ranges is available.

The Contribution made by Beer to the European Economy Portugal 153
• Turnover per employee in the Portuguese on-trade is 30,700 euros annually. • Total employment in the Portuguese on-trade arising from beer sales thus equals approxi-
mately 111,083 employees.
Retail
Retail also benefits from the sale of beer, although to a much lesser extent than the hospitali-ty sector: • About 34 percent of total Portuguese beer consumption is beer sold by supermarkets and
other retail companies. • With an average consumer price of 1.48 euros (incl. VAT) per litre157, total consumer
spending on retail beer is estimated at 271 million euros (excl. VAT). • Because the annual turnover per employee is estimated at 149,800 euros, this means
1,809 individuals owe their jobs to the sales of retail beer.
***
157 Estimated by EY, as beer prices fluctuate and beer in different price ranges is available.

The Contribution made by Beer to the European Economy Portugal 154

The Contribution made by Beer to the European Economy Slovakia 155
24 SLOVAKIA: ECONOMIC IMPACT OF BEER
24.1 Highlights on economic impact
The economic impact of the brewing sector on the Slovak economy is substantial: • Direct employment in the Slovak brewing sector is 2,720 employees. • Indirect employment generated by the brewing sector in the supplying sectors consists of
4,534 jobs. • In the hospitality sector, around 16,750 jobs can be attributed to the brewing sector. Like-
wise in retail around 1,400 employees owe their jobs to beer sales. • The total employment effect of the brewing sector on the Slovak economy can be estima-
ted at around 25,400 jobs. • The government in Slovakia also benefits from the production and consumption of beer.
Excise revenues are 54.4 million euros a year and total VAT revenues are estimated at 81 million euros. Another 11 million euros in tax revenues are generated through the perso-nal direct taxes paid by employees of the breweries and other employees whose jobs can be attributed to beer in sectors such as hospitality and the retail and supplying sectors.
In total the production and consumption of beer in Slovakia generates some 25,400 jobs:
11%
18%
65%
6%
Total employment due to production and sale of beer: 25,400 jobs
direct effect (breweries)
indirect effect (suppliers)
hospitality industry
retail
11%
18%
65%
6%
Total employment due to production and sale of beer: 25,400 jobs
direct effect (breweries)
indirect effect (suppliers)
hospitality industry
retail
The total contribution to the Slovak economy in terms of value added due to production and the sale of beer is estimated at 195 million euros. The hospitality sector accounts for around 50 percent of total value added due to the production and consumption of beer.

The Contribution made by Beer to the European Economy Slovakia 156
638
52
97
Value added due to production and sale of beer: 195 million euros
Breweries
Supplying sectors
Hospitality industry
Retail
638
52
97
638
52
97
Value added due to production and sale of beer: 195 million euros
Breweries
Supplying sectors
Hospitality industry
Retail
Value added due to production and sale of beer: 195 million euros
Breweries
Supplying sectors
Hospitality industry
Retail
***

The Contribution made by Beer to the European Economy Slovakia 157
24.2 Market and industry structure, trends and developments
Just like the neighbouring Czech Republic, Slovakia has a long-standing reputation in bre-wing beer. Beer production dates back to the 11th century.
Key variables Millions
hectolitres158Illustration
• Production 4.2 Slovak beer production is decreasing, among other things because excise taxes were raised159
• Exports 0.18
• Imports 0.4 Beer is imported, especially from the Czech Republic
• Consumption 4.4 Around 65 percent of the Slovak beer market is occupied by two major European brewing companies
• Draught
• Home consumption
Last year beer consumption dropped by more than 10 percent, reflecting the major increase in excise duties from 2003, increasing energy prices and weak consumer purchasing power. These developments also affected the production volume of Slovak brewers. The market lea-der’s beer sales dropped from 2.1 million hectolitres to 1.8 million in 2004, but it still main-tained its leading role in the Slovak beer market with a market share stabilising at 42 percent. This market leader entered the Slovak market in 1995 with some major acquisitions over the subsequent years. Another one of the major European brewing companies also plays an important role in the Slovak beer market, holding a market share of around 23 percent and owning the largest bre-wery in Slovakia160. Independent brewing companies also still play an important role in Slo-vakia, with a total market share of around 30 percent. The Slovak brewing sector consists of 9 breweries producing more than 100,000 hectolitres and a large number of smaller breweries and brewing pubs161:
158 Data shown is for 2003. 159 Between August 2003 and August 2004, Slovak breweries sold 4.2 million hectolitres of beer, where in the pre-vious year they sold 4.9 million hectolitres (the 700,000 hectolitre difference represents a 15 percent drop). Source: The Slovak Spectator, November 1-7, 2004. 160 Production of Pivovar Saris was 1.1 million hectolitres in 2002. 161 Slovak Beer and Malt Association.

The Contribution made by Beer to the European Economy Slovakia 158
Category Number of production units Breweries < 50,000 hl per year 50,000 – 100,000 per year 1 Brewery in Banska Bystrica 100,000 – 500,000 per year 5 Breweries in Rimavská Sobota, Vyhne,
Bratislava, Bytca and Poprad 500,000 – 1,000,000 per year 1 Brewery in Topolcany 1,000,000 – 2,500,000 per year 2 Breweries in Hurbanovo and in Velky Saris2,500,000 – 5,000,000 per year > 5,000,000 per year Important trends in the Slovak brewing sector are summarised below: Brewing sector internal characteristics Context in which the brewing sector operates
• Consolidation of the Slovak beer market, also due to takeovers by two major European bre-wing companies in particular
• Modernisation of breweries and closure of least efficient and/or redundant breweries (for example the Pivovar Corgon brewery in October 2004 and the Martiner brewery in 2003)
• Slovak breweries also export beer, especially to other Central and Eastern European coun-tries
• Increase in excise duties in 2003 • Purchasing power of consumers is weak • Per capita consumption of beer in Slovakia is
around 81 litres a year (compared to around 160 litres in the Czech Republic)
24.3 Direct effect of brewing sector
Direct employment at Slovak breweries is estimated at around 2,720 employees162.
0
0.5
1
1.5
2
2.5
3
3.5
4
4.5
output of which exports
millions hl
0
20
40
60
80
100
120
140
160
euro (mln.)
supplies
valueadded
employment
0
500
1,000
1,500
2,000
2,500
3,000
0
20
40
60
80
100
120
140
euro (mln.)
VAT
excise
Taxes paidby workers
0
0.5
1
1.5
2
2.5
3
3.5
4
4.5
output of which exports
millions hl
0
0.5
1
1.5
2
2.5
3
3.5
4
4.5
output of which exports
millions hl
0
20
40
60
80
100
120
140
160
euro (mln.)
supplies
valueadded
0
20
40
60
80
100
120
140
160
euro (mln.)
supplies
valueadded
employment
0
500
1,000
1,500
2,000
2,500
3,000
employment
0
500
1,000
1,500
2,000
2,500
3,000
0
20
40
60
80
100
120
140
euro (mln.)
VAT
excise
Taxes paidby workers
162 Eurostat provides an employment figure of 3.200 employees in 2002. We believe that total employment since then has decreased (an estimated decrease of 15 percent).

The Contribution made by Beer to the European Economy Slovakia 159
The breweries together generate a value added of approximately 38 million euros, with total supplies purchased amounting to 114 million euros163 Total excise revenues for the Slovak government amounted to 54.4 million euros in 2004. Another important source of revenues for the government is VAT, estimated at 59 million euros (38 million euros from on-trade sales and another 21 million euros from beer sold in supermarkets and other retail outlets). Personal direct taxes paid by workers whose jobs can be attributed to the brewing sector are estimated at 9 million euros. 24.4 Economic impact of breweries on suppliers of goods and services
Slovakia is one of the countries in Europe with a long tradition in barley and malts. For example, at the end of the nineteenth century, when Slovakia was part of Greater Hungary, Slovakia produced more than a third of Greater Hungary’s barley yield. Today too Slovakia is an important producer of barley malt. Heineken, for example, produces most of its malted barley for the entire Central Europe region in Hurbanovo164. Sectors Stimu-
lus Stimulus for the Slovak economy
Personnel costs165 Labour costs per employee
(mln. €) % (mln. €) % of stimu-lus
(mln. €) (in €)
Number of em-ployees
• Agriculture 20 90% 18 1,414• Utilities 4 100% 4 8% 0.32 4,836 66• Packaging industry 37 50% 19 11.5% 2.13 5,136 415• Equipment +other 9 50% 4 11.5% 0.50 5,136 97• Transport 7 90% 6 22.1% 1.38 5,928 233• Media, marketing 21 85% 18 18.2% 3.20 7,968 402• Services + other 17 85% 14 18.2% 2.55 7,968 320Total 114 83 10.8 2,947Primary impact as % of total impact 65%Total indirect effect of brewing sector 4,534
163 Source: Eurostat. 164 Tom Philpott in Spectacular Slovakia (‘A thousand years of beer’), 2003. 165 Personnel costs as a percentage of total output of industries and labour costs per employee are obtained from Eurostat data.

The Contribution made by Beer to the European Economy Slovakia 160
Note: Because the Slovak agricultural sector benefits from a stimulus of 18 million euros, and turnover per agricultural work unit equals 12,700 euros, this means that this stimulus ge-nerates work for around 1,400 employees in the agricultural sector (primary effect). Total employment generated in supplying sectors is split up as follows:
0 1,000 2,000 3,000 4,000 5,000
Agriculture
Utilities
Packaging
Media, marketing
Transportation
Equipment Services
Indirect employment
0 1,000 2,000 3,000 4,000 5,000
Agriculture
Utilities
Packaging
Media, marketing
Transportation
Equipment Services
Indirect employment
24.5 Retail and hospitality sector
Hospitality sector
Estimating the fraction of total employment in the hospitality sector attributable to the bre-wing sector166: • Around 50 percent of all beer consumed in Slovakia is sold in the hospitality sector,
meaning that 2.26 million hl of beer are sold in the hospitality sector. • Average consumer price for beer in pubs is around 1.5 euros per litre, so that total consu-
mer spending on beer in the hospitality sector can be estimated at 330 million euros (in-cluding VAT; 278 million euros ex VAT).
• Average turnover per employee in the Slovak hospitality sector is 16,600 euros (ex VAT). • Therefore around 16,750 people are employed in the Slovak hospitality sector because of
beer sold.
166 Percentage on-trade/off-trade, consumer price of beer and other data must be checked.

The Contribution made by Beer to the European Economy Slovakia 161
Retail
The number of jobs in retail attributable to beer can similarly be assessed: • Around 50 percent of all beer consumed in Slovakia is sold in the hospitality sector, mea-
ning that the hospitality sector sells 2.26 million hl of beer. • Average consumer price for beer in pubs is around 0.80 euros per litre, so that total spen-
ding of consumers on beer in the hospitality sector can be estimated to be 176 million euros (including VAT; 148 million euros ex VAT).
• Average turnover per employee in the Slovak hospitality sector is 106,200 euros. • Thus some 1,400 people are employed in the Slovak hospitality sector through beer sales.
***

The Contribution made by Beer to the European Economy Slovakia 162

The Contribution made by Beer to the European Economy Slovenia 163
25 SLOVENIA: ECONOMIC IMPACT OF BEER
25.1 Highlights on economic impact
The economic impact of the brewing sector on the Slovenian economy can be summarised as follows: • Slovenian breweries provide jobs to 1,100 employees. • Supplying sectors benefit from the brewing sector and an estimated 3,290 jobs in these
sectors are generated by the brewing sector. • 18,930 jobs are also generated in the hospitality sector by the sale of beer and in retail
some 595 jobs can be attributed to the sale of beer. • The total impact of the brewing sector on the Slovenian economy in terms of jobs is thus
estimated at 23,900 jobs. • Apart from supplying sectors and the hospitality and retail sectors, the Slovenian govern-
ment also benefits from beer sales. Total tax revenues are estimated at around 215 million euros. These revenues consist mainly of VAT revenues (128 million euros) while there is also a contribution from direct personal taxes paid by employees of breweries and other workers in the sectors supplying the brewing sector, and those in the hospitality and retail sectors who owe their jobs to beer.
The impact of the brewing sector on Slovenian employment is depicted below:
5%14%
79%
2%
Total employment because of beer: 23,900 jobs
direct effect (breweries)
indirect effect (suppliers)
hospitality industry
retail
5%14%
79%
2%
Total employment because of beer: 23,900 jobs
direct effect (breweries)
indirect effect (suppliers)
hospitality industry
retail The total contribution to the Slovenian economy in terms of value added due to the produc-tion and sale of beer is estimated at 160 million euros. The hospitality sector is responsible

The Contribution made by Beer to the European Economy Slovenia 164
for more than 50 percent of total value added because of beer, reflecting the economic impor-tance of this sector for both the brewing sector and for the Slovenian economy as a whole. Value added per employee is relatively high in the Slovenian brewing sector compared to other sectors, reflecting its high productivity, so that the share of the breweries in total value added generated is higher than the previously-presented share in total employment due to the production and sale of beer:
333
39
85
Value added due to production and sale of beer: 160 million euros
Breweries
Supplying sectors
Hospitality industry
Retail
333
39
85
333
39
85
Value added due to production and sale of beer: 160 million euros
Breweries
Supplying sectors
Hospitality industry
Retail
Value added due to production and sale of beer: 160 million euros
Breweries
Supplying sectors
Hospitality industry
Retail
***

The Contribution made by Beer to the European Economy Slovenia 165
25.2 Market and industry structure, trends and developments
Slovenia is one of the countries in Central and Eastern Europe with a long tradition of bre-wing beer. In 2003 total production was 2.4 million hl and about 35 percent of this is ex-ported:
Key variables Millions hectolitres Illustration
• Production 2.4
• Exports 0.84 Slovenian beer is sold to neighbouring countries, espe-cially Bosnia-Herzegovina, Serbia-Montenegro and Croatia (export as a fraction of total production is esti-mated to be 35 percent, based on data from Pivovar Lasko)
• Imports
• Consumption 2.4
• Draught
• Home consumption 39% According to the 2003 Annual Report of Pivovar Las-ko, 39% of domestically-sold beer is via the retail chan-nel (and the remaining 61 percent on-trade via who-lesalers)
The Slovenian beer market is dominated by two brewing companies. One, with a 180-year-old history, currently has a market share of 56 percent. The company is independent and owned by 10,000 Slovenian shareholders167. Total production of this company is 1.36 million hectolitres of beer, 35 percent of which is exported (an important export market is Bosnia-Herzegovina). The company produces not only beer, but also mineral water, soft drinks and syrups. Of all domestic beer sales of this company, 61 percent is through wholesalers (520,000 hl) and the remaining 39 percent (335,000 hl) is sold by the retail channel. The ave-rage size of the workforce is 423 employees. The second major company offers employment to almost 500 people and currently has a market share of 39.8 percent. The economic impact of the brewing sector is influenced by the following trends, develop-ments and characteristics of the Slovenian economy:
167 Pivovarna Lasko, Annual Report for 2003.

The Contribution made by Beer to the European Economy Slovenia 166
Brewing sector internal characteristics Context in which the brewing sector operates
• Two players serve a large proportion of the beer market, leaving just 4 percent for other companies
• Fierce competition between the two largest breweries
• Domestic beer sales are stagnating, following a European trend
• Increasing competition in the most important export market (Bosnia-Herzegovina), resulting in decreasing exports
25.3 Direct effect of the brewing sector
The brewing sector provides jobs to 1,100 employees. Total production value of the Slove-nian breweries is up to 158 million euros, of which 33 million euros is value added:
0
0.5
1
1.5
2
2.5
3
output of which exports
millions hl
0
20
40
60
80
100
120
140
160
180
supplies
valueadded
euro (mln.) employment
0
200
400
600
800
1,000
1,200
0
50
100
150
200
250
euro (mln.)
VAT
excise
Taxes paidby workers
0
0.5
1
1.5
2
2.5
3
output of which exports
millions hl
0
0.5
1
1.5
2
2.5
3
output of which exports
millions hl
0
20
40
60
80
100
120
140
160
180
supplies
valueadded
euro (mln.)
0
20
40
60
80
100
120
140
160
180
supplies
valueadded
euro (mln.) employment
0
200
400
600
800
1,000
1,200
employment
0
200
400
600
800
1,000
1,200
0
50
100
150
200
250
euro (mln.)
VAT
excise
Taxes paidby workers
0
50
100
150
200
250
euro (mln.)
VAT
excise
Taxes paidby workers
Total tax revenues for the government from the production and consumption of beer is esti-mated at around 215 million euros. The largest part of these revenues is VAT, totalling an es-timated 128 million euros. The other part is direct personal taxes paid by employees of the Slovenian breweries and other workers who owe their jobs to the production and consump-tion of beer (employees in supplying sectors and in the hospitality and retail sectors) and excise duties (which total 82 million euros). 25.4 Economic impact of breweries on suppliers of goods and services
From a total Slovenian brewery production value of 158 million euros, an estimated 125 million euros are spent on supplies, benefiting the sector’s suppliers.

The Contribution made by Beer to the European Economy Slovenia 167
Sectors Stimu-lus
Stimulus for the Slovenian economy
Personnel costs168 Labour costs per employee
(mln. €) % (mln. €) % of stimu-lus
(mln. €) (in €)
Number of em-ployees
• Agriculture 22 65% 14 1,391• Utilities 4 100% 4 14.6% 1 18,648 34• Packaging industry 41 50% 20 19.4% 4 14,064 282• Equipment +other 10 50% 5 19.4% 1 14,064 66• Transport 8 75% 6 23.5% 1 17,436 77• Media, marketing 23 80% 18 20.9% 4 23,808 160• Services + other 18 80% 16 20.9% 3 23,808 128Total 125 82 2,138Primary impact as % of total impact 65%Total indirect effect of brewing sector 3,289
Note: Average turnover per agricultural work unit is 10,244 euros, based on Eurostat data co-vering the total turnover and total work force in the Slovenian agricultural sector, so that with a stimulus of 14 million euros in this sector through the purchases made by the brewing sec-tor, this results in a primary employment effect of 1,319 jobs. Total employment generated in supplying sectors is split up as follows:
0 500 1,000 1,500 2,000 2,500 3,000 3,500
Agriculture
Utilities
Packaging Media, marketing
Transportation
Equipment Services
Indirect employment
0 500 1,000 1,500 2,000 2,500 3,000 3,500
Agriculture
Utilities
Packaging Media, marketing
Transportation
Equipment Services
Indirect employment
168 Personnel costs as a percentage of total output of industries and labour costs per employee are obtained from Eurostat data.

The Contribution made by Beer to the European Economy Slovenia 168
25.5 Retail and hospitality sector
Hospitality sector
The impact of the brewing sector on the hospitality sector is estimated as follows: • Around 61 percent of total domestic beer sold in Slovenia is on-trade. • This means that on-trade sales amount to 1.46 million hl and with an average on-trade
consumer price of 4.50 euros (including VAT) per litre, total consumer expenditure on beer in the hospitality sector is 659 million euros (including VAT) and 540 million euros (excluding VAT, using a 20% VAT rate).
• Average turnover per employee (ex VAT) in the Slovenian hospitality sector is up to 29,000 euros a year.
• It can thus be calculated that 18,930 jobs in the Slovenian hospitality sector can be attributed to the brewing sector.
Retail
Employment in the retail sector through the sale of beer can be similarly assessed: • Based on the 39 percent of total domestic consumption of beer sold via the retail channel,
this results in a total off-trade volume of 0.94 million hl. • With an average consumer price for beer off-trade of 1.12 per litre (including VAT) and
0.93 per litre (ex VAT), this leads to total consumer spending on beer in supermarkets and other retail shops of about 88 million euros.
• With average turnover per employee in the Slovenian wholesale and retail sector at 147,500 euros a year, some 595 jobs in retail can be attributed to the sale of beer.
***

The Contribution made by Beer to the European Economy Spain 169
26 SPAIN: ECONOMIC IMPACT OF BEER
26.1 Highlights of the economic impact
The economic impact of the brewing sector can be expressed as follows: • Spain is one of Europe’s largest beer markets. • Spanish breweries directly employ 8,180 personnel. • Because of goods and services bought in the supplying sectors, additional indirect em-
ployment of around 15,960 employees is generated. • In the Spanish hospitality sector some 192,440 employees can be attributed to the sales of
beer and in the retail sector some 4,350 employees. • The total impact of the brewing sector in terms of direct and indirect employment can be
estimated to be as high as 220,925 employees. • Spanish government tax revenues from beer are around 250 million euros in excise,
around 1.43 billion euros in VAT and an estimated 890 million euros in direct personal taxes paid by workers. The total tax revenues amount to some 2.57 billion euros.
4%7%
87%
2%
Total employment due to production and sale of beer: 220,925 jobs
Direct effect (breweries)
Indirect effect (suppliers)
Hospitality sector
Retail
4%7%
87%
2%
Total employment due to production and sale of beer: 220,925 jobs
Direct effect (breweries)
Indirect effect (suppliers)
Hospitality sector
Retail The total contribution to the Spanish economy in terms of value added arising from the pro-duction and sale of beer is estimated at 5.1 billion euros. The hospitality sector is responsible for around 70 percent of total value added because of beer, reflecting the economic importan-ce of this sector for both the brewing sector and for the Spanish economy as a whole. Value added per employee, however, is relatively high in the Spanish brewing sector compa-red to other sectors, reflecting its high productivity, so that the share of the breweries in total

The Contribution made by Beer to the European Economy Spain 170
value added generated is higher than the share of total employment due to the production and sale of beer as just presented:
65 720
736
3,618
Value added due to production and sale of beer: 5,140 million euros
Breweries
Supplying sectors
Hospitality industry
Retail
65 720
736
3,618
65 720
736
3,618
Value added due to production and sale of beer: 5,140 million euros
Breweries
Supplying sectors
Hospitality industry
Retail
Value added due to production and sale of beer: 5,140 million euros
Breweries
Supplying sectors
Hospitality industry
Retail
***

The Contribution made by Beer to the European Economy Spain 171
26.2 The brewing sector: market structure, trends and developments
Total beer production in Spain was 30.7 million hl in 2003, which is 16 percent higher than production in 2000. Consumption is also rising: from 29.2 million hectolitres in 2000 to 33.5 million hectolitres in 2003 (a 15 percent increase)169. Spain is one of the booming beer mar-kets in Europe, with tourism as one explanation together with increasing beer consumption by the Spanish themselves. Spanish breweries exported 845,500 hl in 2003 and 3.6 million hectolitres were imported.
Key variables Millions hectolitres Illustration
• Production 30.7 21 breweries • Exports 0.8 Spain is not a major beer exporting country, as
growth can still be realised domestically • Imports 3.6 • Consumption170 33.5 • Draught 9.1 30.6% of consumption in Spain is draught, 26.6%
returnable bottles and 42.7% non-returnable bottles and cans
• Home consumption 26% A particular feature of the Spanish beer market is its regional fragmentation. Consumers have a strong loyalty towards their regional brands although the market position of brewers who operate on a national level is strong. Only three brewing companies operate throughout Spain The economic impact of the brewing sector is influenced by the following trends, develop-ments and characteristics of the Spanish economy: Brewing sector internal characteristics Context in which the brewing sector operates
• Spanish beer market is fragmented, with three companies operating throughout Spain and the others focusing on some regions within Spain.
• Spanish breweries are investing in moder-nising production facilities.
• Average size of Spanish breweries is large, with an average production volume of 1.4 mil-lion hectolitres, so they can operate efficiently.
• Production per employee lies around 3,600 hl a year (which in Western Europe is only ex-ceeded by Italy, Portugal and Ireland).
• Market share of ‘white labels’ (low-cost brands) is rising (33 percent in retail channel).
• One of the few fast-growing beer markets in Europe.
• Tourism is of great importance to (growth of) the Spanish beer market and it also explains partly the high percentage of beer consumed in the hospitality sector.
• Labour costs are relatively low compared to labour costs in countries in Northwest Europe.
• The Spanish economy is relatively closed, with the share of imported supplies in the bre-wing sector being relatively low compared to smaller countries.
169 Source: Cerveceros de España. 170 25 million hectolitres are consumed by Spanish consumers (Spanish Ministry of Agriculture, Fishery and Food).

The Contribution made by Beer to the European Economy Spain 172
The large average size of Spanish breweries is illustrated below: 171
Production units in hectolitres Number of production units < 50,000 hl per year - 50,000 – 100,000 per year 1 100,000 – 500,000 per year 3 500,000 – 1,000,000 per year 8 1,000,000 – 2,500,000 per year 5 2,500,000 – 5,000,000 per year 4 > 5,000,000 per year - 26.3 The direct effect of the brewing sector
The brewing companies provided employment to 8,182 personnel in 2004.172 Together the breweries achieved a turnover of 2.4 billion euros (note: turnover of brewing activities only may be lower as the given figure may include some wholesale activities), of which around 1.7 billion euros is spent on the supplying sectors. This means that the Spanish breweries to-gether realise 0.7 billion euros value added:
0
5
10
15
20
25
30
35
output of which exports
millions hl
0
500
1,000
1,500
2,000
2,500
3,000
supplies
valueadded
euro (mln.)
0
1,000
2,000
3,000
4,000
5,000
6,000
7,000
8,000
9,000
employment euro (mln.)
0
500
1,000
1,500
2,000
2,500
3,000Personal direct tax
VAT
excise0
5
10
15
20
25
30
35
output of which exports
millions hl
0
500
1,000
1,500
2,000
2,500
3,000
supplies
valueadded
supplies
valueadded
euro (mln.)
0
1,000
2,000
3,000
4,000
5,000
6,000
7,000
8,000
9,000
employment euro (mln.)
0
500
1,000
1,500
2,000
2,500
3,000Personal direct tax
VAT
excise
The tax revenues are also important, with total excise revenues on beer of 250 million euros. VAT revenues are generated from beer sold in pubs and cafes amounting to about 1.3 billion euros. Beer sales in supermarkets and other off-trade outlets generates another 132 million euros in VAT revenues. It can also be estimated that the employees working for the Spanish breweries together pay some 33 million euros in personal and direct tax and that workers in supplying sectors, in the hospitality sector and in retail who hold jobs attributable to the sales
171 Source: Cerveceros de España. 172 Source: Mapa, based on the figures of yearly business enquiry of the Spanish Statistical office (INE).

The Contribution made by Beer to the European Economy Spain 173
of beer, pay another 856 million euros in personal direct tax. The total tax revenues arising from beer are thus estimated at 2.57 billion euros. 26.4 The economic impact of breweries on suppliers of goods and services
Because some 70 per cent of the total production value of Spanish breweries is spent on suppliers, breweries exercise an important economic impact on supplying sectors. The largest proportion of supplies is purchased from the services sector, with further significant spending on packaging, media and marketing and agricultural produce: Sectors Stimu-
lus173 Stimulus for the Spanish economy
Personnel costs174 Labour costs per employee
(mln. €) % (mln. €) % of stimu-lus
(mln. €) (in €)
Number of em-ployees
• Agriculture175 151 92% 139 3,417• Utilities 35 100% 35 8% 3 42,084 67• Packaging industry 326 84% 274 16% 44 25,896 1,692• Equipment +other 114 64% 73 16% 12 25,896 452• Transport 141 100% 141 19% 27 29,340 914• Media, marketing 212 90% 191 22% 42 43,116 972• Services + other 701 80% 560 22% 123 43,116 2,860Total 1,680 10,373Primary impact as % of total impact 65%Total indirect effect of brewing sector 15,958
Source: Own calculations on the basis of National Statistics and Eurostat
173 Percentages based on data obtained from Spanish breweries and checked with Input/Output data for food and beverage. 174 Personnel costs as a percentage of total output of industries and labour costs per employee are obtained from Eurostat data. 175 For the impact of the brewing sector on agriculture, we have used the industry ratio of total turnover to total employment in FTE (i.e. 38 billion euros with 937,900 FTE) to go from the stimulus in agriculture because of ‘beer’ (i.e. 139 million euros) to resulting employment (3,417 FTE after one round).

The Contribution made by Beer to the European Economy Spain 174
The indirect employment generated in supply sectors due to the production of beer is de-picted below:
0 2,000 4,000 6,000 8,000 10,000 12,000 14,000 16,000 18,000
Agriculture
Utilities
Packaging Media, marketing
Transportation
Equipment Services
Indirect employment
0 2,000 4,000 6,000 8,000 10,000 12,000 14,000 16,000 18,0000 2,000 4,000 6,000 8,000 10,000 12,000 14,000 16,000 18,000
Agriculture
Utilities
Packaging Media, marketing
Transportation
Equipment Services
Indirect employment
26.5 Retail and hospitality sectors
In Spain 26 percent of the beer sales takes place through the retail channel. Another 74 per-cent is sold to the consumer through the hospitality sector.176 177
Hospitality sector
Employment in the hospitality sector due to the sale of beer is estimated at over 190,000 jobs: • Around 74 percent of beer consumption in Spain takes place in the hospitality sector. • This means that 24.8 million hl are sold by Spanish pubs, restaurants and the like. • The consumer price of beer is about 3.80 euros a litre (inc VAT)178, so that consumers are
estimated to spend 8.1 billion euros (excl. VAT) on beer in pubs and restaurants. • Turnover per employee in the Spanish hospitality sector equals 42,200 euros a year. • Total employment in the Spanish hospitality sector because of beer sales thus equals
192,437 employees.
176 Retail channel consists of supermarkets, hypermarkets and cash&carry shops. 177 Source: Alimarket, 2004 178 Estimated by EY, as beer prices fluctuate and beer in different price ranges is available.

The Contribution made by Beer to the European Economy Spain 175
Retail
Employment due to the sale of retail beer can be similarly assessed: • About 26 percent of the total beer consumption in Spain is beer sold by supermarkets and
other retail companies. • With an average consumer price of 1.10 euros (incl. VAT) per litre179, total consumer
spending on retail beer is estimated at 826 million euros (excl. VAT). • Because the annual turnover per employee is estimated at 190,000 euros, this means that
4,347 people owe their jobs to the sales of retail beer.
***
179 Estimated by EY, as beer prices fluctuate and beer in different price ranges is available.

The Contribution made by Beer to the European Economy Spain 176

The Contribution made by Beer to the European Economy Sweden 177
27 SWEDEN: ECONOMIC IMPACT OF BEER180
27.1 Highlights of economic impact
The economic impact of the brewing sector can be expressed as follows: • Swedish brewers produce 3.8 million hectolitres of beer annually. • The brewing sector employs some 4,215 employees. • Another 1,500 full-time jobs in supplying companies are due to beer. • In the hospitality and retail sectors, 16,000 full-time jobs depend on beer sales. • According to the Swedish Brewers’ Association, 26% of total Swedish beer consumption
in 2004 was smuggled or privately imported into Sweden. Most of the private imports and smuggling comes from Germany. Private imports have increased since the Baltic states joined the EU.
• VAT and excise revenues amount to 840 million euros each year. The employment effects of the brewing sector are depicted below:
19%
7%
61%
13%
Total employment due to production and sale of beer: 21,750 jobs
Direct effect (breweries)
Indirect effect (suppliers)
Hospitality sector
Retail
19%
7%
61%
13%
Total employment due to production and sale of beer: 21,750 jobs
Direct effect (breweries)
Indirect effect (suppliers)
Hospitality sector
Retail
Total employment due to production and sale of beer: 21,750 jobs
Direct effect (breweries)
Indirect effect (suppliers)
Hospitality sector
Retail The contribution of the brewing sector to the Swedish economy can also be expressed in terms of value added. Total value added of the brewing sector in Sweden and value added ge-nerated by firms in the supply, hospitality and retail sectors arising from the production and sale of beer amounts to around 554 million euros:
180 When applicable, Swedish kroner were converted into euros using an exchange rate of € 1 = 9.125 kroner.

The Contribution made by Beer to the European Economy Sweden 178
Value added due to production and sale of beer: 554 million euro
Breweries
Supplying sectors
Hospitality industry
Retail
244
96
160
53
Value added due to production and sale of beer: 554 million euro
Breweries
Supplying sectors
Hospitality industry
Retail
Value added due to production and sale of beer: 554 million euro
Breweries
Supplying sectors
Hospitality industry
Retail
244
96
160
53
244
96
160
53
The share of the brewing sector in overall value added arising from the production and sale of beer is estimated at 29 percent. This is far greater than the share of direct employment con-nected to breweries as a fraction of total employment arising from the production and sale of beer (22 percent). The relatively high productivity in terms of value added per employee in the brewing sector is an important explanation for this.
***

The Contribution made by Beer to the European Economy Sweden 179
27.2 The brewing sector: market structure, trends and developments
According to figures from the Swedish Brewers’ Association, Swedes consumed 51.4 litres of beer per capita in 2004. This corresponds to a total recorded consumption of 4.64 million hectolitres. Of this volume, 0.85 million hectolitres are imported officially. As beer is more expensive in Sweden than in Denmark181, Germany or Estonia, there are also substantial un-registered private consumer imports and smuggling. Various developments led to a substan-tial recent increase in private imports and smuggling. Among these are the opening of the Oresund bridge to Denmark, the substantial loosening of the limits for personal imports in 2003, lowering of excise tariffs in Denmark and Finland, and – last but not least – the acces-sion of the Baltic states to the European Union. In 2004, private imports and smuggling into Sweden were estimated at 1.64 million hectolitres, though some sources claim that private imports are higher still (up to 33% of the total volume of normal beer consumed)182. It is a fact that private imports and smuggling into Sweden are on the rise, causing closures of bre-weries and the loss of many jobs. There are no statistics available on exports. Registered ex-ports are expected to be insubstantial.
Key variables Million hectolitres Illustration
• Production 3.8 Production value is approximately € 350-400 million.
• Exports n.a.
• Registered imports 0.8 These are only registered imports. In 2003, an additio-nal 1.64 million hectolitres of beer were imported pri-vately or smuggled from Denmark, Germany and Esto-nia where beer is much cheaper.
• Registered consumption 4.6 2.558 million hectolitres of strong beer (> 3.6% ABV), 2.007 million hectolitres of regular beer (2.25-3.6%) 441 thousand litres of low-alcohol beer (< 2.25%)
• Total consumption 6.3
• Home consumption 78.3%
Source: Swedish Brewers’ Association Sweden currently has around 50 producers of beer, malt, bottled water and soft drinks. The above figures were provided by the Swedish Brewers Association, whose 13 members have a 90 percent market share.
181 In 1999, a comparative ‘basket’ of beer was 27% cheaper in Denmark than it was in Sweden. 182 Source: The Brewers of Europe.

The Contribution made by Beer to the European Economy Sweden 180
27.3 The direct effect of the brewing sector
According to Swedish Statistics, the Swedish brewing sector consists of 32 enterprises183 em-ploying 3,133 personnel184. These employees are partly active in the production of other be-verages, such as cider, soft drinks and bottled water. Another important brewing sector direct effect is tax revenue. Sweden has a relatively high level of alcohol excise for beer. Beer above 2.8 percent ABV is taxed at 147 Swedish kronor per hectolitre per degree of alcohol. There is no tax on beer at or below 2.8 percent ABV. To combat the extensive private imports from Denmark, Germany and Estonia, the current administration has announced plans to reduce the alcohol taxes on spirits by 40% in 2006. The best estimate of the brewing sector’s value added comes from Eurostat data. Eurostat es-timated value added at € 245 million in 2002. However, a large part of this value added may be realised from the production of other beverages, such as soft drinks and bottled waters. Value added arising from the production of beer amounted to some 160 million euros185. millions hl euro (mln.) employment euro (mln.)
0
0.5
1
1.5
2
2.5
3
3.5
4
4.5
Output Of which exports0
100
200
300
400
500
600
700
800
supplies
value added
0
500
1,000
1,500
2,000
2,500
3,000
3,500
4,000
4,500
0
200
400
600
800
1,000
1,200
Direct taxemployees
VAT
Excise
millions hl euro (mln.) employment euro (mln.)
0
0.5
1
1.5
2
2.5
3
3.5
4
4.5
Output Of which exports0
100
200
300
400
500
600
700
800
supplies
value added
0
100
200
300
400
500
600
700
800
supplies
value added
0
500
1,000
1,500
2,000
2,500
3,000
3,500
4,000
4,500
0
500
1,000
1,500
2,000
2,500
3,000
3,500
4,000
4,500
0
200
400
600
800
1,000
1,200
Direct taxemployees
VAT
Excise
Another substantial direct effect of the brewing sector covers taxes and excises paid by the breweries and beer consumers. In 2004 excises were 398 million euros and total VAT inco-me for the government estimated at 443 million euros.
183 16 of the recorded breweries operate without employees, 6 have between 1 and 4 employees and 2 have over 500 employees. 184 Eurostat annual labour surveys showed employment of 4,215 in the year 2002. Some of these employees may also be associated with the production of other beverages. 185 Source: Eurostat.

The Contribution made by Beer to the European Economy Sweden 181
27.4 The economic impact of breweries on suppliers of goods and services
Eurostat provides figures on the expenditure of the beer brewing sector. These figures show that Swedish brewers spent € 482 million on purchased goods and services in 2002. How-ever, a (large) part of these costs is due to the production, bottling and distribution of other beverages, such as soft drinks and bottled waters. We estimate that the stimulus associated with the brewing of beer amounts to € 240 million. This stimulus for the sectors that supply goods and services to the brewing sector results in an estimated 1,500 jobs in these supply sectors: Sectors Stimu-
lus Stimulus for the Swedish economy
Personnel costs186 Labour costs per employee
(mln. €) % (mln. €) % of stimu-lus
(mln. €) (in €)
Number of em-ployees
• Agriculture 39 50% 19 350• Utilities 19 99% 19 6% 1 55,320 20• Packaging industry 58 60% 35 21% 7 48,084 150• Equipment 32 60% 19 21% 4 48,084 85• Transport 36 95% 35 23% 8 47,892 165• Media, marketing 50 90% 45 30% 13 69,324 195• Services 6 90% 6 30% 2 69,324 25Total 240 177 990Primary impact as % of total impact 65%Total indirect effect of brewing sector 1,500
Source: Own calculations on the basis of National Statistics and Eurostat The agricultural sector profits substantially from the stimulus of the Swedish breweries. The main impact of the stimulus goes to barley farmers. Sweden is a net malt exporter. One mal-ting company already has an annual capacity to produce 208,000 tonnes (which is more than is needed for domestic beer production). According to Statistics Sweden’s malting compa-nies employ 44 personnel. Indirect employment effects are illustrated below:
186 Personnel costs as a percentage of total output of industries and labour costs per employee are obtained from Eurostat data.
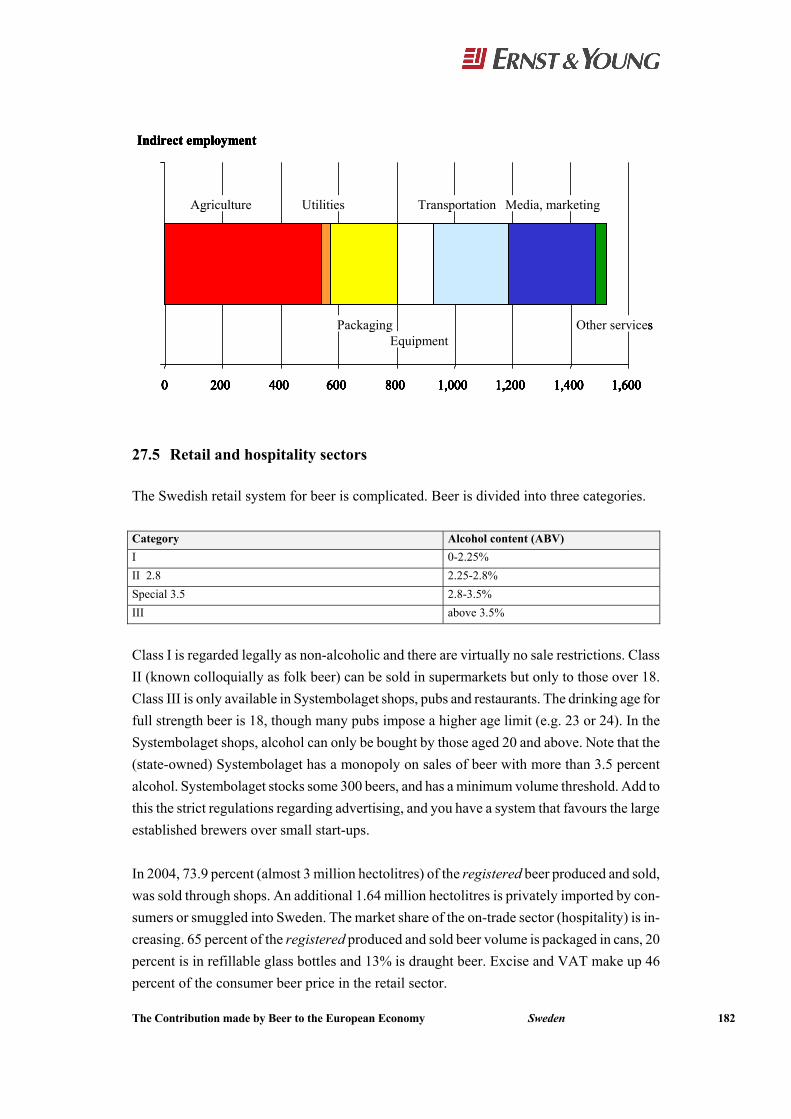
The Contribution made by Beer to the European Economy Sweden 182
0 200 400 600 800 1,000 1,200 1,400 1,600
Indirect employment
Agriculture Utilities
PackagingEquipment
Transportation Media, marketing
Other service
0 200 400 600 800 1,000 1,200 1,400 1,6000 200 400 600 800 1,000 1,200 1,400 1,600
Indirect employment
Agriculture Utilities
PackagingEquipment
Transportation Media, marketing
Other services
0 200 400 600 800 1,000 1,200 1,400 1,6000 200 400 600 800 1,000 1,200 1,400 1,600
Indirect employment
Agriculture Utilities
PackagingEquipment
Transportation Media, marketing
Other services
27.5 Retail and hospitality sectors
The Swedish retail system for beer is complicated. Beer is divided into three categories. Category Alcohol content (ABV) I 0-2.25% II 2.8 2.25-2.8% Special 3.5 2.8-3.5% III above 3.5%
Class I is regarded legally as non-alcoholic and there are virtually no sale restrictions. Class II (known colloquially as folk beer) can be sold in supermarkets but only to those over 18. Class III is only available in Systembolaget shops, pubs and restaurants. The drinking age for full strength beer is 18, though many pubs impose a higher age limit (e.g. 23 or 24). In the Systembolaget shops, alcohol can only be bought by those aged 20 and above. Note that the (state-owned) Systembolaget has a monopoly on sales of beer with more than 3.5 percent alcohol. Systembolaget stocks some 300 beers, and has a minimum volume threshold. Add to this the strict regulations regarding advertising, and you have a system that favours the large established brewers over small start-ups. In 2004, 73.9 percent (almost 3 million hectolitres) of the registered beer produced and sold, was sold through shops. An additional 1.64 million hectolitres is privately imported by con-sumers or smuggled into Sweden. The market share of the on-trade sector (hospitality) is in-creasing. 65 percent of the registered produced and sold beer volume is packaged in cans, 20 percent is in refillable glass bottles and 13% is draught beer. Excise and VAT make up 46 percent of the consumer beer price in the retail sector.

The Contribution made by Beer to the European Economy Sweden 183
Hospitality sector
The approach to estimate employment in the hospitality sector attributable to beer takes the beer turnover of pubs and restaurants as a starting point: • 21.7 percent of beer consumption in Sweden occurs in the hospitality sector. • This means approximately 1 million hectolitres are sold by pubs, restaurants and the like. • The consumer price of beer is about 8.77 euros per litre (excl. VAT)187, so that consumers
are estimated to spend 882 million euros (excl. VAT) on beer in pubs and restaurants. • Turnover per employee in the hospitality sector is 67,100 euros a year. • Total employment in the Swedish hospitality sector arising from beer sales then equals
13,100 employees.
Retail
The importance of the brewing sector for retail can be similarly assessed: • 78.3 percent of registered beer consumption is beer sold by supermarkets and other retail
companies. This equals 3.6 million hectolitres. • With an average retail price of 2.46 euros per litre, excluding VAT, total consumer
expenditure on retail beer is estimated at 890 million euros. • Because turnover per employee is estimated at 310,000 euros, this means 2,900 people
owe their jobs to the sale of retail beer.
*** 187 The prices in this paragraph are estimates of the average prices in the on-trade and off-trade channels. In reality, prices vary considerably, depending on many different factors including the size of the container or glass, the type of establishment and the location.

The Contribution made by Beer to the European Economy Sweden 184

The Contribution made by Beer to the European Economy United Kingdom 185
28 UNITED KINGDOM: ECONOMIC IMPACT OF BEER188
28.1 Highlights of the economic impact
The economic impact of the brewing sector can be expressed as follows: • Between them the 400 to 500 UK breweries produce some 58 million hectolitres of beer,
6% of which (3.5 million hectolitres) is exported. • With a direct economic impact of 22,000 jobs, the breweries are important to the British
economy. • Goods and services bought from supplying sectors produce another 32,000 full-time jobs
in these sectors attributable to the brewing sector. • The brewing sector induces another 395,000 full-time jobs in the hospitality and retail
sectors. • The government also benefits from the brewing sector, since VAT and excise revenues
amount to 4.1 and 4.4 billion euros respectively. The employment effects of the brewing sector are depicted below:
Total employment due to production and sale of beer: 450,000 jobs
5%7%
83%
5%
direct effect (breweries)
indirect effect (suppliers)
hospitality industry
retail
Total employment due to production and sale of beer: 450,000 jobs
5%7%
83%
5%
direct effect (breweries)
indirect effect (suppliers)
hospitality industry
retail
The contribution of the brewing sector to the British economy can also be expressed in terms of value added. Total value added of the UK brewing sector and value added generated by firms in the supply sectors and in the hospitality and retail sectors arising from the production and sale of beer amounts to around 10.9 billion euros:
188 All values have been calculated using an average conversion rate of € 1 = £ 0.6919.

The Contribution made by Beer to the European Economy United Kingdom 186
237 1,971
1,9246,809
Value added due to production and sale of beer: 10,900 million euros
Breweries
Supplying sectors
Hospitality sector
Retail
237 1,971
1,9246,809
Value added due to production and sale of beer: 10,900 million euros
Breweries
Supplying sectors
Hospitality sector
Retail The share of the brewing sector in overall value added arising from the production and sale of beer is estimated at 18 percent. This is far more than the share of direct employment con-nected to breweries as a proportion of total employment arising from the production and sale of beer (5 percent). An important explanation for this is the fact that productivity in terms of value added per employee in the British brewing sector is relatively high compared to other sectors.
***

The Contribution made by Beer to the European Economy United Kingdom 187
28.2 The brewing sector: market structure, trends and developments
In 2003 British breweries produced 58.2 million hectolitres of beer, worth € 10.1 billion (ex-brewery). In the same year 60.3 million hectolitres of beer was consumed within the United Kingdom189.
Key variables Million hectolitres Illustration
• Production190 58.2 Highest volume in Europe, only exceeded by Germany
• Exports 3.5
• Imports191 6.4
• Consumption 60.3 Total spending of consumers is € 27,254 million192
• Draught 56.8%
• Home consumption 38.6%
The British beer market is highly concentrated and consolidated. In 2003 six national bre-wers controlled some 85 percent of the market volume. The largest national brewing compa-ny has a 27 percent market share. The UK beer market also has a large number of small breweries producing less than 60,000 litres a year (pub breweries and other local breweries). The total market share of these local breweries is 1.7 percent, leaving an estimated 13.3 percent market share for the middle-sized regional breweries193. Under pressure of competition and beer consumption which is not gro-wing rapidly, British beer companies are consolidating and closing less efficient and redun-dant production sites. Since 1997, the large brewing companies have closed some 25 – 30 large breweries to take spare capacity out of the market. Important trends and developments influencing the impact of the brewing sector in the Bri-tish economy are:
189 For 2004, these figures are: production 57,549; released for consumption: 59,195. 190 The BBPA believes that HMRC figures overestimate the size of the UK beer market by up to 2 million hecto-litres and estimates total UK beer sales at nearer 58 million hectolitres. 191 A further 1.7 million hectolitres of beer was imported by private consumers to avoid high UK duties in 2003 (1.0 million hl in 2004) and an estimated one million hectolitres entered the UK market via smuggling in large freight consignments/diversion fraud. 192 Households’ final consumption expenditures at current prices 193 Source: BBPA, SIBA and HMRC.

The Contribution made by Beer to the European Economy United Kingdom 188
Brewing sector internal characteristics Context in which the brewing sector operates • Historically the UK had strong regional varia-
tion in beer tastes, with many small regional breweries serving local pubs and clubs
• Most beer was sold through pubs (90.4% of total beer volume was sold through the on-trade in 1970) and brewers owned a number of pubs, serving as a retail channel for their products
• Since the 1970’s lager has become increasing-ly popular194, also attracting competition from foreign multinational brewing companies.
• As five out of six national brewers focus in-creasingly on lager, the ale volumes of the na-tional brewers are declining whereas the ale volumes of many local and regional brewers are growing
• Consolidation of breweries and closing of less efficient breweries is a trend
• Competition regulation forced brewing com-panies to sell many pubs they originally owned.
• Shifting consumer preferences (from beer to wine, RTDs, non alcoholic drinks)
28.3 The direct effect of the brewing sector
The UK brewing companies employ 22,000 people, of whom 20,000 are full-time and 2,000 part-time. Total turnover of the brewing companies is 10.1 billion euros (in 2003), of which 7.9 billion arises from brewing activities and 2.9 billion is in taxes, duties and levies paid. The total value added by brewing companies is € 2,360 million, of which some 84 percent (1,971 million euros, source: Eurostat) comes from beer brewing activities, with the remai-ning 16 percent coming from wholesale activities. Another important activity is the operation of pubs and pub holdings. Wholesaling concentrates on selling other brands and other alco-holic beverages (wine and spirits) to the brewery’s own pubs and other customers. Some bre-wing companies also package beverages for other producers. British brewers do not usually produce products other than beer but many do contract brewing and packaging for other bre-wers. The direct impact of the brewing sector can be depicted as follows:
194 Where 7% of the beer sold in 1970 was lager and 93% was ale, lager now accounts for 70% of UK beer volumes.

The Contribution made by Beer to the European Economy United Kingdom 189
0
10
20
30
40
50
60
70
output of which exports
millions hl
0
1,000
2,000
3,000
4,000
5,000
6,000
euro (mln.)
supplies
valueadded
0
5,000
10,000
15,000
20,000
25,000
employment euro (mln.)
0
2,000
4,000
6,000
8,000
10,000
12,000
Direct taxemployees
VAT
Excise
0
10
20
30
40
50
60
70
output of which exports
millions hl
0
10
20
30
40
50
60
70
output of which exports
millions hl
0
1,000
2,000
3,000
4,000
5,000
6,000
euro (mln.)
supplies
valueadded
0
1,000
2,000
3,000
4,000
5,000
6,000
euro (mln.)
supplies
valueadded
0
5,000
10,000
15,000
20,000
25,000
employment
0
5,000
10,000
15,000
20,000
25,000
employment euro (mln.)
0
2,000
4,000
6,000
8,000
10,000
12,000
Direct taxemployees
VAT
Excise
0
2,000
4,000
6,000
8,000
10,000
12,000
Direct taxemployees
VAT
Excise
An important impact of the brewing sector is the revenues generated for government through excise, VAT and other (corporate) taxes. In 2003, excise revenues totalled 4,399 million euros and income from VAT is estimated to be 4,059 million euros. 28.4 The economic impact of breweries on suppliers of goods and services
The majority of the goods and services purchased by British breweries originate in the UK. The agricultural sector and the packaging industry benefit most from the UK brewing sector. The UK brewing sector requires 661,000 tonnes of malt annually. Almost all malt (> 98 per-cent) comes from domestic suppliers. Some of the brewers have their own malting plants. Brewer-malters provide 25 percent of the beer sector’s total malt requirements. In 2003, UK farmers produced 1,923 tonnes of hops, worth € 8.3 million at ex-farm prices. The UK hops sector has declined rapidly. Hops, which constitute only a small percentage of the total pro-duction costs, are increasingly imported. Packaging is an important aspect of the beer sector’s costs. Beer is mainly packaged in glass bottles, cans, kegs (pressurised tanks) and casks (non-pressurised tanks). Packaging for beer (kegs, bottles and cans) is sourced both from within the UK and abroad. It is unknown how much money is involved in the total purchases of containers, or of their imports. Many brewers provide their own logistics, although one or two national brewers have out-sourced their distribution activities, at least partially. Other services, such as asset manage-ment and control, cellar technical services, pay-rolling and invoicing have also been outsour-ced by some brewers as has (to a lesser extent) the running of boiler plants. The effects of the economic impact on suppliers of goods and services is quantified in the table below. The table is built up as follows. The ‘stimulus’ column shows the brewing sec-

The Contribution made by Beer to the European Economy United Kingdom 190
tor’s expenditures on goods and services, specified for various types of suppliers. For example: the brewing sector buys goods and services from the packaging industry, worth so-me € 200 million. (The total expenditures on raw materials, other goods and services by the British brewing sector is some € 3,000 million.) Of the € 200 million spent on packaging, 72% (€ 144 million) is spent on purchases from British companies. The rest is imported from abroad. From national and European statistics we know that on average in the packaging in-dustry, 19% of the turnover is spent on personnel costs (including wages and social security). This means that workers in the packaging industry earn a total amount of (19 percent of € 144 million) € 27 million due to purchases made by breweries. As the average personnel cost per employee in this sector is € 43,968, the brewing sector induces 620 jobs in the packaging industry. Following this approach for the various sectors, we arrive at a total in-direct employment of 20,750. However the companies from which brewers purchase goods and services also purchase raw materials. Hence the previously calculated indirect employment is only a fraction of the total employment induced. On average this ‘primary effect’ or first round effect, as it is called, is 65 percent of the total indirect employment induced. Hence we estimate the total indirect em-ployment induced by the British brewing sector to be 32,000 employees: Sectors Stimu-
lus195 Stimulus for the UK economy
Personnel costs196 Labour costs per employee
(mln. €) % (mln. €) % of stimu-lus
(mln. €) (in €)
Number of em-ployees
• Agriculture197 950 76% 722 10,300• Utilities 100 99% 99 8% 8 57,132 140• Packaging industry 200 72% 144 19% 27 43,968 620• Equipment 250 72% 180 19% 34 43,968 780• Transport 250 100% 250 20% 50 44,220 1,130• Media, marketing 300 95% 285 32% 91 65,772 1,860• Services 950 95% 903 32% 289 65,772 5,900Total 3,000 2,583 20,750Primary impact as % of total impact 65%Total indirect effect of brewing sector 32,000
195 Percentages based on data from National Statistics and Eurostat. 196 Personnel costs as a percentage of total output of industries and labour costs per employee are obtained from Eurostat data. 197 For the impact of the brewing sector on agriculture, we have used the sector ratio of total turnover to total employment in FTE (i.e. 20.6 billion euros with 295,000 FTE) to arrive at the stimulus in agriculture because of ‘beer’ (i.e. 722 million euros) against resulting employment (10,300 FTE after one round)

The Contribution made by Beer to the European Economy United Kingdom 191
Expenditures on agricultural raw materials are relatively high in the United Kingdom. This is due to the fact that traditional British beers require more malt per hectolitre than lagers.
0 5,000 10,000 15,000 20,000 25,000 30,000 35,000
Agriculture
Utilities
Packaging Media, marketing
Transportation
Equipment Services
Indirect employment
0 5,000 10,000 15,000 20,000 25,000 30,000 35,000
Agriculture
Utilities
Packaging Media, marketing
Transportation
Equipment Services
Indirect employment
The indirect impact of the brewing sector is influenced positively by the fact that some 85 percent of the brewing sector’s expenditure on goods and services is spent domestically. 28.5 Retail and hospitality sectors
In 2003, 62 percent of the UK beer sales volume was sold through the on-trade channel (con-sisting of pubs, wine-bars, restaurants, hotels and clubs). The remaining 38% was sold through the off-trade channel (shops, including off-licence specialists)198. Distribution channels (2004) Average retail
price per litre (incl. VAT) 199
Market shares (volume)
Turnover on beer
(incl. VAT)
On-trade ± € 5.35 61.9% 76.5% Off-trade ± € 2.67 38.1% 23.5% Total 58.2 million hl € 27.250 billion
198 BBPA. 199 The prices in this paragraph are estimates of the average prices in the on-trade and the off-trade channels. In reality, prices vary considerably, depending on many different factors including the size of the container or glass, the type of establishment and the location.

The Contribution made by Beer to the European Economy United Kingdom 192
The British hospitality sector is a very important part of the UK economy, with total turnover of € 83,268 million, and total employment of 1,830,500 jobs. Up to the 1980s brewing com-panies owned large numbers of pubs. National and regional brewers distributed most of their produce through their own pubs. In 1989, the Beer Order legislation led to large brewers sel-ling large parts of their pub holdings. Over the next decade national brewers either speciali-sed only in brewing or ceased brewing and large pub chains were established. Following re-vocation of the Beer Orders, today only 8,900 of the UK’s 59,000 pubs are owned by bre-wing companies. Independent pub chains own another 31,700 pubs. Pubs and licensed clubs offer jobs to 80,000 self-employed persons plus 537,000 employees.
Hospitality sector
The approach to estimating employment in the hospitality sector attributable to the brewing sector takes beer turnover by pubs and restaurants as a starting point: • Around 62 percent of beer consumption in the UK is distributed through the on-trade
channel. • This means that 37.4 million hl are sold by British pubs, restaurants and the like. • The average pub price of beer is 5.35 euros per litre (4.56 euros excluding VAT), so that
consumers are estimated to spend 17 billion euros (excl. VAT) on beer in pubs and res-taurants.
• Turnover per employee in the UK hospitality sector equals 45,500 euros a year. • Total employment in the UK hospitality sector because of beer sold is then 374,000
employees.
Retail
The importance of the brewing sector for retail can be similarly assessed: • 38 percent of total beer consumption is beer sold by supermarkets and other retail compa-
nies. This equals 22.9 million hectolitres. • With an average retail price of 2.27 euros per litre, excluding VAT, total consumer expen-
diture on beer in retail is estimated at 5.2 billion euros. • Because turnover per employee is estimated at 243,700 euros, this means 21,400 people
owe their jobs to the sale of retail beer.
***

The Contribution made by Beer to the European Economy Bulgaria 193
29 BULGARIA: ECONOMIC IMPACT OF BEER
29.1 Highlights of economic impact
The economic impact of the brewing sector on the Bulgarian economy is substantial: • Direct employment at Bulgarian breweries is estimated at 2,755 jobs. • Because of goods and services purchased by Bulgarian brewers within their own country,
an additional 7,250 jobs in these supplying sectors can be attributed to the beer sector. • Many jobs can also be attributed to beer sales in retail and especially in the hospitality
sector. In the hospitality sector this is about 25,450 jobs and in retail another 2,900 jobs. • Total tax revenue for the Bulgarian government from the production and consumption of
beer is estimated at around 93 million euros a year. Of this some 23.9 million euros is excise revenues. Further total VAT revenues are estimated at 59 million euros (33 million euros on beer sold on-trade) and workers whose job can be attributed to the production and consumption of beer pay a total direct personal tax of around 10 million euros (em-ployees of breweries contribute to this, but also workers in the hospitality sector and in retail and employees in sectors supplying goods and services to the breweries).
The employment effect of the brewing sector can be depicted as follows:
7%
19%
66%
8%
Total employment due to production and sale of beer: 38,380 jobs
direct effect (breweries)
indirect effect (suppliers)
hospitality industry
retail
7%
19%
66%
8%
Total employment due to production and sale of beer: 38,380 jobs
direct effect (breweries)
indirect effect (suppliers)
hospitality industry
retail The Bulgarian brewing sector has been modernised rapidly in recent years. To a large extent this explains the high productivity of this sector and its employees. With only a 6 percent share in total employment from the production and sale of beer, the brewing sector accounts for just over 40 percent of total value added generated due to the production and sale of beer. The total contribution of the brewing sector to the Bulgarian economy (directly and indirectly), is estimated at around 127 million euros:

The Contribution made by Beer to the European Economy Bulgaria 194
3
53
25
46
Value added due to production and sale of beer: 127 million euros
Breweries
Supplying sectors
Hospitality industry
Retail
3
53
25
46
3
53
25
46
Value added due to production and sale of beer: 127 million euros
Breweries
Supplying sectors
Hospitality industry
Retail
Value added due to production and sale of beer: 127 million euros
Breweries
Supplying sectors
Hospitality industry
Retail
***

The Contribution made by Beer to the European Economy Bulgaria 195
29.2 Market and industry structure, trends and developments
The Bulgarian beer market is one of the smallest in Eastern Europe, but has shown increasing volumes in recent years. In 2004, for example, the Bulgarian beer market performed well with a growth of 7.5 percent200 while future perspectives are promising201. Total market volu-me is estimated to be 4.7 million hectolitres:
Key variables Millions hectolitres Illustration
• Production 4.9 Total production of Bulgarian brewers over the first eight months of 2005 was 3.295 billion hl.
• Exports 0 Exports are currently minimal (some 1 percent of total production)
• Imports 0.2 Around 5 percent of beer consumption is imports
• Consumption 4.7
• Home consumption 68%
Market leaders in Bulgaria are the Zagorka brewery and Kamenitza, both part of one of the major European brewing companies. With beer sales at 1.5 million hectolitres (in 2003: 1.3 million), the market share of Zagorka is higher than 30 percent. Kamenitza also has a market share of more than 30 percent (in 2003: 26.9 percent), producing 326,000 in the first quarter of 2005 (total production in 2005 is estimated to be 1.3 million hl)202. After the fall of com-munism, the brewing sector privatised rapidly. The first foreign investor in the Bulgarian brewing sector acquired the Zagorka brewery in 1994. In 1995 Kamenitza was privatised and acquired by another international brewing com-pany. A third international brewing company operates also several brands in Bulgaria, selling 220,000 hl in the first quarter of 2005 (expected production volume for 2005: 880,000 hl). Apart from the brewing companies forming part of international brewing groups, there are a limited number of independent breweries. Two of these are now part of Bulbrew. Other inde-pendent breweries are Bolyarka, Lomsko Pivo and Sofia. There are currently 13 breweries in Bulgaria, operated by 7 brewing companies. One brewing group operates 4 breweries, three other companies each 2 breweries203.
200 Heineken N.V., Annual Report 2004. 201 The Association of Brewers in Bulgaria expects a growth rate of 5 to 8 percent (Member of the Board Dimitar Alexiev on Radio Bulgaria, May 28, 2004. 202 Source: www.see-news.com, May 26, 2005. 203 IBA (InvestBulgaria Agency), Bulgaria Factsheet 2004: Food & Beverage, November 2004.

The Contribution made by Beer to the European Economy Bulgaria 196
The economic impact of the brewing sector is influenced by the following trends, develop-ments and characteristics of the Bulgarian economy:
Brewing sector internal characteristics Context in which the brewing sector operates • Excise duties have been increased significant-
ly in recent years (100 percent increase in 2003 and another 50 percent increase in 2004)
• International brewing companies have entered the Bulgarian beer market
• Bulgarian breweries invest large amounts in modernising breweries204
• Beer consumption per capita is low with 57 li-tres a year in 2004205
• Beer consumption per capita is however gra-dually increasing (from 51 litres per capita in 2002 to an estimated 61 litres in 2005)
29.3 Direct effect of the brewing sector
The direct employment connected to Bulgarian breweries is estimated at 2,755 jobs206.
0
0,5
1
1,5
2
2.5
3
3.5
4
4,5
5
output of which exports
millions hl
0
20
40
60
80
100
120
140
supplies
valueadded
euro (mln.)
0
500
1.000
1.500
2.000
2.500
3.000
employment
0
10
20
30
40
50
60
70
80
90
100
euro (mln.)
VAT
excise
Personaldirect tax
0
0.5
1
1.5
2
3
4
4.5
5
output of which exports
millions hl
0
1
2
4
5
output of which exports
millions hl
0
20
40
60
80
100
120
140
supplies
valueadded
euro (mln.)
0
20
40
60
80
100
120
140
supplies
valueadded
euro (mln.)
0
500
1.000
1.500
2.000
2.500
3.000
employment
0
500
1,000
1,500
2,000
2,500
3,000
employment
0
10
20
30
40
50
60
70
80
90
100
euro (mln.)
VAT
excise
Personaldirect tax
0
10
20
30
40
50
60
70
80
90
100
euro (mln.)
VAT
excise
Personaldirect tax
0
0,5
1
1,5
2
2.5
3
3.5
4
4,5
5
output of which exports
millions hl
0
20
40
60
80
100
120
140
supplies
valueadded
euro (mln.)
0
20
40
60
80
100
120
140
supplies
valueadded
euro (mln.)
0
500
1.000
1.500
2.000
2.500
3.000
employment
0
500
1.000
1.500
2.000
2.500
3.000
employment
0
10
20
30
40
50
60
70
80
90
100
euro (mln.)
VAT
excise
Personaldirect tax
0
10
20
30
40
50
60
70
80
90
100
euro (mln.)
VAT
excise
Personaldirect tax
0
0.5
1
1.5
2
3
4
4.5
5
output of which exports
millions hl
0
1
2
4
5
output of which exports
millions hl
0
20
40
60
80
100
120
140
supplies
valueadded
euro (mln.)
0
20
40
60
80
100
120
140
supplies
valueadded
euro (mln.)
0
500
1.000
1.500
2.000
2.500
3.000
employment
0
500
1,000
1,500
2,000
2,500
3,000
employment
0
10
20
30
40
50
60
70
80
90
100
euro (mln.)
VAT
excise
Personaldirect tax
0
10
20
30
40
50
60
70
80
90
100
euro (mln.)
VAT
excise
Personaldirect tax
0
10
20
30
40
50
60
70
80
90
100
euro (mln.)
VAT
excise
Personaldirect tax
0
10
20
30
40
50
60
70
80
90
100
euro (mln.)
VAT
excise
Personaldirect tax
The sector generated € 53 million value added. Of total production value of € 132 million, an estimated 60 percent (i.e. € 79 million) is spent on goods and services produced by supplying sectors.
204 In 2004 around 25 million euros were invested by members of the Union of Brewers in Bulgaria and 22 million euros so far in the first six months of 2005. 205 SABMiller (Alan Clark), Building brand portfolios in Europe, April 26, 2005. 206 Because no data about direct employment could be found, direct employment is estimated on the basis of a com-parison with the Romanian brewing sector (using an identical ratio of employment to beer produced).

The Contribution made by Beer to the European Economy Bulgaria 197
29.4 Economic impact of breweries on suppliers of goods and services
In 2003 Bulgarian brewers spent some € 79 million in supplying sectors, generating jobs in these sectors: Sectors Stimul
us Stimulus for the Bulgarian economy
Personnel costs207 Labour costs per employee
(mln. €) % (mln. €) % of stimulus
(mln. €) (in €)
Number of em-ployees
• Agriculture208 14 70% 10 2,702• Utilities 3 100% 3 7.8% 0 4,116 53• Packaging industry 26 50% 13 11.6% 1 2,076 721• Equipment +other 6 50% 3 11.6% 0 2,076 168• Transport 5 100% 5 13.8% 1 2,856 233• Media, marketing 14 90% 13 15.8% 2 4,329 467• Services + other 11 90% 10 15.8% 2 4,329 327Total 79 57 6 4,716Primary impact as % of total impact 65%Total indirect effect of brewing sector 7,255
Total employment generated in supplying sectors is split up as follows:
0 1,000 2,000 3,000 4,000 5,000 6,000 7,000 8,000
Agriculture
Utilities
Packaging Media, marketing
Transportation
Equipment Services
Indirect employment
0 1,000 2,000 3,000 4,000 5,000 6,000 7,000 8,000
Agriculture
Utilities
Packaging Media, marketing
Transportation
Equipment Services
Indirect employment
207 Personnel costs as a percentage of total output of industries and labour costs per employee are obtained from Eurostat data. 208 The indirect impact on agriculture is estimated using the fact that average turnover per work unit in this sector is 3,591 euros a year208. A stimulus of 10 million euros in the Bulgarian agricultural sector therefore generates (prima-ry) employment effects of 2,700 jobs.

The Contribution made by Beer to the European Economy Bulgaria 198
29.5 Retail and hospitality sector
Hospitality sector
Estimating the impact of the brewing sector and the sales of beer on the hospitality sector: • According to the Union of Brewers in Bulgaria (UBB) it can be estimated that 33 percent
of total beer consumption is on-trade (in pubs and other segments of the hospitality sec-tor).
• This means beer sales in the hospitality sector amount to 1.5 million hl. • With an average consumer price in the hospitality sector of 1.3 euros a litre (including
VAT), this means the hospitality sector enjoys a turnover stimulus of almost 200 million euros (including VAT).
• With a VAT tariff of 20 percent on beer consumption, total on-trade expenditure on beer is 165 million euros (excluding VAT).
• With average turnover per employee in the Bulgarian hospitality sector at € 6,500209 (ex VAT), it is estimated that 25,450 jobs in the Bulgarian hospitality sector can be attributed to the brewing sector.
Retail
The employment in retail from the sale of beer can be similarly assessed: • Because it is estimated that around 67 percent of total beer consumption in Bulgaria is
off-trade, the off-trade consumption is estimated at 3.2 million hl. • With an average consumer price of 0.50 euros a litre, this means consumers spend about
159 million euros on beer in retail (including VAT), which translates to about 132 million euros (ex VAT).
• Because average turnover in retail is estimated at 45,400 euros a year210, this means that in retail around 2,910 jobs can be attributed to the sale of beer.
***
209 Source: Eurostat. 210 Source: Eurostat.

The Contribution made by Beer to the European Economy Croatia 199
30 CROATIA: ECONOMIC IMPACT OF BEER
30.1 Highlights on the economic impact
The economic impact of the brewing sector in Croatia can be expressed as follows: • Direct employment at Croatian breweries is estimated at 2,300 jobs. • Another 2,700 jobs are generated through goods and services purchased by Croatian
breweries within their own country. • Further jobs are generated in the hospitality sector and in retail because of the sales of
beer: an estimated 17,840 jobs in the hospitality sector and some 875 in retail. • The Croatian government also benefits from the brewing sector and the sale of beer. Total
tax revenues are estimated at just over 250 million euros, mainly in VAT revenues (about 114 million because of beer sold on-trade and another 28 million euros through on-trade sales of beer). Employees of breweries and other workers whose jobs can be attributed to beer production and sales also pay personal direct taxes amounting to an estimated 14 million euros. Excise duties are estimated at almost 100 million euros.
The total employment effect of Croatian breweries can be depicted as follows:
10%
11%
75%
4%
Total employment because of beer: 23,700 jobs
direct effect (breweries)
indirect effect (suppliers)
hospitality industry
retail
10%
11%
75%
4%
Total employment because of beer: 23,700 jobs
direct effect (breweries)
indirect effect (suppliers)
hospitality industry
retail
The total contribution to the Croatian economy in terms of value added due to the production and sale of beer is estimated at 155 million euros. The hospitality sector is responsible for more than 50 percent of total value added because of beer, reflecting the economic importan-ce of this sector for both the brewing sector and the Croatian economy as a whole.

The Contribution made by Beer to the European Economy Croatia 200
436
33
80
Value added due to production and sale of beer: 155 million euros
Breweries
Supplying sectors
Hospitality industry
Retail
436
33
80
436
33
80
Value added due to production and sale of beer: 155 million euros
Breweries
Supplying sectors
Hospitality industry
Retail
Value added due to production and sale of beer: 155 million euros
Breweries
Supplying sectors
Hospitality industry
Retail
***

The Contribution made by Beer to the European Economy Croatia 201
30.2 Market and industry structure, trends and developments
The Croatian beer market is dominated by two large breweries, while there are also 15 smal-ler breweries and microbreweries. Of these breweries seven have a production of more than 100,000 hl a year. The breweries together produce around 3.8 million hl a year of which a small fraction is exported:
Key variables Millions hectolitres Illustration
• Production 3.8 Beer production has been fairly stable in recent years (but has risen significantly compared to the production level of around 3 million hl in 1994/1995)211
• Exports 0.2 The most important export markets were Bosnia and Herzegovina, but exports have dropped in recent years because of high levels of taxation and duty on the ex-ports of beer
• Imports 0.16 Slovenia, the Netherlands, Germany, Italy and Austria are the most important countries of origin.
• Consumption 3.8
• Home consumption 50% Estimate by Ernst & Young
The breweries with the highest production volume in Croatia are Zagrebacka Pivovara and Karlovacka Pivovara. The former brewery is owned by one of the major European brewing companies and is Croatia’s leading brewery in production volume terms. With 1.7 million hl the company has gained a 44.9 percent market share (this brewery also produces the number one brand in Croatia). The latter brewing company was acquired by another major European brewing company in 2003 and is currently number two in Croatia in production volume (number one in export volume)212. Karlovacka brewery has a capacity of 1.3 million hectoli-tres; in 2002 its market share was 19.2 percent, resulting in a sales volume of 820,000 hl. In 2002 the brewery employed 595 people. Other breweries include Buzet (production volume in 2001: 121,000 hl), Daruvarska (153,000 hl), Jadranska (332,000 hl), Osijek (327,000 hl) and Panonska brewery (396,000 hl)213 214. Some of these breweries have a long history, with the Daruvarska brewery being the oldest (established in 1840). All breweries were nationalised after the Second World War. More recently, in the 1970s, three more breweries started (Jadranska, Panonska and Buzet).
211 Source: State Bureau of Statistics. 212 Heineken N.V., Annual Report 2004. 213 One of the major European brewing companies has acquired a share in this brewery in 2002. 214 Ksenija Dumicic, Sanda Renko and Natasa Renko, A case study of the Croatian beer market structure and perfor-mances, in: British Food Journal, Vol. 105, nr. 3, 2003.

The Contribution made by Beer to the European Economy Croatia 202
The economic impact of the brewing sector is influenced by the following trends, develop-ments and characteristics of the Croatian economy:
Brewing sector internal characteristics Context in which the brewing sector operates • International brewing companies have entered
the Croatian brewing sector by taking over the two largest companies
• Smaller beer companies and microbreweries also exist, adding to competition between companies
• Strict new anti-alcohol law reduces beer con-sumption
• High levels of taxation and duty on export of beer have a negative impact on exports
• Tourism provides an important stimulus for the Croatian beer market
• Beer consumption per capita is 88 litres a year215
30.3 Direct effect of the brewing sector
The brewing sector in Croatia employs some 2,300 personnel. This estimate is based partly on data available from neighbouring Slovenia and on data from individual breweries such as Karlovacka Pivovara. The production value of the Croatian breweries and the generated va-lue added are similarly estimated to be 139 and 36.4 million euros respectively.
0
0.5
1
1.5
2
2.5
3
3.5
4
4.5
output of which exports
millions hl
0
20
40
60
80
100
120
140
160
180
200
supplies
valueadded
euro (mln.)
0
500
1,000
1,500
2,000
2,500
employment
0
50
100
150
200
250
300
euro (mln.)
VAT
excise
Taxes paidby workers
0
0.5
1
1.5
2
2.5
3
3.5
4
4.5
output of which exports
millions hl
0
0.5
1
1.5
2
2.5
3
3.5
4
4.5
output of which exports
millions hl
0
20
40
60
80
100
120
140
160
180
200
supplies
valueadded
euro (mln.)
0
20
40
60
80
100
120
140
160
180
200
supplies
valueadded
euro (mln.)
0
500
1,000
1,500
2,000
2,500
employment
0
500
1,000
1,500
2,000
2,500
employment
0
50
100
150
200
250
300
euro (mln.)
VAT
excise
Taxes paidby workers
0
50
100
150
200
250
300
euro (mln.)
VAT
excise
Taxes paidby workers
Total tax revenues are estimated at more than 250 million euros, consisting mainly of VAT revenues (about 114 million from beer sold on-trade and another 28 million euros from on-trade beer sales). Employees of breweries and other workers whose jobs can be attributed to the production and sale of beer also pay direct personal taxes amounting to an estimated 14 million euros.
215 Source: Presentation by Interbrew, Strategic partnership with Apatinska Pivara (Serbian brewing company), 11 September 2003 (this presentation also contains information on other former Yugoslav states).

The Contribution made by Beer to the European Economy Croatia 203
30.4 Economic impact of breweries on suppliers of goods and services
The Croatian breweries together spend 139 million euros on goods and supplies from other sectors. These purchases result in substantial employment effects: Sectors Stimu-
lus Stimulus for the Croatian economy
Personnel costs216 Labour costs per employee
(mln. €) % (mln. €) % of stimu-lus
(mln. €) (in €)
Number of em-ployees
• Agriculture217 24 40% 10 947• Utilities 5 100% 5 14.6% 1 18,648 38• Packaging industry 34 40% 14 19.4% 3 14,064 188• Equipment +other 16 40% 6 19.4% 1 14,064 89• Transport 14 85% 12 23.5% 3 17,436 160• Media, marketing 20 85% 17 20.9% 4 23,808 149• Services + other 25 85% 21 20.9% 4 23,808 187Total 139 85 1,758Primary impact as % of total impact 65%Total indirect effect of brewing sector 2,705
Total employment generated in supplying sectors is split up as follows:
0 500 1,000 1,500 2,000 2,500 3,000
Agriculture
Utilities
Packaging Media, marketing
TransportationEquipment
Services
Indirect employment
0 500 1,000 1,500 2,000 2,500 3,000
Agriculture
Utilities
Packaging Media, marketing
TransportationEquipment
Services
Indirect employment
216 Personnel costs as a percentage of total output of industries and labour costs per employee are obtained from Eurostat data. 217 The effect on agriculture is estimated using data from neighbouring Slovenia (because Eurostat data is lacking). With an average turnover per agricultural worker of 10,244 and a stimulus of 10 million euros because of purchases made by the brewing sector, there is a primary effect of around 950 agricultural workers.

The Contribution made by Beer to the European Economy Croatia 204
30.5 Retail and hospitality sector
Hospitality sector
The economic impact of the breweries on the hospitality sector depends on the share of on-trade consumption in total consumption, the average consumer price of beer and average turnover per employee in the hospitality sector: • The share of on-trade beer consumption within total beer consumption is estimated to be
50 percent. • With a total beer consumption of 3.6 million hl, on-trade beer consumption is 1.8 million
hl. • At an average consumer price of 3.50 euros per litre, this results in total consumer spen-
ding on beer amounting to 630 million euros (including VAT) or 520 million euros ex VAT (using a 22 percent VAT tariff).
• With an average turnover per employee of 29,000 euros (using Eurostat data from Slove-nia218), this results in almost 17,840 jobs in the hospitality sector.
Retail
Using the same approach also provides an estimate for the employment in retail because of beer sales: • Assuming that 50 percent of the beer consumed in Croatia is sold by retail, this means
that around 1.8 million hl is retail. • With an average consumer price of 0.87 euros per litre in supermarkets, this leads to con-
sumer spending of 158 million euros (including VAT) and 130 million euros (ex VAT). • With an average turnover per employee of 147,500 euros (ex VAT) annually in wholesale
and retail (using data covering Slovenia because Eurostat data on Croatia is lacking), this results in some 875 jobs in retail attributable to beer sales.
***
218 Eurostat does not provide data on Croatia.

The Contribution made by Beer to the European Economy Romania 205
31 ROMANIA: ECONOMIC IMPACT OF BEER
31.1 Highlights of the economic impact
The most important characteristics of the Romanian beer market are: • Fast-growing market with average growth rates around 10% annually. • Price competition between brewers and a preference for low-cost beers among certain
consumer groups. • Romanian breweries employ around 8,500 personnel (FTE). • Because of goods and services bought in supplying sectors, additional indirect employ-
ment of around 20,950 employees is generated. • In the Romanian on-trade some 51,031 employees can be attributed to the sale of beer. In
off-trade some 9,440 personnel owe their jobs to beer sales. • Total impact of the brewing sector in terms of employment can thus be estimated as high
as 89,900 employees. • Tax revenues for the Romanian government from the beer sector are approximately 7.25
million euros in excise, 145 million euros in VAT and 26 million euros in direct personal taxes paid by workers. Total tax revenues amount to some 178.25 million euros.
The total employment impact of the brewing sector is depicted below:
9%
23%
58%
10%
Total employment due to production and sale of beer: 89,900 jobs
direct effect (breweries)
indirect effect (suppliers)
hospitality industry
retail
9%
23%
58%
10%
Total employment due to production and sale of beer: 89,900 jobs
direct effect (breweries)
indirect effect (suppliers)
hospitality industry
retail In Romania the productivity in terms of value added per employee is relatively high in the brewing sector. This high productivity reflects the fact that in recent years the brewing sector has invested heavily in modernising breweries, also because of international companies ente-ring the Romanian brewing sector. This is the main explanation for the fact that the brewing

The Contribution made by Beer to the European Economy Romania 206
sector accounts for only a small fraction of the total number of jobs attributable to the pro-duction and sale of beer, but is generating around 38 percent of total value added due to the production and sale of beer. The total contribution of the brewing sector to the Romanian economy (directly and indirectly), is estimated at around 350 million euros:
15
135
69
128
Value added due to production and sale of beer: 350 million euros
Breweries
Supplying sectors
Hospitality industry
Retail
15
135
69
128
15
135
69
128
Value added due to production and sale of beer: 350 million euros
Breweries
Supplying sectors
Hospitality industry
Retail
Value added due to production and sale of beer: 350 million euros
Breweries
Supplying sectors
Hospitality industry
Retail
***
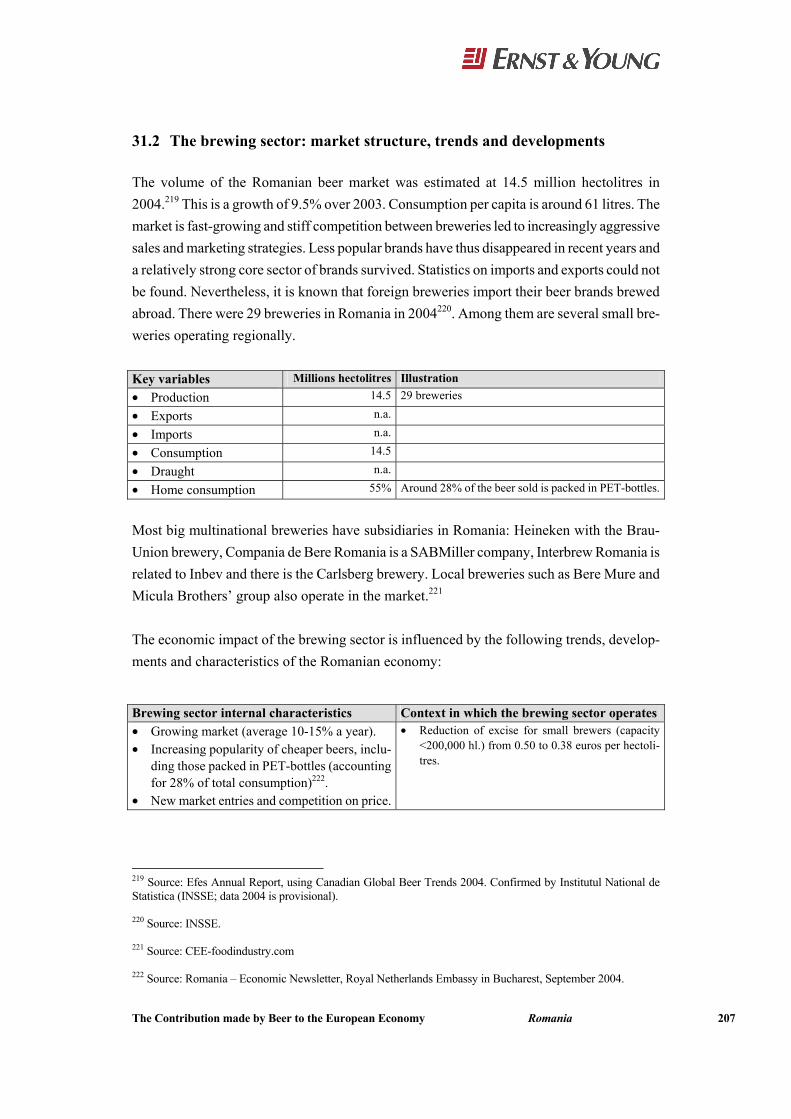
The Contribution made by Beer to the European Economy Romania 207
31.2 The brewing sector: market structure, trends and developments
The volume of the Romanian beer market was estimated at 14.5 million hectolitres in 2004.219 This is a growth of 9.5% over 2003. Consumption per capita is around 61 litres. The market is fast-growing and stiff competition between breweries led to increasingly aggressive sales and marketing strategies. Less popular brands have thus disappeared in recent years and a relatively strong core sector of brands survived. Statistics on imports and exports could not be found. Nevertheless, it is known that foreign breweries import their beer brands brewed abroad. There were 29 breweries in Romania in 2004220. Among them are several small bre-weries operating regionally. Key variables Millions hectolitres Illustration
• Production 14.5 29 breweries
• Exports n.a.
• Imports n.a.
• Consumption 14.5
• Draught n.a.
• Home consumption 55% Around 28% of the beer sold is packed in PET-bottles.
Most big multinational breweries have subsidiaries in Romania: Heineken with the Brau-Union brewery, Compania de Bere Romania is a SABMiller company, Interbrew Romania is related to Inbev and there is the Carlsberg brewery. Local breweries such as Bere Mure and Micula Brothers’ group also operate in the market.221 The economic impact of the brewing sector is influenced by the following trends, develop-ments and characteristics of the Romanian economy:
Brewing sector internal characteristics Context in which the brewing sector operates • Growing market (average 10-15% a year). • Increasing popularity of cheaper beers, inclu-
ding those packed in PET-bottles (accounting for 28% of total consumption)222.
• New market entries and competition on price.
• Reduction of excise for small brewers (capacity <200,000 hl.) from 0.50 to 0.38 euros per hectoli-tres.
219 Source: Efes Annual Report, using Canadian Global Beer Trends 2004. Confirmed by Institutul National de Statistica (INSSE; data 2004 is provisional). 220 Source: INSSE. 221 Source: CEE-foodindustry.com 222 Source: Romania – Economic Newsletter, Royal Netherlands Embassy in Bucharest, September 2004.

The Contribution made by Beer to the European Economy Romania 208
31.3 The direct effect of the brewing sector
The brewing companies had some 8,500 direct job positions in 2004.223 The indirect impact of the Romanian brewing sector on employment is based on survey research and national sta-tistical data estimated at 20,948 job positions. Together the breweries realise a turnover of 388 million euros, of which approximately 252 million is spent on supplying sectors. This means that the Romanian breweries together rea-lise 135 million euros value added:
0
2
4
6
8
10
12
14
16
Output Of which exports
millions hl
0
50
100
150
200
250
300
350
400
450
euro (mln.)
supplies
valueadded
employment
0
1,000
2,000
3,000
4,000
5,000
6,000
7,000
8,000
9,000
0
20
40
60
80
100
120
140
160
180
200
euro (mln.)
Personal direct tax
VAT
excise0
2
4
6
8
10
12
14
16
Output Of which exports
millions hl
0
50
100
150
200
250
300
350
400
450
euro (mln.)
supplies
valueadded
0
50
100
150
200
250
300
350
400
450
euro (mln.)
supplies
valueadded
employment
0
1,000
2,000
3,000
4,000
5,000
6,000
7,000
8,000
9,000
employment
0
1,000
2,000
3,000
4,000
5,000
6,000
7,000
8,000
9,000
0
20
40
60
80
100
120
140
160
180
200
euro (mln.)
Personal direct tax
VAT
excise0
20
40
60
80
100
120
140
160
180
200
euro (mln.)
Personal direct tax
VAT
excise
Note: Figures on exports were not available. 31.4 The economic impact of breweries on suppliers of goods and services
Given that around 35 percent of the total production value of Romanian breweries is spent on suppliers, breweries have an important economic impact on supplying sectors. The largest proportion of supplies is purchased from the services sector, with further signifi-cant spending on agricultural products, media and marketing, transport and packaging.
223 Source: Eurostat.

The Contribution made by Beer to the European Economy Romania 209
Sectors Stimu-lus224
Stimulus for the Romanian economy
Personnel costs225 Labour costs per employee
(mln. €) % (mln. €) % of stimu-lus
(mln. €) (in €)
Number of em-ployees
• Agriculture226 47 75% 35 8,918• Utilities 11 95% 11 10% 1 4,068 266• Packaging industry 40 60% 24 16% 4 7,188 533• Equipment +other 37 45% 17 16% 3 7,188 372• Transport 26 100% 26 21% 5 3,708 1,446• Media, marketing 30 85% 26 20% 5 7,476 690• Services + other 61 85% 52 20% 10 7,476 1,391Total 253 13,616Primary impact as % of total impact 65%Total indirect effect of brewing sector 20,948
The indirect employment impact is depicted below:
0 5,000 10,000 15,000 20,000 25,000
Agriculture
Utilities
Packaging Media, marketing
Transportation
Equipment Services
Indirect employment
0 5,000 10,000 15,000 20,000 25,000
Agriculture
Utilities
Packaging Media, marketing
Transportation
Equipment Services
Indirect employment
224 Percentages based on statistical data analysis and country comparison. 225 Personnel costs as a percentage of total output of industries and labour costs per employee are obtained from Eurostat data. 226 For the impact of the brewing sector on agriculture, we have used the industry ratio of total turnover to total em-ployment in FTE (i.e. 10.6 billion euros with 2.68 million FTE) to go from the stimulus in agriculture because of ‘beer’ (i.e. 35 million euros) to resulting employment (8,918 FTE after one round).

The Contribution made by Beer to the European Economy Romania 210
31.5 Retail and hospitality sectors
In Romania 45 percent of beer is sold through the hospitality sector. The other 55 percent of sales occur in the retail market.
Hospitality sector
Employment arising from the sale of beer in the hospitality sector is estimated as follows: • Around 45 percent of beer consumption in Romania occurs in the hospitality sector. • This means 6.5 million hl are sold by Romanian pubs, restaurants and the like. • The estimated consumer price is about 0.88 euros per litre227, so that consumers are esti-
mated to spend 574 million euros on beer in pubs and restaurants. • Turnover per employee in the Romanian hospitality sector is 9,700 euros a year.228 • Total employment in the Romanian hospitality sector from beer sold thus equals 51,031
employees.
Retail
Employment in retail arising from beer sales can be similarly assessed: • About 55 percent of the total beer consumption in Romania is beer sold by supermarkets
and other retail companies. • With an average consumer price of 0.60 euros (incl. VAT) per litre229, total consumer
spending on retail beer is estimated at 478.5 million euros. • Because the annual turnover per employee is estimated at 43,700 euros, this means 9,439
people owe their jobs to retail beer sales.
***
227 Estimated beer price by EY, as real prices fluctuate and beer in different price ranges is available. 228 Source: Eurostat, Turnover per persons employed in services (2001). 229 Estimated beer price by EY, as real prices fluctuate and beer in different price ranges is available.

The Contribution made by Beer to the European Economy Turkey 211
32 TURKEY: ECONOMIC IMPACT OF BEER
32.1 Highlights of the economic impact
The economic impact of the brewing sector can be expressed as follows: • A very strong market position for one brewing company of Turkish origin with an 80%
market share. • Turkish breweries employ 2,850 people directly. • Because of goods and services bought in the supplying sectors, additional indirect em-
ployment is generated of around 36,700 employees. • In the Turkish hospitality sector some 48,200 employees can be attributed to the sale of
beer and in the retail sector some 12,600 employees. • The total impact of the brewing sector in terms of direct and indirect employment can be
estimated as high as 100,500 employees. • Turkish government tax revenues from the beer sector are approximately 600 million
euros in excise, 275 million euros in VAT and 125 million euros in direct personal taxes paid by workers. The total tax revenues amount to approximately 1 billion euros.
The economic impact of the brewing sector in terms of employment is depicted below:
3%
36%
49%
12%
Total employment due to production and sale of beer: 100,500 jobs
Direct effect (breweries)
Indirect effect (suppliers)
Hospitality sector
Retail
3%
36%
49%
12%
Total employment due to production and sale of beer: 100,500 jobs
Direct effect (breweries)
Indirect effect (suppliers)
Hospitality sector
Retail
Total employment due to production and sale of beer: 100,500 jobs
Direct effect (breweries)
Indirect effect (suppliers)
Hospitality sector
Retail The total contribution of the brewing sector to the Turkish economy in terms of value added is estimated at some 755 million euros. The very high productivity per employee in the bre-wing sector in comparison to other sectors is the reason that the brewing sector itself contri-butes more than 50 percent to total value added generated due to production and sale of beer:

The Contribution made by Beer to the European Economy Turkey 212
***
23
417227
88
Value added due to production and sale of beer: 755 million euros
Breweries
Supplying sectors
Hospitality industry
Retail
23
417227
88 23
417227
88
Value added due to production and sale of beer: 755 million euros
Breweries
Supplying sectors
Hospitality industry
Retail
Value added due to production and sale of beer: 755 million euros
Breweries
Supplying sectors
Hospitality industry
Retail

The Contribution made by Beer to the European Economy Turkey 213
32.2 The brewing sector: market structure, trends and developments
The production of beer in 2004 in Turkey was approximately 8.8 million hectolitres.230 The consumption per capita is around 11.3 litres per year, which totals about 8.2 million hecto-litres.231 Compared with other European countries consumption per capita is relatively low. Nevertheless, the Turkish beer market has grown at an accumulated rate of 15% over the past five years. International brands have displayed higher growth rates. The export of Turkish-originated beer is relatively low as only 0.625 mhl were exported in 2004 (of which 0.380 million hectolitres by the market leader, the rest by the runner up in the Turkish beer market with some 0.245 million hectolitres exported).232
Key variables Millions hectolitres Illustration
• Production 8.8 11 brewing facilities (7 breweries)
• Exports 0.625 Turkey is a minor beer exporter. Nevertheless, Turkish brewers have production facilities outside Turkey for local sales.
• Imports 0.024
• Consumption 8.2
• Draught n.a.
• Home consumption 68% 32% of the total beer sales in Turkey are via the hospitality sector.
Sources: Turkish Brewers’ Association, Turkey’s Statistical Yearbook, press releases and calculations made by Ernst & Young.
A characteristic of the market is the strong position of one brewing company with a market share of approximately 80 percent, followed by another company with a 19 percent market share233. There are 11 production units for beer operating in Turkey. The total Turkish pro-duction capacity is 1,240,000 metric tons.234 Turkey has a total malting capacity of 131,000 tons with three malteries and one hops processing facility. The economic impact of the brewing sector is influenced by the following trends, develop-ments and characteristics of the Turkish economy:
230 Source: Turkish Brewers’ Association: Beer and Malt Report prepared by Ad Hoc Committee of State Planning Organisation to be published in Jan. 2006. 231 Turkey Statistical Yearbook 2004, population in 2000 was 67,803,927. 232 Source: Anadolu Efes annual report 2004 and Türk Tuborg sources. 233 Source: press release Fosters / Efes Beverage Group, 4th of January 2005 and Türk Tuborg sources. 234 Beer and Malt Report by State Planning Organisation

The Contribution made by Beer to the European Economy Turkey 214
Brewing sector internal characteristics Context in which the brewing sector operates
• The market has been growing fast over the past five years.
• Turkish beer market is dominated by Efes Pilsner with a market share of almost 80%.
• The local brands have strong market positions.• Consumption per capita of 11 litres/year is
rather low by European standards.
• Increasing tourism is one of the accelerators of the Turkish beer market, especially for foreign brands.
• Excise is rather high at 73.40 euros per hecto-litre. In total Turkish breweries pay approxi-mately 600 million euros in excise tax to the government.
32.3 The direct effect of the brewing sector
The brewing companies provided employment to 2,850 people in 2004.235 The breweries to-gether realise a turnover of 1.1 billion euros, of which approximately 683 million euros is spent on the supplying sectors. This means the Turkish breweries together realise 417 million euros value added: million hl euro (mln.) employment euro (mln.)
excise
VAT
0
500
1,000
1,500
2,000
2,500
3,000
0
200
400
600
800
1,000
1,200
valueadded
supplies
0
1
2
3
4
5
6
7
8
9
10
Output Of which exports0
200
400
600
800
1,000
1,200
excise
VAT
value
supplies
Personaldirect tax
million hl euro (mln.) employment euro (mln.)
excise
VAT
0
500
1,000
1,500
2,000
2,500
3,000
0
200
400
600
800
1,000
1,200
valueadded
supplies
0
1
2
3
4
5
6
7
8
9
10
Output Of which exports0
200
400
600
800
1,000
1,200
excise
VAT
value
supplies
Personaldirect tax
The tax revenues are also important, with total excise revenues on beer of 600 million euros. With beer sold in pubs and cafes, VAT revenues are generated amounting to about 139 mil-lion euros. Beer sales in supermarkets and other off-trade outlets generate another 136 mil-lion euros in VAT revenues. It can also be estimated that employees working for the Turkish breweries together pay some 4 million euros in personal and direct tax and that workers in supplying sectors, in the hospitality sector and in retail who hold a job that can be attributed to the sale of beer, pay another 123 million euros in personal direct tax. Total tax revenues are therefore estimated at 1 billion euros.
235 Source: Turkish Brewers’ Association.

The Contribution made by Beer to the European Economy Turkey 215
32.4 The economic impact of breweries on suppliers of goods and services
Because 62 percent of the total production value of Turkish breweries is spent on suppliers, breweries have an important economic impact on supplying sectors: Sectors Stimu-
lus236 Stimulus for the Turkish economy
Personnel costs237 Labour costs per employee
(mln. €) % (mln. €) % of stimu-lus
(mln. €) (in €)
Number of em-ployees
• Agriculture238 107 80% 86 8,580• Utilities 56 100% 56 11% 6 6,600 910• Packaging industry 176 75% 132 22% 29 7,200 4,025• Equipment +other 78 50% 39 22% 9 7,200 1,250• Transport 20 100% 20 25% 5 6,600 760• Media, marketing 171 95% 162 28% 45 7,800 5,770• Services + other 75 95% 71 28% 20 7,800 2,560Total 683 23,855Primary impact as % of total impact 65%Total indirect effect of brewing sector 36,700
Indirect employment impact is depicted below:
0 5,000 10,000 15,000 20,000 25,000 30,000 35,000 40,000
Indirect employment
Agriculture Utilities
PackagingEquipment
TransportationMedia, marketing
Other service
0 5,000 10,000 15,000 20,000 25,000 30,000 35,000 40,000
Indirect employment
Agriculture Utilities
PackagingEquipment
TransportationMedia, marketing
Other service
236 Percentages based on data obtained from Turkish breweries and Turkish Brewers’ Association. 237 Personnel costs as a percentage of total output and labour costs per employee are obtained from Eurostat. 238 For the impact of the brewing sector on agriculture, we have used the stimulus on the Turkish agriculture sector because of ‘beer’ (i.e. 86 million euros) and the estimated turnover per work unit per year (i.e. 10,000 euros).238 This results in an employment of 8,580 FTE after one round.

The Contribution made by Beer to the European Economy Turkey 216
32.5 Retail and hospitality sectors
In Turkey 32 percent of beer sales occur through the hospitality sector. Another 68% finds its way to the consumer through the retail channel. The employment in retail that can be attribu-ted to the brewing sector is estimated at some 12,600 jobs: • About 68 percent of the total beer consumption in Turkey is beer sold by supermarkets
and other retail companies. • With an average consumer price of 1.60 euros (incl. VAT) per litre239, total consumer
spending on retail beer is estimated at 756 million euros (excl. VAT). • Because the annual turnover per employee is estimated at 60,000 euros, this means that
12,600 people owe their jobs to the sale of retail beer. Employment due to the sale of beer in the hospitality sector can be similarly assessed: • Around 32 percent of beer consumption in Turkey occurs in the hospitality sector. • This means 2.6 million hl are sold by Turkish pubs, restaurants and the like. • The consumer price of beer is about 3.50 euros (incl. VAT) per litre240, so that consumers
are estimated to spend around 770 million euros (excluding VAT) on beer in pubs and restaurants.
• Turnover per employee in the Turkish hospitality sector is 16,000 euros a year.241 • Total employment in the Turkish hospitality sector because of beer sold is thus 48,200
employees.
***
239 Estimated beer price by EY, as real prices fluctuate and beer in different price ranges is available. 240 Estimated beer price by EY, as real prices fluctuate and beer in different price ranges is available. 241 Estimate made by Ernst & Young, extrapolating data from neighbouring countries.

The Contribution made by Beer to the European Economy Norway 217
33 NORWAY: ECONOMIC IMPACT OF BEER242
33.1 Highlights of economic impact
The economic impact of the brewing sector can be expressed as follows: • In 2004 the five Norwegian breweries produced 2,230 thousand hectolitres of beer. • Large and growing price differences stimulate private imports and smuggling. • The breweries employ some 3,000 personnel. • An open economy and trading climate result in relatively small indirect effects on raw
materials suppliers. Indirect employment at suppliers thus amounts to a mere 680 full-time jobs.
• Employment in the hospitality sector and the retail sector total roughly 12,100 full-time jobs.
• Norway has Europe’s highest excise on beer. Excise revenues from beer amounted to 449 million euros, where additional VAT revenues from beer sales are estimated at some 300 million euros. Total tax revenues (including corporate and environmental taxes) are around € 910 million.
The employment effects of the brewing sector are depicted below:
19%
4%
65%
12%
Total employment due to production and sale of beer: 15,800 jobs
Direct effect (breweries)
Indirect effect (suppliers)
Hospitality sector
Retail
19%
4%
65%
12%
Total employment due to production and sale of beer: 15,800 jobs
Direct effect (breweries)
Indirect effect (suppliers)
Hospitality sector
Retail The contribution of the brewing sector to the Norwegian economy can also be expressed in terms of value added. Total Norwegian brewing sector value added and value added generated by firms in the supply, hospitality and retail sectors arising from the production and sale of beer amounts to around 392 million euros: 242 Currencies have been converted using a conversion rate of € 1 = 8.372 Norwegian kroner

The Contribution made by Beer to the European Economy Norway 218
Value added due to production and sale of beer: 392 million euro
Breweries
Supplying sectors
Hospitality industry
Retail
3496
69
192
Value added due to production and sale of beer: 392 million euro
Breweries
Supplying sectors
Hospitality industry
Retail
Value added due to production and sale of beer: 392 million euro
Breweries
Supplying sectors
Hospitality industry
Retail
3496
69
192
3496
69
192
The share of the brewing sector in overall value added arising from the production and sale of beer is estimated at almost 25 percent. The share of the hospitality sector in total value ad-ded due to production and sale of beer is estimated at 49 percent, which is considerably lower than the share of this sector in the total employment impact of beer. An explanation for this is that value added per employee in the hospitality sector is relatively low to the brewing sector and to most of the sectors that supply goods and services to the brewing sector.
***

The Contribution made by Beer to the European Economy Norway 219
33.2 The brewing sector: market structure, trends and developments
Norwegian breweries produced 2.2 million hectolitres of beer in 2004. Norwegians con-sumed 2.5 million hectolitres of beer. Three-quarters of this volume was bought in shops; one-quarter was bought in bars and other public places. The officially recorded consumption of 54 litres per capita is very low. This is explained by a substantial unregistered border trade: the privately imported beer (mainly from Sweden, Denmark and Finland) is not inclu-ded in the official statistics. This private border trade was estimated at 300,000 hectolitres in 2004.
Key variables Million hectolitres Illustration
• Production 2.2
• Exports 0.03
• Imports 0.2
• Registered consumption 2.5 This is a 9.7% increase over 2003. The most important explanation is the price war in the retail channel which convinced many to buy cheap beer at home instead of privately importing beer from Sweden, Denmark or Finland.
• Border trade 0.3 Estimate
• Total consumption 2.8
• Home consumption 75%
There are at the moment some 25 breweries in Norway. The brewing company with the lar-gest market share (some 58 percent)is part of one of the major international brewing compa-nies. This company is running four breweries in Norway. The number two in the Norwegian beer market exploits three breweries (including one microbrewery) and has also foreign bre-wing companies as stakeholders. Further there are four smaller breweries and about 15 brew-pubs and microbreweries. 33.3 Direct effect of the brewing sector
The number of jobs offered by Norwegian breweries is estimated at some 3,000. Together the Norwegian breweries create a total amount of value added worth 80 million euros243. Total consumers’ spending on beer in retail is estimated at some € 715 million and on-trade in pubs and the like at some € 630 million (see also paragraph on retail and hospitality sec-tors). According to data provided by the Association of Norwegian Brewers and Soft Drink Producers (BROM), around 20 percent of the beer price to consumers in retail is earned by brewing companies and around 12 percent of the beer price to consumers in pubs and
243 Estimate based on data from Eurostat and other publicly available statistics.

The Contribution made by Beer to the European Economy Norway 220
restaurants. This means that turnover of the Norwegian brewing companies due to the sale of beer in Norway is estimated at some € 220 million. Other economic effects from the brewing sector include tax revenues. According to the Bryg-geri- og mineralvannforeningen (BROM), the beer and soft drinks industry supplies the government with 7.6 billion Norwegian kroner (€ 908 million) on annual revenues from exci-ses and taxes. Norwegian alcohol excise duty tariffs are the highest in Europe. Excise duties on a hectolitre of beer are 1.618 kroner (€ 193.26). This means that the excise duty on a standard 0.33 cl. bottle of beer is 5.40 kroner (€ 0.64). This is more than twice the rate in Sweden, and five ti-mes the Danish tariff. In 2004 total alcohol excise revenues from beer amounted to 3,759 million kroner (€ 449 million). Beer excise was amongst the ten largest sources of tax reve-nues244. The large differences induce a substantial cross-border trade and black market. In the first seven months of 2005 Norwegian customs authorities seized 160,000 litres of smuggled beer, which is probably just a small fraction of the total smuggled amount. Accor-ding to official estimates, Norwegians’ private imports amount to 300,000 hectolitres annual-ly245. This amount is likely to continue rising as neighbouring EU members Finland and Swe-den have announced tax reductions on beer, while Norway retains its high excise levels. millions hl euro (mln.)
0
0,5
1
1,5
2
2,5
Output Of which exports0
50
100
150
200
250
300
supplies
value added
employment
0
500
1,000
1,500
2,000
2,500
3,000
3,500
euro (mln.)
0
100
200
300
400
500
600
700
800
900Direct taxemployees
VAT
Excise
millions hl euro (mln.)
0
0,5
1
1,5
2
2,5
Output Of which exports0
50
100
150
200
250
300
0
50
100
150
200
250
300
supplies
value added
employment
0
500
1,000
1,500
2,000
2,500
3,000
3,500
euro (mln.)
0
100
200
300
400
500
600
700
800
900Direct taxemployees
VAT
Excise
We estimate the total VAT revenues from beer at around € 300 million each year. Together with excise revenues and direct taxes paid by employees whose jobs can be attributed to the production and sale of beer these taxes sum up to some 830 million euros.
244 Source: Tollvesenet, Annual report 2004. 245 Source: Bryggeriforenningen and the National Institute for Consumer Research (SIFO).

The Contribution made by Beer to the European Economy Norway 221
33.4 Economic impact of breweries on suppliers of goods and services
The total turnover of the Norwegian brewing sector is estimated at € 220 million (including only the brewing activities). Though no specific details are available we may assume that roughly 60 to 65 percent (estimate) of this turnover is spent on raw materials and other goods and services. The majority of this amount is spent on agricultural raw materials. All brewing malt is imported246, for example from Sweden and Denmark. Sectors Stimu-
lus Stimulus for the Norwegian economy
Personnel costs247 Labour costs per employee
(mln. €) % (mln. €) % of stimu-lus
(mln. €) (in €)
Number of em-ployees
• Agriculture 29 0% 0 0• Utilities 6 100% 6 15% 1 54,000 15• Packaging industry 24 40% 10 20% 2 45,000 40• Equipment 11 50% 5 20% 1 45,000 25• Transport 22 100% 22 18% 4 47,550 85• Media, marketing 33 100% 33 32% 11 62,000 170• Services 20 100% 20 32% 6 62,000 105Total 144 440Primary impact as % of total impact 65%Total indirect effect of brewing sector 680
Source: Own calculations on the basis of National Statistics and Eurostat After the primary or first round, we estimate that the Norwegian brewing sector induces 440 indirect jobs. This is relatively low because of the extensive imports of raw materials. Total indirect employment effects are estimated at 680 jobs. Indirect employment effects are illustrated below:
246 Source: Association of Norwegian Brewers and Soft Drink Producers (BROM). 247 Personnel costs as a percentage of total output of industries and labour costs per employee are obtained from Eurostat data.

The Contribution made by Beer to the European Economy Norway 222
0 100 200 300 400 500 600 700 800
Utilities
PackagingEquipment
Transportation Media, marketing
Other service
Indirect employment
0 100 200 300 400 500 600 700 8000 100 200 300 400 500 600 700 800
Utilities
PackagingEquipment
Transportation Media, marketing
Other service
Indirect employment
33.5 Retail and hospitality sectors
Low-alcohol beer (< 4.75 percent alcohol) is sold through supermarkets and other shops. The state-owned Vinmonopolet has the exclusive monopoly on the retail distribution of beer with over 4.75 percent6 alcohol. Some 75 percent of the registered consumption is bought in Nor-wegian shops, whereas 25% is consumed in bars and other public places. This implies that 1,868 thousand hectolitres are sold through Norwegian shops (off-trade), and 623 thousand hectolitres are consumed in the hospitality sector (on-trade). From national statistics we know that each Norwegian household spends 2,112 kroner on beer in the retail channel each year. Norway has 3.279 million households248. From this we can deduce that each year, Norwegians spend some 6.925 billion kroner (€ 827 million) on beer through the retail channel. Approximately 4.5 percent of this amount (€ 37 million) is the margin for trade and distribution.
Hospitality sector
The approach to estimate employment in the hospitality sector attributable to beer, takes the beer turnover of pubs and restaurants as a starting point: • Around 25 percent of beer consumption in Norway takes place in the hospitality sector. • This means that 623 thousand hl are sold by pubs, restaurants and the like.
248 Source: Statistics Norway, Survey of Consumer Expenditure.

The Contribution made by Beer to the European Economy Norway 223
• The consumer price of beer is about 9.56 euros per litre (excl. VAT, source: BROM)249, so that consumers are estimated to spend 596 million euros (excl. VAT) on beer in pubs and restaurants.
• Turnover per employee in the Norwegian hospitality sector is 58,000 euros a year. • Total employment in the hospitality sector arising from the sale of beer thus equals
10,250 jobs.
Retail
The importance of the brewing sector for retail can be similarly assessed: • About 75 percent of total beer consumption is beer sold by supermarkets and other retail
companies. This represents 1.9 million hectolitres. • With an average consumer price of 3.40 euros per litre (excluding VAT), total consumer
spending on retail beer is estimated at 630 million euros. • Because turnover per employee is estimated at 342,500 euros, this means 1,850 people
owe their jobs to the retail beer brewing sector.
*** 249 The prices in this paragraph are estimates of the average prices in the on-trade and off-trade channels at the begin-ning of 2004. Retail prices declined in 2004 due to a tough price war. We present average prices, but in reality prices vary considerably, depending on many different factors including the size of the container or glass, the type of esta-blishment and the location.

The Contribution made by Beer to the European Economy Norway 224

The Contribution made by Beer to the European Economy Switzerland 225
34 SWITZERLAND: ECONOMIC IMPACT OF BEER250
34.1 Highlights of the economic impact
The economic impact of the brewing sector can be expressed as follows: • Swiss breweries produce some 3.56 million hectolitres of beer annually. • The breweries employ over 3,000 personnel. • Suppliers employ only 820 staff, as a large quantity of supplies is imported. • The employment effect of the Swiss beer sector is largest in the hospitality sector.
75percent of the beer-related jobs are created here. This equals 17,000 full-time jobs. • Total government revenues from beer (excise and VAT) are 200 million euros. The employment effects of the brewing sector are depicted below:
14%
4%
76%
6%
Total employment due to production and sale of beer: 22,000 jobs
Direct effect (breweries)
Indirect effect (suppliers)
Hospitality sector
Retail
14%
4%
76%
6%
Total employment due to production and sale of beer: 22,000 jobs
Direct effect (breweries)
Indirect effect (suppliers)
Hospitality sector
Retail The contribution of the brewing sector to the Swiss economy can also be expressed in terms of value added. Total value added of the brewing sector in Switzerland and value added ge-nerated by firms in the supply, hospitality and retail sectors arising from the production and sale of beer amounts to around 851 million euros:
250 When necessary, Swiss francs were converted into Euros using an exchange rate of € 1 = 1.544 Swiss francs

The Contribution made by Beer to the European Economy Switzerland 226
Value added due to production and sale of beer: 851 million euro
Breweries
Supplying sectors
Hospitality industry
Retail
21 114
65
651
Value added due to production and sale of beer: 851 million euro
Breweries
Supplying sectors
Hospitality industry
Retail
Value added due to production and sale of beer: 851 million euro
Breweries
Supplying sectors
Hospitality industry
Retail
21 114
65
651
21 114
65
651 The share of the brewing sector in overall value added arising from the production and sale of beer is estimated at 13 percent. This almost equals the share of direct employment connec-ted to breweries as a fraction of total employment arising from the production and sale of beer (14 percent).
***

The Contribution made by Beer to the European Economy Switzerland 227
34.2 The brewing sector: market structure, trends and developments
In 2004 the Swiss consumed 57.3 litres of beer per capita. This is around the EU average, but well below consumption in neighbouring France and Germany. Beer consumption has decli-ned by more than 20 percent over the past 15 years, although pro capita consumption is fairly stable in recent years (around 57 to 59 litre of beer per capita251). 83 percent of the total volu-me consumed was brewed domestically. Swiss beer exports are very small.
Key variables Million hectolitres Illustration
• Production 3.6 Switzerland has some 24 breweries. Together Carlsberg (3 breweries) and Heineken (1 brewery) produce 60% of the total production.
• Exports 0.02
• Imports 0.7
• Consumption 4.3 The average Swiss consumed 57.3 litres of beer in 2004.
• Home consumption 60% Some 11% of beer consumption concerns cans, some 55% bottles and the rest is draught beer252.
The Swiss brewing sector is somewhat concentrated. The market leader has a share of 42 per-cent; the second largest has 17 percent. Then there are 20 independent breweries, most of them fairly small (< 50,000hl/year), servicing 24 percent of the market. There are also ± 80 micro breweries and ± 20 brewing pubs with a combined market share of some 1 percent253. Factors influencing the impact of the brewing sector on the economy are: Brewing sector internal characteristics Context in which the brewing sector operates • Concentration: 2 players dominate the market • Regional variation in tastes: German speaking
part is oriented towards lager; French speaking cantons prefer special beers
• Beer is taxed, wine and fruit wine are not 34.3 The direct effect of the brewing sector
According to the international statistics of The Brewers of Europe, the Swiss brewing sector employs some 3,000 people in brewing activities, of which about 1,700 are employed by the market leader alone (including jobs in other activities, such as the production of non-alcoho-
251 Source: Schweizer Brauerei-Verband. 252 Source: Schweizer Brauerei-Verband. 253 Source: The Brewers of Europe and Interessengemeinschaft unabhängiger Klein- und Mittelbrauereien

The Contribution made by Beer to the European Economy Switzerland 228
lic beverages). Together these employees realise 114 million euros of value added for the Swiss economy. Another direct effect of the brewing sector on the national economy is tax revenues. Distilled alcohol taxation, at 29 Swiss francs (€ 18.78) per litre of pure alcohol is broadly in line with the EU average254. Wines are exempt from alcohol taxes. Beer has an excise tax of 24.75 Swiss francs per hectolitre (€ 16.03 per hectolitres). In 2004 beer tax revenues amounted to € 68 million255. The VAT revenues from beer sales amount to some 200 million francs (€ 127 million).
0
500
1,000
1,500
2,000
2,500
3,000
3,500
0
0.5
1
1.5
2
2.5
3
3.5
4
Output Of which exports0
50
100
150
200
250
300
350
supplies
value added
millions hl euro (mln.) employment euro (mln.)
0
50
100
150
200
250
300
Direct taxemployees
VAT
Excise
0
500
1,000
1,500
2,000
2,500
3,000
3,500
0
500
1,000
1,500
2,000
2,500
3,000
3,500
0
0.5
1
1.5
2
2.5
3
3.5
4
Output Of which exports0
50
100
150
200
250
300
350
supplies
value added
millions hl euro (mln.) employment euro (mln.)
0
50
100
150
200
250
300
Direct taxemployees
VAT
Excise
34.4 The economic impact of breweries on suppliers of goods and services
According to official statistics, there is no domestic production of brewing malt and only a small production of hops (8 hectares and an output of 48 metric tonnes in 2004256). Swiss brewers import all the malt they use. 77 percent of the hops used in 2004 was imported. In the table below, we assume that no more than 5 percent of the total expenditure on agricultu-ral products remains within Switzerland.
254 Source: www.eav.admin.ch. 255 Source: The Brewers of Europe. 256 Source: The Barth Report 2004/2005

The Contribution made by Beer to the European Economy Switzerland 229
Sectors Stimu-lus
Stimulus for the Swiss economy
Personnel costs257 Labour costs per employee
(mln. €) % (mln. €) % of stimu-lus
(mln. €) (in €)
Number of em-ployees
• Agriculture 25 5% 1 30• Utilities 7 90 6 16 1 74,120 15• Packaging industry 28 65 18 21 4 48,769 80• Equipment +other 4 70 3 21 1 48,769 15• Transport 23 80 19 25 15 45,002 105• Media, marketing 67 75 51 25 13 68,282 185• Services + other 19 75 29 25 7 68,282 105Total 195 530Primary impact as % of total impact 65%Total indirect effect of brewing sector 820
Note: Figures are estimates Indirect employment effects produce another 820 jobs. This is illustrated below:
0 100 200 300 400 500 600 700 800 900
Agriculture
Utilities
Packaging Media, marketing
Transportation
Equipment Services
Indirect employment
0 100 200 300 400 500 600 700 800 900
Agriculture
Utilities
Packaging Media, marketing
Transportation
Equipment Services
Indirect employment
34.5 Retail and hospitality sectors
Beer consumption is strongly linked to on-trade sales in hotels, pubs and restaurants, which have been affected in recent years by the global economic downturn. 34.5% of the beer out-put is packed in casks, 32.0% is bottled in returnable bottles and 22.9% comes in one-way
257 Personnel costs as a percentage of total output of industries and labour costs per employee are obtained from Eurostat data.

The Contribution made by Beer to the European Economy Switzerland 230
bottles. 10.6% of the beer output is sold in cans258. It is estimated that 60% of the beer sold is consumed at home, and the remaining 40% is consumed in the on-trade channel (catering in-dustry).
Hospitality sector
Estimating employment in the hospitality sector attributable to beer takes pub and restaurant beer turnover as a starting point: • Around 40 percent of beer consumption in Switzerland occurs in the hospitality sector. • This means 1.7 million hl are sold by pubs, restaurants and the like. • We estimate the consumer price of beer in a bar at about 7 euros per litre (excl. VAT). 259
Consumers thus spend 1.2 billion euros (excl. VAT) on beer in pubs and restaurants. • The average turnover per employee in the Swiss hospitality sector is approximately
70,000 euros per year. • Total employment in the Swiss hospitality sector arising from beer sales is thus 17,000
employees.
Retail
The importance of the brewing sector for retail is consequently calculated as follows: • About 60 percent of total beer consumption (i.e. 2.6 million hectolitres) is sold through
supermarkets and other retail companies. • With an average consumer price of 1.86 euros per litre, total consumer expenditure on
retail beer is estimated at 475 million euros. • With turnover per employee estimated at 390,800 euros, this means 1,200 people owe
their jobs to the sale of retail beer.
***
258 Source: Schweizer Brauerei-Verband. 259 The prices in this paragraph are estimates of the average prices in the on-trade and off-trade channels. In reality, prices vary considerably, depending on many different factors including the size of the container or glass, the type of establishment and the location.

The Contribution made by Beer to the European Economy Annex I 231
ANNEX I: VALIDATION OF RESULTS - METHODOLOGY & DATA USED
To present the economic impact of the brewing sector, three different effects may be distin-guished: • Direct impact. • Indirect impact. • Induced impact. The direct impact is defined straightforwardly as jobs, value added and tax revenues genera-ted directly by the brewing sector. The indirect impact represents the impact of breweries on their suppliers. For producing beer, breweries need to purchase a highly diverse range of goods and services. To mention just a selection: barley malt, hops and water and many types of packaging material such as glass and aluminium. Breweries also hire engineers, marketers, communications agencies and many more services. The sale of beer by retail outlets and hospitality firms is an important source of economic benefits. The economic contribution of firms in the retail and hospitality sectors arising from the sale of beer is labelled in this study as the brewing sector’s induced impact. The results presented on the economic impact of the brewing sector derive mainly from four data sources: • Data obtained from national associations representing the brewing sector. • Data collected directly from breweries across Europe through a detailed questionnaire. • Input-output tables representing national economies. • Data available through sources such as Eurostat and other national and sectoral statistics. To strengthen the underlying database for this study, Ernst & Young has presented draft country reports on the economic impact of the brewing sector to all national associations representing the brewing sector. These validated reports provide necessary national checks on the European data series used. Individual brewing companies have been another major source of valuable data. More than 20 brewing companies have completed a detailed questionnaire. Important elements of the questionnaire concerned were: • Procurement and purchase management (amounts of money spent on a variety of goods
and services needed to produce beer, and the proportion of purchases made domestically).

The Contribution made by Beer to the European Economy Annex I 232
• Consumer prices on-trade and off-trade and a breakdown of consumer prices in distribu-tion margins for the retail and hospitality sector, VAT and excise duties, value added for the brewing sector and goods and services purchased by the brewing sector.
Returned questionnaires provided good coverage of all European regions.
.. ...... .
.. ..
.
.
. . .. ..
.. Questionnaire from
Important data from
Data available through statisticscollected by national associationrepresenting
... ....
.. ... ..
.
.
. . .. ..
.
.Questionnaire receivedfrom a brewing company
Important data receivedfrom a brewing company
Data on brewing companiesavailable through statisticscollected by national associationsrepresenting the brewing sector
.
.
The final source of data concerns Eurostat statistics and other national and European data se-ries. Eurostat statistics have provided useful data on labour costs, turnover and value added per employee and personal direct taxes paid by employees, generally covering all or most of the countries considered. As a check on estimates made on the brewing sector’s indirect impact, Ernst & Young has al-so used input-output tables representing the impact of the food and beverage sector on other sectors within a national economy. Input-output tables were available for 15 countries.
***

The Contribution made by Beer to the European Economy Annex II 233
ANNEX II: HOW MOST IMPORTANT VARIABLES ARE ESTIMATED
Some of the reported outcomes concerning the economic impact of the brewing sector are ba-sed on estimates by Ernst & Young. Hereafter we illustrate how these variables have been es-timated, focusing on: • Indirect employment due to the production of beer. • Employment due to the sale of beer in the hospitality sector. • Employment due to the sale of beer in shops, supermarkets and other retail outlets. The indirect employment effect concerns the employment generated in supply sectors due to the production of beer. The starting point of the estimates on indirect employment is the im-pulse in supply sectors resulting from purchases made by the brewing sector:
Production valueof brewing sector
Value added ofbrewing sector-
Purchased suppliesby brewing sector=
Sectoral split up ofpurchased supplies(% agriculture, etc.)
Source:*) Eurostat*) Questionnaires breweries Source:
*) Questionnaires breweries
Domestic purchases(% of total purchasesper sector)
Source:*) Questionnaires breweries*) Input Output tables
Domestic impulse persector due to production of beer
Personal costs as %of impulse per sector
Labour costs peremployee(for every sector)
Calculated
Source:*) Eurostat
Source:*) Eurostat
Number of employeesin supply sectors(for every sector, ‘firstround effect’)
CalculatedDomestic impulse per sector * percentage personal costsdivided by labour costs per employee
‘First round effect’ on supply sectors as% of total effect
Number of employeesin supply sectors(for every sector,total impact)
CalculatedIt is estimated on the basis of Input Output tables that firstround effect normally is around 65% of total employment effect
Indirect employmenteffect(summation of impacton all supply sectors)

The Contribution made by Beer to the European Economy Annex II 234
The induced employment effect, resulting in employment due to the sale of beer in the hospi-tality sector and in retail, is estimated as follows:
Percentage of beerconsumed on-trade(pubs etc.)
Total beer consumption(volume)
Beer consumption on-trade(volume)
Average consumerprice per liter on-trade
Total consumer spending on beeron trade(euros)
VAT paid by consumers
-
=Total consumerspending on beerex VAT
Turnover (ex VAT)per employeein hospitality sector
Total employmentin hospitality sectordue to sale of beer
National brewing associations
National brewing associations
Calculated
National brewing associationsand questionnaires breweries
Calculated
European statistics onVAT tariffs
Calculated
Eurostat data
Calculated
Depicted is the way the employment impact on the hospitality sector is estimated. Estimates for retail are made in a similar way.

The Contribution made by Beer to the European Economy Annex III 235
ANNEX III: GLOSSARY
Backward linkage See indirect employment Bottom up approach Analysis of the direct, indirect and induced effects, taking a selec-
tion of brewing companies as a starting point. Brewing sector All the brewing companies that are located within a certain geo-
graphical area. These companies may also be involved in other ac-tivities than brewing beer, such as the production of soft drinks and bottled mineral water.
Direct employment Employment, value added and tax revenues for governments
generated directly by the brewing sector. Europe Austria, Belgium, Bulgaria, Croatia, Cyprus, Czech Republic,
Denmark, Estonia, Finland, France, Germany, Greece, Hungary, Ireland, Italy, Latvia, Lithuania, Luxembourg, Malta, the Nether-lands, Norway, Poland, Portugal, Romania, Slovakia, Slovenia, Spain, Sweden, Switzerland, Turkey and the United Kingdom
Excise A taxation of the production volume, rather than the production
value, of a certain good. In the case of beer it is often related to the amount of alcohol released for consumption.
FTEs Full time equivalents Forward linkage See induced employment Indirect employment Impact of the brewing sector on supplying sectors in terms of em-
ployment or value added. For example: farmers selling hops or barley or manufacturing industry producing bottles, cans, kegs or brewing equipment.
Induced employment Employment at companies that distribute or sell beer, mainly in
the wholesale, retail and hospitality sectors. For example: barten-ders, waitresses and shopkeepers. For this study the induced em-ployment is confined to the retail and hospitality sectors.

The Contribution made by Beer to the European Economy Annex III 236
Input output table A detailed matrix containing data on how much one industry pur-chases from other industries. These tables were used to calculate the purchases of the brewing sector from supplying industries.
Multiplier The multiplier in this study is defined as indirect employment di-
vided by direct employment. Multipliers can also be estimated for induced impact and they can be expressed in terms of employment and in terms of value added.
On-trade Beer sales through (licensed) pubs, clubs, bars, restaurants and the
like. Off-trade Beer sales through shops, supermarkets and other retail outlets. Top down approach Analysis of the direct, indirect and induced effects, taking existing
statistics as a starting point. Value added Difference between the production value and the value of purcha-
sed inputs (goods and services). In economic terminology value added is also defined as the reward for all production factors (mainly labour, capital, entrepreneurship).
VAT Value Added Tax
***