the contributions of insulation to the u.s. economy in 2018 · contributes to the competitiveness...
TRANSCRIPT

The Contributions of
Insulation to the U.S.
Economy in 2018
Economics & Statistics Department
American Chemistry Council
May 2019

Page 1
TABLE OF CONTENTS
EXECUTIVE SUMMARY ............................................................................ 2
THE INSULATION INDUSTRY IN THE U.S. ...................................................... 3
Insulation Materials .............................................................................. 3
ENVIRONMENTAL AND ECONOMIC BENEFITS OF INSULATION PRODUCTS ............... 4
ECONOMIC SNAPSHOT OF THE INSULATION INDUSTRY ..................................... 5
ECONOMIC CONTRIBUTIONS OF THE U.S. INSULATION INDUSTRY ........................ 5
Upstream Economic Impact..................................................................... 7
Downstream Economic Impact ................................................................. 8
CONCLUSION ....................................................................................... 9
APPENDIX – INSULATION JOBS IN THE STATES ............................................... 9
NOTES ON METHODOLOGY AND SOURCES .................................................. 11
DISCLAIMER ....................................................................................... 12
ECONOMICS AND STATISTICS DEPARTMENT ................................................ 12

Page 2
EXECUTIVE SUMMARY
• The use of insulation in U.S. homes and businesses saves energy, putting more money in the
pockets of home and business owners. In addition, by saving energy, the use of insulation
directly reduces greenhouse gas emissions.
• Beyond the benefits of the use of insulation, the insulation industry—including the
manufacture, distribution, and installation of insulation—generates more than 550,000 jobs
in the U.S. and $33 billion in payrolls that support families and local communities around
the country.
• Insulation materials manufacturing is a $16.0 billion business, and directly employs more
than 39,000 people across 45 states.
• Indirectly, through its purchases of supplies, raw materials, equipment, and services,
insulation manufacturing supports an additional 57,400 jobs in supply-chain industries.
Through the household spending of the wages and salaries paid to workers in insulation
manufacturing and their suppliers, an additional 65,000 payroll-induced jobs are supported.
• The combined direct and indirect economic activity from U.S. insulation manufacturing
supports nearly 162,000 jobs. These jobs generate payrolls of $8.7 billion. In addition, the
combined economic activity supported by insulation manufacturing contributes $1.3 billion
to state and local governments and $2.4 billion in federal tax revenues.

Page 3
THE INSULATION INDUSTRY IN THE U.S.
Insulation is installed in homes and businesses around the country to keep hot things hot and cold
things cold. There are various applications of insulation, including:
Residential insulation – attics, walls, floors and crawl spaces, roofs, doors and windows are
insulated to reduce air leaks and increase energy efficiency.
Nonresidential insulation – in commercial and industrial buildings, insulation of roofs and walls
(building envelope) saves on heating and cooling costs.
Appliances – refrigerators, freezers, ovens, dishwashers, and hot water heaters are constructed
with insulation to reduce thermal transfer.
Motor Vehicles – insulation in body panels, roof, floor, trunk, hood, and door panels is used to
dampen noise, heat, and sound.
Equipment/Mechanical – insulating pipes, tanks, and other mechanical systems reduces energy
consumption, promotes employee and public safety, minimizes environmental impacts, and
contributes to the competitiveness of U.S. industry by lowering operating and production costs.
Insulation Materials
Insulation comes in many forms, depending on what is being insulated, where it is located, and other
factors. Insulation is made from a variety of materials, each with a unique set of properties (i.e., R-
value,1 ability to create complex shapes, and ease of installation). The most commonly used materials
in insulation products are (in alphabetical order):
• Cellulose – plant fibers often made from recycled newspapers, paperboard, and paper. The
cellulose source is shredded and mixed with other ingredients to enhance product use and
performance. It is installed as loose fill or mixed with a water to be applied in a spray.
• Fiberglass – a fluffy, wool-like material made from spun fibers of molten glass. The
intertwined fibers of fiberglass insulation can be installed as loose fill or rolled into blankets
or batts. It can also be made into board formed into shapes like pipe insulation.
• Mineral wool – a wool-like material made from spun fibers of molten minerals (including
rock and blast furnace slag). It can be installed as loose fill, pressed into blankets, boards
or batts, or formed into shapes like pipe/equipment insulation.
• Polyisocyanurate (polyiso) foam – a plastic foam made from the combination of several
chemicals reacted to generate a closed-cell, rigid foam. It is often manufactured in boards
1 An insulating material’s resistance to conductive heat flow is measured or rated in terms of its thermal resistance or R-
value -- the higher the R-value, the greater the insulating effectiveness. The R-value depends on the type of insulation, its thickness, and its density. When calculating the R-value of a multilayered installation, add the R-values of the individual layers. Installing more insulation in your home increases the R-value and the resistance to heat flow. (U.S. Department of Energy)

Page 4
with a variety of facing materials or encapsulated in panels or fabricated from large buns
into pipe/equipment insulation.
• Expanded Polystyrene (EPS) Foam - a closed-cell foam plastic, made from an expandable
polystyrene resin using low global warming potential blowing agent pentane. Post-consumer
and post-industrial material can be used to produce recycled content product. EPS is
commonly molded in large blocks which are cut into sheets or shapes to suit various
applications.
• Extruded Polystyrene (XPS) Foam – a cellular plastic product manufactured in a one stage
process by extrusion and expansion of the base polymer in the presence of blowing agent(s)
resulting in a product which is rigid with closed cellular structure, well suited for
compressive strength, moisture resistance and the prevention of mold, mildew and
corrosion.
• Polyurethane foam – a plastic foam generated by a reaction among several chemicals. For
insulation, the chemicals are sprayed on site where the foaming process fills cavities and
gaps. The foam can also be molded into shapes or poured into cavities to insulate appliances
and other equipment.
• Other materials – including phenolic cellular foams, cellular glass, ceramic fiber, needled
glass, elastomeric, polyethylene/polyolefin and granular materials (calcium silicate,
expanded perlite, and flexible aerogel and microporous mineral materials) that are used
predominantly in mechanical insulation applications.
ENVIRONMENTAL AND ECONOMIC BENEFITS OF INSULATION PRODUCTS
The insulation industry is essential to the quest for energy independence because its products help
reduce energy consumption and energy-related greenhouse gas emissions. By lowering energy
consumption, and thus energy bills, insulation helps make businesses more competitive and gives
households more spending power. In addition, insulation reduces intrusion of outside noise, pollen and
insects, allows for better humidity control, lowers the chance for ice dams in snowy climates, and
promotes employee and public safety. While these benefits are enormous, they are difficult to
quantify. The savings from insulation accrue to individual projects and businesses and depend on
climate and the R-value (or resistance to conductive heat flow) which makes it difficult to aggregate
across the economy. Some of the estimated benefits of insulation include:
The U.S. Environmental Protection Agency’s (EPA) Energy Star program estimates that by adding
insulation and sealing air leaks, the average household could save 15% on heating and cooling
costs.2
In a 2009 analysis by McKinsey that examined multiple chemistry-enabled technologies to
reduce emissions,3 the authors concluded “insulation alone accounted for 40% of the total
identified CO2 savings.”
2 https://www.energystar.gov/index.cfm?c=home_sealing.hm_improvement_methodology 3 McKinsey, “Innovations for Greenhouse Gas Reductions: A life cycle quantification of carbon abatement solutions enabled by the chemical industry.” July 2009.

Page 5
According to the Department of Energy, “Space heating and cooling account for almost half of
a home's energy use, while water heating accounts for 18%, making these some of the largest
energy expenses in any home.”4
The heating and cooling of commercial buildings, e.g., office, retail, educational, health-care
buildings and lodging, accounts for nearly 10% of all energy consumed in the U.S. 5
According to the Business of Council for Sustainable Energy, U.S. energy productivity grew 14%
between 2009 and 2018.6 The use of insulation products across the economy is a key
contribution to energy productivity growth.
In 2009 The National Insulation Association (NIA) in collaboration with the Department of
Energy’s Industrial Technologies Program and Oak Ridge National Laboratory (ORNL)
documented benefits of mechanical insulation in the industrial maintenance market and
examined the difference a modest increase in insulation would make in the industrial and
commercial building industries and estimated $4.8 billion in energy savings, a reduction of 43
million metric tons of CO2 emissions was possible. 7
In addition to creating economic and environmental benefits through its use, the manufacture,
distribution, and installation of insulation also generates economic activity and supports jobs in the
U.S.
ECONOMIC SNAPSHOT OF THE INSULATION INDUSTRY
Table 1 – Economic Snapshot of the Insulation Industry (2018)
Employment Payroll ($ billion)
Insulation Manufacturing 39,224 $2.2
Distribution/Wholesale 47,108 $3.1
Installation 467,784 $27.7
Total 554,115 $33.0
ECONOMIC CONTRIBUTIONS OF THE U.S. INSULATION INDUSTRY
The insulation manufacturing industry takes raw materials such as glass, rock, slag, isocyanates, polyols, recycled paper and other products and converts these materials into energy-saving insulation products. This analysis examines seven basic classes of insulation materials: polystyrene, polyurethane,
4 https://energy.gov/energysaver/heat-and-cool 5 http://aceee.org/sector/commercial 6 https://www.bcse.org/factbook/ 7 http://www.insulation.org/io/articles/mechanical-insulation-can-save-4-8-billion-in-energy-costs-and-43-million-metric-tons-of-co2-emissions-and-create-89000-green-jobs-per-year/
Page 6
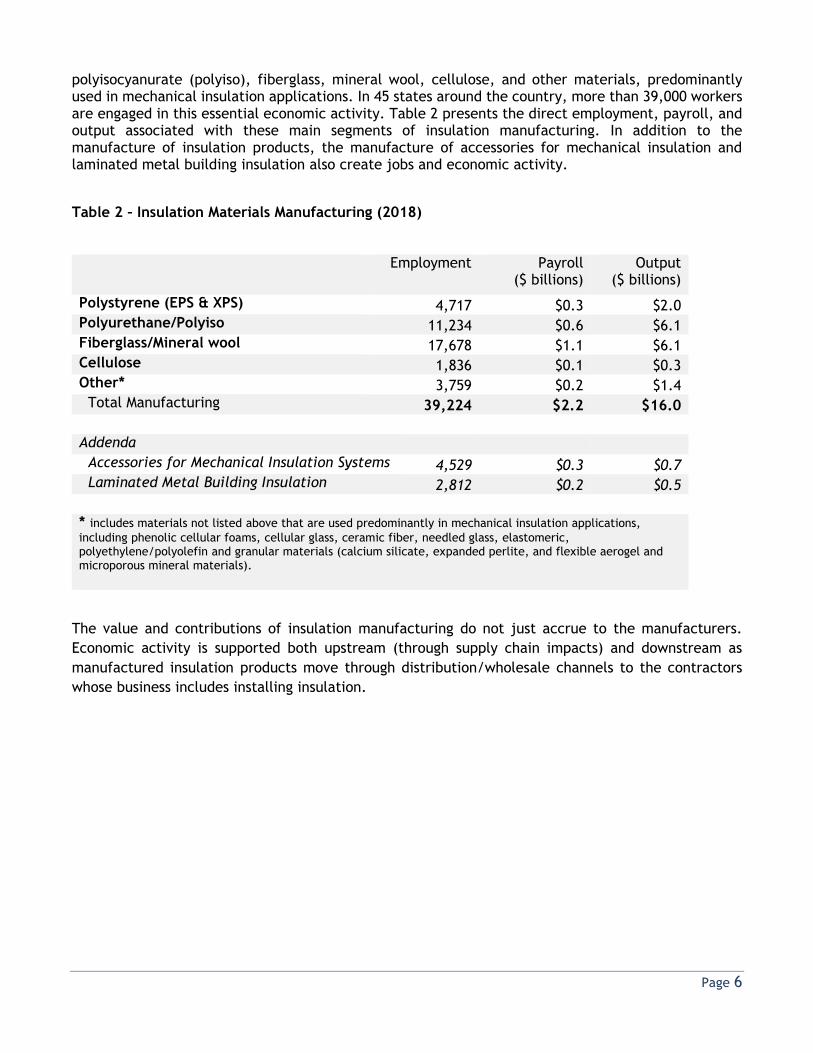
polyisocyanurate (polyiso), fiberglass, mineral wool, cellulose, and other materials, predominantly used in mechanical insulation applications. In 45 states around the country, more than 39,000 workers are engaged in this essential economic activity. Table 2 presents the direct employment, payroll, and output associated with these main segments of insulation manufacturing. In addition to the manufacture of insulation products, the manufacture of accessories for mechanical insulation and laminated metal building insulation also create jobs and economic activity.
Table 2 – Insulation Materials Manufacturing (2018)
Employment Payroll ($ billions)
Output ($ billions)
Polystyrene (EPS & XPS) 4,717 $0.3 $2.0 Polyurethane/Polyiso 11,234 $0.6 $6.1 Fiberglass/Mineral wool 17,678 $1.1 $6.1 Cellulose 1,836 $0.1 $0.3 Other* 3,759 $0.2 $1.4 Total Manufacturing 39,224 $2.2 $16.0 Addenda Accessories for Mechanical Insulation Systems 4,529 $0.3 $0.7 Laminated Metal Building Insulation 2,812 $0.2 $0.5 * includes materials not listed above that are used predominantly in mechanical insulation applications,
including phenolic cellular foams, cellular glass, ceramic fiber, needled glass, elastomeric, polyethylene/polyolefin and granular materials (calcium silicate, expanded perlite, and flexible aerogel and microporous mineral materials).
The value and contributions of insulation manufacturing do not just accrue to the manufacturers.
Economic activity is supported both upstream (through supply chain impacts) and downstream as
manufactured insulation products move through distribution/wholesale channels to the contractors
whose business includes installing insulation.

Page 7
Upstream Economic Impact
The economic contributions of the insulation manufacturing were analyzed using an economic input-
output model, IMPLAN.8 This method estimates the total contributions of an industry to the economy
at the state and national levels for a given year. The economic contributions analyzed in this report
are employment, payroll and output in the U.S. for the year 2018.
The manufacture of insulation products directly generates $16.0 billion in industry shipments and
directly employs more than 39,200 workers across 45 states. Insulation manufacturers purchase goods
and services from their suppliers and their suppliers do the same. The economic impact generated by
the insulation supply chain supports an additional 57,000 indirect jobs. Finally, the wages paid by
insulation manufacturers and their suppliers support more than 65,000 payroll-induced jobs, jobs
supported by the household spending of workers in the direct and indirect (supply-chain) segments.
Thus, the economic activity from U.S. insulation manufacturing supports nearly 162,000 jobs which
generate payrolls of $8.7 billion.
In addition, the combined economic activity supported by insulation manufacturing contributes $1.3
billion to state and local governments and $2.4 billion in federal tax revenues.
8 IMPLAN (IMpact analysis for PLANning) is a complete economic assessment package providing economic resolution from the National level down to the zip code level; MIG Inc. is the sole licensor of IMPLAN.
Direct Impacts• Employment, wages and output of the industry being
analyzed; in this case, the manufacture of insulation materials.
Indirect Impacts
• Jobs, wages and output created by the supply-chain businesses that provide goods and services essential to the industry.
• These businesses range from suppliers of raw materials, supplies, utilities, equipment, transportation, and other services.
Induced Impacts
• The result of the spending of wages and salaries of the direct and indirect employees on items such as food, housing, education, transportation and medical services.
• This spending creates induced employment in nearly all sectors of the economy, especially service sectors.
Page 8
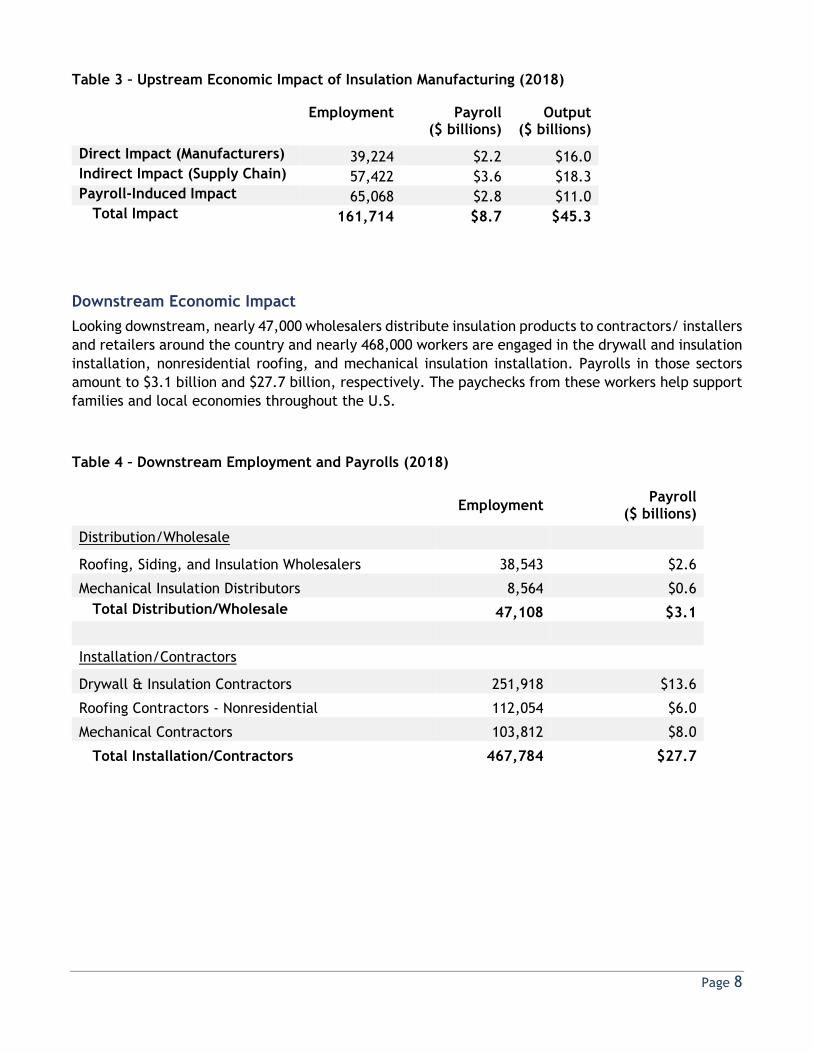
Table 3 – Upstream Economic Impact of Insulation Manufacturing (2018)
Employment Payroll ($ billions)
Output ($ billions)
Direct Impact (Manufacturers) 39,224 $2.2 $16.0 Indirect Impact (Supply Chain) 57,422 $3.6 $18.3 Payroll-Induced Impact 65,068 $2.8 $11.0 Total Impact 161,714 $8.7 $45.3
Downstream Economic Impact
Looking downstream, nearly 47,000 wholesalers distribute insulation products to contractors/ installers
and retailers around the country and nearly 468,000 workers are engaged in the drywall and insulation
installation, nonresidential roofing, and mechanical insulation installation. Payrolls in those sectors
amount to $3.1 billion and $27.7 billion, respectively. The paychecks from these workers help support
families and local economies throughout the U.S.
Table 4 – Downstream Employment and Payrolls (2018)
Employment Payroll
($ billions)
Distribution/Wholesale
Roofing, Siding, and Insulation Wholesalers 38,543 $2.6
Mechanical Insulation Distributors 8,564 $0.6
Total Distribution/Wholesale 47,108 $3.1
Installation/Contractors
Drywall & Insulation Contractors 251,918 $13.6
Roofing Contractors - Nonresidential 112,054 $6.0
Mechanical Contractors 103,812 $8.0
Total Installation/Contractors 467,784 $27.7

Page 9
CONCLUSION
The insulation industry, including manufacturers, distributors, and installers, makes vital contributions
to the U.S. economy. The products that they make, distribute, and install conserve precious energy
resources, saving money for households and businesses. The use of insulation also has large
environmental benefits as reduced energy consumption translates directly into lower emissions of
greenhouse gases. In addition, through supply chain and payroll-induced impacts, the economic activity
generated by American insulation manufacturing is broad and helps support local economies across the
U.S. Moving through the economy, there are huge contributions in terms of jobs and payrolls generated
by those businesses that distribute insulation products from manufacturers to where they will be
installed. Finally, hundreds of thousands of workers make a living installing insulation in homes and
businesses around the U.S.
APPENDIX – INSULATION JOBS IN THE STATES
Insulation manufacturing occurs in 45 states while distribution/wholesale and installation activities
occur across all 50 states. Appendix Table 1 presents the top 10 states in each of the three main
segments. Appendix Table 2 presents employment by segment for all states.
Appendix Table 1 – Top 10 States for Insulation Employment by Industry Segment (2018)
Manufacturing Distribution/Wholesale Installation/Contractors
Ohio 4,965 Texas 4,374 California 65,998
Georgia 3,547 Florida 3,702 Texas 44,412
Texas 3,364 California 2,739 Florida 32,740
California 2,364 New York 2,343 New York 27,433
Indiana 2,101 Illinois 2,201 Washington 15,926
Pennsylvania 2,075 Virginia 2,147 Illinois 15,896
Illinois 1,652 Pennsylvania 2,111 Ohio 14,747
Florida 1,586 North Carolina 1,826 Pennsylvania 14,171
Wisconsin 1,216 Wisconsin 1,793 North Carolina 12,215
Kentucky 1,198 Georgia 1,764 Georgia 11,887
Other States 15,155 Other States 22,107 Other States 212,358
Total 39,422 Total
47,108 Total 467,784
Top 10 as % of Total 61% Top 10 as % of Total 53% Top 10 as % of Total 55%

Page 10
Appendix Table 2 – Insulation Employment by Industry Segment (2018)
Manufacturing Distribution/ Wholesaler
Installation/ Contractors
Manufacturing
Distribution/ Wholesaler
Installation/ Contractors
Alabama 584 336 4,693 Montana 50 272 1,330
Alaska 68 39 619 Nebraska 226 339 3,225
Arizona 885 559 11,672 Nevada 567 207 7,406
Arkansas 106 315 3,492 New Hampshire - 184 2,029
California 2,364 2,739 65,998 New Jersey 436 1,456 8,594
Colorado 486 1,355 11,179 New Mexico 118 92 2,738
Connecticut 379 593 4,177 New York 903 2,343 27,433
Delaware - 253 1,432 North Carolina 1,135 1,826 12,215
Dist. of Columbia - - 788
North Dakota
18 95 915
Florida 1,586 3,702 32,740 Ohio 4,965 1,540 14,747
Georgia 3,547 1,764 11,887 Oklahoma 600 473 4,622
Hawaii 50 168 2,052 Oregon 159 362 7,556
Idaho 251 178 2,482 Pennsylvania 2,075 2,111 14,171
Illinois 1,652 2,201 15,896 Rhode Island - 92 1,585
Indiana 2,101 1,195 10,016 South Carolina 702 741 5,350
Iowa 221 910 5,579 South Dakota 60 130 1,250
Kansas 1,006 486 4,250 Tennessee 429 1,210 8,092
Kentucky 1,198 762 5,845 Texas 3,364 4,374 44,412
Louisiana 236 437 4,926 Utah 1,064 486 6,745
Maine 38 34 2,227 Vermont - 55 878
Maryland 100 669 10,806 Virginia 336 2,147 10,802
Massachusetts 297 1,091 11,630 Washington 486 701 15,926
Michigan 951 1,148 10,797 West Virginia 845 110 1,365
Minnesota 151 1,201 8,544 Wisconsin 1,216 1,793 8,445
Mississippi 633 345 2,798 Wyoming - 63 869
Missouri 579 1,428 8,563 U.S. 39,224 47,108 467,784

Page 11
NOTES ON METHODOLOGY AND SOURCES
Data on direct employment and payrolls are based on data from the Bureau of Labor Statistics (Covered
Employment and Wages program). In addition, for insulation manufacturing, employment estimates
were also based on results from a January 2017 survey of insulation manufacturers. Survey results for
some segments were updated in February 2019. Payrolls were estimated using average annual pay for
industries and states multiplied by the employment estimates.
For insulation manufacturing, where data on shipments was estimated as a portion of a larger NAICS
code, employment was estimated using output-to-employment ratios for that particular NAICS code
supplemented with data from the survey of insulation manufactures. Employment data on mechanical
insulation manufacturers was provided by the National Insulation Association (NIA). Payrolls for each
segment were estimated by multiplying employment by the average annual wage for that industry.
With the exception of fiberglass/mineral wool insulation manufacturing, insulation made from other
materials falls within broader NAICS codes and is not easily pulled out of existing government data. As
a result, data on shipments/output of manufactured insulation products was derived from multiple
sources, including the Census Bureau, IHS Chemical, the Center for the Polyurethanes Industry,
Polyisocyanurate Insulation Manufacturers Association (PIMA), Cellulosic Insulation Manufacturers
Association (CIMA), EPS Industry Alliance, Extruded Polystyrene Foam Association and NIA.
Data on employment and payroll for distributors/wholesalers is based on NAICS 42333 (Roofing, Siding,
and Insulation Wholesalers). In addition, data for distributors of mechanical insulation were provided
by the NIA.
Data on employment and payroll for installers and contractors is based on the following NAICS codes
in addition to data from NIA on mechanical insulation installers:
NAICS 23831 – Drywall & insulation contractors (residential & nonresidential)
NAICS 238162 – Nonresidential roofing contractors
It was determined that these NAICS classifications represent a large share of the insulation installation
segment. Drywall installation is included in NAICS 238311 and 238312. While no data exists to separate
insulation contractors from drywall contractors, it is likely that a majority of these contractors are
engaged in both lines of business. In addition, it should be noted that insulation is also installed by
self-employed handymen and homeowners that are not included in industry employment data. Because
roofs are a significant source of energy losses in commercial buildings, most roofing contractors are
also engaged in insulation installment as part of a commercial roofing project. Though likely
significant, installers of insulation in appliances, industrial equipment, mechanical systems,
transportation equipment, etc. are not included due to a lack of data.

Page 12
DISCLAIMER
The American Chemistry Council (ACC) has made reasonable effort to ensure the information contained in this report is complete and accurate. However, ACC expressly disclaims any warranty or guaranty, whether express or implied, associated with this reference book or any of the data contained herein.
This report and the information contained herein are owned and protected by the ACC. Data published
in this book are based on various sources as well as ACC estimates. ACC disclaims any liability
associated with the accuracy or completeness of the information presented, or its suitability for any
particular use. Users of this reference book are solely responsible for any consequences, including any
liability that arises from such use.
©2019 American Chemistry Council, Inc.
ECONOMICS AND STATISTICS DEPARTMENT
The Economics & Statistics Department provides a full range of statistical and economic advice and
services for ACC and its members and other partners. The group works to improve overall ACC advocacy
impact by providing statistics on American Chemistry as well as preparing information about the
economic value and contributions of American Chemistry to our economy and society. They function
as an in-house consultant, providing survey, economic analysis and other statistical expertise, as well
as monitoring business conditions and changing industry dynamics. The group also offers extensive
industry knowledge, a network of leading academic organizations and think tanks, and a dedication to
making analysis relevant and comprehensible to a wide audience. The primary author of this report is
Martha Gilchrist Moore.
Dr. Thomas Kevin Swift
Chief Economist and Managing Director
202.249.6180
Martha Gilchrist Moore
Senior Director – Policy Analysis and Economics
202.249.6182
Heather R. Rose-Glowacki
Director, Chemical & Industry Dynamics
202.249.6184
Emily Sanchez
Director, Surveys & Statistics
202.249.6183