the convergence computing model for big sensor data · pdf fileaccumulation of the results of...
TRANSCRIPT

The convergence computing model for big sensor data mining and knowledge discoveryAlexey G. Finogeev2*, Danila S. Parygin1 and Anton A. Finogeev2
BackgroundSensor data is one of the big data, and its intelligent management and utilization have necessarily required. The ubiquitous introduction of automated process control systems highlights the need to collect and process a large volume of telemetry (sensor) data from a multitude of sensors, which are located at the monitoring objects [1, 2]. This data is essential for the analysis/forecasting the condition and functioning objects, processes and technogenic and natural events [3, 4]. The efficiency and quality of administrative
Abstract
The article considers the model and method of converged computing and storage to create SCADA systems based on wireless networks for the energy industry. Comput-ing power of modern wireless sensor network nodes allow the transfer to them some operations sensor data mining and offload the dispatching data centre servers. This fog computing model is used for the aggregation of primary data, forecast trends controlled variables as well as to warn about abnormal and emergency situations on distributed SCADA systems objects. Large arrays of sensor data, integral indicators and heterogeneous information from other sources (e.g., weather stations, security and fire alarm systems, video surveillance systems, etc.) is more appropriate to process via GRID computing model. GRID computing model has three-tier architecture, which includes the main server at the first level, a cluster of servers at the second level, and a lot of GPU video card with support for Compute Unified Device Architecture at the third level. The model of cloud computing and cloud storage today is the basis for the accumulation of the results of data mining and knowledge discovery. Means of com-munication and remote access can solve the problem of intellectual processing and visualization of information with elements of augmented reality and geo-information technologies within the framework of mobile computing model. The implementation of these four computing models for the operation of components of SCADA system is the convergent approach to distributed sensor data processing, which is discussed in the article.
Keywords: Convergence computing, Wireless sensor network, Fog computing, GRID, Cloud computing, Cloud storage, Mobile computing, Data mining, Knowledge discovery
Open Access
© The Author(s) 2017. This article is distributed under the terms of the Creative Commons Attribution 4.0 International License (http://creativecommons.org/licenses/by/4.0/), which permits unrestricted use, distribution, and reproduction in any medium, provided you give appropriate credit to the original author(s) and the source, provide a link to the Creative Commons license, and indicate if changes were made.
RESEARCH
Finogeev et al. Hum. Cent. Comput. Inf. Sci. (2017) 7:11 DOI 10.1186/s13673-017-0092-7
*Correspondence: [email protected] 2 CAD-Department, Penza State University, 40, Krasnay St, Penza 440025, RussiaFull list of author information is available at the end of the article

Page 2 of 16Finogeev et al. Hum. Cent. Comput. Inf. Sci. (2017) 7:11
decisions depend upon the following factors: timeliness obtain information about con-trolled objects and processes; completeness and objectivity of the analysis (processing) of this information; clarity of presentation processing results for decision support sys-tems [5]. However, these problems are not adequately reflected in the existing papers. Therefore, the aim of the article is an attempt to eliminate this disadvantage.
The problems of intellectual big sensor data processingCurrently, there is great scientific and practical interest in respect of wireless sensor networks development and use [6, 7]. Of particular importance is their application for remote monitoring of various objects and processes in natural, technical, environmen-tal, medical, military and other systems [8, 9]. The tendency to displace wired networks to wireless telecommunications for monitoring spatially distributed objects is observed [10, 11]. Engineering network energy, heat, water and gas, oil and gas pipelines, telecom-munication networks are such objects. In the engineering networks with many facilities, located in the vast territories it is not always possible to implement a full-scale collec-tion and transmission of data in a single dispatching center for real-time processing [12]. Therefore actual problem of the synthesis and study of the model of collecting informa-tion based on the method of distributed computing, realized directly to the end-points of data collection. This opportunity came in connection with the spread of wireless sen-sor network technology in recent years. Units WSN have sufficient processing power and memory to download software agents capable of solving the problem of data pro-cessing and aggregation.
The convergence of the distributed computing models is proposed to solve the tasks of collecting, processing and integration of big sensor data in the monitoring of distributed objects and processes. This approach includes: GRID convergence models, cloud, fog and mobile computing [13, 14]; association of computing clusters (grid, cloud and fog) in a single system; integration server application business logic, operating platforms, data warehouses; unification of administrative mechanism computing medium, information security on all data processing and storage levels.
A number of research groups doing research in the field of fog and cloud comput-ing and has the results in terms of practical application [15–17]. For example, at the University of Southampton (United States) to the project FloodNet intelligent sensor network, providing flood forecasting and warning c WiseNet using cloud computing platform are developed. Another project (GlacsWeb) devoted to the development of the cloud environment glacier monitoring system to forecast the behavior and movement of glaciers. Intel is engaged in the construction and implementation of hybrid cloud com-puting models. It provides: energy efficiency and the optimization of human resources; easy to create a cloud computing; safety information to reduce risk. IBM Company, Google, Toshiba, Cisco, Microsoft offer solutions for analytical processing of Big Data using cloud computing models. Solutions are used to [18–20]: support for the energy sector, health care; create a secure data storage services, support ubiquitous Internet technology; inter-machine communications, fog computing. One of the research areas at Toshiba and Cisco infrastructure is the synthesis of distributed data processing obtained from a plurality of distributed sensors—based on the architecture of fog computing for the interaction of smart Internet of Things [21]. Joint development assumes association

Page 3 of 16Finogeev et al. Hum. Cent. Comput. Inf. Sci. (2017) 7:11
infrastructure Cisco fog computing network with Toshiba Group technologies [22] to control points on the network, tracking and maintenance of geographically dispersed multi-function devices.
The objectives of energy monitoring and distributed big sensor data processingThe energy management—a power management system that allows to forecast and con-trol the processes of production, transportation and use of energy to ensure that the needs of the population and industrial enterprises [23]. The aim is to achieve cost-effec-tiveness in terms of optimization of the costs of production and transportation of energy to the end user; energy security for the prevention of risks associated with the use of automated process control systems of energy supply and energy consumption. Infra-structure distributed utilities and energy services in the cities and selected areas related to critical and potentially dangerous objects. Stopping power for the enterprises, build-ings, hospitals, schools, kindergartens can lead to serious losses; social consequences; reduced level of safety of life of the population; the emergence of threats to the lives of citizens, etc. The energy management is based on the monitoring of facilities and utili-ties situations forecast of economic, resource and price trends.
The energy monitoring term is used to describe the processes of monitoring and data collection with a spatially distributed objects in the field of production, transport, dis-tribution, consumption and utilization of energy resources (gas, water, electricity and heat). The aim of monitoring is measuring and recording technological parameters for the assessment and forecasting of energy production and consumption. An important task are also the identification, analysis and assessment of natural, technogenic and anthropogenic factors that affect or could potentially affect at the objects and processes. The system provides detection of emergency and emergency situations; warning person-nel of power supply companies and energy consumers; risk management. The purpose of the automated energy monitoring system with a converged computing model are to improve the energy efficiency of enterprises, reduction of energy losses, optimization of energy consumption.
The energy monitoring objects are engineering communication networks. These include a internal and external power supply network of buildings; lighting network of urban infrastructure; internal and external heat network; water supply and sewage net-works; gas supply network; oil transportation network; engineering ventilation and air conditioning of buildings.
Automated monitoring system should provide the following tasks:
1. The collection, processing, analysis, storage and transmission of information on the location, state parameters of distributed objects and technological processes of gen-eration, transportation, consumption and waste of energy, the occurrence of abnor-mal and emergencies, etc.
2. Support for activities to ensure security engineering services, technological pro-cesses of generation, transportation, energy consumption and utilization, prevention and containment of crises, liquidation of consequences.

Page 4 of 16Finogeev et al. Hum. Cent. Comput. Inf. Sci. (2017) 7:11
3. Synthesis and analysis of forecast models for the integrated assessment of freelance, emergency and crisis situations in relation to the monitoring of distributed objects and processes.
4. Forecasts of threats to the population, utilities, facilities and technological processes of generation, transportation, energy consumption and utilization, depending on changes in the state of their security under the influence of natural, technological and anthropogenic factors.
5. Scenario analysis and evaluation of different situations at the monitoring objects.6. Maintain operational databases, cloud storage and data marts for the storage and
maintenance of the potential availability of sensor data, and aggregates the results of monitoring, the synthesis variants of administrative decisions on the protection of objects, subjects and processes.
7. Provision of information resources for the administration, protection of resources against unauthorized access and information threats.
8. Formation of a heterogeneous transport environment, and a single information space of monitoring systems based on standardization and compatibility of information, software and hardware.
9. Information support of agreements in the process of engineering communications monitoring, processes of generation, transportation, energy consumption and utili-zation.
The result is the development and implementation of measures aimed at ensuring optimal and trouble-free operation of engineering services networks in urban energy systems. Activities provided by: improving the efficiency of control services; implemen-tation of energy saving when consumed of energy resources; minimization of energy losses; optimization of energy consumption; implementation of data collection and pro-cessing technologies; prevention of emergency situations; rapid response to the situation and the disaster; maintenance and repair works in the engineering systems; optimization of settlements between suppliers and customers, etc.
Models and methods of convergent distributed computingToday cloud services ensure an efficient use of applications by limiting capital invest-ments and reducing the cost of ownership of corporate information systems. Four mod-els of distributed computing can be distinguished: GRID computing; cloud computing; fog computing, mobile computing. GRID calculations are based on the architecture of computer networks of the individual compute nodes. Computing process provides for a distribution (including dynamic) separate parts for task to currently free network com-puting resources. This approach is used for tasks too complex for a single node.
Cloud computing—is not only the allocation of tasks on the network nodes of comput-ing resources. This model is used for the ubiquitous network access to a common pool of configurable resources (software, server, information, platform, etc.) at any time [24]. The user uses the technology of “thin” client as a means of access to applications, plat-forms and data, and the entire infrastructure of the information system is located at the provider of cloud services.

Page 5 of 16Finogeev et al. Hum. Cent. Comput. Inf. Sci. (2017) 7:11
Fog computing—is the virtual platform of distributed computing and data storage ser-vices on end-terminal devices and network services for data transmission, storage and processing [25]. Computation are performed terminal devices with limited computing and energy resources—including controllers, industrial equipment, household appli-ances with microprocessors equipment, sensor network nodes.
The reasons for the development of a converged model of distributed computing are existing problems in the plan of information processes:
1. The information’s opacity, which is associated with the closed data formats of infor-mation systems from various developers. This is unacceptable for enterprises, servic-ing critical and potentially dangerous objects.
2. Mismatch of data and protocols that is associated with use of the manufacturers pro-prietary systems for collecting and telemetry data processing.
3. Duplication and synchronization information. Similar data necessary for solving var-ious tasks are duplicated in different databases in its own storage formats. This leads to the need for synchronization and verification.
4. Mismatch of data streams, associated with the use of different network technologies and telecommunications solutions.
5. Qualitative data accounting to monitor energy supply. The problem occurs because of differences in the departmental affiliation electricity enterprises, heat, water and gas. To solve the problems the cloud storage and fog computing technologies are used. The problem of duplication and dissynchronization data in the database of the different services is achieved by using a single data store. Fog computing technology allows to perform data processing in terms of their cleaning and bringing to a com-mon format. This will solve the problem of mismatch of data and protocols. Cloud computing technology will help in solving the problem of opacity data in automated systems of different organizations.
Wireless sensor network as fog computing platformFirst level convergent computing model is expedient to implement a fog computing plat-form through the software agents that are integrated into the wireless sensor network units and/or industrial controllers.
To implement the platform are encouraged to use WSN, based ZigBee technology [26]. Censor node has a microcontroller with preloaded operating system, flash mem-ory, interface with sensors and devices, the radio interface for data transmission. Sen-sor nodes from the NXP company have a radio interface 802.15.4 standard, software and operating system JenOS. OS uses the IP protocol at the network layer on top of the 802.15.4 protocol that allows access to the sensor network nodes upon request, trans-mitted through the IP-packets with the IP addressing via TCP-port.
The wireless sensor network is ideal for the implementation of a fog computing platform. The sensor network is an infrastructure comprised of sensing (measuring), computing, and communication elements that gives an administrator the ability to instrument, observe, and react to events and phenomena in a specified environment. An example of a fragment of a wireless sensor network, which was developed for the

Page 6 of 16Finogeev et al. Hum. Cent. Comput. Inf. Sci. (2017) 7:11
implementation of the model of cloud computing in the SCADA system of urban heat-ing, shown in Fig. 1.
There are four basic components in a sensor network:
1. An assembly of distributed or localized sensors.2. An interconnecting network (usually, but not always, wireless-based).3. A central point of information clustering.4. A set of computing resources at the central point (or beyond) to handle data correla-
tion, event trending, status querying, and data mining. Terminal nodes distributed along the periphery of the network and information processing are performed in real time during data collection. According to the model of fog computing sensor nodes are not only used to collect data from sensors and automation devices, but also for their structuring, aggregation, encryption and transmission to the control center. Fog processing is to calculate the aggregated energy indicators directly to the network nodes. Indications are forwarded for integration to the next level model of the data collection/processing. The ultimate goal of is to extract information and intelligent analysis in clusters of virtualized GRID system.
Telecommunication environment for uniting sensor nodes, distributed over a large area, leading to the risk of information security. Note, in particular, the threat of indus-trial viruses and trojans. It can be remotely loaded on controllers and sensor nodes WSN; migrate to industrial networks; perform certain destructive actions. Virus pro-gram is a software agent that changes the functionality of the devices and makes it fulfill not inherent function. A similar approach is used to create intelligent software agents that are loaded on remote terminal devices and solve data storage problems, calculate aggregated indicators, convolution, etc. Computing power sensor nodes and control-lers based on programmable logic integrated circuits (FPGAs), operating system and
Fig. 1 A sensor network cluster (fog computing) at the energy (heating) station

Page 7 of 16Finogeev et al. Hum. Cent. Comput. Inf. Sci. (2017) 7:11
firmware software can significantly extend the functionality of nodes to perform quite complicated procedures for transformation and analytical sensor data processing.
Transferring operations at the sensor nodes are associated with the primary sensor data processing, provides positive effects:
1. Utilization of low-speed channels in sensor networks is reduced. Not all data is transmitted, but only aggregated indicators for time intervals for loading into the data store.
2. The autonomy of the network is increased by reducing the number of transmissions and traffic that requires energy consumption.
3. The load on the server applications is reduced.4. Queues on the data processing computer cluster are reduced. Some of the functions
is implemented directly on the sensor network nodes.5. The amount of data in a central repository is decreased.6. The sensor data are processed in real time.7. Sensor monitoring is carried out directly on the terminal nodes.
Hyper graph model fog big sensor data processingConverged computing system can be represented as a hyper graph model with two sub-sets of vertices and edges; an expanded set of features
There subset of vertices V id{x,y}
describes the network nodes with weight (id) attributes, characterizing features controllers and the spatially distributed nodes coordinates {x,y}; a subset of vertices Vpa
κ identifies software agents with attributes (pa), characterizing parameters of the modules, and attributes that define computational functions; Uid
const constant incidence describes the data channels with weighting (id) attributes; subset of hyper edges Uvar variable incidence describes the virtual routes for migration download-able software agents on hosts and controllers; «P»—binary predicate that determines the incidence of vertices and hyper edges. In graphical form clustered sensor network frag-ment shown in Fig. 2.
In this figure, the vertices V1(id,(x,y)) to V7(id,(x,y)) denote sensor nodes; V1(pa,k), V2(pa,k)—the software agents; hyper edges U1(id,const), U8(id,const) displayed constant data channels in the sensor segment tree architecture; U1(var), U4(var)—dynamic virtual software agents migration routes. In the case of a cellular sensor network architecture, when there are several possible data transmission routes hyper edges Ui(id,const) are classic, and include a set of vertices Vi(id,(x,y)).
A subset of vertices V id{x,y}
defines the different types of devices—including processors sensor nodes and the controllers control equipment, accounting and control of energy resources, as well as different operating platforms and software firmware. Therefore, in this subset are allocated clusters of similar vertices, grouped by the processing power and platforms. It allow to download a certain class of agents, which is a subset vertices Vpa also divided into clusters. Hyper edges constant incidence Uconst (a1,…, an), where n = const, are divided into clusters, combining the particular segments of the network
G = (V (V id{x,y},V
paκ ), U(Uid
const ,Uvar),P).

Page 8 of 16Finogeev et al. Hum. Cent. Comput. Inf. Sci. (2017) 7:11
technology. Hyper edges Uvar combine a subset vertices, modeling software agents, with a subset vertices, modeling specific types of controllers and sensor nodes, in which they are loaded to perform computing tasks.
Features hyper graph model: a set hyper edges Uvar (b1,…,bm) are dynamically changed in real time; vertices have geospatial tagging; model allows to perform a space–time analysis of the software agents migration.
The relational model is used for the semantic description of convergent system of dis-tributed computing. Hyper graph vertex corresponds to the static entry with attributes object monitoring and data processing unit. Hyper edge Uconst corresponds static entry and hyper edge Uvar—dynamically changing record.
Let the sensor data are collected and processed on i node of the sensor network, and software agent migrates through the j virtual route to the energy costs of its transfer qi within the specified time interval. Each node has a reserve of ei energy for battery life, and spends energy ej data processing j software agent. Battery life time of the sensor node may be defined as:
where N—the number of agents migration routes, M—the number of data processing nodes. Total battery life time of the sensor segment:
The system architecture of convergent big sensor data processing1. The system architecture, implementing a converged model of distributed comput-
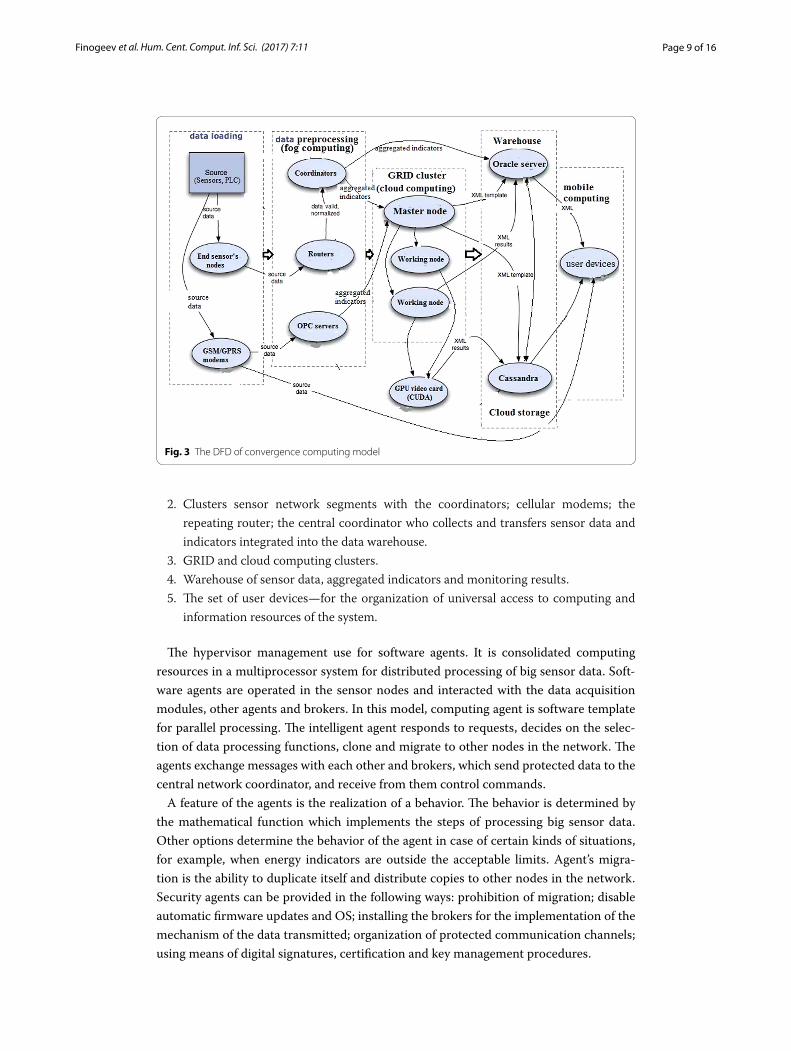
ing, may include five hardware and software levels (Fig. 3): the set of sensor nodes, that are associated with industrial controllers and sensors, directly implementing fog computing.
ti = ei/
(
∑
i∈N(qi) ∗
∑
j∈M(ej)
)
,
T =∑
i∈N(ti(qi)).
Fig. 2 Hyper graph representation the model of fog computing (fragment)
Page 9 of 16Finogeev et al. Hum. Cent. Comput. Inf. Sci. (2017) 7:11
2. Clusters sensor network segments with the coordinators; cellular modems; the repeating router; the central coordinator who collects and transfers sensor data and indicators integrated into the data warehouse.
3. GRID and cloud computing clusters.4. Warehouse of sensor data, aggregated indicators and monitoring results.5. The set of user devices—for the organization of universal access to computing and
information resources of the system.
The hypervisor management use for software agents. It is consolidated computing resources in a multiprocessor system for distributed processing of big sensor data. Soft-ware agents are operated in the sensor nodes and interacted with the data acquisition modules, other agents and brokers. In this model, computing agent is software template for parallel processing. The intelligent agent responds to requests, decides on the selec-tion of data processing functions, clone and migrate to other nodes in the network. The agents exchange messages with each other and brokers, which send protected data to the central network coordinator, and receive from them control commands.
A feature of the agents is the realization of a behavior. The behavior is determined by the mathematical function which implements the steps of processing big sensor data. Other options determine the behavior of the agent in case of certain kinds of situations, for example, when energy indicators are outside the acceptable limits. Agent’s migra-tion is the ability to duplicate itself and distribute copies to other nodes in the network. Security agents can be provided in the following ways: prohibition of migration; disable automatic firmware updates and OS; installing the brokers for the implementation of the mechanism of the data transmitted; organization of protected communication channels; using means of digital signatures, certification and key management procedures.
Fig. 3 The DFD of convergence computing model

Page 10 of 16Finogeev et al. Hum. Cent. Comput. Inf. Sci. (2017) 7:11
The model of intellectual brokers is offered to agent interaction with server applica-tions at the data center (Fig. 4).
Broker is an agent that runs on routers and realizing the storage, data protection and transmission functions. Message Query Telemetry Transport protocol is used for the implementation of information exchange with limited energy resources [27].
Collect cloud computing results entering from sensor segments ZigBee network is performed by using the broker MQTT, loaded into computing network gateway cluster, that provides interaction ZigBee protocol stack [28] and MQTT-client.
The gateway is implemented on a central coordinator ZigBee network or modem pool cellular network. The broker’s functions is sensor data and aggregates processing, enter-ing in the coordinator; conversion frames with this information to be integrated into the data warehouse; data encryption; support «sliding» window algorithm to ensure reliable transmission, etc.
Availability coordinators and routers simplifies the integration MQTT brokers in the converged computing model.
Software tools for the intellectual big sensor data processingThe Erlang programming language used to develop software for converged comput-ing, including software brokers, software agents and server applications [29, 30]. Lan-guage includes a means of generating parallel processes and ensure their interaction through the exchange of asynchronous messages in accordance with the multi-agent model. Erlang is designed to create a failsafe distributed computing systems in real time. The Open Telecom Platform (OTP) framework includes the plug-in libraries and behavior patterns Class library has built-in capabilities of distributed computing: clus-tering, load balancing, add nodes and servers, increased computing reliability. Failsafe is achieved by using insulated from each other lightweight processes related messag-ing and output signals. Erlang program is translated into byte code executable virtual machines on a network nodes. The system supports “hot swapping” of code brokers and agents. The use of lightweight processes in accordance with the model allows agents to perform simultaneous multiple processes on distributed nodes with limited computing resources. Memory requirements are minimized due to the fact that the virtual machine runs lightweight process, not tools of the OS. Although the processes
Fig. 4 The model of intellectual brokers

Page 11 of 16Finogeev et al. Hum. Cent. Comput. Inf. Sci. (2017) 7:11
are isolated from each other, can be set asynchronous messaging for TCP/IP protocol, regardless of the supported operating platforms. To ensure the information security, communication between processes and nodes is done using SSL and key management schemes. To create server applications on Erlang language used set of behaviors frame-work OTP. Set action formalizes processes and allows you to build on their OTP-based applications. OTP module determines the design of parallel application templates, such as a server, and the observer, the state machine, the event handler, and others. The OTP-behavior are divided into working processes (perform query processing) and monitoring processes (watching workflows).
The combination of an industrial warehouse with non-relational data storage system is proposed to improve the efficiency of data processing and storage of results [31]. For this, together with Oracle database uses a distributed non-relational Cassandra system for caching of sections of the multidimensional storage. This improves the data sampling rate, fault tolerance and scalability. Cassandra system on the Java platform includes a distributed hash-based system that provides scalability by increasing the amount of data. Thus, the continuous removal and change data in the storage is not required. The data is loaded only in moments of interrogation OPC (OLE for process control) servers and computing integral indicators at remote sites in the cloud computing environment. Each entry of the relational component is cached section of Oracle relational database.
The data mining tool in the system allows to process large arrays of sensor data for data retrieval and analysis. It includes such components as:
• A agents for data mart visualization in the hypertable form, • A agents for data aggregation modes creation and editing, • A agents for data mart selection from hypercube for analysis.
The visualization agents of the multidimensional data is essential for a dispatcher and the DM. It allows you to see information from the specific devices for accounting and control in the structured hypertable form. The hypertable is a nonstandard user inter-face element of the monitoring system. It combines the functionality of a classic table with a tree structure and controls to view the dynamic changes of the values displayed in cells in real time. The hypertable is a way to visualize the hypercube data in which the data are grouped according to the parameters and levels of aggregation. It provides the ability to navigate in a multidimensional data structure.
A distinctive feature of the hypertable is that the number of rows is not a static value, and a row character and functionality are not equal, and some of them being the aggre-gates. The aggregates are nodal and show summary information on the relevant columns of the lower levels aggregation rows. In turn, the row-aggregates may belong to the rows of the upper levels of aggregation. The button is connected with the aggregates which and works similar to the tree list anchor element, i.e., allows showing or hiding the con-tents of the selected group. The actual number of the hypertable rows varies dynamically depending on the grouping of rows.
Another feature of the hypertable is the ability to view quickly and analyze changes in indicators of energy and heat consumption over time. When one updates data in and MDB the hypertable also changes the data values for all rows and for each time interval.

Page 12 of 16Finogeev et al. Hum. Cent. Comput. Inf. Sci. (2017) 7:11
The time interval is determined from and analysis and forecast requirements. Thus, one can view hypertable graphs change of any selected index for the period, as well as the predicted values for the specified forecast horizon. One can see the change of power indicators values tabulated in the hypertable while moving through the timeline.
The agents for aggregation modes creation and edition is needed to support the tech-nology of work with and database in the aggregation mode for selection and visualiza-tion of data mart in the hypertable. When the aggregation mode is setup the hypertable view is given, and values of visible columns, the number and nature of data grouping levels, as well as color coding are determined.
To add the aggregation mode, which will determine the form and content of the archi-val hypertable, current and forecast indicators, it is necessary to use tools, to define a set of aggregation parameters and save it with a unique name. When the mode is setup, the user should define a set of object properties (columns of values) that will be shown in the hypertable. Available properties can be selected from the drop-down list.
The agents for the analyzed data mart extraction from the hypercube allows choos-ing the data needed for the analysis of a concrete situation, which arises in the urban heat supply system. The data marts selection criteria can be quite complex. For this pur-pose, the system uses multi-level queries and filters that limit the data choice displayed in summary tables and charts. The module allows the personnel easily and clearly create queries to choose the right information, in terms of the subject area. In fact, the module is a constructor that implements the methods of querying data sampling with different requirements and criteria. It allows to group the selection criteria using logical operators in the structure of the parameterized specifications.
Data mining agents operate in a server GRID cluster. The tools are developed on the Java Enterprise Edition (J2EE) server platform using Spring and Object-Relational Map-ping (ORM) Hibernate technologies. The server part of the monitoring system gets operational and archival data from the OPC server via a wireless heterogeneous net-work with sensor and cellular networks segments. The tools are developed on the Java Enterprise Edition (J2EE) server platform using Spring and Object-Relational Mapping (ORM) Hibernate technologies. The Hibernate library solves the problems of Object-Relational Mapping Java classes to communicate with the database tables, Java data types to SQL data types. It provides tools for generating and updating a set of tables in the MDB, SQL-query building and responses processing. Using of this tool allows reduc-ing the time of typical configuration of the SCADA system, which is spent on writing of the SQL-and JDBC-codes, frees the SCADA system dispatcher from the processing of the data set and objects transforming, provides the application interface to any SQL database.
The server platform is built using the JBoss Application Server applications. JBoss Application Server with the open source is used as a server platform in the monitor-ing system. It is a competitor to proprietary software solutions, such as IBM WebSphere or Oracle WebLogic. Data exchange between clients and the application server of the SCADA system and remote server procedures call are implemented by the HTTPS and AMF (Adobe Media Format) protocols. To create the business logic of client applica-tions and the user interface we use the Adobe Flex platform, which reduces time and development cost. It is a development environment with the open source software to
Page 13 of 16Finogeev et al. Hum. Cent. Comput. Inf. Sci. (2017) 7:11
create desktop and mobile web applications. The technology extends the Flash capabili-ties, allowing describing application interface on the XML API for storing and transmit-ting structured data.
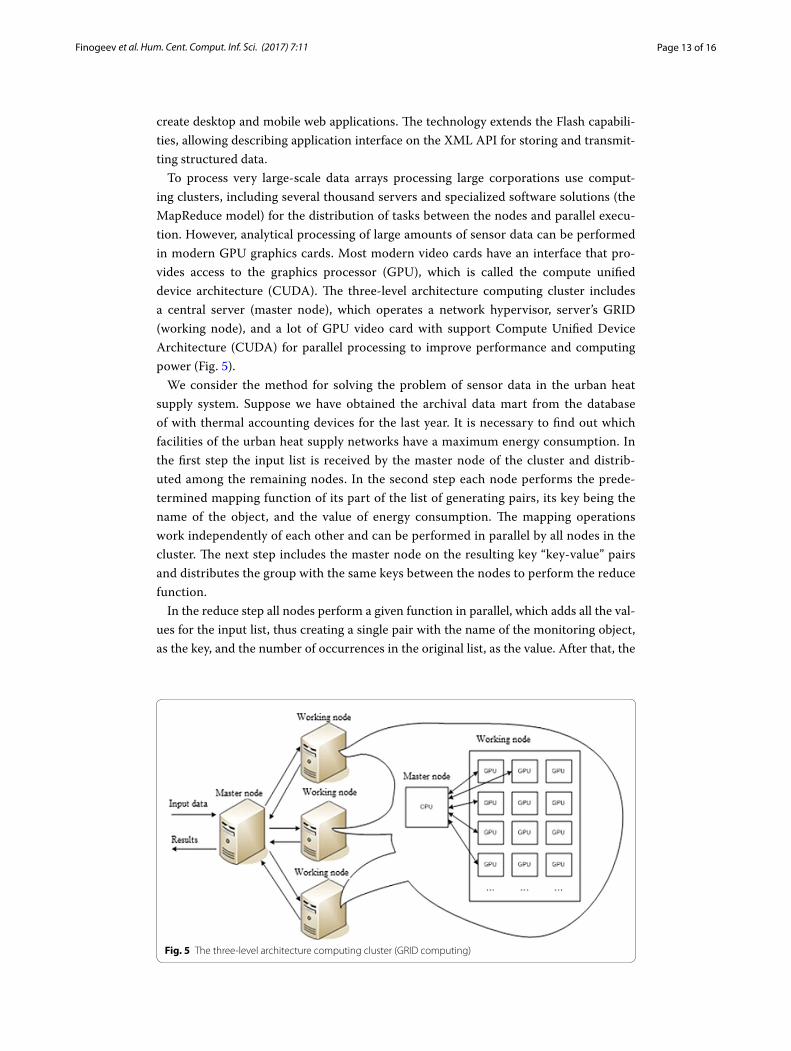
To process very large-scale data arrays processing large corporations use comput-ing clusters, including several thousand servers and specialized software solutions (the MapReduce model) for the distribution of tasks between the nodes and parallel execu-tion. However, analytical processing of large amounts of sensor data can be performed in modern GPU graphics cards. Most modern video cards have an interface that pro-vides access to the graphics processor (GPU), which is called the compute unified device architecture (CUDA). The three-level architecture computing cluster includes a central server (master node), which operates a network hypervisor, server’s GRID (working node), and a lot of GPU video card with support Compute Unified Device Architecture (CUDA) for parallel processing to improve performance and computing power (Fig. 5).
We consider the method for solving the problem of sensor data in the urban heat supply system. Suppose we have obtained the archival data mart from the database of with thermal accounting devices for the last year. It is necessary to find out which facilities of the urban heat supply networks have a maximum energy consumption. In the first step the input list is received by the master node of the cluster and distrib-uted among the remaining nodes. In the second step each node performs the prede-termined mapping function of its part of the list of generating pairs, its key being the name of the object, and the value of energy consumption. The mapping operations work independently of each other and can be performed in parallel by all nodes in the cluster. The next step includes the master node on the resulting key “key-value” pairs and distributes the group with the same keys between the nodes to perform the reduce function.
In the reduce step all nodes perform a given function in parallel, which adds all the val-ues for the input list, thus creating a single pair with the name of the monitoring object, as the key, and the number of occurrences in the original list, as the value. After that, the
Fig. 5 The three-level architecture computing cluster (GRID computing)

Page 14 of 16Finogeev et al. Hum. Cent. Comput. Inf. Sci. (2017) 7:11
master node receives data from the operating units and generates a result list, in which the records with the highest value and are the desired objects.
Cluster dual-platform architecture implementation for the ultrafast complex analytical processing of large amounts of sensory data with the possibility of parallel processing on a set of the GPU video card with the CUDA technology support is proposed to support data mining and knowledge discovery procedures at the software and hardware level. The practical implementation of the system is executed on a cluster of servers DL580 G2 Intel (R) Xeon (TM) MP ×64 (4× CPU 2.80 GHz) with video Nvidia Quadro FX 5800 4 GB with 240 GPU. The calculation performance for the data aggregation tasks reaches a the value comparable with the solution of similar problems on a single cluster platform of 800 servers.
ConclusionThe research towards the synthesis and implementation of converged computing model led to the following conclusions:
1. Convergent approach to distributed computing is the convergence of distributed data processing technologies (GRID, cloudy, foggy, and mobile computing). The model is designed for the collection, processing and integration of large sensor data obtained in the process of monitoring and control of spatially distributed objects and processes. Perspectives supports the current state of wireless technologies, software and hardware sensor networks.
2. Convergent model of distributed computing includes four levels of processing and two levels of storage. The first level—is the level of fog computing. Here, process-ing and aggregation of sensor data is realized by migrating software agents in nodes WSN ZigBee and controllers embedded in devices of industrial automation and energy accounting. At the next level sensor data and aggregates are integrated in a multidimensional cloud storage, generated based on a combination of industrial SQL Oracle type storage and distributed non-relational Cassandra system for caching data slices. The third level of data processing is implemented in the server cluster. The cluster includes the main server to control the hypervisor, network servers of low power of the local network, a lot of GPU server graphics card with CUDA tech-nology. The fourth level is implemented on mobile systems (smartphones and tab-lets) where loading and operating agents to retrieve and visualize the results of intel-ligent analysis with elements of augmented reality and the use of geo-information technologies.
3. Information interaction of the agents of fog computing together, with cloud stor-age and database and the server applications provided by brokers through intellec-tual MQTT protocol. For managing agents and brokers use the hypervisor network that consolidates distributed resources in a multiprocessor complex. Functionality of agents and brokers is defined as a mathematical function that determines the action to sensor data processing and the selection of behaviors to respond to emerging events. Functionality is implemented in Erlang language. Server applications running on a computing cluster on the J2EE platform using the Spring framework and plat-form ORM Hibernate technology.

Page 15 of 16Finogeev et al. Hum. Cent. Comput. Inf. Sci. (2017) 7:11
4. The benefits of large sensor data processing based on convergent model of distrib-uted computing: decrease the load on the server cluster; reduction in the volume of traffic in sensor networks; increasing the battery life of a network and its compo-nents; decrease in the volume of data in the repository; monitoring in real time con-trollers and sensors; obtaining integral indicators on mobile communication directly from the terminal nodes, etc.
Authors’ contributionsAll coauthors contributed significantly to the research and this paper, and the lead author is the main contributor. All authors read and approved the final manuscript.
Author details1 CAD&SD-Department, Volgograd State Technical University, Volgograd, Russia. 2 CAD-Department, Penza State Univer-sity, 40, Krasnay St, Penza 440025, Russia.
Competing interestsThe authors declare that they have no competing interests.
Fundingthe reported study was funded by Russian Foundation for Basic Research (RFBR) according to the research Project No 16-07-00031, 15-07-01720.
Received: 31 October 2016 Accepted: 21 February 2017
References 1. Matijević M, Milašinović V, Tomanović U, Petrović V (2005) JSCADA A new approach to monitoring and managing
processes. Eng Mech Eng (Tehnika–Mašinstvo) 54(5):1–6 2. Kamaev VA, Fionova LR, Finogeev AG, Finogeev AA (2015) Wireless monitoring and control at urban heating supply
system. Int J Appl Eng Res 10(3):6499–6507 3. Shcherbakov M, Kamaev V, Shcherbakova N (2013) Automated electric energy consumption forecasting system
based on decision tree approach. In: Proceeding of the IFAC conference on manufacturing modelling, management and control, pp 1061–1066
4. Shevchenko SV, Kamaev VA, Manev RI (2012) Application of fuzzy production rules and neural networks for electric-ity consumption forecasting in the region. Izvestia VSTU (Actual problems of management, computer science and informatics in technical systems) 10(14):108–112
5. Botvinkin PV, Kamaev VA, Nefedova IS, Finogeev AG (2015) On information of security risk management for GPS/GLONASS-based ground transportation monitoring and supervisory control automated navigation systems. Soc Sci 10(2):201–205
6. Dargie W, Poellabauer C (2010) Fundamentals of wireless sensor networks: theory and practice. Wiley, Hoboken. ISBN: 0470997656, 0470666390
7. Sohraby K, Minoli D, Znat T (2007) Wireless sensor networks: technology, protocols, and applications. Wiley, Hobo-ken. ISBN/ASIN:0471743003
8. Gustafsson J (2013) Integration of wireless sensor and actuator nodes with IT infrastructure using service-oriented architecture. IEEE Trans Ind Inform 9(1):43–51
9. Aleisa Eisa (2013) Wireless sensor networks framework for water resource management that supports QoS in the Kingdom of Saudi Arabia. Procedia Comput Sci 19:232–239
10. Galloway Brendan, Hancke Gerhard P (2013) Introduction to industrial control networks. IEEE Commun Surv Tutor 15(2):860–880
11. Valery Kamaev, Alexey Finogeev, Anton Finogeev, Vinh Thai Quang et al (2015) Wireless sensor network for the supervisory control and data acquisition in the heating supply system. Int J Appl Eng Res 10(15):35390–35393
12. Valery Kamaev, Alexey Finogeev, Anton Finogeev et al (2015) Methods and tools for secure sensor data transmission and data mining in energy SCADA system. Commun Comput Inf Sci Part XI 535:474–487
13. Liu Wei, Nishio Takayuki, Shinkuma Ryoichi, Takahashi Tatsuro (2014) Adaptive resource discovery in mobile cloud computing. Comput Commun 50:119–129
14. Fernando Niroshinie, Loke Seng W, Rahayu Wenny (2013) Mobile cloud computing: a survey. Futur Gener Comput Syst 29(1):84–106
15. Armbrust M, Fox A, Griffith R, Joseph A, Katz R, Konwinski A, Lee G (2010) A view of cloud computing. Commun ACM 53(4):50–8
16. Arunkumar G, Venkataraman Neelanarayanan (2015) A novel approach to address interoperability concern in cloud computing. Procedia Comput Sci 50:554–559
17. Badger L, Grance T, Patt-Corner R, Voas J (2012) Cloud computing synopsis and recommendations. Recommenda-tions of the National Institute of Standards and Technology. NIST Special Publication. http://csrc.nist.gov/publica-tions/nistpubs/800-146/sp800-146.pdf. Accessed 16 Oct 2016
18. Cisco and Microsoft extend relationship with new Cloud Platform. http://newsroom.cisco.com/press-release-content?type=webcontent&articleId=1608152. Accessed 16 Oct 2016

Page 16 of 16Finogeev et al. Hum. Cent. Comput. Inf. Sci. (2017) 7:11
19. Google Cloud Platform. BigQuery. A fast, economical and fully managed data warehouse for large-scale data analyt-ics. https://cloud.google.com/bigquery. Accessed 16 Oct 2016
20. Hybrid. Open. Secure. IBM Cloud delivers a new way to work. http://www.ibm.com/cloud-computing/us/en/. Accessed 16 Oct 2016
21. Hersent O, Boswarthick D, Elloumi O (2012) The internet of things: key applications and protocols. Wiley, Hoboken 22. Toshiba Asia Pacific Pte. Ltd. Toshiba Launches new storage system “Toshiba Total Storage Platform” to meet big data
and cloud solutions. http://www.asia.toshiba.com/wp-content/uploads/2013/11/tapl_20131112.pdf. Accessed 16 Oct 2016
23. ISO 50001:2011 «Energy management systems—requirements with guidance for use» NIST Cloud Computing Program. http://csrc.nist.gov/publications/nistpubs/800-145/SP800-145.pdf. Accessed 16 Oct 2016
24. Stojmenovic I, Wen S (2014) The fog computing paradigm: scenarios and security issues. In: Proceedings of the 2014 federated conference on computer science and information systems (ACSIS) 2, pp 1–8
25. ZigBee Alliance. http://www.zigbee.org. Accessed 16 Oct 2016 26. OASIS. MQTT version 3.1.1. OASIS Standard. 2014. http://docs.oasis-open.org/mqtt/mqtt/v3.1.1/os/mqtt-v3.1.1-os.
pdf. Accessed 16 Oct 2016 27. ZigBee Specification Overview. http://www.zigbee.org/Specifications/ZigBee/Overview.aspx. Accessed 16 Oct 2016 28. Larson Jim (2008) Erlang for concurrent programming. ACM Queue 5:18–23 29. Nyström JH, Trinder PW, King DJ (2008) High-level distribution for the rapid production of robust telecoms software:
comparing C++ and ERLANG. Concurr Comput Pract Exp 20(8):941–968 30. Kamaev V, Finogeev A, Finogeev A, Shevchenko S (2014) Knowledge discovery in the SCADA databases used for the
municipal power supply system. In: Proceedings. Knowledge-Based Software Engineering (JCKBSE), pp 1–15 31. Alexey Finogeev, Valery Kamaev, Ludmila Fionova, Anton Finogeev, Egor Finogeev, Thang Mai Ngoc (2015) Tools for
data mining and secure transfer in the wsn for energy management. Int J Appl Eng Res 10(15):35373–35381