the corporation: en genomgång 730g32 ht 2012 fundamentals of corporate finance bmm lecture 4: chap....
TRANSCRIPT

The Corporation: en genomgång
730g32 HT 2012Fundamentals of Corporate Finance
BMMLecture 4: Chap. 1, 2, 3 & 4: Financial decisions,
Financial institutions, and performance measures

LEARNING OBJECTIVES
Chapter 1• Understand the definition of a corporation• The role of the financial manager in a
corporation.• Functions of financial markets.• Principal-agent problems, agency costs and
information asymmetries.
Chapter 1• Understand the definition of a corporation• The role of the financial manager in a
corporation.• Functions of financial markets.• Principal-agent problems, agency costs and
information asymmetries.
2

Corporations • two types of financial decisions that are made
in a corporation: investment decisions and financing decisions.
• Financial managers are responsible for both decisions!
Investment decisions
Financing decisions
Financial Market
3

Corporation
• Corporation– A business organized as a separate legal entity owned
by stockholders. – Or a nexus of contract between legal entities.
• Types of Corporations– Public Companies– Private Corporations, sole proprietorships– Partnerships– Etc.
4

Organizing a BusinessSole
Proprietorship Partnership Corporation
Who owns the business?
The manager Partners Stockholders
Are managers and owners separate?
No No Usually
What is the owner's liability?
Unlimited Unlimited Limited
Are the owner and business taxed
separately?No No Yes
5

Corporate Structure
Sole Proprietorships
Corporations
Partnerships
Limited Liability
Corporate tax on profits +
Personal tax on dividends
Unlimited Liability
Personal tax on profits
6

Who is The Financial Manager?
• Chief Financial Officer (CFO)– Oversees the treasurer and controller and sets
overall financial strategy.• Treasurer
– Responsible for financing, cash management, and relationships with banks and other financial institutions.
• Controller– Responsible for budgeting, accounting, and taxes.
7

Who is The Financial Manager?
Chief Financial Officer
Treasurer Controller
8

Definitions
Capital Budgeting Decision– Decision to invest in tangible or intangible assets.
…also called the Investment DecisionFinancing Decision
– The form and amount of financing of a firm’s investments.
9

Capital Structure (D/E ratio)
• Capital StructureThe proportion of debt vs. equity financing.1.Debt/Equity ratio, a multiple of debt over equity. Can be tricky when equity becomes small.2.D/(E+D) debt asset ratio measures the indebtedness of the company. ranging from 0 to 100%.Market capitalization: the company´s total amount of shares outstanding times the share price.
10

Distinguishing Real Assetsand Financial Assets
• Real Assets– Assets used to produce goods and services.– examples: Patents, Machines, a new pipeline, etc
• Financial Assets– Financial claims to the income generated by the
firm’s real assets.– Examples: stocks, bonds, bank loans
11

The Goals of the corporation
• Firm Value maximization: I. Anglo-America model: shareholder interests II. Continental European model: Stakeholder interests
which include all claimants who has a vested interest in the company, for example, the supplier, the workers union, the local government, tax authority, etc.
Is it just a conceptual dispute? Most firms do maximize Firm value taken into
consideration of the stakeholder interests: That is to say, Corporate Social Responsibilities, ethics
of corporation add value to the firm.
12

Corporate governanceand Agency problems
• Shareholder oriented model: US, UK1. Professional managers, principal-agency problems,
agency costs, 2. Monitoring type: Shareholder meeting, institutional
ownership, specialist monitoring3. Market for corporate control: hostile takeovers
• Stakeholder oriented model: continental Europe1. Big shareholder control, long term ownership, Less
agency costs, Less problem of investor protection, specialist
2. Bank monitoring, Shareholder Meeting, friendly takeover
13

Asymmetric information and Principal agency problem
Managers know more about the corporation including:•Stock price movement and returns•Issues of shares and other securities•Dividends decision•Financing Managers may have their own goals other than shareholders´.
14

Agency Problem Solutions
1 – Management Compensation plans2 - Board of Directors3 – Market for corporate control:
Takeovers4 - Specialist Monitoring5 - Legal and Regulatory Requirements
15

Chap 2. Financial Markets and Institutions
Learning objectives•The Importance of Financial Markets and Institutions•The Flow of Savings to Corporations•Functions of Financial Markets and of Financial Intermediaries•Value Maximization and the Cost of Capital
16

Financial Markets
Primary
Markets: issuing stocks, bonds
Secondary
Markets: trading
stocks, bonds
OTC
Markets: forex
trading
Money
17

Financial Markets
Company
Issue Securities
Cash
InvestorsCash Reinvested
18

Corporation
Investment in real assets
Investorsworldwide
Financial markets
Stock marketsFixed-income marketsMoney marketsMarkets for Commodities Foreign exchange Derivatives
Financial Intermediaries:
Mutual Funds Pension funds
Financial Institutions
Banks Insurance companies
Reinvestment
Financial Markets
19

Financial InstitutionsCompany
IntermediariesBanks
Insurance Cos.
Brokerage Firms
ObligationsObligationsFundsFunds
20

Financial InstitutionsIntermediaries
InvestorsDepositors (sparare)
Policyholders (försäkringstagare)
Investors
ObligationsFunds
21

Financial Markets
Funds
Funds
Banks
Insurance Cos.
Brokerage Firms
Obligations
Depositors
Policyholders
Investors
Obligations
Company
Intermediary
Investor
22

Financial Markets
Banks
Depositors
$2.5 m
Cash
Loan
Deposits
Company
Intermediary
Investor
23

Financial Market: some definitions• Financial Market is a market where securities are
issued and traded.• A security is a traded financial asset. Shares,
bonds, asset backed securities, options, etc.• Fixed income market: market for debt securities,
for example, treasury bills, corporate bond, etc.• Capital market: market for long term financing,
e.g. stocks, long term bonds, etc.• Money market: market for short term financing,
less than 1 year.
24

Function of Financial Markets
• Transporting cash across time• Risk transfer and diversification• provide Liquidity• Payment mechanism• Provide useful information for all: commodity
price, cost of capital, interest rate, exchange rate, share price, etc.
25

U.S. Financing
Information Provided by Financial Markets• Commodity prices• Interest rates• Company values Credit Rating Interest Rate
AAA 5.71%AA 5.78A 6.38BBB 7.12BB 9.84B 10.82
Source: Bloomberg Composite Corporate BondIndexes.
Interest rates on 30-year corporate bonds,February 2008.
26

Opportunity cost of capital(alternativ kapitalkostnad)
• Opportunity cost of capital: the best possible investment forego by the investor is the opportunity cost of capital for the firm.
• Cost of capital: minimum acceptable rate of return on capital investment for the investor.
• The investors can invest in financial market and get expected rate of return on the investment at a similar risk level. This expected rate of return in the market determines the firm´s cost of capital.
27

Chapter 4 Measuring corporate performance
Important issues! Very relevant for business lawyers.•Measuring Profitability•Measuring Efficiency•Analyzing the Return on Assets: The Du Pont System•Measuring Leverage•Measuring Liquidity•Interpreting Financial Ratios
28

Importance of accounting data
Performance evaluationFinancial decisions Financial decisions
Accounting data Accounting data
29

Value and Value Added
• Market CapitalizationTotal market value of equity, equal to share price times number of shares outstanding.
• Market Value AddedMarket capitalization minus book value of equity.
share)per (priceshares) (# tion CapitalizaMarket
ValueBook Equity -tion CapitalizaMarket MVA
30

Value and Value AddedPepsiCo Balance Sheet (December 31, 2006) $Millions

Pepsico Income Statement (year end 2006) M$
Net Sales 35,753Cost Of Goods Sold 15,762Selling, G&A expenses 11,530Depreciation expense 1,406EBIT 7,055Net interest expense 66Taxable Income 6,989Income Taxes 1,347Net Income 5,642Allocation of net incomeDividends 1854
32

Market-to-Book Ratio: performance measure
– Ratio of market value of equity to book value of equity.
76
36815$
457102$
equity of book value
equity of uemarket valratiobook -to-Market
.
,
,
33
Pepci´s common stock closed at the end of 2006 at $62,55 per share. There are 1,638 million shares outstanding. So, the total market capitalization =62,55*1,638= $102,457 million

Market-to-Book Ratio
• Stock market measures of company performance, 2006. Companies are ranked by market value added. (dollar values in millions)
34

Measuring Profitability
• Economic Value Added (EVA)– Net income minus a charge for the cost of capital
employed. Also called residual income.
• Residual Income – Net Dollar return after deducting the cost of
capital
Equity Equity ofCost - IncomeNet
Income Residual
EVA
35

Measuring Profitability
• Economic Value Added (EVA) of PepsiCo
Equity Equity ofCost - IncomeNet
Income Residual
EVA
million $4,527
14,251.095 - 5,642
Income Residual
EVA
Obs: the equity figure is the from the end of 2005, because this was the equity employed in the year 2006.
36

Measuring Profitability• Return on Equity (ROE)
– Net income as a percentage of shareholders’ equity
• Return on Capital (ROC)– Net income plus Interest as a percentage of long-term
capital.• Return on Assets (ROA)
– Net income plus interest as a percentage of total assets
Svenska termer räntabilitet på eget kapital, se nästa slides
37

Lönsamhets nyckeltal
Det totala kapitalets räntabilitet ---- RT
Resultat Mått: Rörelseresultat + finansiella intäkterEllerResultat efter finansiella poster + finansiella kostnaderKapital mått: genomsnittligt totalt kapital=(T0 +T1 )/2
38

Rörelseresultat + Finansiella intäkter RT = x 100%
Genomsnittlig Balansomslutning
lönsamhets nyckeltalRT
ROA= Räntabilitet på totala kapital = AVKASTNING på Totala Kapital

RT =VP x KOH
Resultat efter finansiella intäkter * Omsättningar Omsättningar Totalt kapital
RT =
Du Pont modellen: RT =VP x KOH
Det Totala Kapitalets Räntabilitet RT = vinst marginal x Kapitalomsättningshastighet
Tumregel 7~8% (*statsobligations avkastning + riskpremie)
RT Return on Assets ROA
40

RsyssAvkastning (Rsyss) på sysselsatt Kapital=
Rörelseresultat + finansiella intäkterx 100%
Genomsnittligt Sysselsatt Kapital
Sysselsatt kapital = Balansomslutning - Ej räntebärande skulder (till Leverantörer)- Latenta skatteskulder (på obesk. reserver)
41
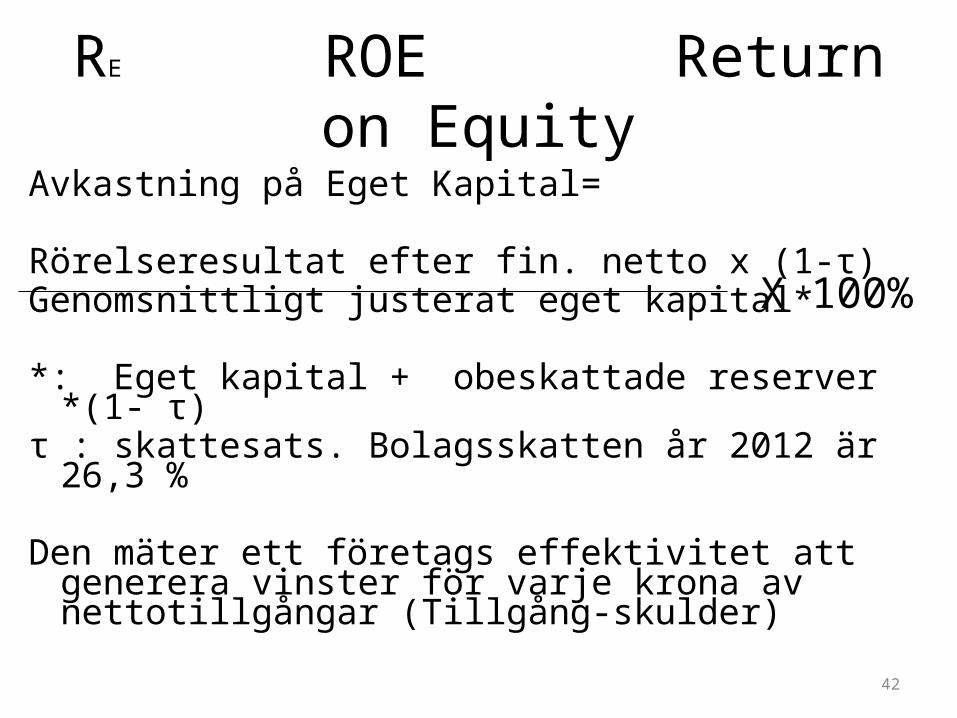
RE ROE Return on EquityAvkastning på Eget Kapital=
Rörelseresultat efter fin. netto x (1-τ) Genomsnittligt justerat eget kapital*
*: Eget kapital + obeskattade reserver *(1- τ) τ : skattesats. Bolagsskatten år 2012 är 26,3 %
Den mäter ett företags effektivitet att generera vinster för varje krona av nettotillgångar (Tillgång-skulder)
X 100%
42

Effektivitet i Kapitalanvändning
Kapitalomsättningshastighet (KOH)KOH= Omsättning / Total kapitalTumregel 1,5 för KOH.Ränta Betalningsförmåga:Räntetäckningsgrad = resultat efter finansiella intäkter / finansiella kostnader Tumregel är 2, men minst 1.
43

Rörelseresultat
Rörelsemarginal = rörelseresultat / omsättning
Vinstmarginal (VP)Brukar kallas KapitalersättningsmarginalDe vanligaste definitionerna är: Resultat före finansiella kostnader Omsättning
44

Measuring Profitability• Accounting measures of company performance, 2006.
Companies are ranked by return on equity.
45

Measuring Profitability (kursbok exempel)
396.14,251
5,642
equity
incomenet =equityon Return
185.31,727
2395,642=
assets total
Interest IncomeNet =assetson Return
355.564,16
2395,642
equity debt termLong
Interest IncomeNet =capitalon Return
PepsiCo Profitability Measurements
46

Measuring Efficiencyyear ofstart at assets total
Sales=ratioover Asset turn
assets totalAverage
Sales=ratioturnover Asset
OR
13.131,727
35,753
year ofstart at assets total
Sales=ratioover Asset turn
16.12/)930,29(31,727
35,753
assets totalAverage
Sales=ratioover Asset turn
OR
For PepsiCo
47

Measuring Efficiency
sold/365 goods ofcost
year ofstart at inventory =Inventoryin Days Average
year ofstart at inventory
sold goods ofcost =ratioturnover Inventory
salesdaily average
year ofstart at sreceivable=period collection Average
year ofstart at sreceivable
sales=Turnover sReceivable
48

The DuPont model
total sales Net Income interest paid ROA= x
assets total sales
Assetturnover
Operating Profitmargin
Net Income interest paidROA=
assets
49

Measuring Leverage
equity+debt termlong
debt termlong=ratiodebt termLong
equity
debt termlong=ratioequity Debt
Skuldsättningsgrad (S/E) = Debt-to-equity ratio (D/E)
Skuldsättningsgrad (S/E) skulder + skatt på obeskattade reserver = eget kapital + obeskattade reserver med avdrag för skatt 50

Measuring Leverage
EBIT+depreciation Cash coverage ratio=
interest payments
Räntetäckningsgrad = (EBIT+ avskrivningar)/ räntekostnader
Justerat Eget Kapital (JEK)SOLIDITET =
Totalt Kapital
JEK= Eget kapital + (1 – skattesats) x obeskattade reserver
Equity ratio = shareholders funds/ total assets =shareholders funds/(debt+equity)
51

Return on Equity
interestIncomeNet
IncomeNet x
sales
interestIncomeNet x
assets
salesx
equity
assets=ROE
leverageratio
assetturnover
Operating profitmargin
debtburden
ROA
Kom ihåg: Du Pont modellenRT =VP x KOH
52

The DuPont Model
• A breakdown of ROE and ROA into component ratios
sales
Interest IncomeNet =MarginProfit Operating
sales
IncomeNet =MarginProfit
53

Measuring Liquidity
Net working capital Net working capital=
to total assets ratio Total assets
current assetsCurrent ratio=
current liabilities
sliabilitiecurrent -assetcurrent capital gNet workin
54

Liquidity Ratios
sliabilitiecurrent
securities marketable+cash=ratioCash
sliabilitiecurrent
sreceivable+securities marketable+cash=ratioQuick
55

Sustainable Growth
ratiopayout -1=
earnings
dividends-earnings=ratioPlowback
earnings
dividends=ratioPayout
56

Interpreting Financial Ratios• PepsiCo Ratios
57

Interpreting Financial Ratios• PepsiCo Ratios (continued)
58

Interpreting Financial Ratios• Selected 2006 financial ratios for industry groups in Standard & Poor’s
Composite Index
59

Accounting information and market information are important
• The market demand transparency of company information!
• this is to ensure fairness for all the market participants to make informed decision.
• Efficient market is characterized of efficient information revealing.
60

Next topic: Valuing stocks!
61