the corporation of the city of nelson
TRANSCRIPT

The Corporation of the City of Nelson

Agenda 1. Introduction
2. Quick Facts
3. 2019 – 2023 Financial Plan Process
4. 2019 Budget Overview
5. Taxation & Operating Budget
6. City Assets/Reserves/Debt
7. Comments & Questions Presenter: Colin McClure, Chief Financial Officer


Our Vision
is supported by four Strategic Goals
Each goal identifies what we hope to achieve, communicates how we plan to achieve it and how
we will measure success. To implement the Strategic Plan and link it to departmental work
plans, the City develops annual Business Plan priorities and budgets to identify the specific
actions and resources required to carry out the identified goals and achievements.
The City’s Annual Report identifies progress towards meeting the goals in the Strategic Plan
Enhance Sustainability of City Services and Infrastructure
Strengthen Neighbourhoods
Expand Local Jobs, Local Prosperity
Achieve Excellence in City Governance

•Financial Planning – Process, Environment & Direction
•Five Year Plan Overview and Quick Facts
•Operating Costs
•Funding Sources – User Fees, Debt, Reserves & Taxation
Utilities, City Assets & the Capital Budget

Financial Planning Process Departmental staff
prepare budget
Finance staff & senior management
review
Adjustments by staff
Staff presentations to Council
Council debate & propose tax rate
Public consultation
Council review of input & potential
subsequent changes
Bylaw introduction and adoption
Today

Financial Planning Environment Economic growth in BC expected to be 2.6% in 2019 Shifting of responsibilities/downloading Public demand for services Increasing demands on aging infrastructure and the need
to address this issue Sustainability & GHG Reduction Plans Long term planning Current and potential new private development will assist in
generating new market construction taxation revenue Reduced interest earned on investments

Budget Principles Council’s Direction to Staff
Support delivery of municipal services Maintain services delivered at 2018 levels Reduce costs of service delivery, where possible, while
minimizing service impact levels Generate new revenue Minimize tax rate increase Long term planning as a focus Continue utility infrastructure program Address roads & facilities infrastructure deficit Implement sustainability principles

Revenue Sources Operating Expenses
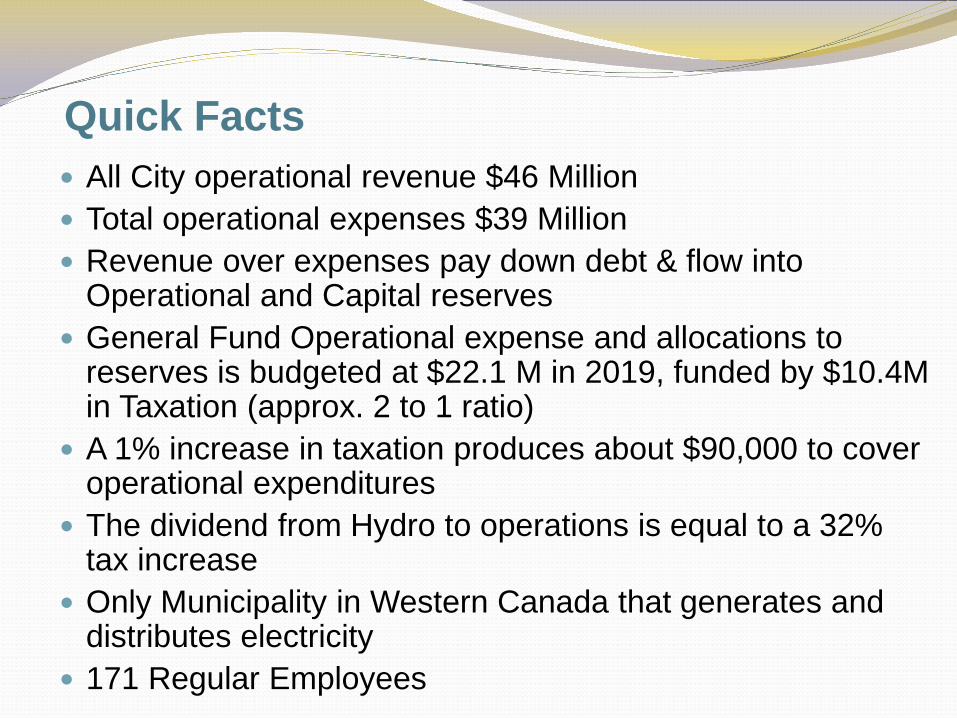
Quick Facts All City operational revenue $46 Million Total operational expenses $39 Million Revenue over expenses pay down debt & flow into
Operational and Capital reserves General Fund Operational expense and allocations to
reserves is budgeted at $22.1 M in 2019, funded by $10.4M in Taxation (approx. 2 to 1 ratio)
A 1% increase in taxation produces about $90,000 to cover operational expenditures
The dividend from Hydro to operations is equal to a 32% tax increase
Only Municipality in Western Canada that generates and distributes electricity
171 Regular Employees

City of Nelson 2017 Operating Revenues
Taxes 22%
Sale of Services 7%
Other revenue from own sources
8%
Investment income
1% Grants - unconditional
2%
Grants - conditional
6% Water user Fees 7%
Sewer user fees 7%
Transit user fees 1%
Nelson Hydro sales 40%
Taxes $10,188,590 Sale of Services 3,393,001 Other revenue from own sources 3,298,250 Investment income 523,976 Grants - unconditional 784,993 Grants - conditional 2,829,650 Water user fees 3,490,223 Sewer user fees 3,001,144 Transit user fees 282,828 Nelson Hydro sales 18,353,665
$46,146,320

City of Nelson 2017 Operating Expenses General Government $5,040,004 Police & Bylaw 4,486,190 Fire Services 2,058,971 Development Services 644,344 Engineering Services 4,861,685 Parks, Cultural & Recreational 2,349,929 Transit 1,568,395 Library 893,786 Nelson Hydro 12,693,855 Utilities 4,760,405
$39,357,564
General Government
13% Police & Bylaw
12%
Fire Services 5%
Development Services
2%
Engineering Services
12%
Parks, Cultural & Recreational
6%
Transit 4%
Library 2%
Nelson Hydro 32%
Utilities 12%

Five Year Financial Plan
Funding Sources Debt & Grants
Taxation
User Fees
General
Water
Sewer
Hydro
Waste
Areas: General Water Sewer Hydro Resource Recovery
Costs include: Capital Operating

2019 Budget Overview Highlights: New market construction taxation revenue generation for 2019 is
expected to be $79,000 A 2% property tax increase was recommended, however, in working
with our partners in the RDCK and some proposed funding changes for regional parks and emergency management this may change
Council has not had a chance yet to discuss and decide how they would like to handle the proposed new funding
Water & Sewer overall rate increase of 1.75% or $19 for a home; rate reallocation dropped water rates by $192 and increased sewer rates by $211 (with discounts)
Hydro rate increase effective April 1, 2019 of 1.5% urban and 2.94% rural
No change in garbage and recycling fees
2019 Capital Budget: • $15.8M including General, Water, Sewer & Hydro

2019 Operating Budget Revenues
TAXES 54%
GRANT-IN-LIEU OF TAXES
3%
SALE OF SERVICES
17%
OTHER REVENUE FROM OWN SOURCES
14%
GRANTS - UNCONDITIONAL
3%
GRANTS - CONDITIONAL
8% INVESTMENT
INCOME 1%

Operating Fund - How did we get there? Starting Operating Budget Shortfall? $(202,000)
Revenues New Development – Taxation 79,000
Increase in Grants in Lieu of taxes 30,000
Increase in Parkade revenue 90,000 Increase in expected building/dev permit rev 125,000 Loss of Youth employment grant (120,000) Net proposed funding from regional parks 158,000
Increase parking meter revenue 60,000
Total Change in Revenues
$422,000

Operating Fund - How did we get there? Expenditure Additions/Reductions
Temporary Summer Beat Officer $(31,000)
Increase in Public Works staff for graveyard shift (131,000)
No Election expenses in 2019 20,000
Increase in funding to Capital reserve from parking (60,000)
Increase to Building Inspection staffing (50,000)
Balance after revenue & expense adjustments -32,000
Proposed 2% Taxation increase revenue 180,000
Surplus after adjustments
$148,000

Revenue Sources Operating Expenses Capital Plan

• Who does the City collect taxes for? • Assessment * Tax Rate = Property Taxes • What is the proposed change for 2019?

2018 Tax Collection Over All Gov’t Sectors
City of Nelson $10,419,352 School 8,568,817 RDCK 4,080,902 Regional Hospital 721,113 BCAA & MFA 153,720 Total $23,943,904
City of Nelson
44% School
36%
RDCK 17%
Regional Hospital
3%
BCAA & MFA 1%

Taxation - Assessment
BC Assessment is a provincial Crown corporation that determines the market value of all real properties in BC.
After determining correct classification, actual value and exemption status of every property, BC Assessment provides taxing authorities with an Assessment Roll which lists all properties, names of owners and taxable values of the land and any improvements (buildings).

Tax Revenues: Growth – Where does it come from? New revenue only exists when there is new
assessment Increase in “inventory” i.e. through subdivision or
new construction General increases in market value do not generate
more tax dollars Past couple of years has resulted in moderate new
revenues from growth

BC Assessment: Year over Year Market Changes 2014 - 2019
14.89%
5.68%
-4.00%
-2.00%
0.00%
2.00%
4.00%
6.00%
8.00%
10.00%
12.00%
14.00%
16.00%
2014 2015 2016 2017 2018 2019
Residential Commercial

Residential Improved Properties

Commercial Improved Properties

Effect of Assessments in 2019
Property Class
2018 Assessed Values
2019 Assessed Values
% Change Due to Market
% Change Overall
Residential $1,564,572,200 $1,820,405,900 14.89% 16.35%
Utility 107,638,295 109,669,495 2.39% 1.89%
Light Industry
1,644,200 1,704,500 3.67% 3.67%
Business 255,563,950 270,087,100 5.26% 5.68%
Non-Profit 2,211,700 2,324,700 5.11% 5.11%
Total $1,931,630,345 $2,204,191,695 12.9% 14.1%

2018 Business Tax Class Multiples
1.78 1.93
2.10 2.11 2.19
2.38 2.51 2.55
2.74 3.26 3.29
4.64 6.03
0.00 1.00 2.00 3.00 4.00 5.00 6.00 7.00
RosslandCrestonNelson
TrailNakusp
KelownaInvermereCranbrook
FernieCastlegar
KimberleyRevelstoke
North Saanich
Note: Provincial business class multiple is 2.45 for RDCK , Hospital and School tax

Property Taxes & Assessments Property Class 2019 Assessed
Values Assessed
Value Percentages
% of Property
Taxes Levied
Residential $1,820,405,900 82.5% 73.4% Utility 109,669,495 5.0% 1.3% Light Industry 1,704,500 0.1% 0.1% Business 270,087,100 12.3% 25.1% Non-Profit 2,324,700 0.1% 0.1%
Total $2,204,191,695 100% 100%

2018 Tax Distribution of Average Single Family Dwelling (SFD)
City of Nelson $1,689
School 855
RDCK 541
Regional Hospital 109
BCAA & MFA 16
Total $3,210 City of Nelson
44% School
36%
RDCK 17%
Regional Hospital
3%
BCAA & MFA 1%

2019 Proposed Budget Effect on an Average SFD
Average Single Family Dwelling $455,000
2018 2019 Net Change
Net Monthly Change
Property Tax (municipal only) $1,689 $1,689 $0 $0
Water Rates (after discount) 549 357 -192 -16.00
Sewer Rates (after discount) 469 680 211 17.58
Resource Recovery (fee + bag tag) 118 118 0 0
Overall $2,825 $2,844 $19 $1.58

2019 TAX EFFECT ON AVERAGE SFD
2018 2019 Net
Change
Net Monthly Change
Assessed Value $393,000 $455,000 $62,000 n/a
Municipal Property Tax 1,689 1,689 0 0.00
RDCK tax requisition 541 618 77 6.17
West Kootenay Hospital requisition 109 118 9 0.75
BC Asses/MFA tax requisition 16 16 0 0
School Tax requisition 855 855 0 0
Overall $3,210 $3,296 $86 $7.17

2019 TAX EFFECT ON AVERAGE SFD 2018 2019
Net Change
% Change
Assessed Value $393K $455K $62K 15.8%
Municipal Property Tax 1,689 1,689 0 0.0%
RDCK tax requisition 541 618 77 14.2%
West Kootenay Hospital requisition 109 118 9 8.3%
BC Asses/MFA tax requisition 16 16 0 0
School Tax requisition 855 855 0 0
Less: Basic Home Owner Grant (HOG) (770) (770) 0.00 0.0%
Total Tax $2,440 $2,526 $86 3.5%

2019 Proposed Budget Effect on $1,000,000 Commercial Restaurant (50 seats)
2018 2019 Net Change
Net Monthly Change
Assessed Value $950,000 $1,000,000 $50,000 n/a
Property Tax (municipal only) $8,576 $8,576 $0 $0
Water Rates (after discount) 1,644 1,070 -574 47.83
Sewer Rates (after discount) 1,400 2,028 628 52.33
Overall $11,620 $11,674 $54 $4.50

2019 General Budget Expenditures
GENERAL GOVERNMENT
SERVICES 18%
POLICE PROTECTION 18%
FIRE SERVICES 9%
OTHER PROTECTIVE SERVICES
3%
TRANSPORTATION SERVICES
18%
ENVIRONMENTAL HEALTH SERVICES
1%
PUBLIC HEALTH & WELFARE
SERVICES 1%
RECREATION & CULTURAL
10%
TRANSIT 8%
LIBRARY GRANT 3%
CONTRIB. TO RESERVES
11%

Transit 2018
Budget 2019
Budget Transit operating costs $1,410,000 $1,506,000
Debt service costs 206,000 223,000
Total costs $1,616,000 $1,729,000
Fares $261,000 $281,000
BC Transit/RDCK 1,037,000 1,126,000
City Contribution 318,000 322,000
Total Funding $1,616,000 $1,729,000

Overall Capital Plan – 2019 Highlights Total Capital - $15.8M
$7.8M Water, Sewer & Hydro Continuation of watermain replacement, secondary source Continuation of CIPP relining, sewer main upgrades Hydro transmission system upgrades, pole replacements
$8.0M General Capital Paving program, sidewalk & retaining wall improvements Building improvements (i.e. exteriors, mechanical systems) Vehicle & equipment replacements Park improvements

Proposed Facilities Program
2018 2019 Required annual budget $1,701,000 $1,982,000
Budgeted contribution 300,000 300,000 Shortfall $1,401,000 $1,682,000 Proposed Funding Profit 310 Ward Street $180,000 $180,000 Water Lic. Reserve 500,000 350,000 Community Works Fund 300,000 377,000 Grants 265,000 125,000 ARES Lessee Contribution 100,000 0 New Funding $1,345,000 $1,032,000
Reserve (usage) $56,000 $650,000

2018 Facilities Highlights Civic Centre (719 Vernon St) - Electrical and Life Safety Improvements
• Need to improve aged infrastructure
• General upgrades completed in last three years; partially funded by $225k Canada 150 grant and $82.5k RDCK Community Works funding
• Upgraded electrical system completed
• Upgraded fire alarm system substantially complete

2019 Facilities Highlights
Coke & Gas Works (610 Railway St.) Exterior Revitalization Project
• Built in 1900 – historical value
• Key component of Railtown District
• Restoration of original windows & gas lamp posts, etc.
• Repointing of brick & stone
• Roof replacement
• $100k CBT Heritage grant
Heritage Restoration

Police & Library – LED Lighting Upgrade • Drastically reduce energy usage and operating costs
• Improve quality of lighting for occupants
Government Place – LED Lighting Upgrade • Successful pilot project of 1st & 2nd Floor completed in 2018;
work with Province to complete remaining floors
Energy Efficiency Initiatives
2019 Facilities Highlights

2019 Facilities Highlights Police & Library (602/606 Stanley St.) – Roof and Mechanical System Replacement • Aging infrastructure at end of life
• Replacement needed to minimize future operational costs (repairs and maintenance) and increase efficiency
Install new roofing system
Replace mechanical rooftop units (4)

Overview – Total City Assets
0.0
50.0
100.0
150.0
200.0
WaterUtility
SewerUtility
HydroUtility
Roads &StormSewer
Buildings All Other
$ M
illio
ns
Replacement Cost
Historical Cost

Surplus and Reserves Debt

Funding - What is a Surplus? • A surplus is the amount by which revenue exceeds
expenditures in a year. We do not budget for a surplus.
• May be caused by: • Unexpected revenue • Revenue exceeding budget (i.e. investments, fees -
difficult to budget) • Budgeting may be conservative because we cannot
have a deficit • Vacant positions

How Should We Spend General Surplus or Reserves?
Good tool for non-recurring items (e.g. capital or one-
time projects).
Recurring items (e.g. policing costs or parks
maintenance) should generally not be funded through
reserves, as the benefits can be short lived.
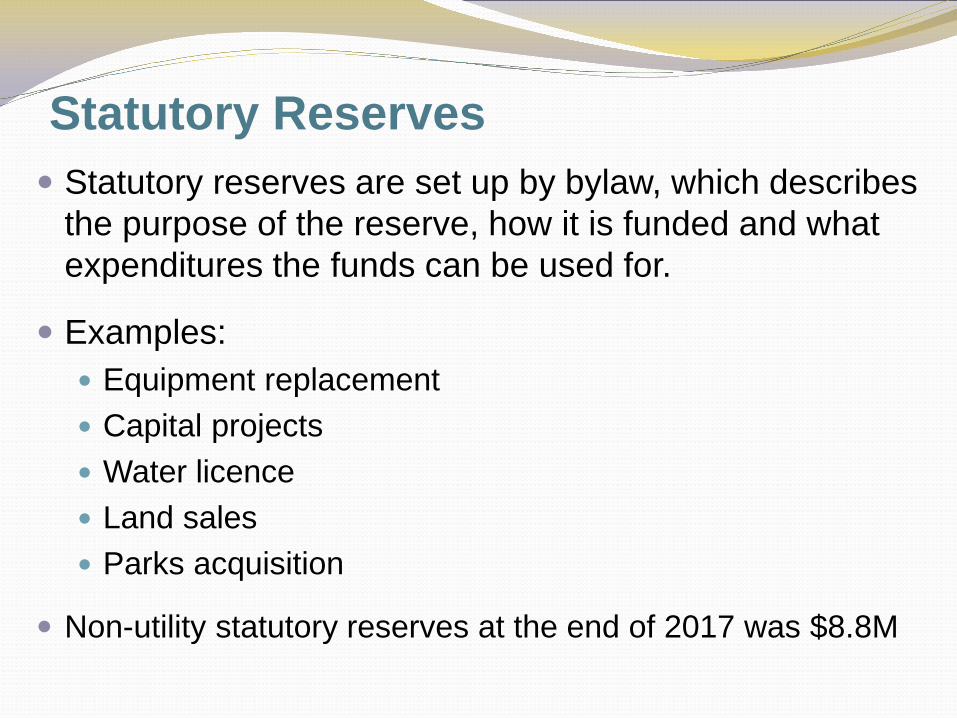
Statutory Reserves Statutory reserves are set up by bylaw, which describes
the purpose of the reserve, how it is funded and what expenditures the funds can be used for.
Examples: Equipment replacement Capital projects Water licence Land sales Parks acquisition
Non-utility statutory reserves at the end of 2017 was $8.8M

Other Appropriated Surplus Past Councils have directed allocation of surpluses to be
reserved from a variety of one-time and ongoing activities including:
Selkirk College Campus Services – Recycling, Economic Development Administrative Costs – Insurance, Legal Development and Infrastructure– Land Sale, Bridges,
Airport, Buildings Fortis Pay Down
Appropriated Surplus at the end of 2017 was $2.6M

Debt and Debt Servicing Major capital projects typically funded by
using combination of existing reserves and by borrowing funds.
Strategic decision when to borrow vs using reserves or taxation.
$14.4M in General & Utility Debt
Of $7.6M in General Debt (Dec 31, 2018), only $1.1M is supported through general taxation.

General Capital Funding 2019 = $7.96M
Statutory Reserves
66%
Contrib. & Donations
6%
Storm Sewer Parcel Tax
1%
Gov't Grants 2%
Special Reserves
25%

Water Licence Reserve 2019 2020 2021 2022 2023
Opening bal. $1,426,710 $722,341 $685,755 $746,709 $1,241,537
Water licence rev. 864,500 884,514 904,854 919,028 933,279
Borrowing 0 0 0 0 0
Grants/Donations 0 0 0 0 0
Debt Servicing 175,000 175,000 175,000 175,000 175,000
Capital program (1,758,069) (1,109,500) (1,033,500) (623,500) (429,800)
Interest 14,200 13,400 14,600 24,300 38,400
Closing Balance $722,341 $685,755 $746,709 $1,241,537 $797,279

Water License Reserve – Planned Five Year Expenditures
$0
$500,000
$1,000,000
$1,500,000
$2,000,000
2019 2020 2021 2022 2023
Other
Info. Tech.
Sidewalks
Parks
Buildings(Allocation toBuilding Res)

Capital Reserve (Transportation System)
2019 2020 2021 2022 2023 Opening bal. $1,843,572 $1,248,072 $538,072 $508,672 $697,372
Parking meter revenue
975,000 975,000 975,000 975,000 975,000
Other funding 200,000 275,000 275,000 200,000 1,000,000
Road/sidewalk maintenance program
(1,795,000) (1,970,000)
(1,290,000)
(1,000,000)
(2,000,000)
Interest Income 24,500 10,600 10,000 13,700 13,400
Closing Balance $1,248,072 $538,672 $508,672 $697,372 $685,772

Assets Versus Reserves
$0
$20
$40
$60
$80
$100
$120
$140
Water Sewer Hydro Roads & Storm Sewer Building All Other
1.0 2.5 2.9 1.0 0.3 2.2 5.4 4.3 6.3
1.8 1.0 6.7
50.1
31.0
52.0
45.3
35.7 36.6
$89
$53
$125
$112 $111
$56
Annual ContributionReserve BalanceHistorical CostReplacement Cost
$ M
illion
s

Debt Payments– Trend Line – 5 years
$-
$100,000
$200,000
$300,000
$400,000
$500,000
$600,000
$700,000
$800,000
$900,000
$1,000,000
2019 2020 2021 2022 2023
Sewer Utility
Water Utility
Hydro Utility
General (NET)
General (GROSS)

Statutory Reserves – Trend Line
$(1,000,000)
$-
$1,000,000
$2,000,000
$3,000,000
$4,000,000
$5,000,000
$6,000,000
$7,000,000
2019 2020 2021 2022 2023
Water Licence
Capital (Roads)
Equipment
Water Utility
Hydro Utility
Sewer Utility

Water Sewer Resource Recovery Nelson Hydro

Overview – Water Utility • Strategic Direction:
• Water Master Plan - long term planning critical to maintain safe and accessible water and fire flow protection
• Water conservation, secondary water sources, continuation of watermain replacement and data gathering for water metering plan
• Rates: • Council approved 2% rate increase for 2019 • Rate reallocation dropped rates by $192 (with discount) • Proposed 2% increase per year for next 10 years

$0
$200
$400
$600
$800
$1,000
2004
2005
2006
2007
2008
2009
2010
2011
2012
2013
2014
2015
2016
2017
2018
2019
2020
2021
2022
2023
2024
2025
2026
2027
2028
2029
2030
2031
2032
2033
2034
Projected Water Rates - SFD

Overview – Water Utility 2019
Operating Highlights Capital Highlights Revenue:
User fees $2.5M
Operating costs: Approx. $1.4M
Debt Service: $100k per year No new debt planned
until 2024
Budget of $1.8M for infrastructure upgrades
Watermain - $1M Secondary Source - 610k Emerg. Intake - $50k ICI metering - $150k
2019-2023 Capital • funded through User Fees &
Gov’t grants

Overview – Sewer Utility
Strategic Direction: Sewer Masterplan – asset repair & maintenance Develop replacement program in conjunction with
water utility and road network upgrades Improved technology “CIPP (cured-in place pipe)” has
cut cost of relining sewer pipes Rates:
• Council approved 1.5% rate increase for 2019 Rate reallocation increase rates by $211 (with
discount) Proposed 1.5% increase per year for next 10 years

$0
$200
$400
$600
$800
$1,00020
0420
0520
0620
0720
0820
0920
1020
1120
1220
1320
1420
1520
1620
1720
1820
1920
2020
2120
2220
2320
2420
2520
2620
2720
2820
2920
3020
3120
3220
3320
34
Projected Sewer Rates - SFD

Overview – Sewer Utility
Operating Capital Revenue:
User fees $4.4M
Operating costs: Approx. $1.9M
Debt Service: $78k per year No new debt planned
until 2023
2019 Budget $2.6M Infrastructure expansion and
replacement:
CIPP Relining $600k
STP Upgrades $700k
Airport Lift Station Grit Chamber $970k
2019-2023 Capital
funded through User Fees & grants

Overview – Resource Recovery Utility Waste function is based on a fee for service model
Yearly charge per household pays for the collection
2019:
No increase in fees
The City is receiving $142K annually from MMBC to collect recycling – this revenue is currently being used to fund operations
In 2019, the City signed a new 5 year contract with Recycle BC, which requires the elimination of single use blue bags for curbside pick up by July of 2020
A new garbage truck to be procured this year
Looking for a made in Nelson solution to composting

Overview – Hydro Utility Strategic Objective:
Provide safe and efficient generation, distribution and sale of electrical energy
Strategic Business Priorities:
District Energy Business Plan Investigating new small hydro generation

2018 Capital Achievements:
Distribution System Rebuild of 60L2 & 60L3 sections North Shore re-conductor Pole replacements Submarine cable design & cable purchase
Power Plant G5 auxiliary systems upgrade
Substations
Bonnington Sub circuit breaker replacement
Overview – Hydro Utility

Overview – Hydro Utility
2019 Capital Budget $3.5M (funded by energy sales)
Distribution System Pole replacements Submarine cable crossing
Power Plant
Wood deck replacement Bridge deck replacement
Substations
Lakeside Terminal switchgear New voltage regulator at Six Mile Sub

Overview – Hydro Utility
2019 Operating Budget:
• Revenue of $18.7M
• Expenses: • $5.1M Operating
• $6.7M Power Purchase
• $499k Debt Payments
• $6.5M Transfers
2019 Contributions: • $2.8M to City of Nelson operations
• $658k to Water License Reserve
• $90k to the Nelson & District Community Complex

Hydro Rates – Urban

Hydro Rates – Rural
