the correlation between visual...
TRANSCRIPT
THE CORRELATION BETWEEN VISUAL ELECTROPHYSIOLOGY TEST WITH
RETINAL NERVE FIBRE LAYER THICKNESS AND ADVANCE GLAUCOMA INTERVENTIONAL STUDY
SCORE IN PRIMARY ANGLE CLOSURE GLAUCOMA PATIENTS.
by
DR. AHMAD NURFAHMI B. AKHTAR ALI MBBS (MALAYA)
DISSERTATION SUBMITTED IN PARTIAL FULFILMENT OF THE REQUIREMENT FOR THE
DEGREE OF MASTER OF MEDICINE (OPHTHALMOLOGY)
SCHOOL OF MEDICAL SCIENCES
UNIVERSITI SAINS MALAYSIA 2014

ii
TABLE OF CONTENTS
ACKNOWLEDGEMENTS ii
TABLE OF CONTENTS iii
LIST OF TABLES vii
LIST OF FIGURE ix
LIST OF APPENDICES xi
LIST OF ABREVIATION xii
ABSTRACT IN MALAY xiv
ABSTRACT IN ENGLISH xvii
CHAPTER ONE
1 INTRODUCTION 1
1.1 PRIMARY ANGLE CLOSURE GLAUCOMA (PACG). 1
1.2 NATURAL OF PRIMARY ANGLE CLOSURE GLAUCOMA (PACG)
3
1.3 PROGRESSION PRIMARY ANGLE CLOSURE GLAUCOMA (PACG) 5
1.4 OPTICAL COHERENCE TOMOGRAPHY (OCT) IN PACG 7
1.5 THE PACG VISUAL FIELD DEFECT AND ADVANCE GLAUCOMA INTERVENTIONAL STUDY 9
1.6 PATTERN ELECTRORETINOGRAM (PERG) AND GLAUCOMA 11
1.7 PATTERN VISUAL EVOKED POTENTIAL (PVEP) IN GLAUCOMA 13
1.8 RATIONAL OF THIS STUDY 15
CHAPTER TWO
2 OBJECTIVES
2.1 GENERAL OBJECTIVE 18
2.2 SPECIFIC OBJECTIVES 18
2.3 RESEARCH QUESTIONS 19

iii
CHAPTER THREE
3.0 METHODOLOGY 20
3.1 RESEARCH DESIGN 20
3.2 POPULATION, PLACE AND PERIOD OF STUDY 20
3.2.1 STUDY POPULATION: 20
3.2.2 PLACE OF STUDY: 20
3.2.3 DURATION OF STUDY: 20
3.3 SAMPLING METHOD: 20
3.3.1 SELECTION CRITERIA: 20
3.3.2 PACG GROUP INCLUSION CRITERIA 21
3.3.3 PACG GROUP EXCLUSION CRITERIA 21
3.3.4 CONTROL GROUP INCLUSION CRITERIA 22
3.3.5 CONTROL GROUP EXCLUSION CRITERIA 22
3.4 SAMPLE SIZE ESTIMATION 23
3.5 DEFINITION OF TERMS. 24
3.6 STUDY INSTRUMENT 30
3.6.1 DRUG 30
3.6.1.2 PROPACAINE HYDROCHLORIDE (ALCAINE) 0.5% EYE DROPS (ALCON-COUVREUR, PUURS, BELGIUM) 20
3.6.1.2 FLUORESCEIN SODIUM PAPER STRIP (FLUORETS) FOR OPHTHALMIC USE 1MG (BAUSCH & LOMB, UK) 31
3.6.2 INVESTIGATIVE INSTRUMENTS 31
3.6.2.1 SNELLEN CHART 31
3.6.2.2 SLIT LAMP BIOMICROSCOPE (TOPCON CORP, JAPAN) 31
3.6.2.3 GOLDMAN APPLANATION TONOMETER (HAAG-STREIT BERN, SWISS) 32

iv
3.6.2.4 PACHYMETER (PACSCAN 300AP DIGITAL BIOMETRIC RULER,SONAMED INC, USA). 32
3.6.2.5 FUNDUS PHOTOGRAPH (KOWA INCORPORATION , TOKYO, JAPAN). 32
3.6.2.6 HUMPHREY VISUAL FIELD ANALYZER STATPAC2 (CARL ZEISS MEDITEC INC, USA). 33
3.6.2.7 OCT (CIRRUS HD-OCT; CARL ZEISS MEDITEC INC, USA). 33
3.6.2.8 GRANZFIELD PVEP AND PERG (ROLAND-CONSULT, RETI-PORT 32, GERMANY) 33
3.7 DATA COLLECTION /DETAIL OF METHODOLOGY
3.7.1 RECRUITMENT OF PATIENT 34
3.7.2 BASELINE EXAMINATION 34
3.7.3 ELECTROPHYSIOLOGY TEST 38
3.7.3.1 PVEP MEASUREMENT 39
3.7.3.2 PERG MEASUREMENT 40
3.7.4 METHOD TO MINIMISE ERROR 42
3.8 DATA ANALYSIS
3.8.1 GENERAL DEMOGRAPHIC DATA 43
3.8.2 COMPARING PVEP, PERG AND OCT PARAMETERS BETWEEN PACG AND CONTROL GROUP. 44
3.8.3 CORRELATION BETWEEN PVEP, PERG WITH AGIS SCORE AND RNFL ANALYSIS. 44
3.10 ETHICAL APPROVAL 46
v
CHAPTER FOUR
4.1 DEMOGRAPHIC DATA 51
4.1.1 SOCIO DEMOGRAPHIC CHARACTERISTIC 51
4.1.2 CLINICAL CHARACTERISTICS 53
4.2 COMPARISON OF PVEP READING BETWEEN PACG PATIENTS AND CONTROL GROUP 55
4.3 COMPARISON OF PERG READING BETWEEN PACG PATIENTS AND CONTROL GROUP 56
4.4 COMPARISON OF RETINA NERVE FIBER ANALYSIS BETWEEN PACG PATIENTS AND CONTROL GROUP 57
4.5 CORRELATION BETWEEN ADVANCE GLAUCOMA INTERVENTION STUDY (AGIS) SCORE AND PVEP READING IN PACG PATIENTS AND CONTROL GROUP 59
4.6 CORRELATION BETWEEN ADVANCE GLAUCOMA INTERVENTION STUDY (AGIS) SCORE AND PERG READING IN PACG PATIENTS AND CONTROL GROUP 65
4.7 CORRELATION BETWEEN MEAN OVERALL RETINA NERVE FIBER LAYER (RNFL) THICKNESS AND PVEP READING IN PACG PATIENTS AND CONTROL GROUP 70
4.8 CORRELATION BETWEEN MEAN OVERALL RETINA NERVE FIBER LAYER (RNFL) THICKNESS AND PERG READING IN PACG PATIENTS AND CONTROL GROUP 76

vi
CHAPTER FIVE
5.1 PATTERN ELECTRORETINOGRAM (PERG) IN PACG PATIENTS. 89
5.2 PETTERN VISUAL EVOKED POTENTIAL (PVEP) IN PACG PATIENT 92
5.3 RETINAL NERVE FIBER LAYER (RNFL) ANALYSIS IN PACG 95
5.4 THE CORRELATION BETWEEN VISUAL ELECTROPHYSIOLOGY TEST AND OVERALL RNFL ANALYSIS 98
5.5 CORRELATION BETWEEN VISUAL ELECTROPHYSIOLOGY WITH AGIS SCORE 106
5.6 LIMITATION AND RECOMMENDATIONS 107
CHAPTER SIX
6.0 CONCLUSION 109
REFERENCES 111
APPENDICES 129

vii
LIST OF TABLES
TABLE 3.1 AGIS SCORE
TABLE 3.2 CLASSIFICATION OF CORRELATION COEFFICIENTS BASED ON
CORRELATION BETWEEN TWO VARIABLES
TABLE 4.1 SOCIO DEMOGRAPHIC CHARACTERISTICS OF PACG PATIENTS
AND CONTROL GROUP.
TABLE 4.2 CLINICAL CHARACTERISTIC OF THE STUDY EYE IN PACG
PATIENT AND CONTROL GROUP
TABLE 4.3 COMPARISON OF PVEP N75 BETWEEN PRIMARY ANGLE CLOSURE
GLAUCOMA AND CONTROL (N=66)
TABLE 4.4 COMPARISON OF PVEP P100 BETWEEN PRIMARY ANGLE CLOSURE
GLAUCOMA AND CONTROL (N=66)
TABLE 4.5 COMPARISON OF PVEP N135 BETWEEN PRIMARY ANGLE CLOSURE
GLAUCOMA AND CONTROL (N=66)
TABLE 4.6 COMPARISON OF PVEP N75-P100 BETWEEN PRIMARY ANGLE
CLOSURE GLAUCOMA AND CONTROL (N=66)
TABLE 4.7 COMPARISON OF PVEP P100 – N135 BETWEEN PRIMARY ANGLE
CLOSURE GLAUCOMA AND CONTROL (N=66)
TABLE 4.8 COMPARISON OF PERG N35 BETWEEN PRIMARY ANGLE CLOSURE
GLAUCOMA AND CONTROL (N=66)

viii
TABLE 4.9 COMPARISON OF PERG P50 BETWEEN PRIMARY ANGLE CLOSURE
GLAUCOMA AND CONTROL (N=66)
TABLE 4.10 COMPARISON OF PERG N95 BETWEEN PRIMARY ANGLE CLOSURE
GLAUCOMA AND CONTROL (N=66)
TABLE 4.11 COMPARISON OF PERG N35-P50 BETWEEN PRIMARY ANGLE
CLOSURE GLAUCOMA AND CONTROL (N=66)
TABLE 4.12 COMPARISON OF PERG P50-N95 BETWEEN PRIMARY ANGLE
CLOSURE GLAUCOMA AND CONTROL (N=66)
TABLE 4.13 COMPARISON OF DISC AREA BETWEEN PRIMARY ANGLE
CLOSURE GLAUCOMA AND CONTROL (N=66)
TABLE 4.14 COMPARISON OF MEAN TOTAL RETINA NERVE FIBER THICKNESS
BETWEEN PRIMARY ANGLE CLOSURE GLAUCOMA AND CONTROL
(N=66)
TABLE 4.15 COMPARISON OF MEAN SUPERIOR RETINA NERVE FIBER
THICKNESS BETWEEN PRIMARY ANGLE CLOSURE GLAUCOMA
AND CONTROL (N=66)
TABLE 4.16 COMPARISON OF MEAN INFERIOR RETINA NERVE FIBER
THICKNESS BETWEEN PRIMARY ANGLE CLOSURE GLAUCOMA
AND CONTROL (N=66)
TABLE 4.17 COMPARISON OF MEAN NASAL RETINA NERVE FIBER THICKNESS
BETWEEN PRIMARY ANGLE CLOSURE GLAUCOMA AND CONTROL
(N=66)

ix
TABLE 4.18 COMPARISON OF MEAN TEMPORAL RETINA NERVE FIBER
THICKNESS BETWEEN PRIMARY ANGLE CLOSURE GLAUCOMA
AND CONTROL (N=66)
LIST OF FIGURES
Figure 3.1 Gutt proparacaine (Alcaine, ALCON LAB) and fluorescence strip.
Figure 3.2 Fundus photo (A) and Humphrey’s Visual Field (B)
Figure 3.3 Performing ocular coherence tomography (OCT)
Figure 3.4 Electrode position during PVEP
Figure 3.5 Electrode position during PERG
Figure 3.6 Room light setting, small checks size and distance during visual electrophysiology test
Figure 3.7 Flow Chart of The Study
Figure 4.1 A scatter plot showing no correlation between AGIS score and PVEP (N75)
Figure 4.2 A scatter plot showing no correlation between AGIS score and PVEP (P100)
Figure 4.3 A scatter plot showing no correlation between AGIS score and PVEP (N135)
Figure 4.4 A scatter plot showing no correlation between AGIS score and PVEP (N75-P100)
Figure 4.5 A scatter plot showing no correlation between AGIS score and PVEP (P100-N135)
Figure 4.6 A scatter plot showing fair negative correlation between AGIS score and PERG (N35)
Figure 4.7 A scatter plot showing fair negative correlation between AGIS score and PERG ( N95)
Figure 4.8 A scatter plot showing no correlation between AGIS score and PERG ( P50)
Figure 4.9 A scatter plot showing no correlation between AGIS score and PERG ( N35-P50)

x
Figure 4.10 A scatter plot showing no correlation between AGIS score and PERG (P50-N95)
Figure 4.11 A scatter plot showing no correlation between mean RNFL thickness and PVEP (N75)
Figure 4.12 A scatter plot showing no correlation between mean RNFL thickness and PVEP (P100)
Figure 4.13 A scatter plot showing no correlation between mean RNFL thickness and PVEP (N135)
Figure 4.14 A scatter plot showing no correlation between mean RNFL thickness and PVEP
(N75-P100)
Figure 4.15 A scatter plot showing no correlation between mean RNFL thickness and PVEP (P100-N135)
Figure 4.16 A scatter plot showing good positive correlation between mean RNFL thickness
and PERG (N95)
Figure 4.17 A scatter plot showing no correlation between mean RNFL thickness and PERG (N35)
Figure 4.18 A scatter plot showing no correlation between mean RNFL thickness and PERG (P50)
Figure 4.19 A scatter plot showing no correlation between mean RNFL thickness and PERG (N35- P50)
Figure 4.20 A scatter plot showing no correlation between mean RNFL thickness and PERG
(P50-N100)

xi
LIST OF APPENDICES
APPENDIX A: Ethical Approval from USM
APPENDIX B: Patient Performa Sheet
APPENDIX C: Patient Information Sheet (Malay version)
APPENDIX D: Patient Information Sheet (English version)
APPENDIX E: Written Consent (Malay version)
APPENDIX F: Written Consent (English version)

xii
LIST OF ABREVIATIONS
AGIS Advance Glaucoma Interventional Study
CCT Central corneal thickness
DTL Dawson-Trick-Litzkow electrodes
HFA Humphrey Visual Field Analysis
HUSM Hospital Universiti Sains Malaysia
IOP Intraocular Pressure
MD Mean difference
OCT Ocular Coherence Tomography
OHT Ocular Hypertension
ONH Optic Nerve Head
PAC Primary Angle closure
PACG Primary Angle Closure Glaucoma
PERG Pattern Electroretinogram
POAG Primary Open Angle Glaucoma
PSD Pattern Standard Different
PVEP Pattern Visual Evoked Potential
RGC Retinal Ganglion Cell
RNFL Retina Nerve Fibre Layer
VFI Visual Field Index
xiii
ABSTRAK
PENGENALAN
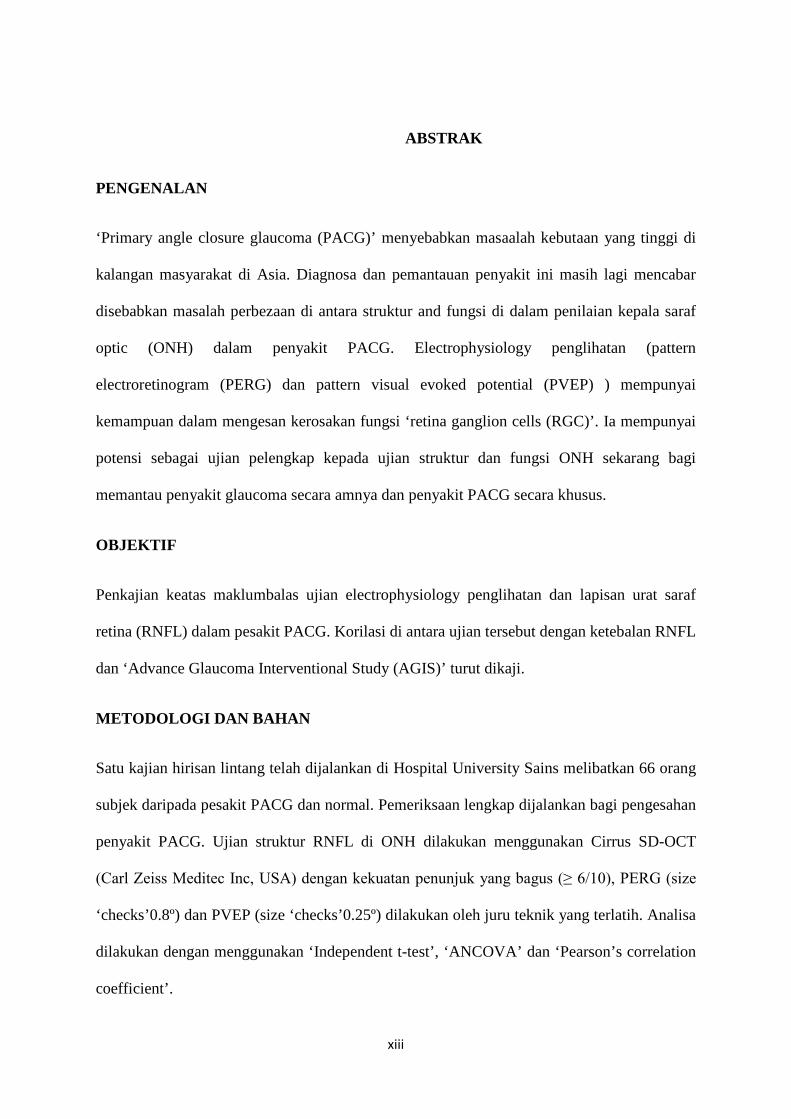
‘Primary angle closure glaucoma (PACG)’ menyebabkan masaalah kebutaan yang tinggi di
kalangan masyarakat di Asia. Diagnosa dan pemantauan penyakit ini masih lagi mencabar
disebabkan masalah perbezaan di antara struktur and fungsi di dalam penilaian kepala saraf
optic (ONH) dalam penyakit PACG. Electrophysiology penglihatan (pattern
electroretinogram (PERG) dan pattern visual evoked potential (PVEP) ) mempunyai
kemampuan dalam mengesan kerosakan fungsi ‘retina ganglion cells (RGC)’. Ia mempunyai
potensi sebagai ujian pelengkap kepada ujian struktur dan fungsi ONH sekarang bagi
memantau penyakit glaucoma secara amnya dan penyakit PACG secara khusus.
OBJEKTIF
Penkajian keatas maklumbalas ujian electrophysiology penglihatan dan lapisan urat saraf
retina (RNFL) dalam pesakit PACG. Korilasi di antara ujian tersebut dengan ketebalan RNFL
dan ‘Advance Glaucoma Interventional Study (AGIS)’ turut dikaji.
METODOLOGI DAN BAHAN
Satu kajian hirisan lintang telah dijalankan di Hospital University Sains melibatkan 66 orang
subjek daripada pesakit PACG dan normal. Pemeriksaan lengkap dijalankan bagi pengesahan
penyakit PACG. Ujian struktur RNFL di ONH dilakukan menggunakan Cirrus SD-OCT
(Carl Zeiss Meditec Inc, USA) dengan kekuatan penunjuk yang bagus (≥ 6/10), PERG (size
‘checks’0.8º) dan PVEP (size ‘checks’0.25º) dilakukan oleh juru teknik yang terlatih. Analisa
dilakukan dengan menggunakan ‘Independent t-test’, ‘ANCOVA’ dan ‘Pearson’s correlation
coefficient’.
xiv
KEPUTUSAN
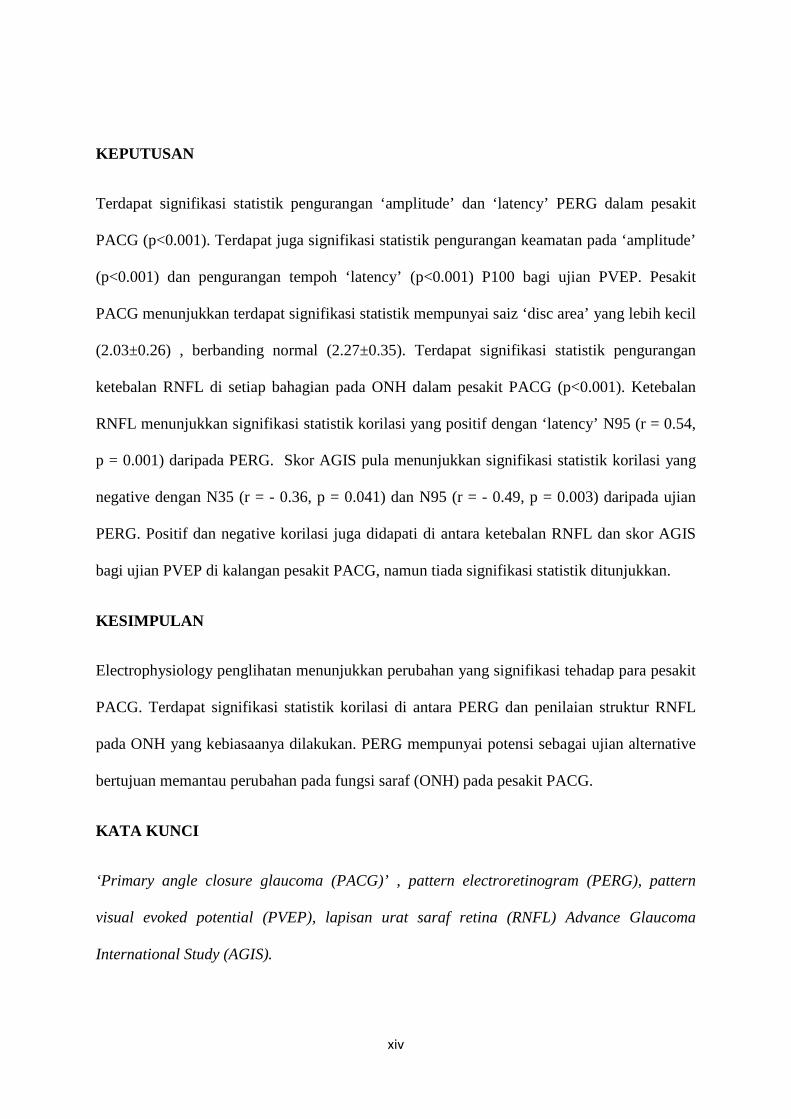
Terdapat signifikasi statistik pengurangan ‘amplitude’ dan ‘latency’ PERG dalam pesakit
PACG (p<0.001). Terdapat juga signifikasi statistik pengurangan keamatan pada ‘amplitude’
(p<0.001) dan pengurangan tempoh ‘latency’ (p<0.001) P100 bagi ujian PVEP. Pesakit
PACG menunjukkan terdapat signifikasi statistik mempunyai saiz ‘disc area’ yang lebih kecil
(2.03±0.26) , berbanding normal (2.27±0.35). Terdapat signifikasi statistik pengurangan
ketebalan RNFL di setiap bahagian pada ONH dalam pesakit PACG (p<0.001). Ketebalan
RNFL menunjukkan signifikasi statistik korilasi yang positif dengan ‘latency’ N95 (r = 0.54,
p = 0.001) daripada PERG. Skor AGIS pula menunjukkan signifikasi statistik korilasi yang
negative dengan N35 (r = - 0.36, p = 0.041) dan N95 (r = - 0.49, p = 0.003) daripada ujian
PERG. Positif dan negative korilasi juga didapati di antara ketebalan RNFL dan skor AGIS
bagi ujian PVEP di kalangan pesakit PACG, namun tiada signifikasi statistik ditunjukkan.
KESIMPULAN
Electrophysiology penglihatan menunjukkan perubahan yang signifikasi tehadap para pesakit
PACG. Terdapat signifikasi statistik korilasi di antara PERG dan penilaian struktur RNFL
pada ONH yang kebiasaanya dilakukan. PERG mempunyai potensi sebagai ujian alternative
bertujuan memantau perubahan pada fungsi saraf (ONH) pada pesakit PACG.
KATA KUNCI
‘Primary angle closure glaucoma (PACG)’ , pattern electroretinogram (PERG), pattern
visual evoked potential (PVEP), lapisan urat saraf retina (RNFL) Advance Glaucoma
International Study (AGIS).

xv
ABSTRACT
INTRODUCTION
Primary angle closure glaucoma (PACG) causes more blindness in Asian population.
Diagnosis and monitoring remains a challenge especially due to structural-functional
discrepancy in evaluating optic nerve head (ONH) in PACG. Visual electrophysiology
(pattern electroretinogram (PERG) and pattern visual evoked potential (PVEP)) has the
capability in detecting functional impairment of retina ganglion cells (RGC). It has the
potential as complimentary test to the existing standard structural and functional test for ONH
evaluation in glaucoma in general and PACG specifically.
OBJECTIVE
To evaluate visual electrophysiology response and retina nerve fibers layer (RNFL) thickness
in PACG. The correlation between visual electrophysiology with the glaucoma severity based
on RNFL thickness and Advance Glaucoma Interventional Study (AGIS) score were also
evaluated.
MATERIALS AND METHODS
A comparative cross sectional study was conducted in Hospital University Sains Malaysia
involving 66 samples of PACG patients and controls. A Complete ocular assessment was
done to confirm the diagnosis of PACG. Evaluation of structural changes of RNFL of ONH
was conducted using Cirrus SD-OCT (Carl Zeiss Meditec Inc, USA) with good signal
strength ( ≥ 6/10).AGIS score was performed on a reliable reproducible visual field of two
consecutive Humphrey’s visual field (24-2) analysis. PERG (0.8º checks size) and PVEP

xvi
(0.25º checks size) was conducted by a trained technician. Independent t-test, ANCOVA and
Pearson’s correlation coefficient analysis were used in analysis.
RESULTS
There was statistically significant reduction in amplitude and latency in of PERG in PACG
patients (p<0.001). There was also significant reduction in magnitude of amplitude (p<0.001)
and shorten of P100 latency in PVEP (p<0.001). PACG patients had significant smaller disc
area (2.03±0.26) compared to controls (2.27±0.35). There was also significant thinner RNFL
analysis in all quadrant of the ONH in PACG patients (p<0.001). RNFL thickness shown a
significant strong positive correlation with the PERG amplitude of N95 (r = 0.54, p = 0.001).
AGIS score showed a significant negative correlation between N35 (r = - 0.36, p = 0.041) and
N95 (r = - 0.49, p = 0.003) of PERG. Similarly the positive and negative correlations were
seen between RNFL thickness and AGIS score respectively with PVEP. However it was not
statistically significant.
CONCLUSION
Visual electrophysiology showed significant changes in PACG patients. There was
significant correlation between PERG and existing standard structural and functional analysis
of ONH. PERG is the potential alternative tools for evaluation of functional changes of ONH
in PACG patients.
KEY WORDS
‘Primary angle closure glaucoma (PACG)’, pattern electroretinogram (PERG), pattern
visual evoked potential (PVEP), retina nerve fiber layer (RNFL), Advance Glaucoma
International Study (AGIS).

xvii

THE CORRELATION BETWEEN VISUAL ELECTROPHYSIOLOGY TEST WITH
RETINA NERVE FIBRE LAYER THICKNESS AND ADVANCE GLAUCOMA
INTERVENTIONAL STUDY SCORE IN PRIMARY ANGLE CLOSURE GLAUCOMA
PATIENT.
Dr Ahmad Nurfahmi Akhtar Ali
MMed Ophthalmology
Department of Ophthalmology
School of Medical Sciences, University Sains Malaysia
Health Campus,16150 Kelantan, Malaysia
INTRODUCTION: Primary angle closure glaucoma (PACG) causes more blindness in Asian
population. Diagnosis and monitoring remains a challenge partly due to discrepancy between
structural and functional changes in evaluating optic nerve head (ONH) in PACG. Visual
electrophysiology (pattern electroretinogram (PERG) and pattern visual evoked potential
(PVEP)) has the capability in detecting early functional impairment of retina ganglion cells
(RGC). Perhaps, it has the potential as complimentary test to the existing standard structural and
functional test for ONH evaluation in glaucoma in general and PACG specifically.
OBJECTIVE: To evaluate visual electrophysiology response and retina nerve fibers layer
(RNFL) thickness in PACG. The correlation between visual electrophysiology with the
glaucoma severity based on RNFL thickness and Advance Glaucoma Interventional Study
(AGIS) score were also evaluated.

MATERIALS AND METHODS:A case control study was conducted in Hospital Universiti
Sains Malaysia involving 33 of PACG patients and 33 controls. A complete ocular assessment
was done to confirm the diagnosis of PACG. Evaluation of structural changes of RNFL of ONH
was conducted using SD-OCT (Carl’s Zeiss) with minimal signal strength more than 6/10.
AGIS score was performed on a latest reliable reproducible of two consecutive Humphrey’s
visual field (SITA-Standard) 24-2 analysis. Pattern electroretinogram (PERG), 0.8º (48 min of
arc) and pattern visual evoked potential (PVEP), 0.25º (15 min of arc) were performed.
Independent t-test and ANCOVA analysis were used to compare the parameters. Pearson’s
correlation coefficient was used to correlate the parameters and RNFL thickness as well as AGIS
score.
RESULTS: There was statistically significant reduction in amplitude and latency in of PERG in
PACG patients (p<0.001). There was also significant reduction in magnitude of amplitude
(p<0.001) and shorten of P100 latency in PVEP (p<0.001). PACG patients had significant
smaller disc area compared to controls (2.03±0.26, 2.27±0.35, p =0.001). There was also
significant thinner RNFL analysis in all quadrant of the ONH in PACG patients (p<0.001).
RNFL thickness shown a significant strong positive correlation with the PERG amplitude of N95
(r = 0.54, p = 0.001). AGIS score showed a significant negative correlation between N35 (r = -
0.36, p = 0.041) and N95 (r = - 0.49, p = 0.003) of PERG. Similarly the positive and negative
correlations were seen between RNFL thickness and AGIS score respectively with PVEP.
However it was not statistically significant.
CONCLUSION: Visual electrophysiology showed reduced response in PACG patients. There
was correlation established between PERG and existing standard structural and functional
analysis of ONH. PERG is the potential alternative tools for evaluation of functional changes of
ONH in PACG patients.
Assoc. Prof. Dr. Wan Hazabbah Wan Hitam
Assoc. Prof. Dr. Liza Sharmini Ahmad Tajudin (Co-Supervisor)
XVII
ABSTRACT
INTRODUCTION
Primary angle closure glaucoma (PACG) causes more blindness in Asian population. Diagnosis
and monitoring remains a challenge partly due to discrepancy between structural and functional
changes in evaluating optic nerve head (ONH) in PACG. Visual electrophysiology (pattern
electroretinogram (PERG) and pattern visual evoked potential (PVEP)) has the capability in
detecting early functional impairment of retina ganglion cells (RGC). Perhaps, it has the
potential as complimentary test to the existing standard structural and functional test for ONH
evaluation in glaucoma in general and PACG specifically.
OBJECTIVE
To evaluate visual electrophysiology response and retina nerve fibers layer (RNFL) thickness in
PACG. The correlation between visual electrophysiology with the glaucoma severity based on
RNFL thickness and Advance Glaucoma Interventional Study (AGIS) score were also evaluated.
MATERIALS AND METHODS
A case control study was conducted in Hospital Universiti Sains Malaysia involving 33 of PACG
patients and 33 controls. A complete ocular assessment was done to confirm the diagnosis of
PACG. Evaluation of structural changes of RNFL of ONH was conducted using HD-OCT
(Carl’s Zeiss) with minimal signal strength more than 6/10.

XVIII
AGIS score was performed on a latest reliable reproducible of two consecutive Humphrey’s
visual field (SITA-Standard) 24-2 analysis. Pattern electroretinogram (PERG), 0.8º (48 min of
arc) and pattern visual evoked potential (PVEP), 0.25º (15 min of arc) were performed.
Independent t-test and ANCOVA analysis were used to compare the parameters. Pearson’s
correlation coefficient was used to correlate the parameters and RNFL thickness as well as AGIS
score.
RESULTS
There was statistically significant reduction in amplitude and latency of PERG in PACG patients
(p<0.001). There was also significant reduction in magnitude of amplitude (p<0.001) and shorten
of P100 latency in PVEP (p<0.001). PACG patients had significant smaller disc area compared
to controls (2.03±0.26, 2.27±0.35, p =0.001). There was also significant thinner RNFL analysis
in all quadrant of the ONH in PACG patients (p<0.001). RNFL thickness shown a significant
strong positive correlation with the PERG amplitude of N95 (r = 0.54, p = 0.001). AGIS score
showed a significant negative correlation between N35 (r = - 0.36, p = 0.041) and N95 (r = -
0.49, p = 0.003) of PERG. Similarly the positive and negative correlations were seen between
RNFL thickness and AGIS score respectively with PVEP. However it was not statistically
significant.
CONCLUSION
Visual electrophysiology showed reduced response in PACG patients. There was positive
correlation established between PERG and existing standard functional analysis and negative
correlation with structural analysis of ONH. PERG is the potential alternative tools for
evaluation of functional changes of ONH in PACG patients.
XIX
KEY WORDS
‘Primary angle closure glaucoma (PACG)’, pattern electroretinogram (PERG), pattern visual
evoked potential (PVEP), retina nerve fiber layer (RNFL), Advance Glaucoma International
Study (AGIS).

XIV
ABSTRAK
PENGENALAN
Glaucoma sudut tertutup primer (PACG) menyebabkan masalah kebutaan yang tinggi di
kalangan masyarakat di Asia. Diagnosa dan pemantauan penyakit ini masih lagi mencabar
disebabkan masalah perbezaan di antara struktur and fungsi di dalam penilaian kepala saraf optik
(ONH) dalam penyakit PACG. Electrophysiologi penglihatan (‘pattern electroretinogram
(PERG)’ dan ‘pattern visual evoked potential (PVEP)’ ) mempunyai kemampuan dalam
mengesan kerosakan fungsi cell-cell ganglion retina (RGC). Ia mempunyai potensi sebagai ujian
pelengkap kepada ujian struktur dan fungsi ONH sekarang bagi memantau penyakit glaucoma
secara amnya dan penyakit PACG secara khusus.
OBJEKTIF
Penkajian keatas maklum balas ujian electrophysiology penglihatan dan lapisan urat saraf retina
(RNFL) dalam pesakit PACG. Korilasi di antara ujian tersebut dengan ketebalan RNFL dan
‘Advance Glaucoma Interventional Study (AGIS)’ turut dikaji.
METODOLOGI DAN BAHAN
Satu kajian pengawalan kes telah dijalankan di Hospital University Sains melibatkan 66 orang
subjek daripada pesakit PACG dan normal. Pemeriksaan lengkap dijalankan bagi pengesahan
penyakit PACG. Ujian struktur RNFL di ONH dilakukan menggunakan Cirrus HD-OCT (Carl
Zeiss Meditec Inc, USA) dengan kekuatan penunjuk yang bagus (≥ 6/10), PERG (size

XV
‘checks’0.8º) dan PVEP (size ‘checks’0.25º) dilakukan oleh juruteknik yang terlatih. Analisa
dilakukan dengan menggunakan ‘Independent t-test’, ‘ANCOVA’ dan ‘Pearson’s correlation
coefficient’.
KEPUTUSAN
Terdapat signifikasi statistik pengurangan ‘amplitude’ dan ‘latency’ PERG dalam pesakit PACG
(p<0.001). Terdapat juga signifikasi statistik pengurangan keamatan pada ‘amplitude’ (p<0.001)
dan pengurangan tempoh ‘latency’ (p<0.001) P100 bagi ujian PVEP. Pesakit PACG
menunjukkan terdapat signifikasi statistik mempunyai saiz ‘disc area’ yang lebih kecil
berbanding normal (2.03±0.26, 2.27±0.35, p =0.001). Terdapat signifikasi statistik pengurangan
ketebalan RNFL di setiap bahagian pada ONH dalam pesakit PACG (p<0.001). Ketebalan RNFL
menunjukkan signifikasi statistik korilasi yang positif dengan ‘latency’ N95 (r = 0.54, p = 0.001)
daripada PERG. Skor AGIS pula menunjukkan signifikasi statistik korilasi yang negatif dengan
N35 (r = - 0.36, p = 0.041) dan N95 (r = - 0.49, p = 0.003) daripada ujian PERG. Positif dan
negatif korilasi juga didapati di antara ketebalan RNFL dan skor AGIS bagi ujian PVEP di
kalangan pesakit PACG, namun tiada signifikasi statistik ditunjukkan.
KESIMPULAN
Electrophysiology penglihatan menunjukkan perubahan yang signifikasi tehadap para pesakit
PACG. Terdapat signifikasi statistik korilasi yang positif di antara PERG dan penilaian struktur
RNFL pada ONH dan juga signifikasi korelasi yang negatif dengan ujian penilian fungsi medan
penglihatan yang kebiasaanya dilakukan. PERG mempunyai potensi sebagai ujian alternatif
bertujuan memantau perubahan pada fungsi saraf (ONH) pada pesakit PACG.

XVI
KATA KUNCI
‘Primary angle closure glaucoma (PACG)’ , pattern electroretinogram (PERG), pattern visual
evoked potential (PVEP), lapisan urat saraf retina (RNFL) Advance Glaucoma International
Study (AGIS).
1
Introduction
1.1 Primary angle closure glaucoma (PACG).
Primary angle closure glaucoma (PACG) generally affects more Asians as compared to their
Western counterparts. However, primary open angle glaucoma (POAG) is still the predominant
type of glaucoma in Asian population (Hu Z et al., 1989; Quigley HA et al., 1996; Foster PJ et al.
2002). Quigley HA et al. (2006) had reported that total of 60.5 million people with glaucoma in
2010 and expected the prevalence will increase to 79.6 million by 2020. From the same report, in
2010, 26% of glaucoma was angle closure with Asians and women represented 87% and 70% of
those with angle closure. They also reported on bilateral blindness involved 3.9 million people
with angle closure in 2010 and expected to increase to 5.3 million people in 2020. Shen et al.
(2008) in the Singapore Malay Eye Study had reported the epidemiological review of PACG in
South-East Asia, with highest prevalence noted in Myanmar, followed by Thailand and
Singapore.
The term PACG is defined as present of progressive optic neuropathy resulted from degenerative
changes of retina ganglion cells (RGC) and present of occludable angle structures of more than
270⁰, associated with raised intraocular pressure (IOP) (Foster PJ et al. 2002). This could explain
why the symptoms are more manifest in PACG rather than POAG. Should a rise in IOP happen
suddenly, patient would experience acute attack or also known as acute PACG which is an
emergency. Primary angle closure (PAC) and primary angle closure suspect (PACS) is another
spectrum of the disease. PAC is by definition is an eye without glaucomatous optic neuropathy

2
but with occludable angle structures of more than 270⁰ withfeatures indicating present of
trabecular obstruction by the peripheral iris has occurred, such as high intraocular pressure as
well as peripheral anterior synechiae, iriswhorling (distortion of the radially orientated iris
fibres), glaucomfleken and excessive pigment deposition on the trabecular surface (Foster PJ et
al. 2002). While PACS is an eye with occludable angle structures of more than 270⁰ only, and
does not have glaucomatous optic neuropathy or evidence of trabecular obstruction occurred
(Foster PJ et al. 2002).
The pathogenesis of PACG involves either the pupillary block or non-pupillary mechanism, with
the both mechanisms having the risk of acute attack, although the pupillary block is still the
commonest mechanism observed (Robert N. et al., 2014). Obstruction of aqueous flow at the
pupillary area had caused accumulation of fluids behind the iris which precipitated posterior
pushing mechanism, thus iris convexity is increased hence created a shallow anterior chamber
and obstructed the aqueous of outflow pathway. Previously Quigley HA et al. (1984) and Marx
MS et al. (1998) had demonstrated involvement of magnocelluar and parvocellular pathway
damage in glaucoma. They concluded that magnocellular was exclusively affected while the
parvocellular was spared, with the X cells subgroup were more affected than the Y cells. Their
experimental models had proven it especially in early stage glaucoma and those with history of
angle closure. In chronic progressive disease especially POAG they reported involvement of
both pathways. However recent review by Bach M et al. (2008) this pathway involvement theory
had showed inconsistent reports from few latest studies. They also highlighted the issues
regarding the early blue deficits in glaucoma cannot readily be explained with the involvement of

3
magnocellular pathway alone. So, they had suggested studying more on isolation of retinal
ganglion cell activity in glaucoma patients.
During an acute angle closure attack, a very high intraocular pressure (usually more than
30mmHg) is recorded. It is also associated with other clinical symptoms such as very marked
ocular pain, nausea, vomiting, and intermittent blurring of vision with haloes in the patient
(Robert N. et al., 2014). Other than that, the increased IOP level has trek capability of causing
mechanical structural damage to the RGC and nerve fibre layer (NFL) (Boland et al., 2007).
Nevertheless, ocular perfusion to the optic nerve head is possibly compromised by affecting its
auto-regulation earlier during the acute attack.
Other ocular risk factors for angle closure include a small eye with short axial length and with
crowded anterior segment, a shallow central anterior chamber depth, and more anteriorly
positioned thicker lens had been reported in several studies (Sakai H et al., 2005; Lavanya R et
al., 2008; Nongpiur ME et al. 2011). A recent study by Vithana EN et al. (2012) reported a
genome-wide association study which included more than 20 000 individuals from 7 countries. 3
new genetic loci for angle closure: was discovered: rs11024102 at PLEKHA7, rs3753841 at
COL11A1 (HGNC:2186), and rs1015213 located between PCMTD1(HGNC:30483) and ST18
(HGNC:18695) on chromosome 8q. The findings demonstrate that genetically there is a
difference between patients with PACG and POAG. However, the definite role and
phenotypically behaviour of these genes towards retinal ganglion cells (RGC) and optic nerve is
still under study.

4
1.2 Natural of Primary angle closure glaucoma (PACG)
Lowering of intraocular pressure (IOP) is the only proven strategy in treating glaucoma as it is
the only modifiable risk factor in glaucoma (Boland MV et al., 2013). In Early Manifest
Glaucoma Trial which is a multicentre randomised control trial evaluating progression of
glaucoma in early glaucoma patients with and without treatment (Heijl A et al., 2002). The study
showed that after 6 years of follow-up, the progression is more in patients without treatment as
compared to those in the treatment group (62% vs 45%). The progression risk was doubled in
those without treatment. This study however, was conducted on patients with POAG only.
In angle closure glaucoma, several treatment options can be instituted to deepen the anterior
chamber and/or widen the outflow pathway at the angles. During an acute attack, definitive
treatment that is laser peripheral iridotomy (LPI) or clear lens extraction (Lam DSC et al., 2007)
is performed besides the standard treatment of topical IOP-lowering agent medications. Aung T
et al. (2001) in their prospective study of acute angle closure in Asian had reported up to 72%
success rate with LPI performed during an acute attack. An earlier study by Alsagoff Z et al.
(2000) also reported a high success rate of LPI in treating an acute attack; however the presence
of extensive peripheral anterior synechiae and preceded glaucomatous optic neuropathy had
reduced its IOP lowering effect. Argon laser iridoplasty is an alternative to LPI in acute attack,
and should any of these fail to control the IOP, surgical peripheral iridotomy or anterior chamber
paracentesis are the other options available (Robert N. et al., 2014). However, the complication

5
of decompression retinopathy needs to be addressed should these procedure are performed
(Fechtner RD et al., 1992;Dudley DF et al., 1996;Nah G et al. 2000).
A paper by Liza-Sharmini AT et al. (2014) which studied the clinical presentation, severity and
progression of primary angle closure in local Malays, had reported almost 50% of their patients
had history of an acute attack, while, 58% of their patients were diagnosed with PACG at initial
presentation with incidence of blindness at almost 30%. Nevertheless, the study had concluded
that chronic and asymptomatic PACG in local patients had contributed to more severe stage of
PACG during initial ophthalmology visit due to their late presentation. The incidence of
blindness in PACG reported in the study however, had almost similar incidence to those of
ethnic Chinese in Singapore (Foster PJ et al., 2000) as well as the Indians in Southern India
(Vijaya L et al., 2008). Robert N. et al. (2014) in their review had also reported only a third of
PACG patients presented acutely with an angle closure attack and conclude that PACG is
predominantly an asymptomatic disease with patients often unaware until the later stages of the
condition. Thus, PACG patients are at a potentially higher risk of blindness when this spectrum
is taken into consideration.

6
1.3 Progression of primary angle closure glaucoma (PACG)
In monitoring PACG, the concept is the same as monitoring other type of glaucoma, which is by
monitoring anatomical structural abnormality of optic nerve head retinal nerve fiber layer
(RNFL) and visual field functional damage resulting from the disease (Chen HY et al., 2011;
Wollstein G et al., 2012) . Quantifying the optic nerve head changes is a great challenge, as most
of PACG patients have short axial length. This is associated with crowded and variable optic disc
morphology (Boland MV et al., 2013). Previously, the standard procedure of evaluating optic
nerve head using vertical cup disc ratio ( VCDR) is by direct visualization of the optic disc
through direct ophthalmoscopy, slit lamp or binocular indirect ophthalmoscopy, or by
stereoscopic picture from fundus photography (Chen HY et al.,2011; Wollstein G et al.,2012).
All these methods are very subjective and entirely operator dependent. In an overcrowded disc,
there is even more tendency to underestimate the VCDR by using the above methods.
With rapid advances in technology, ocular imaging modalities such as Optical Coherence
Topography (OCT) and Heidelberg Retinal tomography (HRT) allow sensitive and accurate
early detection of structural changes in optic nerve head RNFL (Martus P et al.,2000; Arkin RV
et al.,2010; Chen HY et al., 2011). However, these tests have also been reported to have a
structural-functional assessment discrepancy between optic nerve head RNFL thickness and the
visual field test (Martus P et al.,2000; Arkin RV et al.,2010). Another later study by Wollstein G
et al. (2012) in their study evaluating the threshold value in structural assessment and visual field
had reported that visual field lost is demonstrated only after almost 20% to 40% structural
damage has occurred.

7
Besides posterior segment structural and functional assessment, Nongpiur ME et al. (2011)
highlighted that anterior segment assessment has greater significance in PACG as compared to
POAG. Smaller anterior chamber width, area and volume, thicker irides with greater iris
curvature, and lens vault is significant in PACG, and predispose the patient to have both acute
and acute on chronic angle closure.
Several imaging methods that can be used to objectively assess eyes for the presence of angle
closure have been recently developed. Ultrasound biomicroscopy (UBM) allows assessment of
anterior chamber together with visualization of posteriorly located structures such as the ciliary
body, lens zonules, and the anterior choroid. Another imaging is anterior segment optical
coherence tomography (AS-OCT), which is a noncontact imaging device that acquires high-
resolution cross-sectional images of the anterior chamber that allows rapid measurement of
anterior segment parameters. These devices have been reported to have a higher rate in
diagnosing angle closure as compared to conventional gonioscopy (Sakata LM et al.,2008; Wong
HT et al., 2009).

8
1.4 Optical Coherence Tomography (OCT) in PACG
Optical coherence tomography (OCT) and scanning laser ophthalmoscopy have become
important diagnostic tools for detection of glaucoma especially both in screening and in the early
stage (Parikh RS et al., 2007; Alencar LM et al., 2008; Medeiros FA et al., 2008; Leite MT et al.,
2010). The commonly used Cirrus Spectral Doman OCT (HD-OCT) has been demonstrated to
be a consistent and clinically more accurate tool to determine optic disc parameters in a few
studies (Manassakorn A et al., 2007; Sharma A et al., 2008; Leung CK et al., 2011).
Due to differences in ocular biometry, pathophysiology and IOP influence, many clinicians and
researchers had thought the effect to and the characteristic of optic neuropathies is different in
PACG as compared to other subtype of glaucoma. Douglas GR et al. (1975) in a study of 22
persons, accessing the morphological changes in optic nerve head (ONH) reported that after
acute attacks of PACG, the ONH was pale and not deeply excavated; however for those same
PACG patients after longer and more modest IOP elevation, the ONH characteristics were more
similar to eyes with POAG. In contrast, Shen SY et al. (2006) reported in their study that the
ONH features following acute angle closure were similar to eyes with POAG.
9
Previously, Sihota et al. (2005 and 2006) in the two studies had evaluated the structural changes
in ONH analysis to differentiate between POAG and PACG. They had studied the difference
between ONH parameters measured using OCT as well as HRT to compare normal, POAG, and
PACG eyes in an East Indian population. They had reported OCT measurement demonstrated
significant differences in PACG group, with less rim area, disc cupping area, cup volume, cup-
to-disc (C/D) ratios, and the optic disc cup shape as compared to POAG and normal. This is
perhaps the evidence that PACG exclusively has a different ONH structural as compare to other
glaucoma subtype.
OCT allows direct measurement of RNFL thickness by in vivo visualization of the retina and
optic nerve head (ONH) (Sommer A et al., 1991; Chen TC et al., 2008). Budenz DL et al.,
(2005) have studied the sensitivity and specificity of OCT measurement in glaucoma. From their
study, it is concluded that OCT measurement of RNFL is accurate in glaucoma with visual field
defect. Later, Boland MV et al. (2008) in their study comparing POAG and PACG by OCT
parameters had reported the mean total RNFL in PACG was thicker compared to POAG. Based
on this study finding, the authors highlighted the possibility of differences in the characteristics
of OCT parameters in PACG. However, further longitudinal study considering confounding
factors such as age and severity of the disease should be done.

10
1.5 The visual field defect and Staging of Glaucoma
Perimetric glaucoma may be graded on their visual field sensitivities as measured by standard
automated perimetry (SAP) based on the depth and number of defective points, mean deviation
(MD), pattern standard deviation (PSD) and the most recent, visual field index (VFI). This is
important in staging the severity of glaucoma, monitoring the progression and assisting clinical
investigators who are studying new forms of treatment response in glaucoma (Speath GL et al.,
2005).
Rhee K et al. (2001) had done a comparative study between visual field defects in POAG and
PACG patients. The study had reported there is a different pattern of visual field defects noted
between the two. They had concluded that PACG has a tendency towards more diffuse damage
rather than localised defects as seen more commonly in POAG. The study however, only
reported in early and moderate stage of glaucoma; advanced stage patients were not studied.
Later, Gazzard G et al. (2003) had conducted a study assessing the relation between IOP and
visual field defect in PACG and POAG. This study found a stronger association between pre-
treatment IOP and visual field defect in PACG than in POAG. Nevertheless, Boland MV et al.
(2008) had stated that there was no correlation established between field defects in both POAG
and PACG with the ONH structure.

11
The Advanced Glaucoma Intervention Study (AGIS) investigators used a graduated scoring
system (0 to 20 points) to denote the visual field deterioration in their patients (AGIS
investigators, 1994). The score is obtained from the total deviation plot of Humphrey Visual
Field Statpac2 (24-2). Once a visual field point reached the minimal amount of sensitivity
depression, that particular point is considered defective, and then a score will be given (Mills et
al., 2006). This scoring system however, is impractical for routine clinical use. Presence of
media opacity such as significant cataract or cornea opacity can give a false score, due to
defective point changes detected in total deviation. Moreover, early diffuse glaucomatous
changes can be missed by this scoring (Susanna Jr. R et al., 2009).
12
1.6 Pattern Electroretinogram (PERG) and glaucoma.
In glaucoma, visual field losses are only demonstrated after at least 25-30% of retina ganglion
cells (RGC) are lost. (Quigley HA et al., 1999;Kerrigan–Baumrind LA et al.,2000). This has
given rise to structural-function discrepancy especially in the early stage of the disease. With the
ability of PERG ability to detect compromised and lost RGC, diagnosis of the early stages of
glaucoma could perhaps be established earlier to prevent the delay in starting treatment, hence
reducing the risk of blindness (Parisi V et al., 2001 and 2006; Bach M et al., 2007) . The role of
PERG in glaucoma is in early detection, monitoring the disease progression and severity as well
as perhaps helping investigators and clinicians to better understand the pathophysiology of this
condition (Bach M et al. 2007).
The few initial papers reporting on PERG recordings in glaucoma patients showed a significant
latency reduction with prolonged amplitude in glaucomatous eyes (May JG et al., 1982; Bobak P
et al., 1983; Wanger P et al. 1983; Papst N et al., 1984; Wanger P et al., 1985). In a glaucoma
patient, it is expected that the positive amplitude (P50) and negative (N95) component will be
equally affected in PERG recording (Bach M et al., 1988). Viswanathan et al. (2000) in their
study had reported a 60% and 23% reduction of the amplitude P50 and N95 responses
respectively.

13
However, Hood et al. (2005) reported there were overlaps of controls and patients’ P50 and N95
responses, while more pronounced changes observed in latency of P50-N95 and index ratio of
N95/P50 for glaucoma patients. The variable response in their study was found to be influenced
by the wide distribution of disease severity as well as the difference in PERG recording strategy
used.
The knowledge on PERG in glaucoma had been further expanded in a study by Parisi V et al.
(2006) who studied the response of PERG in patients with glaucoma and ocular hypertension
(OHT). In that study, they reported significant changes in both the latency of P50 and amplitude
of N95 in POAG and OHT patients as compared to normal patients. The study also reported a
significant correlation of PERG with visual field defect based on Humphrey’s visual field
analyser (HFA). The glaucomatous visual field defect was reported based on the mean diffrent
(MD (dB)) in that study. At the end of their study, they had concluded that PERG had a potential
diagnostic ability to diagnose early stage of glaucoma, although there was no visual field defect
in patients with clinically evident glaucomatous optic disc changes. Bach M et al. (2007)
reported that appropriate recording techniques and paradigms of PERG had a sensitivity and
specificity of more than 70% in detecting early glaucoma and had a potential to identify eyes at
risk a year earlier before the field damage manifest.

14
However, PERG is still not routinely used in daily clinical practice in managing glaucoma
patients. It requires rigorous and standardised recording techniques plus experienced and trained
operators to achieve reliable and reproducible results (Bach M et al., 2007). Efforts are being
undertaken to address these issues. The International Society for Clinical Electrophysiology of
Vision (ISCEV) had, in 2012, published a guideline on PERG. Other electrophysiological test
such as multifocal ERG and multifocal PERG together with reporting PERG based on index
amplitude and latency of small to large check are now being extensively studied (Bach M et al.,
2013; Roa A 2014).
1.7 Pattern Visual Evoked Potential (PVEP) in Glaucoma.
Visual evoked potential (VEP) response is generated by an electrical potential gradient recorded
between the scalp and the eye in response to light (flash VEP) or pattern stimulation (PVEP).
PVEP has the ability to detect functional visual integrity within the visual pathway from inner
retina layer to the visual cortex (retino-cortical response); however, it is less useful in
postchiasmatic disorders (Celesia GG et al., 1993; Odom JV et al., 2004; Odom JV et al., 2010).
PVEP is the most preferred test in clinical disease due to its relatively low variability of
waveform & peak latency both within a subject and over the normal population.
Odom JV et al. (2010) had established ISCEV latest guideline (2009) to perform standard
method of recording PVEP. The guidelines provide comprehensive instructions in eliminating
non-pathophysiologic parameters such as pattern size, pattern contrast, mean luminance, signal

15
filtering, patient age, refractive error, poor fixation, and miosis in recording PVEP as the reading
will be affected. The pattern reversal VEP consists of a prominent positive component at
approximately 100ms (P100) preceded and followed by negative components, N75 and N135
(Holder GE, 2004).
Several studies have reported on alterations in PVEP recording with reduced response observed
in glaucomatous eyes (Marx MS et al., 1987; Falsini B et al., 1991; Parisi V et al. 1997). The
results obtained were described as consequences of the dysfunction of the innermost retinal
layers resulting in impairment of neural conduction in the optic nerve and in the whole
postretinal visual pathways (Marx MS et al., 1987; Falsini B et al., 1991; Parisi V et al. 1997;
Odom JV et al., 2010). Two previous animal studies by Dandona L et al. (1991) and Weber AJ et
al. (2000) in which glaucoma had been induced demonstrated abnormalities both histologically
and functionally involving the lateral geniculate nucleus. Subsequently Parisi V et al. (2001)
reported a functional derangement in glaucoma can be demonstrated by PERG. This had include
a reduced in PERG response resulting from the reduction in the magnitude and delayed timing of
the input to the visual cortex.
16
To our best knowledge, there is limited study available reporting on PVEP response in PACG
patients. Mitchell KW et al. (1989) had conducted a study on PVEP response specifically on 29
patients’ eyes with history of acute angle closure. The study had reported an increased response
in P100 in PACG patients compared to normal, while the PVEP amplitude demonstrated a
delayed response. Another study done by Parisi v et al. (2006), also studied the PVEP parameters
response in glaucoma, but their study samples were POAG and OHT patients.
They had reported significant reduction in all of the PVEP parameters response (including P100)
in both groups, which is in contrast to PACG patients’ response as outlined by Mitchell KW et
al. (1989). Perhaps further longitudinal study involving the subgroups of glaucoma will enable
us to see more consistent and established PVEP response in this disease.

17
1.8 Rationale of this study
Optic neuropathy is the main criteria to distinguish a PACG from primary angle closure. Once
PACG is diagnosed, the risk of blindness is relatively high, and thus a proper mode of
monitoring is needed to prevent blindness. Structural monitoring with latest technology from
either SD-OCT or HRT III has gained popularity between both clinicians and researchers,
nevertheless with further functional monitoring of visual field defect by HFA has helped in terms
of staging the disease as well as monitoring the optic neuropathy.
The structural-function monitoring in glaucoma however had been reported to have some highly
variable discrepancies between them. The challenge is more towards the diagnosis of the early
stages of PACG, its progression as well as severity. Visual electrophysiological tests, which has
the ability to detect and monitor RGC function, changes in early impairment rather than only
when it is lost. This can perhaps give added value in terms of those limitations and also to
determine the visual prognosis in severe PACG patients.
This study focuses on the visual electrophysiological changes in PACG patient and to establish
any correlation between it with the glaucoma severity based on overall RNFL thickness (OCT)
as well as AGIS score from visual field defect. Perhaps this test can be a complimentary test to
OCT and Humphrey visual field in managing PACG patients.

18
2.0. OBJECTIVE
2.1 General Objective
To investigate the relationship between the visual electrophysiology test with structural
and functional status of PACG patients.
.
2.2 Specific Objectives
1. To compare pattern VEP changes between PACG patients and control group.
2. To compare pattern ERG changes between PACG patients and control group.
3. To compare mean RNFL thickness using OCT between PACG patients and control
group.
4. To determine the correlation between PVEP and PERG measurements with RNFL
thickness in PACG patients
5. To determine the correlation between PVEP and PERG measurements with AGIS score
in PACG patients.

19
2.3 Research questions
1. Is there any difference between PVEP measurement in PACG patients compared to control
group?
2. Is there any difference between PVEP measurements in PACG patients compared to control
group?
3. Is there any difference between RNFL analysis in PACG patients compared to control group?
4. Is there a correlation between PVEP and PERG changes with RNFL thickness in PACG?
5. Is there a correlation between PVEP and PERG changes with AGIS score in PACG?
20
3.0 METHODOLOGY
3.1 Research Design:
A case control study was the research design for this study.
3.2 Population, Place and period of study:
3.2.1 Study population:
PACG patients who attended the glaucoma clinic at Hospital Universiti Sains Malaysia
(HUSM), Kubang Kerian.
3.2.2 Place of study:
Ophthalmology Clinic, HUSM
3.2.3 Duration of Study:
This study was carried out for from June 2012 until May 2014. (2 years)
3.3 Sampling Method:
3.3.1 Selection Criteria:
Convenient sampling was applied on PACG patients under HUSM eye clinic follow up
who fulfilled the criteria of this study.

21
3.3.2 PACG Group Inclusion Criteria
Age more than 40 years old
Patient diagnosed with Primary Angle Closure Glaucoma (PACG) based on
gonioscopy finding and evidence of glaucomatous optic neuropathy from RNFL
thickness defect (OCT) and Humphrey’s visual field (HVF), with or without history
of acute attack.
Availability of two reliable, reproducible (HVF) test SITA standard 24-2.
Availability of OCT image with signal strength more than 6/10.
Patient who understand the nature of study and willing to sign the informed
consent form.
3.3.3 PACG Group Exclusion Criteria
Primary angle closure, primary angle closure suspect and all secondary angle
closure glaucoma.
History suggestive optic neuropathy and optic disc abnormality other than
glaucoma.
Glaucoma patients with concurrent other pre-existing retinopathy
Patient who had previous post pan retina photocoagulation or retina surgery.
Patient with impaired media opacity including cornea scar, significant cataract
and vitreous hemorrhage that effected quality of OCT image.
Pervious cerebral vascular accident (CVA) or intracranial lesion.
Refractive error more than -5D or whose axial length more than 25mm.
Refractive error more than +3D or whose axial length less than 21mm.

22
3.3.4 Control Group Inclusion Criteria
Age more than 40 years old.
Subjects who has normal ophthalmic examination and normal visual field.
Intraocular pressure below 21mmHg.
Goniscopy grade IV all quadrants.
AGIS score of 0 from two reliable, reproducible (HVF) test SITA standard 24-2.
Availability of OCT image with signal strength more than 6/10.
Patient who understand the nature of study and willing to sign the informed
consent form.
3.3.5 Control Group Exclusion Criteria
Family history of glaucoma.
Glaucoma suspects patients.
Patient on prolonged steroid therapy.
History suggestive optic neuropathy and optic disc abnormality.
History of ocular trauma.
Myopic more than -5D or whose axial length more than 25mm.
Previous cerebral vascular accident (CVA) or intracranial lesion.
Impaired media opacity including cornea scar, significant cataract and vitreous
hemorrhage.

23
3.4 Sample Size Estimation
Sample size calculation determined by using PS (power and sample size) Software 2010.
The calculation is done base on t-test, 2 mean (independent). Sample size done was base
on each specific objective.
1) To determine PVEP parameters in PACG patients and Control:
Confident interval (C.I) α = 0.05, study power (β) = 0.8 (80%), detectable difference
between affected patient and unaffected patient (δ) = 3.0, Standard deviation (σ) = 3.7
(Keith w Mitchell at el 1989) and ratio PACG : control (1:1), M=1. n=25, total sample
needed (n+10% drop out) will be 28 samples.
2) To determine PERG parameters in PACG patient and Control:
Confident interval (C.I) α = 0.05, study power (β) = 0.8 (80%), detectable difference
between affected patient and unaffected patient (δ) = 0.3, Standard deviation (σ) = 0.4
(Rachel at el 2009) and ratio PACG: control (1:1),M=1.n=29, total sample needed
(n+10% drop out) will be 32 samples.
3) To determine RNFL analysis in PACG patients and Control:
Confident interval (C.I) α = 0.05, study power (β) = 0.8 (80%), detectable difference
between affected patient and unaffected patient (δ) = 5.1, Standard deviation (σ) = 6.9
(Hsin-Yi Chen et al 2011) Ratio PACG: control (1:1), M=1 n=30, total sample needed
(n+10% drop out) will be 33 samples.

24
For our fourth and fifth specific objectives; correlation electrophysiology test with RNFL
analysis, and AGIS score, to our best knowledge there were limited previous study done.
The sample size calculation was based on above calculation. Since the largest sample
obtained was 33 samples, we had decided to recruit 33 samples on each arm for each of
our specific objective.
3.5 Definition of Terms.
a) The Primary Angle Closure Glaucoma (PACG)
The Primary Angle Closure Glaucoma (PACG) criteria are based on consensus of
International Society Geographical & Epidemiological Ophthalmology (ISGEO)
definition. (Foster et al., 2002) which stated an eye with an occludable drainage angle
and features indicating that trabecular obstruction by ≥270° of the peripheral iris has
occurred, such as peripheral anterior synechiae, elevated intraocular pressure, iris
whorling (distortion of the radially orientated iris fibres), “glaucomfleken” lens opacities,
or excessive pigment deposition on the trabecular surface with presence of glaucomatous
optic disc and visual field damage.