the cost and extent of corruption and weak governance · correspondingly, the world economic forum...
TRANSCRIPT

1
Market BriefVolume 4 • Issue 40For the period ofSept. 16 to 20, 2013
The findings of this brief reflect the opinions of the authors and not those of the African Development Bank, its Board of Directors or the countries they represent.
Mthuli NcubeChief Economist & Vice President ECON [email protected]+216 7110 2062
Charles Leyeka LufumpaDirectorStatistics Department [email protected]+216 7110 2175
Steve Kayizzi-Mugerwa DirectorDevelopment Research Department EDRE [email protected] +216 7110 2205
Victor MurindeDirectorAfrican Development Institute [email protected]+ 216 7110 2072
Supervised by Steve Kayizzi-Mugerwa and Abebe Shimeles [email protected] Tel.: +216 7110 2420Manager - Research Partnerships Division
Prepared by the following staff :
Adeleke Oluwole [email protected].: +216 7110 2551
Gilbert [email protected].: +216 7110 1647
Dawit [email protected].: +216 7110 1725
Nesrine Ressaisi [email protected].: +216 7110 1520
Key Points
• Weekly theme: « The cost and extent of corruption and weak governance»
• Global equity markets made gains spurred by the latest employment and growth figures from the UK and the US
The cost and extent of corruption and weak governance
It is widely accepted that the quality of institutions and governance are crucial determinants of a country’s economic performance. Corrupt practices distort markets and stifle economic growth and sustainable development including robbing countries of critically needed resources. Overall, corruption reduces efficiency and increases inequality. Estimates show that the cost of corruption amounts to more than 5 percent of global GDP (USD 2.6 trillion) with more than USD 1 trillion paid in bribes each year1.
The overall effect of corruption on the likelihood of FDI taking place is negative. For instance2, a recent IMF study has shown that investment in corrupt countries is almost 5 percent less than in countries that are relatively corruption-free. Correspondingly, the World Economic Forum estimates that corruption increases the cost of doing business by up to 10 percent, on average. Thus, it imposes a significant negative impact on a country’s capital productivity.
While the extent and cost of corruption differ across countries, the brunt of its effect is more pronounced in Africa. Although there have been significant improvements in governance in some African countries during the past decade, most African countries have not made significant headway in reforming their governance systems into tools of wealth creation and economic growth.
According to Transparency International’s (TI, 2012) Corruption Perception Index, Africa remains the most corrupt region in the world with corruption, rent seeking and public financial malfeasance playing a major role in hindering sustainable growth. Similarly, a 2013 study by the African Development Bank and Global Financial Integrity showed that the continent lost between USD 1.2-1.4 trillion in illicit financial outflows over the period 1980-20093. Real illicit ouflows from Africa increased from USD 42.9 billion in 1980 to USD 74.2 billion in 2009. The study showed that illicit financial outflows in the period varied by region with Central Africa, North Africa and Southern Africa accounting for 37 percent, 31 percent and 27 percent of cummulative outflows.
Source: Global Corruption Barometer (2013)
Figure 1: % of people who paid bribes to access public services.
Market Brief Volume 4, Issue 40; For the period of September 16 to 20, 2013
Stock MarketsGlobal Markets
Global markets ended the week on a positive note. UK’s Office for National Statistics (ONS) confirmed its estimate of 0.7 percent growth in the three months to June and upgraded the first quarter from 0.3 percent to 0.4 percent. Each of the three key sectors – services, production and construction have all expanded. Similarly, reports from the US Department of Commerce showed that the US economy grew at an annual rate of 2.5 percent in the second quarter from 1.1 percent in the first quarter. These factors contributed towards favourable global economic outlook. The DJIA gained 0.5 percent while the CAC40 and Nikkei 225 Index edged higher 2.2 percent and 2.3 percent, respectively.
African Markets
African markets were also lifted by positive global market news, the South African All Share Index rose by 1.1 percent as global investors continue their holdings of emerging markets assets. The US FED’s decision to postpone the phasing-out of quantitative easing programs continued to stimulate interest in emerging markets. Similarly, the Nigerian composite index (NGSE All-share) gained 0.3 percent as a result of the Central Bank’s decision to lower rates. In Kenya, large year-on-year earnings by East African Breweries (28 percent) following a 54 percent advance in 2012 led to gains in the NSE 20 (0.1 percent).
Corruption not only lowers the tax-GDP ratio but also causes long-term damage to the economy by detracting investment, increasing the size of the informal economy, and distorting tax structures. The African Development Bank4 (AfDB) estimates corruption costs Africa up to 50% in lost tax revenues and over USD 30 billion in aid, annually. For instance in Uganda, the AfDB estimates losses from illicit tax incentives and exemptions at 2 percent of GDP, or equivalent to UShs 690 billion (USD 272 million) in 2009/10.
Several studies find evidence that high and rising corruption exacerbates income inequality and poverty. A worsening in the corruption perception index of a country by one standard deviation is associated with an equivalent increase in the GINI coefficient of income inequality as a reduction in average secondary schooling of 2.3 years5. Similarly, a one-standard deviation increase in the growth rate of corruption reduces income growth of the poor by 7.8 percentage points, annually. AfDB estimates indicate that lower income households in Africa spend on average 2-3 percent of their income on bribes, while high income households spend an average of 0.9 percent.
Corruption hits the poorest segments of the population the hardest since they are the most dependent on basic services. A 2008 TI survey of 22000 households in India found that the poor have paid in excess of USD156 million to access 11 supposedly free services including health services, schools and utilities providers. TI’s 2010 survey of primary education management in Ghana, Madagascar, Morocco, Niger, Senegal, Sierra Leone and Uganda showed that 44 percent of households surveyed paid illicit fees for children to go to school. Average illicit payments per child, per-school year were estimated at USD 4.16.
Country specific public opinion surveys that explore the dynamics of bribery confirm the scale and extent of bribery is by no means petty. The East African Bribery Index, for example finds that the average bribe paid for land services is more than USD 100 in Kenya and the average value of bribe paid to the Judiciary in Uganda is more than USD 200. The recent Global Corruption Barometer shows that 12 of the 13 countries with the worst record of bribery are in Africa. For instance, more than 6 out of 10 people in Sierra Leone, Liberia and Kenya claim to have paid bribes to access public services.
These figures illustrate the widespread and costly nature of corruption in Africa. While these results are indicative of the general climate on the continent a few countries fare reasonably well in international comparisons. These include Botswana, Tunisia, Mauritius, Namibia and Rwanda. Implementing effective fraud and corruption control measures should be a priority in the pursuit of wealth creation and economic growth. Sustaining economic growth requires that African countries learn from best practices in institutional development.
1. World Economic Forum (2013), Global Agenda Council on Anti-Corruption & Transparency.
2 Javorcik and Wei (2009) and Hakkala et al. (2008)
3 AfDB, GFI (2013), Illicit Financial Flows and the Problem of Net Resource Transfers from Africa: 1980-2009. May 2013
4 AfDB (2010), Corruption and fragile institutions: mutual accountability between Africa and its partners.
5. Sanjeev Gupta, Hamid Davoodi and Rosa Alonso-Terme (2002), Does corruption affect income inequality and poverty, Economics of Governance, Vol 3., Issue 1, pp23-45.
3
Commodity Markets
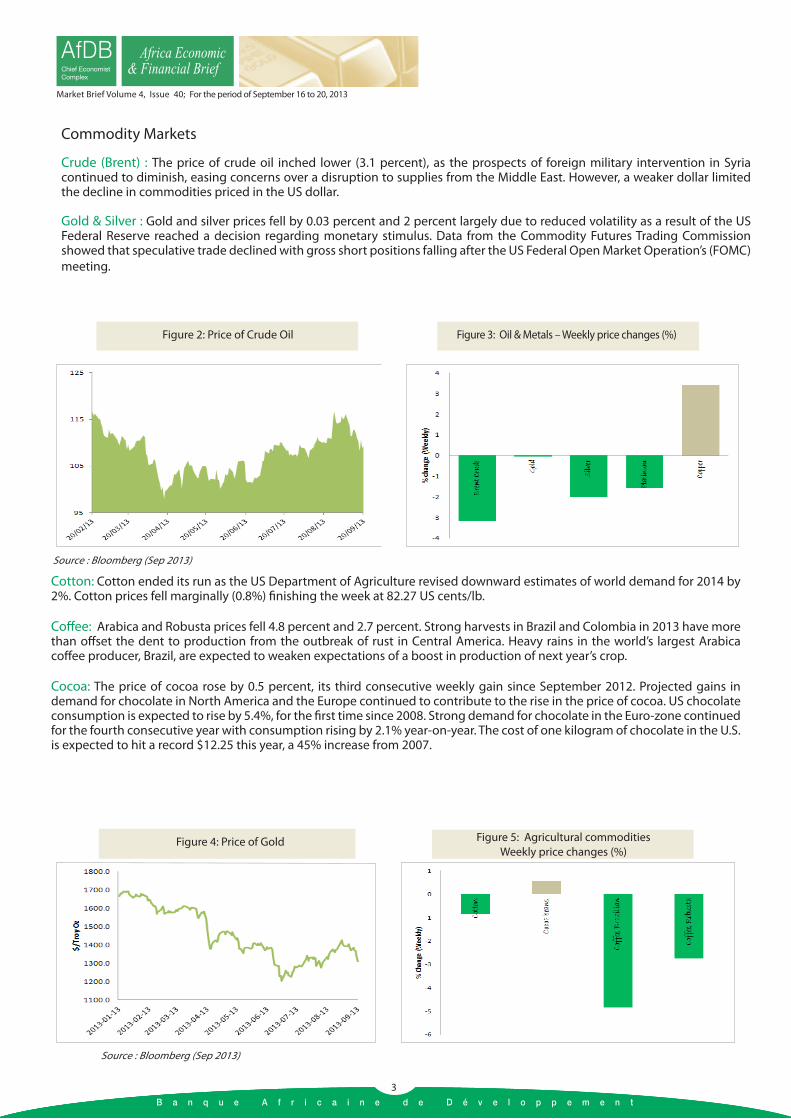
Crude (Brent) : The price of crude oil inched lower (3.1 percent), as the prospects of foreign military intervention in Syria continued to diminish, easing concerns over a disruption to supplies from the Middle East. However, a weaker dollar limited the decline in commodities priced in the US dollar.
Gold & Silver : Gold and silver prices fell by 0.03 percent and 2 percent largely due to reduced volatility as a result of the US Federal Reserve reached a decision regarding monetary stimulus. Data from the Commodity Futures Trading Commission showed that speculative trade declined with gross short positions falling after the US Federal Open Market Operation’s (FOMC) meeting.
Cotton: Cotton ended its run as the US Department of Agriculture revised downward estimates of world demand for 2014 by 2%. Cotton prices fell marginally (0.8%) finishing the week at 82.27 US cents/lb.
Coffee: Arabica and Robusta prices fell 4.8 percent and 2.7 percent. Strong harvests in Brazil and Colombia in 2013 have more than offset the dent to production from the outbreak of rust in Central America. Heavy rains in the world’s largest Arabica coffee producer, Brazil, are expected to weaken expectations of a boost in production of next year’s crop.
Cocoa: The price of cocoa rose by 0.5 percent, its third consecutive weekly gain since September 2012. Projected gains in demand for chocolate in North America and the Europe continued to contribute to the rise in the price of cocoa. US chocolate consumption is expected to rise by 5.4%, for the first time since 2008. Strong demand for chocolate in the Euro-zone continued for the fourth consecutive year with consumption rising by 2.1% year-on-year. The cost of one kilogram of chocolate in the U.S. is expected to hit a record $12.25 this year, a 45% increase from 2007.
Figure 2: Price of Crude Oil Figure 3: Oil & Metals – Weekly price changes (%)
Source : Bloomberg (Sep 2013)
Source : Bloomberg (Sep 2013)
Figure 4: Price of Gold Figure 5: Agricultural commodities Weekly price changes (%)
Market Brief Volume 4, Issue 40; For the period of September 16 to 20, 2013
3

Relief Efforts on the continent
Cameroon Heavy rains caused the rupture of a dam along the Logone River of Dougui, Kai Kai District in the Far North Region of Cameroon causing initial evacuations of people to the banks of the dam. A second rupture in the dam 4 km from the first rupture started flooding the area and nearly 9,000 people were evacuated immediately. Following this second flooding, a team directed by the Cameroon Red Cross (CRC) Disaster Management Coordinator deployed to the area to do initial assessments and participate in the coordination mechanism.
Sovereign Debt Issues in Africa
African yield spreads contracted further during the week, in response to global economic developments. The Egyptian USD 2020 bond continue to fall on the month, shrinking to 8.4 percent compared to 8.9 percent at the end of the previous week. The US Fed’s decision to hold off paring bond purchased increased the attractiveness of Nigerian bonds for both local and international investors. Similarly, Kenya, East Africa’s largest economy plans to raise at least $1.5 billion in 2014 in its first sale of dollar bonds.
Market Brief Volume 4, Issue 40; For the period of September 16 to 20, 2013
Currency Markets
The dollar made losses against the Euro (1.7 percent) and Yen (0.7 percent) during the week as the US Federal Reserve decides to keep monthly bond purchases unabated depending on the strength of the economy. The U.S. currency fell against the majority of its 16 most-traded peers for a third-straight week as the U.S. central bank announced on Sept. 18 to keep $85 billion in monthly bond purchases unchanged.
In Africa, currency markets were also swayed by global currency market movement. The South African rand rallied gaining 3.0 percent against the dollar. The Rand continues to be buoyed by continuing flow of funds to emerging market economies. The Nigerian naira edged up against the dollar.
4
Figure 6: Weekly % Changes of Selected African Yield Spreads
Source : AfDB (Sep, 2013)
Developments Partnerships
Kenya: The African Development Bank (AfDB) approved the Lake Turkana Transmission Line Delay Partial Risk Guarantee for Euro 20 million. The ADF PRG is a risk mitigation instrument that covers private lenders and investors against the risk of a possible government failure to meet contractual obligations to a project.

5
Market Brief Volume 4, Issue 40; For the period of September 16 to 20, 2013
Countries in Focus
Egypt: is hoping to implement a smart card system at the start of 2014 for fuel purchases by vehicle drivers. The government has been struggling to reduce the cost of its energy subsidies, which make up 20 percent of all state expenditure. Egypt is negotiating with Gulf countries to supply it with badly needed petroleum products into 2014.
Chad: is planning to expand oil production to 200,000 bpd next year and 300,000 bpd by 2015 once oilfields near Lake Chad begin production. Cilvil conflict had reduced production to around 115,000 barrels per day in 2011, that subsequently dropped to about 105,000 in 2012. In 2013, oil production has fallen below 100,000 bpd.
5
Updates on African Economic Indicators
Zambia: Inflation slowed to 7.0 percent year-on-year in September from 7.1 percent in August. Inflation also eased to 0.4 percent month-on-month in September from 0.7 percent in the previous month, mainly due to a slight decrease in food prices.
Nigeria: TThe Central Bank of Nigeria will probably hold its benchmark lending rate unchanged at a record high today to support the naira as oil revenue slumps and spending pressures increase before 2015 elections. Inflation eased to 8.2 percent in August from 8.7 percent in the previous month.
Tanzania: The year-on-year rate of inflation in east Africa’s second-largest economy has now fallen in the last 18 of 19 months. Food and non-alcoholic beverages inflation rate fell to 6.5 percent in August from 8.0 percent in July 2013. The annual inflation rate for energy increased to 15.2 percent in August compared to 12.9 percent in July.
Somalia: A decision by Barclays bank to close the accounts of more than 100 money transfer organizations (MTOs), four of which have dealings with Somalia, at the end of September 2013 could have serious humanitarian implications. The total annual value of remittances to Somalia is estimated to range from US$1 billion to $2 billion. The US is the largest source country, while an estimated $160 million is sent from the UK every year. In some parts of Somalia, 40 percent of the population receives regular remittances, with 80 percent of them spending the money on basic services.

Market Brief Volume 4, Issue 40; For the period of September 16 to 20, 2013
Global Economic Leading Indicators
6
Chinese Purchasing Managers’ Index (PMI) India Purchasing Managers’ Index (PMI)
Japan Purchasing Managers’ Index (PMI) USA Purchasing Managers’ Index (PMI)
Eurozone Purchasing Managers’ Index (PMI) US ISM Manufacturing Production Index
Source: US, Institute of Supply Management. 2013
7
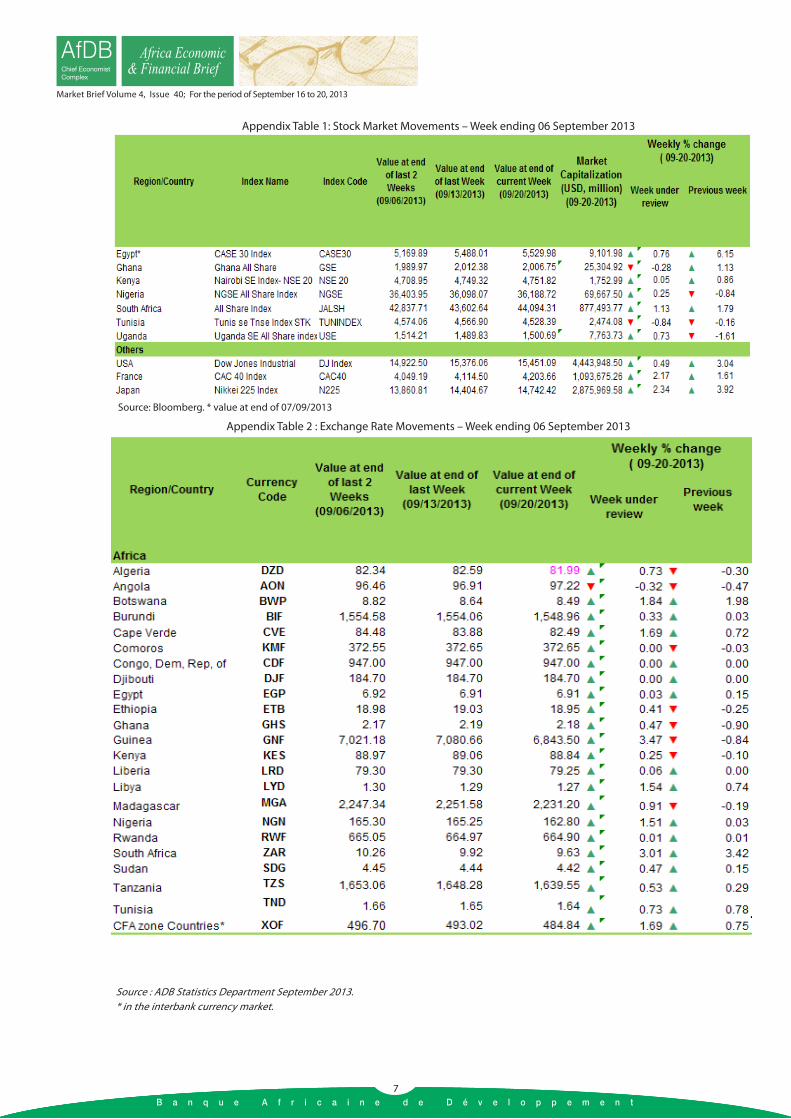
Appendix Table 2 : Exchange Rate Movements – Week ending 06 September 2013
Appendix Table 1: Stock Market Movements – Week ending 06 September 2013
7
Market Brief Volume 4, Issue 40; For the period of September 16 to 20, 2013
Source : ADB Statistics Department September 2013. * in the interbank currency market.
Source: Bloomberg. * value at end of 07/09/2013