the cost cape townof homelessness
TRANSCRIPT

THE COST OF HOMELESSNESS
Cape Town
FULL REPORT By Jonathan Hopkins,James Reaper, Sam Vos &Gemma Brough
homeless.org.zaIn partnership with

2
CONTENTS EXECUTIVE SUMMARY ............................................................................................................................................................................ 3
Rationale for the study ...................................................................................................................................................................... 3
Methodology.......................................................................................................................................................................................... 3
Research Findings ............................................................................................................................................................................... 4
What now? ............................................................................................................................................................................................. 4
INTRODUCTION – Why undertake a study like this? ..................................................................................................................... 5
The number of homeless on the streets .................................................................................................................................... 6
Measuring the cost of homelessness – Experience from other cities and countries in calculating the cost of homelessness .............................................................................................................................................................................................. 7
International study findings and their implications ............................................................................................................. 8
Implications for the Cape Town Cost of Homelessness Study ....................................................................................... 10
CAPE TOWN STUDY METHODOLOGY ............................................................................................................................................. 11
Cost calculations ................................................................................................................................................................................ 12
Shelter costs ................................................................................................................................................................................... 12
Service provider costs ................................................................................................................................................................ 12
City of Cape Town Municipality .............................................................................................................................................. 13
Provincial Department of Social Development ............................................................................................................... 13
City Improvement Districts (CIDs) ........................................................................................................................................ 14
Street homeless population survey ...................................................................................................................................... 15
Number of homeless people ................................................................................................................................................... 15
Criminal justice costs ................................................................................................................................................................. 16
Sources of income for people facing homelessness ..................................................................................................... 17
Unquantified costs ...................................................................................................................................................................... 18
RESEARCH FINDINGS ............................................................................................................................................................................ 20
How to interpret the findings – a word of caution ................................................................................................................ 20
Finding 1: Average time sleeping on the streets .................................................................................................................. 20
Finding 2: Cape Town has a very high level of chronic homelessness ........................................................................ 21
Finding 3: There are an estimated 14,357 street people in Cape Town ....................................................................... 22
Finding 4: We are spending in excess of R744m a year on homelessness in Cape Town – R4,318 per person per month .............................................................................................................................................................................. 23
Finding 5: Homeless people are 11 times more likely to be arrested than the average for the whole population ............................................................................................................................................................................................ 25
Finding 6: There is a high unmet need for healthcare among street people ........................................................... 25
Finding 7: The current response to homelessness is expensive .................................................................................... 26
CONCLUSION – What now? ................................................................................................................................................................. 27
ACKNOWLEDGEMENTS ........................................................................................................................................................................ 28
ENDNOTES ................................................................................................................................................................................................. 29
3
EXECUTIVE SUMMARY
Rationale for the study Global research shows that homelessness has detrimental consequences, both to individuals on the street and also society at large. Living on the street causes a decline in physical and mental health, and an increase in trauma and injury because of a lack of safety.i Housed residents face an increase in begging and littering as well as a perceived decrease in safety. All of this has a cost, whether it is a human, social or financial cost.
Despite multiple costing studies completed globally,ii to date, no costing study of homelessness has been completed in Africa. This study builds on the best practice and methodologies from other studies to uncover the true cost of homelessness in Cape Town, South Africa. Knowing this cost will help us all to evaluate, plan, prioritise and advocate more effectively to reduce and ultimately end homelessness in the ‘Mother City’.
Methodology The design of the study and the costing categories included were influenced by a review of costing studies conducted in Europe, North America and Australia as well as evaluating which cost elements could reliably be obtained in our setting. The authors decided to only include clearly definable costs to the government, businesses or residents, and to be purposely conservative in every calculation, also taking special care to avoid double counting of any cost element. It is further noted that the impact of Covid-19 is largely excluded because majority of the figures that were obtained came from 2019/2020 data and the few costs that were obtained after March 2020 still did not show the impact of Covid-19. It is anticipated that the cost of homelessness has increased as a result of COVID. The costs were grouped into 3 main categories as follows:
Developmental: These are costs of providing direct services to the homeless such as shelter, food, ablutions, social support, skills development and economic empowerment. Reactive and Punitive: These are costs for reacting to homelessness, either through an urban management requirement (e.g. cleaning), a security-based response, or increased demand on the criminal justice system. Humanitarian: These are the cash handouts given to homeless people every day from Cape Town residents who support them either out of concern or compassion.
Numerous sources were used to determine the aforementioned costs including (but not limited to) a comprehensive survey of street people (n=350), government publications, discussions with service providers, published financial reports, academic studies and online resources. Due to the nature of some of the sources used, certain assumptions had to be made in some calculations. These calculations and the assumptions underlying them, are clearly described in the methodology section of the document.

4
Research Findings
Average time homeless for those sleeping on the streets in Cape Town is 8 years and 7 months.
Cape Town has a very high level of chronic homelessness – 50% compared to 5% - 25% in other countries. The longer someone is on the streets, the more costly and harder it is to help them to leave the streets long term. It is therefore a significant challenge that such large proportion of Cape Town’s homeless are chronic homeless. Urgent action is required to break this cycle.
There are an estimated 14,357 street people in Cape Town
We are spending in excess of R744m a year on homelessness in Cape Town – that is R51,811 per person per year or $4,318 per person per month. Evaluating how these costs break down, we spend: a. R335m or 45% on reactive activities such as urban management costs and punitive
activities such as the incarceration of people facing homelessness. b. R287m or 39% on humanitarian through compassionate support from the public
directly to people facing homelessness; and c. R122m or 16% on developmental activities to meet the daily needs of a person facing
homelessness and help them leave the street.
Street homeless people in Cape Town are 11 times more likely to be arrested than the average for the whole population. Most arrests are for petty crimes such as possession of drugs, bylaw infringements, and antisocial behavior. Based on the experience of other countries, a law enforcement based approach to homelessness is expensive and counterproductive. iii
There is a high unmet need for healthcare among street people. This gap in healthcare utilization exacts a high human cost and also has a negative impact on extended community health.
The current response to homelessness is expensive. Currently each person facing homelessness costs society an average of R445,000 whilst they are on the street. Investing in longer-term solutions that provide a sustained pathway off the street are therefore more cost effective than short term “relief” programmes. International research and best practice offer lessons that must be explored for a South African context, notably: The sooner someone can be helped to leave the streets, the lower the complexity
regarding mental and physical health, and therefore the lower the costs. Criminalizing people facing homelessness – for example through fines – is detrimental
and makes it harder for them to leave the streets. Effective discharge planning from prison reduces the chance of someone becoming
homeless. Affordable housing provision is a critical element of the long term solution.
What now? This study shows that we spend more on homelessness than we realise. Maintaining the status quo is both ethically and financially unviable and unsustainable. The fact that we have as many homeless in the city as we do, and the fact that the percentage of those who are chronically homeless demands that we review how we spend money in this space. Unless we change the way we invest to solve this problem, and achieve a reduction in both the number of homeless people as well as the proportion of those that become chronic homeless, the costs of homelessness will continue to rise. As shown in this report, there are lots that can be learned from the global body of research and evidence to direct our response to homelessness into programmes that achieve better long-term outcomes thus ultimately reducing both the number of homeless people, as well as the cost of homelessness.

5
INTRODUCTION – Why undertake a study like this? How much does it cost Cape Town to have homeless people in its midst? Would it benefit both the community and the people facing homelessness to spend this money differently? Seeking answers to these questions led to this cost of homelessness study.
Global research shows that homelessness has detrimental consequences, both to individuals on the street and also society at large. Living on the street causes a decline in physical and mental health, and an increase in trauma and injury because of a lack of safety.iv Housed residents face an increase in begging and littering as well as a perceived decrease in safety. All of this has a cost, whether it is a human, social or financial cost.
This is not a new idea. In Malcolm Gladwell’s 2006 article entitled “Million Dollar Murray”v he chronicled the experience of a man named Murray who lived on the streets of Reno, Nevada. Gladwell calculated the cost of Murray’s time spent in prison, his stays in homeless shelters, his visits to emergency rooms and his stays in hospital added up to over a million dollars in ten years. This article changed thinking about homelessness in North America, Europe and Australia as it highlighted the real cost of the current short term responses to homelessness and inspired communities and government officials to think different about how to better address this important issue to solve homelessness. Gladwell effectively demonstrated that when we think we can get away with responding to homelessness ‘on the cheap’ through relief rather than rehabilitation, we are mistaken as it is actually costing all of us a lot more than we realise.
Since the early 2000’s, costing studies have been conducted in many cities and countries around the world. The cost of homelessness encompasses direct costs, including shelters and services, as well as indirect costs, such as increased use of health services, policing and the criminal justice system. Early research in New York City, vi and 60 subsequent replication studies in other US cities have found that in there are very high costs associated with chronic homelessness. vii Once housed, these costs can be reduced such that they effectively offset the entire costs of providing people with housing subsidies and intensive supportive services. These findings have been replicated by similar studies in Canada, Australia and the UK.viii
Despite multiple costing studies completed globally,ix to date, no costing study of homelessness has been completed in Africa. This study builds on the best practice and methodologies from other studies to uncover the true cost of homelessness in Cape Town, South Africa. The purposes of the study are four-fold:
Gain a more accurate understanding of the cost of homelessness annually in Cape Town Enable all role players to motivate for more effective investment into the sector Highlight the realities experienced on the street Guide planning and support policy development
Given these objectives, this study is for everyone, including role players at all levels of government, organisations working within the sector, and housed and non-housed residents. Knowing the true cost of homelessness will help us all to evaluate, plan, prioritise and advocate more effectively to reduce and ultimately end homelessness in the ‘Mother City’.
6
The number of homeless on the streets If you walk around any South African city it is impossible not to be struck by the number of homeless people there are – you can’t miss it, especially in the early evening when people who have nowhere else to stay are bedding down for the night in shop doorways, under bridges or in parks.
It is difficult to quantify exactly how many people are sleeping on the streets in South Africa as no reliable national statistics are routinely collected. The latest national figure is from 2008 which estimates there are between 100,000 – 200,000 homeless individuals.x Metropolitan areas have conducted their own census’ with the City of Cape Town counting 6175 sleeping on the street or in homeless shelters in 2018xi and Durban finding 3,933 in 2016.xii
Whilst these counts are common practice in cities across the world and provide some indicator of the numbers on the street, it is widely understood that a survey can never count everyone. Street surveys inevitably miss a significant number of people that are living on the streets but are hidden from view such as people who sleep in someone’s back yard or in very remote public spaces such as parks or mountain escapes. Calculating the actual number of homeless people in Cape Town faced the same challenges and is discussed in the methodology section below. Crucially, these figures are a small part of a much bigger picture. Street homelessness is the most visible form of homelessness and while tackling it is vital, there are currently thousands more homeless people hidden from view, sleeping on floors and sofas, in abandoned buildings, in backyards or on the mountain. Not included in this are the hundreds of thousands at all are those living in substandard housing such as Wendy houses or shacks.
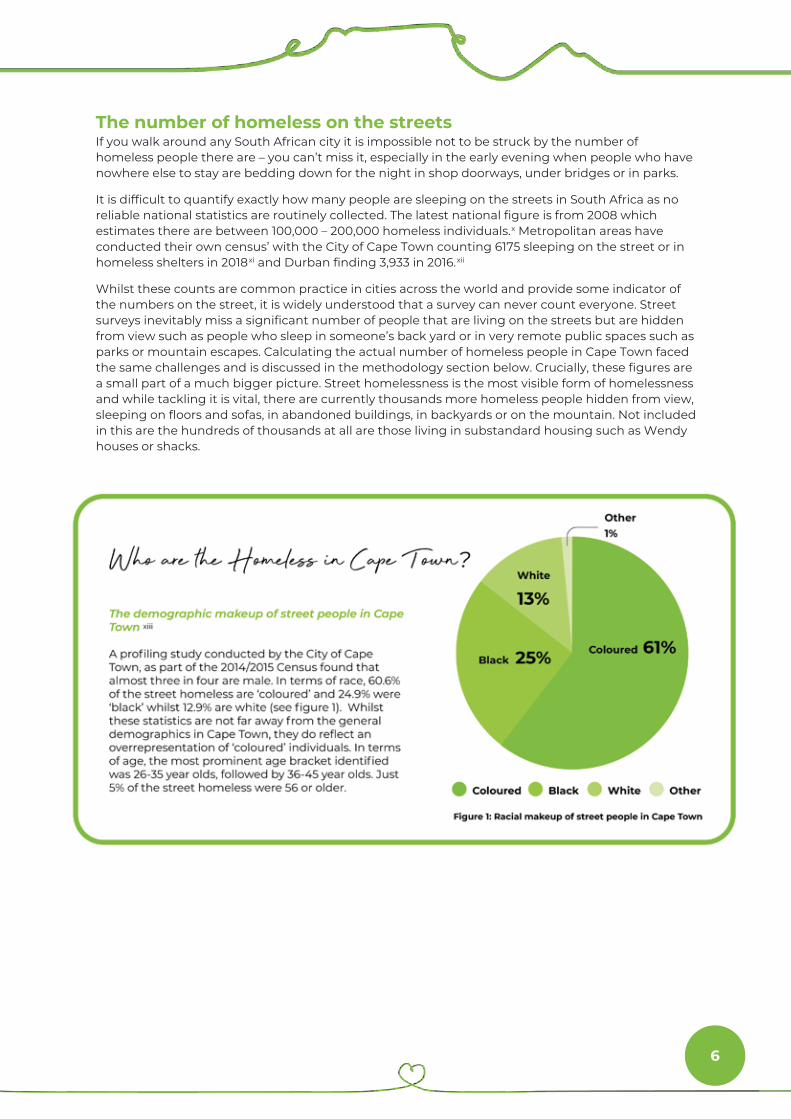
xiii
7
Measuring the cost of homelessness – Experience from other cities and countries in calculating the cost of homelessness Costing studies of homelessness have been conducted in numerous countries in Europe and North America, as well as Australia. No two studies were exactly the same with each adapted to the local context and including a slightly different array of costs. These included:
Costs to the government: such as homeless services, criminal justice, welfare grants, healthcare, and temporary and permanent housing solutions; Costs to the economy: such as house depreciation values and losses of tax revenues, and loss of potential of tax expenditure in other areas resulting from the high economic burden of the cost of homelessness; Costs to the homeless individual: in terms of wellbeing, quality of life and life expectancy.
Each study had a slightly different focus. For example:
Geographic focus: Some looked at a smaller geographic area, for example Orange County, and others were looking at the country as a whole, for example the Canada study. Population: Some studies focused on a subset of the homeless population, for example the youth homeless, whereas some took the whole homeless population. Outcomes: Studies had a range of different outcomes they looked at including the total cost of homelessness, the cost per person, comparative costs of the homeless versus non-homeless for different services, and the cost effectiveness of different interventions.
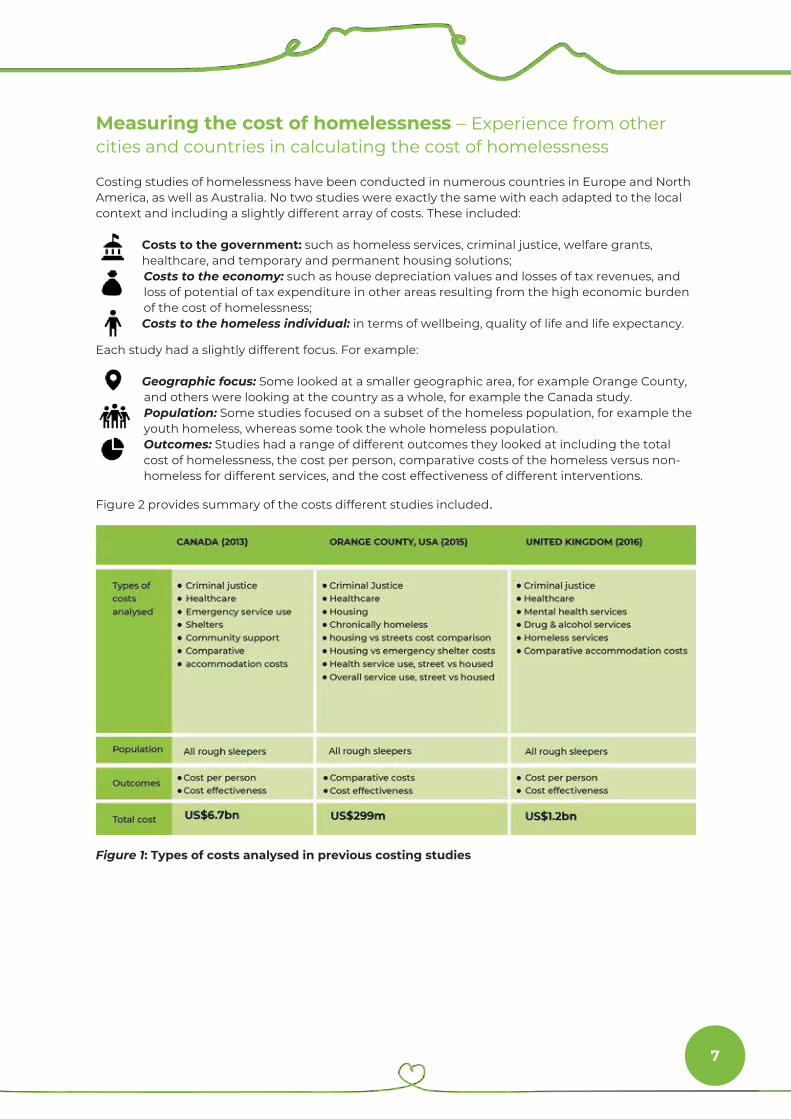
Figure 2 provides summary of the costs different studies included.
Figure 1: Types of costs analysed in previous costing studies

8
The different studies all show high total costs of homelessness. In the UK it was estimated to be over £1 billion annually (US$1.2bn),
xviii
xiv and in Canada CA$7.05 billion in 2013 (US$6.7bn)xv. In Australia a study by AHURI calculated youth homelessness alone to be AUS$574 million annuallyxvi. In Orange County, California in the United States – which has a population of 3.2 millionxvii – the cost was US$299 million in 2014/15.
International study findings and their implications Cost effectiveness As well as total costs, and cost per person, a number of studies took the analysis further and looked at the cost-effectiveness of different interventions. Studies in the UK, Canada and Australia found that taking no action, as well as temporary and short-term solutions to homelessness, have a heavy financial burden. Significantly, the studies found that investing in longer-term solutions that provide a sustained pathway off the street resulted in substantial gains – financially, as well as socially.xix
Healthcare interventions The longer someone spends on the street, the more complex mental and physical health conditions they are likely to have,
xxiii
xx increasing the likelihood of requiring and utilising health services.xxi Several studies revealed cost-savings in regards to the use of healthcare services by the homeless after effective prevention and intervention measures. In New York, homeless patients stay in hospital on average 4 days longer compares to low-income tenants and annual inpatient days fell by 57% after the homeless were moved into a form of supportive housing. This lead to an annual cost saving of $53,400 on average.xxii In Orange County, there were 78% fewer ambulance transports in a month among those in supportive housing and 100% fewer arrests compared to homeless people. In Canada people who are homeless are far more likely to have a number of serious chronic conditions as outlined in figure 3 below.

9
Figure 2: Chronic health conditions faced by people how are homeless
Mental health interventions Service use related to mental health specifically yielded beneficial results also from investment in aiding the homeless from a long-term perspective. Again financial contrasts have been drawn from the US in a comparison between the homeless and the housed, as the provision of mental health and substance abuse services to homeless individuals is estimated to cost $3196 per person more than a housed person.xxiv The same study also concluded that the cost of addressing severe mental illness was reduced by $16, 281 per person annually when comparing those in accommodation to those who were not.
Criminal justice interventions Criminal justice costs were consistently one of the highest contributors of costs for the different studies for example making up 35% of the UK calculated cost of homelessness per person.
xxvii
xxv There is a growing body of research that demonstrates that the relationship between homelessness and jail is bi-directional That is, people who are homeless are much more likely to be arrested and in jail than those who are housed, and without adequate discharge planning and supports, people in prison are more likely to become homeless upon release.xxvi For example, in Orange County, there were 100% fewer arrests among those in supportive housing than those on the streets.
Community strategies that involve criminalizing homelessness, such as issuing tickets for begging or sleeping in public parks, are also expensive and counterproductivexxviii. A Canadian study titled “Can I See Your ID?”xxix demonstrates the incredible cost of criminalizing homelessness. In examining the implementation of the Safe Streets Act in Toronto, the authors found that the number of tickets issued rose from 710 in 2000, to over 15,324 in 2010, despite a steep decline in nuisance behaviour. The total value of the 67,388 tickets issued during the period was more than 4 million Canadian dollars and it was estimated that it cost the Toronto Police Service CA$936,019 to issue the tickets over this time. However, only 0.2% of the fine value were paid during this period totalling CA$8,086.56. This therefore cost the Toronto Police Service over CA$925,000 net to issue the fines!
Most importantly, the unpaid fines left those who are homeless with an incredible debt burden that they carry with them when they are housed making it harder for them to achieve stability (see figure 4). xxx Effectively addressing homelessness,
will reduce the chances of someone becoming involved with the criminal justice system. At the same time, effective discharge and planning from prison saves money in the long run, and makes communities safer.xxxi
Figure 3: Cost of Criminalising the Homeless through fines in Toronto 2000 to 2010

10
Housing interventions Multiple studies have looked at the cost-benefit of housing people. The cost of homelessness does not only accrue for homeless shelters, soup kitchens and day programmes, but also for the healthcare system and correctional services. Therefore, when evaluating whether it is cheaper to keep people in emergency services versus providing them with housing and the support they need, this becomes an important part of the equation. A study in Canada compared the costs of different ‘housing’ options for the homeless. This report found that the average monthly costs of housing people while they are homeless are $1,932 for a shelter bed, $4,333 for provincial jail, or $10,900 for a hospital bed. Yet at the time, the average monthly cost to the City of Toronto for rent supplements was $701 and social housing was $199.92.xxxii This is summarised in figure 5.
Figure 4: Comparative housing costs in Canada
Implications for the Cape Town Cost of Homelessness Study This review of other studies and the costs included is important as it influenced the methodology design of the Cape Town study through the cost categories to include. It also highlighted global learning to date regarding the cost of homelessness – including cost effectiveness.
It is clear from these studies across multiple countries that investment in short-term homeless services only alleviate immediate problems rather than making investments intended for permanent solutions.xxxiii
Attempting to alleviate long-term effects and causes of homelessness also requires the need for addressing how specific populations are disproportionately affected by homelessnessxxxiv
xxxvi
and a redistribution of resources so that investment is not being ineffectively invested, as current forms of investment are resulting in ‘significant economic costs that may not be alleviating homelessness’.xxxv Obviously from a moral perspective the most fundamental factor is the humane issues surrounding homelessness as the longer the period spent homeless result in a greater likelihood of both physical and mental deterioration, however when it comes to government expenditure ensuring effective and efficient spending is also key.
Financially speaking, the various research indicated that money could be saved in the long-run by governments if they invested in services which helped the homeless escape the streets permanently rather than how resources are currently being distributed and investment spent.

11
CAPE TOWN STUDY METHODOLOGY As this was the first Cost of Homelessness study to be conducted in Africa, it was decided to only include clearly definable costs to the government, businesses or residents, and to be purposely conservative in every calculation. The costs were grouped into three main categories as follows:
Developmental: These are costs of providing direct services to the homeless such as shelter, food, ablutions, social support, skills development and economic empowerment. These services are provided by non-profit shelters and service providers; the City of Cape Town Social Development and Early Childhood Development Department; the Western Cape Department for Social Development; and Community Improvement District social development teams. Reactive and Punitive: These are costs for reacting to homelessness, either through an urban management requirement (e.g. cleaning), a security-based response, or increased demand on the criminal justice system. These costs include the City of Cape Town Displaced People’s Unit, Community Improvement District security and urban management spending, and Criminal Justice costs. Humanitarian: These are the cash handouts given to homeless people every day from Cape Town residents who support them either out of concern or compassion.
Numerous sources were used to determine the aforementioned costs including (but not limited to) a comprehensive survey of street people (n=350), government publications, discussions with service providers, published financial reports, academic studies and online resources. Due to the nature of some of the sources used, certain assumptions had to be made in some calculations. These calculations and the assumptions underlying them, are clearly described in the methodology that follows.
Along with a deliberately conservative approach, careful attention was also given not to double count any costs. As one might imagine, there is significant overlap between some of the expenditures listed above (e.g. government and non-profit spending) and this was accounted for in the calculations to ensure double counting did not occur.
Some important costs had to be omitted from the study because the study team could not find ways to reliably and accurately isolate these costs. These include: Substance use disorder rehabilitation costs; Mental and physical healthcare costs; Private Security costs relating to homelessness; Government grants to individuals; and individual churches and mosques, local soup kitchens and Community Action Networks (CANs) providing support to the homeless. These are highlighted in more detail below. Apart from the above, the study team also decided, by design, to exclude economic multiplier costs such as loss of revenue due to tourism, property devaluations, or the cost to the individual homeless person, such as poorer quality of life and lowered life expectancy. This is because these ‘indirect’ costs – whilst very real costs due to homelessness – due to the methods used to calculate them, can lack credibility among some stakeholders.
It is further noted that the impact of Covid-19 is largely excluded because majority of the figures that were obtained came from 2019/2020 data and the few costs that were obtained after March 2020 still did not show the impact of Covid-19. It is anticipated that the cost of homelessness has increased as a result of COVID.

12
Cost calculations This section unpacks the specific methodology, calculation and data sources for each of the included cost elements.
Shelter costs Shelters are organisations which provide subsidised accommodation for the homeless population. Some of them also provide meals and social support, for example rehabilitation and assistance with reintegration. In ascertaining shelters costs, we used both publicly available financial statements and direct outreach through telephone and email.
To avoid double counting, the number sought was total annual operating costs, less fees from users and less government contributions. These costs were determined elsewhere in the study. No Safe Space costs were included here as these were included within other cost categories (Service Provider and City of Cape Town Social Development).
In March 2020 there were 20 shelters providing a total of 2180 shelter beds (additionally there were two safe spaces providing 293 spaces). Information was received from seven organisations who run 16 shelters accounting for 86% of beds in the City (see figure 6). One shelter (The Ark) didn’t provide financial statements, instead an accurate estimate of the cost of providing their services was calculated by the study team together with senior management.
Financial data were not received from four shelters (which between them amount for 14% of shelter beds in the city). To get to a figure that showed total shelter costs, operating costs based on the average cost per bed per night from the 86% of shelter beds there were data for.
The total cost from these shelters came to R30.6m for a year. Given that user fees and government support are counted in other parts of the study, this R30.6m of costs effectively represent the costs that are born by non-governmental donors to these organisations
Service provider costs Service providers are all the organisation working in Cape Town that do not run formal shelter accommodation but work with the homeless to provide food, ablutions, a safe sleeping space, social support, skills building and economic empowerment programmes.
Information was obtained through reviewing published financial statements & phone conversations with different service providers. To avoid double counting, the number sought was total annual operating costs, less fees from users (e.g. paying for a meal or shower), less government contributions and less City Improvement District (CID) contributions. These costs are reflected elsewhere in the study.
Information was received from 9 service providers (see figure 7). There was one service provider that information was requested from
Figure 5: Shelter organisations financial data were received from
Figure 6: Shelter provider data received
Figure 6: Service provider data received

13
but not received (TASP). As there was no reliable estimate of costs and given that practice vary considerably from one service provider to another, the costs from this provider were excluded from the study altogether. The list of service providers was also non-exhaustive, owing to the multitude of smaller organisations (e.g. soup kitchens, church groups etc.) which were challenging to quantify, in particular because not all of their activity (e.g. a meal) is for street people but also often for poorer members of a community who are housed. As the smaller operator costs were excluded, the service provider costs calculated as part of the study are an underestimate of true cost across the city.
The total cost for the service providers came to R17.6m for a year. The implication is that these costs are born by donors to these organisations
City of Cape Town Municipality The City of Cape Town Municipality spends directly on homelessness related activities under two specific departments:
i) the Street People’s Unit in the Community Services and Health Directorate; ii) the Displaced Peoples Unit (DPU) under the Safety and Security Directorate.
Social Development The Community Services & Health directorate spent R31,581,882 on street people related expenditure in the financial year 2018/19. This includes funding for the Street Peoples Unit which employs 47 outreach and reintegration officers, the Safe Space in Culemborg, and the Winter Readiness Programme (Source: Alfonso Sauls – Director, Community Services & Health Directorate).
Safety and Security Directorate Exact figures for the Displaced Peoples Unit (DPU) were unable to be sourced, so they were calculated using the following facts and assumptions:
- There are 23 officers in the DPU (Source: Wayne Aldridge – head of DPU) - The average City of Cape Town law enforcement officer earns R369 801 per annum (Source:
Indeed.com) - Costs of a department such as the DPU can be divided between salary costs and non-salary costs.
We have assumed that the ratio between these two cost types is consistent between the DPU and the Safety and Security Portfolio as a whole. The Safety and Security portfolio in 2019/20 was budgeted to spend 60.8% of its budget on salaries. We have thus assumed the DPU spends the same proportion on salaries (Source: Safety and Security Budget 2020/21)xxxvii.
The total DPU costs therefore equals R13,989,183
It is noted that DPU law enforcement officers don’t just address homelessness related issues but are called upon to address other law enforcement issues as part of their role such as problem buildings, land invasions and other complaints. However, it is also noted that other law enforcement officers also deal with complaints related to homelessness people when a DPU officer is not present or available. It is therefore assumed these two cancel each other out and it is thus reasonable to assume the full cost of the DPU can be attributed as a cost of homelessness.
It was pointed out to the research team by City of Cape Town officials that there are other municipal expenses incurred due to homelessness such as area cleaning, and repair and maintenance of damaged infrastructure. No response was received from the City on the exact magnitude of these costs and it was not possible for the research team to reliably estimate them, therefore they have not been included.
Provincial Department of Social Development The Western Cape Department of Social Development directly contributes funding to addressing homelessness across the Western Cape to support shelters. According to the Western Cape Government websitexxxviii in 2019, DSD contributed R47.6m towards addressing homelessness in the Western Cape. As this study is only calculating costs for Cape Town this number has been reduced based on the proportion of DSD funded shelter beds in Cape Town compared to those in other areas of the Western Cape.
14
There are 1401 DSD funded shelter bed in the Western Cape (Source: Western Cape Government website). Of these, 1020 are in Cape Town,xxxix which is 72.8% of the funded shelter beds. Accordingly, we have attributed 72.8% of the R47.6m to Cape Town. This figure comes to R34.7m.
City Improvement Districts (CIDs) There are 46 City Improvement Districts across Cape Town and they strive to better the communities they serve.xl A considerable portion of their time and budget is spent addressing problems directly stemming from homelessness.
CIDs are mandated to do three core things: i) security; ii) urban management (cleaning services); iii) social development. Using the combined 2020/2021 CID budget for all the CIDs in Cape Town,xli it was calculated that on average their budgets are broken down as follows:
Security 53% Urban Management 11% Social Development 3%
To then determine what proportion of these costs are attributable to addressing homelessness related issues, we used insights kindly shared by Tasso Evangelinos, the head of the Cape Town CID and separately incident call log data at the Voortrekker Road CID. Both came up with very similar proportions of the costs that can be attributed to addressing homelessness related issues. They were as follows:
20% - 30% of security costs 20% of urban management 90% - 100% of social development costs
In each case with the calculations – to err on the side of caution – we have used the lower estimate in each case.
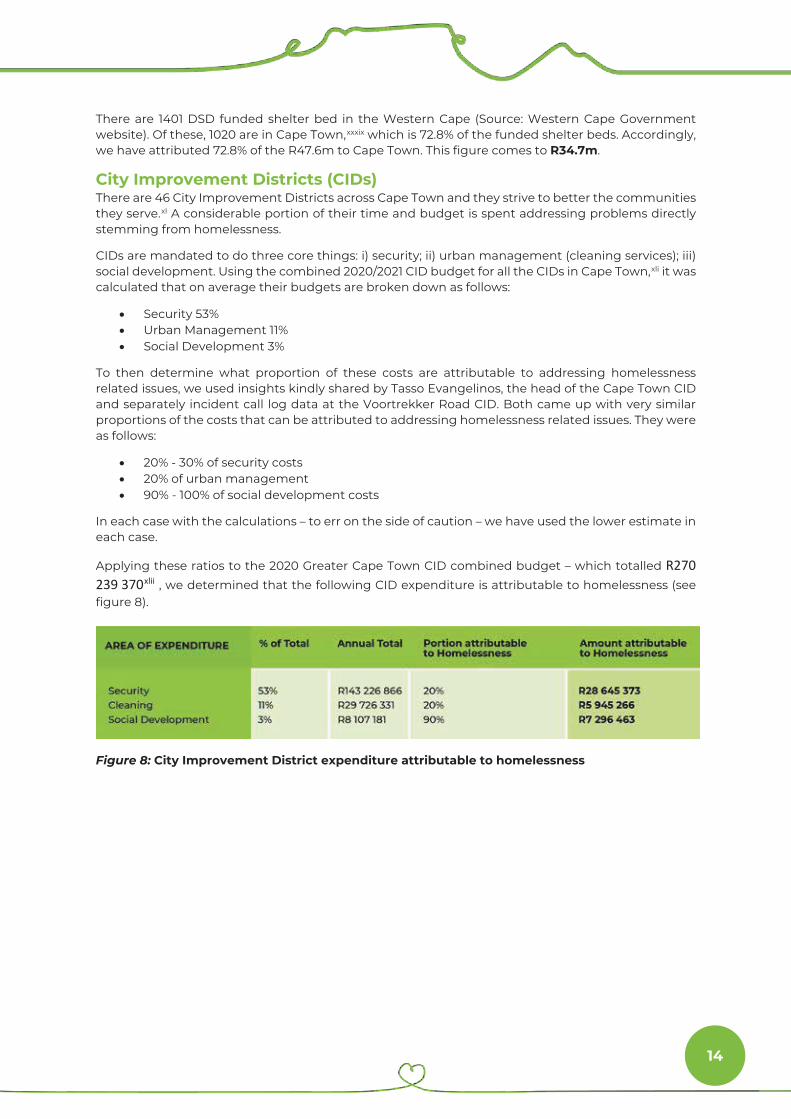
Applying these ratios to the 2020 Greater Cape Town CID combined budget – which totalled R270 239 370xlii , we determined that the following CID expenditure is attributable to homelessness (see figure 8).
Figure 8: City Improvement District expenditure attributable to homelessness

15
Street homeless population survey In order to ascertain service use amongst the street homeless population the study team worked with the South African Human Sciences Research Council (HSRC) to design and conduct a structured survey. Ethics approval was received from the HSRC for the survey instrument and methodology. Due to ethical considerations, especially around obtaining consent from minors, no children were interviewed as part of the study. The survey was conducted among a representative sample of 350 people based on the demographic and geographic findings of the City of Cape Town homeless census data from 2015 and 2018. xliii Figure 9 provides the geographic breakdown of the sample.
In each of the above areas, the fieldwork team visited different places where homeless people meet up during the day or sleep together. This included sleeping areas, soup kitchens, meeting places for begging and other income generation, and support organization sites. A maximum of 10 respondents were sampled from each site on any day so as to generate a wider distribution of respondents. Those selected for interview were done primarily on a first come, first served approach but with an attempt to ensure a representative distribution of race and gender. A group of 25 fieldworkers conducted the study between 30th January and 11th March 2020. The fieldworkers were all linked to MES, Streetscapes, U-turn and VRCID. They all had prior experience to working with, or being homeless which facilitated access and improved interpersonal connection, trust and honesty. A full training of the fieldworkers on ethics and the tools was provided. The survey was made available in English, Afrikaans and Xhosa. The translation was done by a person working with the homeless community, so the vocabulary and style will be understandable to the target community. When implementing the survey, the fieldworkers approached people on the street to invite them to participate in the survey. If it was found that they were not homeless or had completed the survey previously, the survey was not conducted with the individual. For those willing to be a part of the study, it was explained and consent sought. The fieldworker then asked the questions for the survey filling in the responses given. At the end of the interview a list of service providers and places to go for additional help (if needed) were provided. Once collected, the survey responses were captured into an excel datasheet for analysis. From the survey findings the study team gleaned valuable insights into financial, legal, health and demographic aspects of Cape Town’s homeless population. These findings were used to answer several questions around the costs associated with homelessness in Cape Town and also to highlight the experiences of life on the streets.
Number of homeless people The City of Cape Town conducted a count of street people in 2015 and 2018. These counts followed international best-practice and provide a useful insight into the number of street people. However, as academic literature shows,
xlvii
xliv a Census, however well conducted, will inevitably miss a significant number of people living on the streets as you cannot possibly count everyone. As the City’s 2018 study pointed out, “An enumeration of a nomadic target population would always render an approximate figure as there is no standard scientific way to count a moving target.”xlv For example, a study in New York planted people on the street in plain sight and 30% of them were missed.xlvi Then there are many more people hidden from view – either because they are hidden in a storm drain, on the mountain, in abandoned buildings, or in other outside spaces out of sight. Ascertaining the exact level of the undercount is difficult but by triangulating using other data, such as from service providers, it has been found that the actually number of street people is between 2.5 and 5 times higher than the census count.
Figure 14: Geographic breakdown of survey respondents
16
The latest available homeless census count available is the City of Cape Town’s 2018 Census Count which counted 4091 people who were sleeping on the street and 2084 people staying in shelters.
Multiplying the street number only by somewhere between 2.5 and 5 times would mean there is an estimated total of somewhere between 12,312 and 22,539 in Cape Town.
To err on the side of caution the study team have gone towards the lower end of this spectrum, namely three times the number of people counted on the street in the 2018 Census. We didn’t chose 2.5 times because of the geographic nature of Cape Town, especially the mountain making it hard to count everyone and unsafe township areas where the census was not completed due to safety concerns. xlviii The estimated total number of street people in Cape Town is therefore:
(4,091 x 3) + 2084 people in shelters = 14,357
In the costs that follow, the data gleaned from our statistically representative survey shows the cost as a cost per person. These costs are then multiplied by the estimated number of homeless people in Cape Town to come to the total cost.
Criminal justice costs The criminal justice costs were calculated using the survey responses to questions on number of arrests, number of court appearances, time in prison, and time on parole. Each cost was calculated as follows:
1) Arrests a. Based on survey responses we determined that on average a homeless person is arrested
once every 3 years or 0.3 times annually. According to research conducted by the Anti-Drug Alliance, it costs R105 per arrestxlix – note this amount has been adjusted to reflect 18% inflation since 2016. Therefore, the arrest cost per person per year is R105 x 0.3 = R31,36.
2) Court Appearances a. From survey data we can tell that on average a homeless person attends a court visit 0.34
times a year. According to research conducted by the Anti-Drug Alliance, it costs R1,261.18 for court proceedings including the cost of investigation of the casel–- note this amount has been adjusted to reflect 18% inflation since 2016. Therefore, the cost of court appearances per year per person is R1261.18 x 0.34 = R428.90.
3) Time spent in prison a. Based on the survey, the homeless population spend an average of 37.84 days per year in
prison per person. Note that this calculation was performed by dividing total time spent in prison since becoming homeless by the number of years since each respondent was first on the street. This gives us the metric ‘time spent in prison per year since becoming homeless’. Although this might appear high to the casual observer, it is easily explained by the fact that in order to qualify for parole a person has to have a verifiable address and it takes more than 14 days to verify an address alone.
b. The cost of incarceration is R479.50 per day per prisonerli – note this amount has been adjusted to reflect 37% inflation since 2014.
c. Thus, we calculated the annual cost of incarceration per person at (37.84 * R479.50) = R18,145.66
4) Time spent on parole a. Form the survey we determined that the average homeless person spends 6 days per year
on parole. Given that a day under parole (with tracking) costs R229.24lii – note this amount has been adjusted to reflect 37% inflation since 2014. This brings the average annual cost per person to 6 x R229.24 = R1,365.23.
Adding the four figures together, the total cost of criminal justice per homeless person per year is R19,971
The cost to the Criminal Justice system due to the Cape Town homelessness population is therefore 14357 x R19,971 = R286.7m

17
Sources of income for people facing homelessness One of the most significant costs of homelessness falls onto the citizens of Cape Town in the form of donations to homeless people, whether it be for car guarding, donations at the robot, begging, ad hoc employment such as cleaning up a garden in exchange for money, or financial support from family and friends. The survey asked each respondent on average how much they had spent over the past three days. The assumption with this question is that street homeless people cannot save any money, primarily because it is too dangerous, or not possible to do so. This is backed up by the survey that reported 0% of the sample used savings for this expenditure. The data showed that their income was on average R78.00 per person per day.
The various sources of income where then analysed (see figure 10) and the relative proportions of each income source were calculated with a weighting given to each depending on how frequently they were reported. For example, those reporting sex work as a form of income had the highest incomes, followed by those who sold drugs. However, as these were a relatively small proportion of the sample (3% and 2% respectively) they were weighted accordingly.
It was decided by the study team that ‘productive’ sources of income would be removed, such as employment and EPWP. This is because this income is providing a benefit to society and shouldn’t be seen as a ‘cost’ of homelessness. This of course raises other policy questions such as “Why are people who are employed still homeless? Initial responses points to the cost of housing and transport relative to incomes. We also note that other parts of the world also experience this discrepancy between the earning power of entry level jobs versus the cost of living in a city.
In addition to the productive sources of income, we also excluded Government grants (SASSA) from the income. This is because the survey did not ask which grants they were – i.e. unemployment, disability or child allowance. Some of these sources will lead to a cost saving – e.g. unemployment – if an individual finds work, but others won’t, such as child allowance. Thus it was difficult to attribute these as a direct cost of homelessness or not.
Having excluded these costs, the R78 total income was reduced to R55 per person per day representing largely the support they receive from donations from the public because they are homeless. Per person per year, this is R19,966.
Total donations to the homeless population of Cape Town per year is 14,357 x R19,966 = R286.6m
Figure 10: Source of income for street homeless population in Cape Town (Note: Respondents could select more than one income source)

18
Unquantified costs There were a number of costs that could not be quantified, or for methodological reasons, were not quantified by this study. The study team welcome stakeholders or researchers that have in depth knowledge of any of the costs below to make contact so that ways can be explored to capture these costs reliably so they can be included in future iterations of the costing study. The currently unquantified costs are as follows:
Substance use disorder rehab costs It had been planned to include these costs as part of the service delivery costs. The survey found that 64% of street people had a substance use disorder and 17% have been to rehab at least once since being on the streets. However, we were unable to calculate the number of people on the street currently in rehab or what the average cost of rehab is per person. These are costs we would like to add to the study at a later date should it be possible to do so.
Private Security During the peer review of the findings, it was mentioned that there are a number of private security companies, for example PPA Private Security that are mandated to keep homeless people away from their streets, in particular in Garden’s or around Van Reibeek Park. There are a significant number of call outs to private security regarding homeless individuals each day and from this it should be possible to ascertain the cost of homelessness to these private security firms. The study team reached out to some private security firms in Cape Town but while they were supportive of the study, we did not receive any information in time for publication. If this information is forthcoming and these costs can be calculated, then they will be added to the study at a later date.
Healthcare (physical and mental) Homelessness has a devastating impact on the health of people who directly experience it including increased illness, higher use of health services and early death.liii Figure 11 highlights the numerous links between homelessness and poor health.
While some people become homeless because of mental illness, it is known that the experience of homelessness can exacerbate existing problems and lead to new mental health problems, including addictions. 16% of the respondents to the street homeless population survey, reported mental health issues but this is an under representation of reality as obvious mental illness was one of the factors which excluded people from the survey – for example, if they were not in their right might during the survey questioning so the validity of the answers was questioned, then the survey response was discounted. The survey also asked for diagnosed mental health conditions and it is expected that a number of the sample have undiagnosed mental illness. Mental illness rates amongst the homeless in Canada, for example, were 30%.liv There is no reason to believe that this number is any smaller in Cape Town.
The street homeless population survey asked questions regarding use of the health system, such as a day clinic and a hospital, and how frequently these services had been utilized in the past three month, and what was the reason for last attending. There is some rich data here to be analysed however, it was not possible to use in the costing study as the study authors were unable to isolate specific healthcare costs such as the cost of a visit to the Emergency Room or a Day Hospital.
Figure 11: Link between homelessness and poor health
19
However, during a peer review, links were provided to the UCT Health Economics Department and it is hoped this component can be added to the study at a later date.
Cost to the City of urban management costs (e.g. solid waste) When talking with the City of Cape Town regarding the costs of homelessness it was mentioned that areas to look at included the extra cost of solid waste removal due to homelessness as well as damage to structures and property. However, the City did not provide any figures on the costs of either of these, and the research team could not find sufficient data from which to reliably estimate the costs. It is likely that there is a high cost of doing this. For example, in 2017 the City of Los Angeles reported that the Bureau of Sanitation spent at least US$547,000 a year on clean-up relating to homelessness.lv
Support from faith-based and community organisations There are many faith-based or community organisations, including those run by Community Action Networks (CANs) that provide food and other support to street people on a daily basis. However, they often do this as part of a broader outreach to the poorest and most vulnerable in society. Therefore, it was difficult to ascertain the proportion these groups spent on homelessness. Given the large number of small community based organisations, churches, mosques and CANs, the research team were not able to source this data.
Individual costs Homelessness has a high individual cost which is rarely taken into consideration when assessing costs. These include costs in terms of shortened life expectancy, wellbeing and quality of life.
Due to the impact of street homelessness on mental and physical health, mortality rates are significantly higher among the homeless compared to the overall general population.lvi while we recognize these cost to human life are real, the researchers could not identify a reliable way to calculate such costs and on that basis they were excluded.
Economic impact Economic costs were not included in the study methodology but it is clear that homelessness impacts on the economy through a negative impact on economic competitiveness, a loss of tourism and depreciation in property values.
Negative impact on economic competitiveness: People who are homeless are high users of services, and generate expense rather than income for the community.lvii The direct cost to businesses increases due to increased spending on private security. Depreciation in property values: Beyond the increased urban management and private security costs faced by residents, studies have found high levels of homelessness can decrease property values. This in turn directly affects the local government budget as it reduces property tax revenue. For example, in Dallas, Texas, the number of homeless people in the city led to an estimated loss of $4 million in property tax incomes.lviii Loss of tourism: Whilst homelessness doesn’t stop people from visiting a city, it does determine which parts of the city they are willing to visit and stay in. This directly affects businesses and rental properties that depend on tourist income.

20
RESEARCH FINDINGS
How to interpret the findings – a word of caution Before we present the key findings of the study it is important to understand what the numbers can and cannot tell us. This understanding is important so the findings are correctly applied. 1. This study does not assess the savings that would accrue if homelessness was ended. Although
some of the spend might be saved on services like policing homelessness and humanitarian costs, much of the current expenditure will be redirected elsewhere. For example, shifting away from spending on cleaning and security to maintain the status quo, to spending on improving and beautifying urban spaces to encourage more visitors.
2. The study doesn’t show where there is a choice over spending and where there isn’t. For example, in order to maintain the status quo in the City, we are doing a responsible thing by spending money on fixing up a building that has been vandalised or cleaning the streets after they have been used as a toilet. However, presenting the costs encourages a dialogue on whether there are clear alternatives and also encourages longer term rather than shorter term thinking.
3. The study does not measure cost-effectiveness. As mentioned in the methodology, the study focuses on total costs and does not include cost comparisons on different interventions. However, this study lays the foundation for a future comparative study to assess the cost-effectiveness of different interventions in addressing homelessness.
4. This is a minimum cost of homelessness in Cape Town. The study is conservative in all calculations. There were costs, such as healthcare, drug rehab and private security, that were excluded due as the required costing data could not be obtained. Thus, language such as, “We spend in excess of…” should be used when talking about the cost findings in this study.
Finding 1: Average time sleeping on the streets
Current street homeless people in Cape Town have spent a mean average of 8 years and 7 months living on the street – this is accordingly to the Street People survey conducted as part of the study. The median average is 4 years and 7 months – slightly lower than the mean given the long periods of time some have spent on the street, but still incredibly high. The majority (71%) have spent more than one year on the street with 45% spending more than 5 years on the street (figure 12). Only 29% reported being on the street under one year. The shortest someone had been on the streets in the sample was four days, the longest was over 40 years.

21
Figure 12: Length of time living on the street in Cape Town
Finding 2: Cape Town has a very high level of chronic homelessness
“Chronic homelessness” describes people who have experienced homelessness consistently for at least a year — or repeatedly over several years — while struggling with a disabling condition such as a serious mental illness, substance use disorder, or physical disability. lix Considering the elements of the definition, Cape Town showed the following alarming results:
71% of the street homeless population have been on the streets more than one year, 6% have a serious mental health condition such schizophrenia, dementia, bipolar disorder or
post-traumatic stress disorder (PTSD) 64% have a current drug or alcohol addiction. Taken together, 50% were found to have been homeless more than one year and have a
serious mental health condition or a substance addiction (see figure 12).
To put this figure into context – in the US only 24% of the homeless population is classified as chronic homeless – less than half the Cape Town figure.lx In Northern Ireland, they use a broader definition of what constitutes “chronic homeless” yet even with this much broader definition they report that only between 5-10% of the homeless population could be identified as experiencing chronic homelessness.lxi

22
Figure 13: Calculation of chronic homelessness in Cape Town
The fact that such a high proportion of Cape Town’s homeless population are classified as Chronic homeless is a very worrying trend. Apart from the human suffering that is taking place on the streets, it also matters from a cost perspective. Research shows that living on the street leads to deteriorations of a person’s physical and mental health and well-being.
lxiii
lxii The chronic homeless become more expensive for the public sector over time as they start drawing more on public services such as healthcare, and their homelessness is increasingly costly to resolve as their needs become more complex. The longer someone is on the streets, the more costly and harder it is to help them to leave the streets long term. It is therefore a significant challenge that such large proportion of Cape Town’s homeless are chronic homeless. Urgent action is required to break this cycle.
Finding 3: There are an estimated 14,357 street people in Cape Town
As described in the detailed methodology section, there are estimated to be between 12,312 and 22,539 street homeless people in the city. Using a conservative approach, the estimated number of homeless in the city is 14,357. lxiv Whilst this is higher than previously published numbers, the total number calculated and the methodology were both validated and accepted by the peer reviewers from the across the sector who reviewed the research findings before publication. It also helps explain why homelessness ranks so high as a topic of complaint amongst citizens and businesses alike.

23
Finding 4: We are spending in excess of R744m a year on homelessness in Cape Town – R4,318 per person per month
The total cost of homelessness in Cape Town is R744m a year. This means that R51,811 per year or R4,318 per month is spent per person facing homelessness on maintaining the status quo.
It is also important to remember that this is conservative figure as there are many costs not included in this total such as healthcare, substance use disorder rehabilitation, private security and government grants to individuals.
Figure 14 provides a summary for the different costs of homelessness organized by the three main categories defined in the methodology namely developmental, reactive & punitive, and humanitarian (see page 11 for definitions).
Figure 14: Breakdown of cost of homelessness by category

24
The primary response to homelessness in Cape Town is a reactive / punitive response, followed closely by a humanitarian / compassionate response and with the developmental approach in a distant 3rd position. It explains a lot of the frustration seen in the city between some citizens who feel compassion versus others wanting to lead with a security response. It is important to note that neither a reactive / punitive nor a humanitarian response leads to effective exit strategies from the streets which further explains the particularly high levels of chronic homelessness found on Cape Town’s streets.
The study therefore begs us to scruitinise more carefully what we are actually spending money on. Looking through a longer term cost effectiveness lens, does continuing the status quo and merely reacting to effects of homelessness make sense? Case study 2 shows just how real this issue is.

25
Finding 5: Homeless people are 11 times more likely to be arrested than the average for the whole population
A
striking finding from the survey was that the homeless in Cape Town are arrested on average once every three years giving a 33% chance of arrest each year. This is 11 times higher than amongst the general population where there is a 3% chance of arrest per year.lxv This is not to say that homeless are necessarily dangerous criminals. The reasons for arrest given in the survey are primarily related to minor offences such as drug possession, bylaw infringements and antisocial behavior.
If the experience of Toronto, Canada is anything to go by we know that a law enforcement based approach to homelessness, such as issuing fines for begging or sleeping in public spaces, is expensive and counterproductive.lxvi The research and data are encouraging us to look for alternatives using a more developmental approach to support people to leave the streets.
Finding 6: There is a high unmet need for healthcare among street people
Living on the street is bad for your physical and mental health.lxvii Homelessness, is correlated with increased incidence of illness and injury, and over time health problems accumulate. lxviii However, healthcare access for those on the street is limited. The street people study found 59% of those interviewed had been to clinic and/or hospital in the last three months. Yet, as a comparison, in the Strandfontein temporary camp for the homeless set up during COVID-19 lockdown, it was reported that 1,352 homeless persons (approx. 85% of the 1600 residents) were required and were provided with chronic and clinical treatment for conditions such as TB, HIV, Diabetes, Hypertension and Epilepsy. lxix This ‘gap’ in healthcare utilisation shows the level of untreated chronic and clinical conditions among the homeless population which exacts a high human cost, but also has a negative impact on extended community health.
While some people become homeless because of mental illness, it is known that the experience of homelessness can exacerbate existing problems and lead to new mental health problems, including addictions. 16% of the survey respondents reported mental health issues of which 6% were serious, but this is an under representation of reality as obvious mental illness was one of the factors which excluded people from the survey.
As highlighted in the methodology, an estimated cost on the healthcare system due to street homelessness has not been calculated as part of this study due to problems in accessing reliable health service costing data. However, during the study peer review, links were provided to the UCT Health Economics Department and it is hoped this costing component can be added at a later date.

26
Finding 7: The current response to homelessness is expensive
The longer a person remains on the street, the more it costs. It not only costs more for all of society to continue providing services to that person, but ultimately it will also cost more to rehabilitate that person due to increased complexity of mental and physical health.
The study found that 50% of the Cape Town’s homeless population is chronically homeless which is significantly higher than other parts of the world where figures range between 5%-25%. We are already spending in excess of R744m per annum on homelessness in the city which equates to a cost per person of R4,357 per month! Given that the average time on the street for a person in Cape Town is 8 years and 7 months, each person who is homeless is costing at least R444,754 whilst they are on the street. As such, the current response to homelessness within Cape Town is expensive.
Unless we begin to reduce the number of homeless people and effectively address chronic homelessness, the costs of homelessness will continue to rise. This can be achieved by investing in longer-term solutions that provide a sustained pathway off the street. International research and best practice offer lessons that must be explored for a South African context. For example, criminalizing people facing homelessness – for example through fines – is detrimental and makes it harder for them to leave the streets. Similarly, effective discharge planning from prison reduces the chance of someone becoming homeless after they leave prison. Investment in short-term homeless services only alleviate immediate problems and do not help people to leave the streets longer term. Longer-term investments include holistic economic empowerment programmes and increasing the availability of affordable housing in locations close to the economic hubs across the City.

27
CONCLUSION – What now? The cost of solving homelessness is cheaper than doing nothing. In order to change the status quo the following needs to happen: 1. Research into cost effectiveness: Based on international methodologies and practice, further
research is needed into the cost-effectiveness of different interventions in helping a street homeless person to leave the streets. This will look at the cost comparison between different interventions, for example, short term shelter vs longer term housing, or different work-based programmes.
2. Develop evidence-based policies and strategies: The best social and economic policies are based on research and evidence. Policy and strategy development at all levels of government need to consider the true costs of homelessness and focus on interventions that are the most cost-effective in supporting more people to leave the streets long term, even if it appears ‘more expensive’ in the short term. This will also enable better social outcomes.
3. Impact investment: There is currently a growing crisis of chronic homelessness in Cape Town. Increased investment is needed in programmes that are proven to show the greatest cost-effectiveness and impact in helping homeless people to leave the streets long term. These programmes must break the cycle of chronic homelessness and poverty and help individuals reintegrate into society. This will require multiple models and pathways to ensure everyone on the street has the ability to access the services they require to move away from street life permanently.
In conclusion, this study shows that we spend more on homelessness than we realise. Maintaining the status quo is both ethically and financially unviable and unsustainable. The fact that we have as many homeless in the city as we do, and the fact that the percentage of those who are chronically homeless demands that we review how we spend money in this space. Unless we change the way we invest to solve this problem, and achieve a reduction in both the number of homeless people as well as the proportion of those that become chronic homeless, the costs of homelessness will continue to rise. As shown in this report, much can be learned from the global body of research and evidence to direct our response to homelessness into programmes that achieve better long-term outcomes thus ultimately reducing both the number of homeless people, as well as the cost of homelessness.

28
ACKNOWLEDGEMENTS

29
ENDNOTES
i Gaetz, S. (2012) The real cost of homelessness: Can we save money by doing the right thing? https://www.homelesshub.ca/costofhomelessness Accessed 13 November 2020 iiCrisis (2016) Cost of Homelessness https://www.crisis.org.uk/ending-homelessness/homelessness-knowledge-hub/cost-of-homelessness/ ; Australian Housing and Urban Research Institute (2003) Counting the Costs of Homelessness https://www.ahuri.edu.au/__data/assets/pdf_file/0015/3075/AHURI_RAP_Issue_24_Counting_the_cost_of_homelessness.pdf ; Jamboree (2017) Homelessness in Orange County: The Costs To Our Community’ https://cdn.shopify.com/s/files/1/0072/3019/3782/files/jamboree-united-way-uci-oc-cost-study-homelessness-executive-summary.pdf iii Gaetz, S. (2012) The real cost of homelessness: Can we save money by doing the right thing? https://www.homelesshub.ca/costofhomelessness Accessed 13 November 2020 iv Gaetz, S. (2012) The real cost of homelessness: Can we save money by doing the right thing? https://www.homelesshub.ca/costofhomelessness Accessed 13 November 2020 v Malcolm Gladwell (2006) Million Dollar Murray. New Yorker. https://housingmatterssc.org/wp-content/uploads/2018/11/Million-Dollar-Murray.pdf vi Culhane, D. P., Metraux, S., & Hadley, T. (2002). Public service reductions associated with placement of homeless persons with severe mental illness in supportive housing. Housing Policy Debate. doi:10.1080/10511482.2002.9521437 vii Dennis P. Culhane, Kennen S. Gross, Wayne D. Parker, Barbara Poppe, and Ezra Sykes. “Accountability, Cost-Effectiveness, and Program Performance: Progress Since 1998” National Symposium on Homelessness Research (2008). viii Pleace, N. (2015) At what cost https://www.crisis.org.uk/ending-homelessness/homelessness-knowledge-hub/cost-of-homelessness/at-what-cost-2015/ Accessed 13 November 2020 ixCrisis (2016) Cost of Homelessness https://www.crisis.org.uk/ending-homelessness/homelessness-knowledge-hub/cost-of-homelessness/ ; Australian Housing and Urban Research Institute (2003) Counting the Costs of Homelessness https://www.ahuri.edu.au/__data/assets/pdf_file/0015/3075/AHURI_RAP_Issue_24_Counting_the_cost_of_homelessness.pdf ; Jamboree (2017) Homelessness in Orange County: The Costs To Our Community’ https://cdn.shopify.com/s/files/1/0072/3019/3782/files/jamboree-united-way-uci-oc-cost-study-homelessness-executive-summary.pdf x Obioha, E.E. (2019) ‘Addressing Homelessness Through Public Works Programmes in South Africa’, Walter Sisulu University https://www.un.org/development/desa/dspd/wp-content/uploads/sites/22/2019/05/OBIOHA_Emeka_Paper-1.pdf xi City of Cape Town (2018/19), ‘Street People Enumeration 18/19’ https://resource.capetown.gov.za/cityassets/Media%20Centre%20Assets/Enumeration%20Presentation-Janine.pdf xii Ikhaya Lami: Understanding homelessness in Durban http://www.hsrc.ac.za/en/research-outputs/ktree-doc/17258#:~:text=A%20total%20of%203933%20street,(see%20Figure%203%20below). xiii The Directorate of Social Development and Early Childhood Development (July 2014 – August 2015) An investigation of homelessness within the City of Cape Town: Those who live and sleep on the streets. Research brief 2 of 8: Profile of those who live on the streets and in shelters. City of Cape Town xiv Crisis (2016) Cost of Homelessness https://www.crisis.org.uk/ending-homelessness/homelessness-knowledge-hub/cost-of-homelessness/ Accessed 23 November 2020 xv USD calculation made using Oanda with date set for 1st November 2013 for Canada and 1st November 2016 for UK xvi Australian Housing and Urban Research Institute (2003) ‘Counting the Costs of Homelessness’ https://www.ahuri.edu.au/__data/assets/pdf_file/0015/3075/AHURI_RAP_Issue_24_Counting_the_cost_of_homelessness.pdf Accessed 23 November 2020 xvii United States Census Bureau (1 July 2019) Quick facts. Orange County, California. https://www.census.gov/quickfacts/orangecountycalifornia Accessed 23 November 2020 xviii Jamboree (2017) Homelessness in Orange County: The Costs To Our Community https://cdn.shopify.com/s/files/1/0072/3019/3782/files/jamboree-united-way-uci-oc-cost-study-homelessness-executive-summary.pdf Accessed 23 November 2020. xix Australian Housing and Urban Research Institute (2003) ‘Counting the Costs of Homelessness’ https://www.ahuri.edu.au/__data/assets/pdf_file/0015/3075/AHURI_RAP_Issue_24_Counting_the_cost_of_homelessness.pdf Accessed 23 November 2020 xx National Alliance to End Homelessness (January 2020) Chronic Homelessness. https://endhomelessness.org/homelessness-in-america/who-experiences-homelessness/chronically-homeless/ Accessed 13 November 2020 xxi Gaetz, S. (2012) The real cost of homelessness: Can we save money by doing the right thing? https://www.homelesshub.ca/costofhomelessness Accessed 13 November 2020 xxii Australian Housing and Urban Research Institute (2003) ‘Counting the Costs of Homelessness’ https://www.ahuri.edu.au/__data/assets/pdf_file/0015/3075/AHURI_RAP_Issue_24_Counting_the_cost_of_homelessness.pdf Accessed 23 November 2020
30
xxiii Jamboree (2017) Homelessness in Orange County: The Costs To Our Community https://cdn.shopify.com/s/files/1/0072/3019/3782/files/jamboree-united-way-uci-oc-cost-study-homelessness-executive-summary.pdf Accessed 23 November 2020. xxiv Australian Housing and Urban Research Institute (2003) ‘Counting the Costs of Homelessness’ https://www.ahuri.edu.au/__data/assets/pdf_file/0015/3075/AHURI_RAP_Issue_24_Counting_the_cost_of_homelessness.pdf Accessed 23 November 2020 xxv Pleace, N. & Culhane, D.P. (2016) Better Than Cure https://www.crisis.org.uk/media/20680/crisis_better_than_cure_2016.pdf xxvi Gaetz, S. (2012) The real cost of homelessness: Can we save money by doing the right thing? https://www.homelesshub.ca/costofhomelessness Accessed 13 November 2020 xxvii Jamboree (2017) Homelessness in Orange County: The Costs To Our Community https://cdn.shopify.com/s/files/1/0072/3019/3782/files/jamboree-united-way-uci-oc-cost-study-homelessness-executive-summary.pdf Accessed 23 November 2020. xxviii Culhane, D. & Byrne, T. (2010). Ending Chronic Homelessness: Cost-Effective Opportunities for Interagency Collaboration. Philadelphia, PA: University of Pennsylvania, Penn School of Social Policy and Practice. xxix O’Grady, B., Gaetz, S., Buccieri, K. (2011). Can I See Your ID? The Policing of Youth Homelessness in Toronto. Homeless Hub Report Series, 5. xxx O’Grady, B., Gaetz, S., Buccieri, K. (2011). Can I See Your ID? The Policing of Youth Homelessness in Toronto. Homeless Hub Report Series, 5. xxxi Gaetz, S. (2012) The real cost of homelessness: Can we save money by doing the right thing? https://www.homelesshub.ca/costofhomelessness Accessed 13 November 2020 xxxii Wellesley Institute’s Blueprint to End Homelessness (2007). Reported in Gaetz, S. (2012) The real cost of homelessness: Can we save money by doing the right thing? https://www.homelesshub.ca/costofhomelessness Accessed 13 November 2020 xxxiii Jamboree (2017) Homelessness in Orange County: The Costs To Our Community https://cdn.shopify.com/s/files/1/0072/3019/3782/files/jamboree-united-way-uci-oc-cost-study-homelessness-executive-summary.pdf Accessed 23 November 2020. xxxiv Gaetz, S. (2012) The real cost of homelessness: Can we save money by doing the right thing? https://www.homelesshub.ca/costofhomelessness Accessed 13 November 2020 xxxv Pleace, N. & Culhane, D.P. (2016) Better Than Cure https://www.crisis.org.uk/media/20680/crisis_better_than_cure_2016.pdf xxxvi Gaetz, S. (2012) The real cost of homelessness: Can we save money by doing the right thing? https://www.homelesshub.ca/costofhomelessness Accessed 13 November 2020 xxxvii City of Cape Town (27 May 2020) 2020/21 Budget, Page 173 Available from: http://resource.capetown.gov.za/documentcentre/Documents/Financial%20documents/AnnexureA_2020-2_Budget.pdf Accessed 13 November 2020. xxxviii Western Cape Government (5 December 2019) Homelessness https://www.westerncape.gov.za/general-publication/homelessness-0 xxxix This was determined by calling around all the shelters in Cape Town (whether on the Western Government Site or not) to ask if they received DSD funding. xl New City Improvement Districts are being created each year. There are 46 CIDs included in the document: City of Cape Town Urban Management Department (2020) Annexure 3: City Improvement Districts Additional Rates http://resource.capetown.gov.za/documentcentre/Documents/Financial%20documents/Ann3_2020-21_CIDs_Add_Rates.pdf Accessed 23 November 2020 xli City of Cape Town Urban Management Department (2020) Annexure 3: City Improvement Districts Additional Rates http://resource.capetown.gov.za/documentcentre/Documents/Financial%20documents/Ann3_2020-21_CIDs_Add_Rates.pdf Accessed 23 November 2020 xlii City of Cape Town (May 2020) Annexure 3: City Improvement District Additional Rates. http://resource.capetown.gov.za/documentcentre/Documents/Financial%20documents/Ann3_2020-21_CIDs_Add_Rates.pdf Accessed 23 November 2020 xliiiThe Directorate of Social Development and Early Childhood Development (July 2014 – August 2015) An investigation of homelessness within the City of Cape Town: Those who live and sleep on the streets. Research brief 3 of 8: Counting the number who lives and sleeps on the streets of Cape Town. City of Cape Town xliv Hopper, K., et al., Estimating numbers of unsheltered homeless people through plant capture and post count survey methods. American Journal of Public Health, 2008. 98(8): p. 1438-1442 xlv Social Development and Early Childhood Development Department Research Team (2018/19) Street People Enumeration Final Report. City of Cape Town. xlvi Hopper, K., et al., Estimating numbers of unsheltered homeless people through plant capture and post count survey methods. American Journal of Public Health, 2008. 98(8): p. 1438-1442.

31
xlvii Guardian (26 February 2020) https://www.theguardian.com/uk-news/2020/feb/26/uks-official-rough-sleeping-numbers-far-lower-than-reality; Professor Glen Bramley, Herriot Watt University. More or Less, 7th October 2019. https://www.bbc.co.uk/programmes/w3csz3rj#:~:text=An%20article%20in%20the%20San,compared%20to%205096%20in%20Britain.&text=Photo%3A%20A%20homeless%20man%20sleeps,district%20in%20San%20Francisco%2C%20California. 4min30 onwards xlviii Social Development and Early Childhood Development Department Research Team (2018/19) Street People Enumeration Final Report. City of Cape Town. xlix Mail and Guardian (19 May 2017) Police time and money go to pot https://mg.co.za/article/2017-05-19-00-police-time-and-money-go-to-pot/ Accessed 12 November 2020 l This is the cost of investigation and the cost of court proceedings. Mail and Guardian (19 May 2017) Police time and money go to pot https://mg.co.za/article/2017-05-19-00-police-time-and-money-go-to-pot/ Accessed 12 November 2020 li Business Tech (2014/15) https://businesstech.co.za/news/trending/104579/how-much-each-prisoner-costs-sa-taxpayers-every-day/ lii Business Tech (2014/15) https://businesstech.co.za/news/trending/104579/how-much-each-prisoner-costs-sa-taxpayers-every-day/ liii Gaetz, S. (2012) The real cost of homelessness: Can we save money by doing the right thing? https://www.homelesshub.ca/costofhomelessness Accessed 13 November 2020 liv Gaetz, S. (2012) The real cost of homelessness: Can we save money by doing the right thing? https://www.homelesshub.ca/costofhomelessness Accessed 13 November 2020 lv California State Auditor (2017) Homelessness in California: State Government and the Los Angeles Homeless Services Authority Need to Strengthen Their Efforts to Address Homelessness. http://www.auditor.ca.gov/reports/2017-112/summary.html Accessed 16 November 2020 lvi Hwang, S. W. (2000). Mortality among men using homeless shelters in Toronto, Ontario. The Journal of the American Medical Association, 283(16), 2152-2157. Roy, E., Boivin, J. F., Haley, N., & Lemire, N. (1998). Mortality among street youth. The Lancet, 352(9121), 32. lvii American Security Project (2018) The Impact of Homelessness on Economic Competitiveness. https://www.americansecurityproject.org/impact-homelessness-economic-competitiveness/ Accessed 20 November 2020. lviii Australian Housing and Urban Research Institute (2003) ‘Counting the Costs of Homelessness’ https://www.ahuri.edu.au/__data/assets/pdf_file/0015/3075/AHURI_RAP_Issue_24_Counting_the_cost_of_homelessness.pdf Accessed 23 November 2020 lix National Alliance to End Homelessness (2020) Chronically Homeless https://endhomelessness.org/homelessness-in-america/who-experiences-homelessness/chronically-homeless/ lx National Alliance to End Homelessness (2020) Chronically Homeless https://endhomelessness.org/homelessness-in-america/who-experiences-homelessness/chronically-homeless/ lxi National Housing Executive (May 2019) Northern Ireland Chronic Homeless Action Plan. https://www.nihe.gov.uk/Documents/Supporting-Documents/RS-246-02-19-Chronic-Homelessness-Action-Plan-ACCE.aspx Accessed 3rd December 2020 lxii Gaetz, S. (2012) The real cost of homelessness: Can we save money by doing the right thing? https://www.homelesshub.ca/costofhomelessness Accessed 13 November 2020 lxiii At what cost (2015) Pleace, N. https://www.crisis.org.uk/ending-homelessness/homelessness-knowledge-hub/cost-of-homelessness/at-what-cost-2015/ lxiv In each case the formula used was (multiplier x the number of people found sleeping on the street) + the total counted in shelters. Thus the final estimate was calculated as follows: (3x4081)+2084 = 14,357. lxv Muntingh, L. (2013) Page 19. ‘Race, gender and socioeconomic status in law enforcement in South Africa – are there worrying signs?’ Community Law Centre. https://acjr.org.za/resource-centre/Inequality%20paper.pdf. Accessed 19 November 2020 lxvi Gaetz, S. (2012) The real cost of homelessness: Can we save money by doing the right thing? https://www.homelesshub.ca/costofhomelessness Accessed 13 November 2020 lxvii Gaetz, S. (2012) The real cost of homelessness: Can we save money by doing the right thing? https://www.homelesshub.ca/costofhomelessness Accessed 13 November 2020 lxviii Gaetz, S. (2012) The real cost of homelessness: Can we save money by doing the right thing? https://www.homelesshub.ca/costofhomelessness Accessed 13 November 2020 lxix City of Cape Town (19 August, 2020) Cape Town delivered South Africa’s highest service reach to the homeless under lockdown. https://www.da.org.za/government/undefined/2020/08/cape-town-delivered-south-africas-highest-service-reach-to-the-homeless-under-lockdown Accessed 19 November 2020

021 674 [email protected]
HEAD OFFICE
155 2nd Avenue,Kenilworth, 7708, Cape Town, South Africa
R744 million ANNUALLY HOMELESSNESS COSTS CAPE TOWN
Over
We spend more on homelessness than we realise. This study shines a light on what – as a society – we are spending on responding to
homelessness in Cape Town. Unless we begin to reduce the number of homeless people and effectively address chronic homelessness,
the costs of homelessness will continue to rise. This can be achieved by investing in longer-term solutions that provide a sustained path-
way off the street.
WE'RE REACTING TO THE PROBLEM Not solving it
© 2020