the cost of health care in kenya - actual costing of keph ...€¦ · the cost of health care in...
TRANSCRIPT

THE COST OF HEALTH CARE IN KENYA -
ACTUAL COSTING OF KEPH AND NON-KEPH
SERVICES
Financed by Deutsche Gesellschaft für Technische Zusammenarbeit (GTZ), Kenya
June 2010

1
Contents
Contents .................................................................................................................................... 1 1. Background and Context ....................................................................................................... 2 2. Objectives .............................................................................................................................. 2 3. Methodology ......................................................................................................................... 4
3.1 Features of the model ..................................................................................................... 4 3.2 Costing methods ............................................................................................................. 6 3.3 Data collection ................................................................................................................ 7 3.4 Assumptions .................................................................................................................... 9
4 Results ............................................................................................................................. 10 4.1 Total actual costs ........................................................................................................... 10 4.2 Unit costs................................................................................................................ 11 4.3 Costs of the KEPH conditions ........................................................................................ 15
5. Scenarios ......................................................................................................................... 18 Conclusion and next steps ....................................................................................................... 23 Annex tables ............................................................................................................................ 24 Annex 1: Facility Questionnaire ............................................................................................... 26 Annex 2: KEPH Questionnaire (outpatient) ............................................................................. 56 Annex 3: Exit Questionnaire .................................................................................................... 72
2
1. Background and Context One of the strategic objectives of the NHSSP II is to improve upon the equitable and efficient allocation of financial resources in the health sector. The Kenyan Essential Package for Health (KEPH) has been developed in order to help target public resources (Government and development partner) towards cost-effective services that benefit the most vulnerable population groups. Providing sufficient resources for this package will be important in ensuring that this strategy is successful. At the same time the Government requires an estimate of the overall cost of all medical services provided (KEPH and non-KEPH), now and in the future, in order to develop and implement a healthcare financing policy and strategy that takes account of the needs of the of the nation, encourages greater risk pooling for services and provide information on how additional resources committed to health care by the government might be used to finance an increase in the depth and breadth of the overall benefits package financed by government, employers and communities. To address these needs, work was commissioned to develop a model that could be used to estimate the current costs of providing the KEPH services, more general estimates of the total costs of service and then enable projections to be made about how costs would change if the KEPH was implemented according to normative standards or overall utilisation changes. The result will be a large model based on excel but with frequent use of menus
and user forms to make both data entry and output user friendly.
2. Objectives The Terms of Reference produced by the Ministry of Health for this assignment suggests the overall objective of this assignment should be “ to help the Ministry of Health in Kenya develop a costing methodology and procedure that will facilitate the completion of the numerous cost-related activities in the AOP and JPWF, provide improved and more detailed cost estimates for health care planning, scenario analysis, and future iterations of the AOP, provide linkages between “top-down” and “bottom-up” approaches, and have applicability to other parts of the financial cycle” 1. During the inception phase, the following specific objectives or use of the model were highlighted2:
1. Provide an estimate of the current costs of delivering health services to those seeking care (KEPH and general services) based on the unit costs of standard cost centres in health facilities (e.g. cost per patient day, per diagnostic test, per outpatient visit)
2. Provide a projection of the costs of delivering health services to those projected to have a health need (met and unmet), assuming that people present at facilities
3. Estimate the costs of delivering services for the KEPH based on standard treatment guidelines that is can be updated as new service protocols are developed and are added to the package.
4. Reveal differences in productivity across facilities of a similar category 5. Provide guidance on reimbursement for services at different levels of the system.
1 Terms of Reference, Kenya Health Sector Financing Strategy Support to Develop Costing Approaches
for AOP2 Implementation, AOP3 Preparation and Health Financing Strategy, DRAFT #3 – September 8, 2006. 2 OPM, Development Of The Health Sector In Kenya (GTZ), Inception Report, May 2007.

3
Three main activities were undertaken to achieve these objectives . Firstly, a survey of x-number health facilities was undertaken to obtain information on the current costs of services. Data were obtained from a survey of health facilities divided by ownership - Public, NGO/FBO and Private - and level - Tertiary Hospital to Dispensary and community level. Services captured include personal health services, outreach activities and national programmes. Information was collected from each service level on staffing, activities (patients treated, outreach camps etc), space used by department, equipment and capital spending and spending on recurrent items including drugs and medicines (include in-kind distribution from KEMSA), wages and operating costs. Secondly, a spreadsheet based model was developed that would utilise the actual and normative cost data (activity three) to derive activity based unit cost estimates for inpatient and outpatients, and cost per KEPH conditions. It can also be used to simulate the estimated cost of future services based on different scenarios of KEPH and non-KEPH activity. The former is based around the cost of expanding essential services to target groups. The spreadsheet model utilises a step down cost accounting methodology for allocating costs based on user specified allocation criteria. The sector is divided into 21 sub-sectors relating to ownership and level plus the three levels of public administration. Thirdly, the costs of providing KEPH based services based on standardised norms. This work was undertaken by a team of four experts comprising two clinicians, a laboratory expert and a pharmacist. Team extracted the resource requirements of providing the KEPH services according to current treatment guidelines (Kenyan best practice). This information was then converted into financial resource requirements per condition within the model. The information is necessarily simplified but is designed to capture the main determinants of cost for treatment of an average condition. This report will focus mainly on the actual costs of health services – KEPH and non-KEPH and begin to explore scenarios that that demonstrate how costs would change as coverage of services expand.

4
3. Methodology
The specification for the model is quite exacting requiring measurement of detailed actual costs of providing the KEPH services, more general actual costing of all services delivered at all levels and by through different types of providers (public, faith based, NGO, private-for-profit) and normative costing of KEPH and general services based on service standards and normatives for the facilities.
3.1 Features of the model
The following features of the health care system are considered important in capturing the realities of the health care system are so are incorporated into the design of the model: Actual and normative cost – The model allows a distinction between the normative and actual costs of service provision. Actual costs are the costs of current practice as observed in facilities and captured in cost and expenditure information of facilities. Actual costs incorporate system inefficiencies and inappropriate quality of care. Normative costs, by contrast, focus on the costs of providing treatment for conditions according to a standard guideline set at the national or international level. Normative treatment implies treatment that is appropriate using staff and medical inputs that are sufficient but not excessive to treat the patient effectively. Normative treatments almost always assume the use of generic medicines in treatment of patients (where they exist). Facility based costing - The total cost of health services do not increase in a linear fashion as service coverage is expanded. Some costs, particularly commodities, are directly related to the number of patients treated while in other cases costs, particularly related to recurrent overhead, administration and capital costs are related to the size and number of facilities. To capture these the cost model utilises a facility structure which to approximate the actual and projected number of facilities of different types (hospital, health centre, dispensary etc). Included in the data requirements are standard (average) costs of building and equipment which, when annualised, will provide an estimate for new facilities required as coverage of health services expand. Dual approach to costing - The specification requires a detailed costing of the KEPH and also a more general costing of all health service provision. The KEPH is a list of around 50 detailed conditions focused on the main policy priorities of maternal health, family planning, health of children under five and treatment of priority communicable diseases. The list of conditions covered is similar to many essential service packages in other countries. From a methodological perspective it would be difficult to cost properly all items in the KEPH without an estimate of the general costs of health facilities (to permit accurate apportionment and take account of economies of scale and scope). At the same time at a hospital level hundreds of services are provided to patients which, in cost terms, require further classification to take account of age groups, co morbidities etc. It is not realistic to expect to cost all possible categories of service in a short timescale so a . dual approach to costing was used. For the health service-wide costing the focus is on the unit costs of intermediate cost centres. A patient stay is made up of a number of building blocks including the (specialty specific) stay on the ward (the cost of which is influenced principally by the length of stay), surgical procedures (influence by time in operating theatre), outpatient visits, diagnostic tests, x-rays etc. By deriving unit costs for each of these

5
cost-pools we should be able to provide the costing building blocks for any particular service. It is then a matter of adding up the required number of days on a ward, time in surgery, number of tests and number of outpatient visits. For the KEPH components a more detailed approach is required. We propose to derive the normative cost of standard treatment guidelines for each KEPH activity both for medical supplies required and staff time. This is added to the fixed costs derived from the generalised facility costing (above) to provide an estimate of the costs of each element of the KEPH. Supply and demand side costs - The model focuses on the costs of health service provision (supply side). These costs include government and donor spending on health services and also household contributions in the form of user fees (official and unofficial) and in-kind contributions to care (such as medicines brought into the facility by family). It does not reflect the demand side costs of service such as transport and the opportunity costs to the household of missing work by patient and attendant. It is, however, recognised, that such costs may be considerable and represent a significant barrier to using services. Analysis of reasons for differences in service uptake and facility productivity may suggest that demand side costs are critical and so could lead to a financing response from the health service. Costs of transport could be accommodated either by increasing the coverage of services (e.g. health centres closer to communities) or providing transport. If this is the case such costs would then be included into the modelling. The main elements of the resulting model are illustrated in the figure below (Figure 1) which also forms the basis of the main menu page of the excel prototype. Figure 1: Main components of the costing model
The logic of the model is that the two main data sets - actual facility costs and normative resource inputs (described in

6
3.3 Data collection) – provide two main flows of data that produce firstly unit costs of services and then projections of total costs of providing services based firstly on current utilisation (current number of inpatients, outpatients, community outreach services etc) and then on targets or projections for future utilisation of services (scenario utilisation). Final unit and total costs are based on a series of core assumptions including:
□ Numbers of facilities (by level)
□ Proportion of patients/population served by public, FBO, NGO and private providers
□ Services included in the KEPH
□ Normative assumptions about the way KEPH services are provided
□ Core inflation rates including wage increases
□ Target occupancy of services These assumptions can be changed and their impact on costing observed within the model.
3.2 Costing methods The model employs at its heart a step down costing methodology where costs of services are firstly divided between direct costs that are incurred by identifiable departments and overhead costs that are shared (apportioned) between departments. At a second stage the costs of overhead (administration etc), support (kitchen etc) and clinical support (operation theatres etc) are allocated to final service departments (inpatient, outpatient, outreach) according to the physical use of these departments made by each final service department. This enables calculation of total department costs, costs per unit of final service (cost per admission etc) and cost per intermediate department (cost per operation, lab test etc). The model is run 15 times during calculation phase for each category of facility (public, FBO/NGO & private for each of levels 2 to 6). A separate section of the model simulates the cost of community services. These basic costs can then be used both to estimate the current cost of patients treated and also to simulate the cost of future services as patient numbers increase, cost rise or normatives change. The cost of KEPH services are calculated using a combination of bottom up costs for medical supplies and some staff costs supplemented by a portion of overhead and support costs obtained from the step down process. Bottom-up costing is based on an ingredients approach which costs the main items used to produce a unit of service. A top-down approach takes the total costs of all services and then allocates them to cost-centres and then services using apportionment rules. A bottom-up approach is primarily suited to the costing of direct inputs such as medicines or staff that are directly involved in patient care (nurses, doctors etc). A top-down approach is usually need for the allocation of overhead costs (utilities, cost of buildings etc) and also some indirect staff inputs such as security or administration. The main model produces a number of key outputs including:
□ Costs of providing services by level and type of provider
□ Unit costs by department, level and type of provider
□ Unit costs of intermediate cost centres – cost per lab test, x-ray, operation etc
□ Costs per KEPH condition - actual and normative
□ Scenario costs based on changes in patient load, facilities, KEPH, inflation etc

7
3.3 Data collection
In order to undertake the exercise two main types of data are required:
information on current costs of providing services – both KEPH and in general
resource implications of normative protocols A number of studies have been undertaken to estimate the costs of services across facilities notably:
GTZ report on private health care.
CHAK cost analysis by Mokua
Study by Wangombe and Mercy 2006 costing the delivery of minimum essential health services package in the coast province, Kenya for Danida
Programmatic costing undertake for NHSSP II While each of these studies provide a good picture of specific aspects of cost across the sector, they were not considered individually not even when taken together to offer a sufficiently representative picture of costs across the sector. It was therefore decided to carry out a costing of services provided for levels one to six and across the main provider categories – public, FBO/NGO and private-for-profit. In addition, information was collected on provincial and district health offices to enable an estimation of the cost of these levels and their allocation between a super-overhead administrative function and direct service provision. A questionnaire (Appendix One) was used to obtain information on activities, expenditure, in-kind supplies received staffing numbers and patterns and use of space and equipment. The questionnaire was modified for use in district and provincial offices. In addition Ministry of Health own spending was analysed and apportioned between its super-overhead administrative function and direct service provision.
Table 1: Final usable sample for facility survey3
Public NGO/FBO
4 Private Total
Dispensary 19 23 10 52
Health Centres 27 27
Nursing Homes 1 12 13
District Hospitals 21 10 11 42
Provincial Hospitals
7 7
National Hospitals 2 1 3
District Offices 8 8
Provincial Offices 2 2
86 34 34 154
A sample of facilities was drawn aimed to ensure representation across the country and by provider type but subject to limitations on budget available. The sample was stratified by provider ownership, level and region and facilities were then randomly sampled within in each type and region (Table 1). . From an initial 240 facilities intended to be sampled it was
3 Provisional sample – facilities actually sampled were slightly fewer.
4 Dispensaries and health centres were combined for NGO/FBO and private sector providers.

8
possible obtain information from 200. Of these many facilities provided incomplete data so the final sample was reduced to 154. In addition to the general data collection on activities and costs of services two additional instruments were utilised. A survey of the actual costs of treating patients for all the main KEPH was undertaken for a sub-sample of 70 facilities (Instrument in Appendix two). This is a detailed instrument that obtains information for each condition on medicines required (by age group), staffing inputs, laboratory tests and examinations as well as the number of patients treated in an inpatient and outpatient setting. Secondly, an exit survey was undertaken to obtain information from patients on demand side costs of care (Instrument in Appendix Three). This was aimed at both inpatients and outpatients and obtained information on costs of transport, accommodation for accompanying relatives as well as the out of pocket purchase of medicines and supplies from outside the hospital. This information is used to adjust the overall costs (by level and function) to take account of costs not recorded in facilities. Data cleaning took a considerable period since at many of the facilities insufficient information was available on key components required for costing including staff numbers, financial information and service activities. The final sample of facilities providing adequate information for costing purposes was reduced to 150. A series of issues arose that lead initially to results that, when triangulated to other data, indicated a strong upwards bias in the final costs. These were
1. A private dispensary that indicated costs at least ten times the average. Exploration suggested that much of this cost was attributable to activities that lie outside the main purpose of the facility and the facility was dropped from the study.
2. A level 4 public facility that reported an unrealistically high number of medical staff while also reporting little activity. This observation was dropped.
3. It became apparent during the initial reporting of draft results that the salary component and staff numbers of public facilities differed substantially (by a factor of 2) from the expenditure on personnel reported by the Ministry of Health. The major reason for this was the result of oversampling of larger level four facilities relative to the frequently much small sub-district hospitals (also categorised as level 4). The data were subsequently re-weighted to take account of this bias. Spending on personnel fell to levels that are comparable to the Ministry of Health expenditure analysis (used in the National Health Accounts) although it should be noted that the costs are not identical partly because facilities may choose to buy in contracted staff financed from their own resources.
4. It became apparent during analysis and initial presentation of results that the distinction between FBO/NGO and private level 2 and level 3 (dispensary and health centres) facilities is not always clear. This, combined with the relatively small sample achieved of these facilities, led to the decision to collapse these facilities into a single category for each ownership type.
9
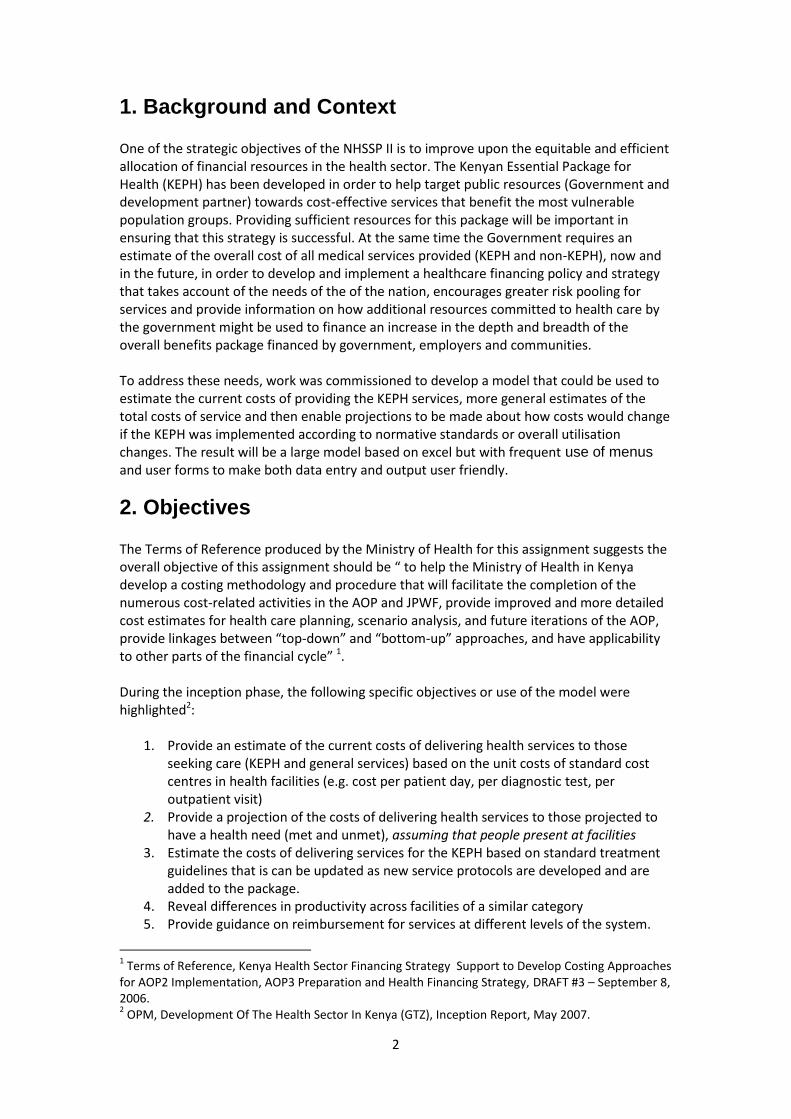
3.4 Assumptions In order to derive both baseline and scenario costs a series of assumptions were applied to the data. All these can be entered and modified in the costing model (Figure 2). Figure 2: Assumption menu in costing model
Assumptions used in deriving baseline actual costs
1. Costs per square metre to derive building costs (20,00 to 30,000 per square metre) 2. Depreciation rates (right off) used to annualise capital costs (8 years for medical
equipment/vehicles, 30 years for buildings) 3. Medical mark-ups (20% storage, 30% wastage, 20% distribution) 4. Target facility productivity (80% target bed occupancy, threshold for increases in
outpatient and admissions before capital expansion required) Assumptions used in deriving scenario costs
1. Inflation rates used in projections. These were based on three year averages based on information from the Bureau of Statistics. (
2. Cost drivers – variables used to project variable costs, semi variable and fixed costs 3. Assumptions about the incidence/prevalence of conditions in the population,
proportion requiring treatment and inpatient admission rate

10
4 Results In this section we describe the main results of the actual costing. Data were collected at the end of 2007 and financial data refer to the year 2006-2007 (Base year)5.
4.1 Total actual costs The modelling suggests that the total cost of services amounts to around KSh. 61.4 billion6. Just over 54% of this cost is in public sector facilities, 17% in FBO/NGO facilities, 22% in the private sector and just under 6% on overall administration, provided directly the Ministry, Province and District (Table 2). Around 33% of this cost is absorbed by salaries (53% of recurrent funding) and 21% by drugs and medical supplies (28% of recurrent). The ratio of staff spending varies across sectors and levels with more than 70% of cost in public outpatient facilities and less than 20% in some private facilities. Table 2: Summary total costs of health services
Capital costs are incorporated through a valuation of the new cost of buildings and standardised equipment (land values are not costed). At attempt was made to value actual equipment available but the information provided was not consistent and much of it was incomplete so that it could not be properly utilised. Instead costed normative equipment lists were used as the basis for deriving costs of equipment by each level of service. These were available for each level of service. For level four facilities, for example, the list of medical equipment comprises more than 400 main items. The annualised capital cost should, therefore, be considered an average normative rather than a reflection of actual capital spending.
5 Financial and activity data were also collected for 2005-2006 and these were use in some cases
where the 2006-2007 were not available with inflation (10%) adjustment. 6 This corrects an earlier figure reported of 74 billion which arose mainly because of the over sampling
of larger level four facilities.

11
The focus of this study is on costs and information on the sources of funding was not, therefore, explicitly obtained. More information on this aspect will be available in the National Health Accounts. The recurrent cost of the public sector (Ksh 24 bn) is comparable to the Ksh 21 bn reported by the Ministry of Health for the budget year 2006/07. The remainder of the cost is financed through formal facility user charges, user demand-side costs (transport, prescriptions purchased outside facilities) and contributions from other sources including direct donor funding. Figure 3: Total base (2007) costs by function
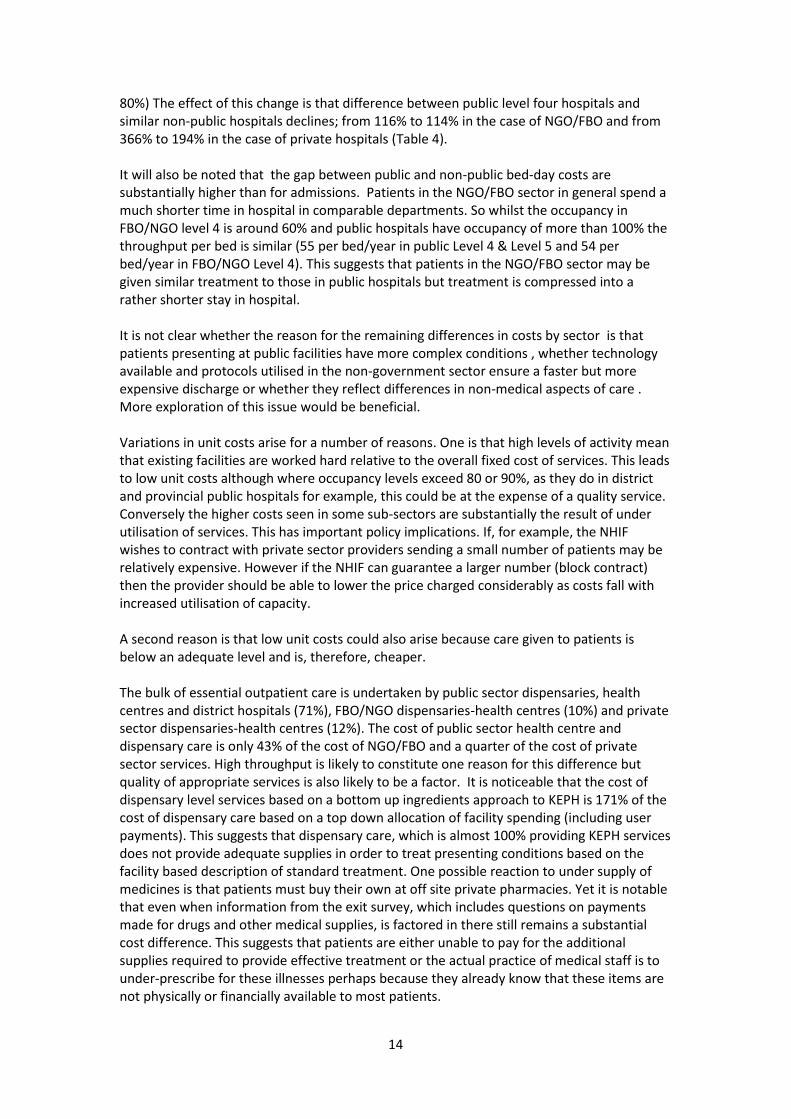
Just under half (49%) of the cost of care is absorbed by outpatient services and 43% by inpatient services (Figure 3 & Annex Table 1). Some inpatient services are included in private and NGO/FBO dispensaries and health centres. These are largely day beds for monitoring of medical conditions and delivery care and are not comparable to the inpatient services offered in hospitals. The cost of the community level (Level 1) is not yet well incorporated into the baseline actual costing although simulations will be possible. Unit costs of both public and NGO/FBO community services were obtained from Ministry and NGO sources. The coverage levels for 2007 were based only on modest coverage by public services. Furthermore these services are likely to be heavily under costed since no salaries and only a small allowance was then paid to public sector staff working in the community by the public sector. In contrast, NGO estimates of cost all include modest salaries paid to community workers which mean that costs increase substantially if significant levels of NGO/FBO provision is assumed. Costs will also increase if if public community workers are properly compensated for their time as many think is necessary in order to sustain the programme and provide effective services.
4.2 Unit costs Four types of generalised unit costs are derived from the model- cost per admission (inpatients), cost per bed-day, cost per outpatient (all types of contact) and cost per adjusted bed-day. Each of these unit costs is disaggregated by provider type and level. The latter is included because it provides a crude comparator between all types of facility and output (inpatient and outpatient) by converting outpatient visits into ‘resource equivalent’

12
bed-days. This is on the basis that the resources required to provide an inpatient day is roughly equivalent to five outpatient visits. The first step is to collect information on total spending across the main economic line items: salaries, drugs and other supplies and overhead expenditure (utilities, maintenance, capital costs etc) (See questionnaire in Annex 1). Unit costs are based on a step down costing approach which first allocates all costs to overhead (administration, facilities & transport), support (laundry, kitchens, sterile supplies), clinical support (pharmacy, operating theatres, laboratory, imaging, intensive care) and direct patient departments (inpatient, outpatient, outreach and national programmes). Figure 4: Allocation factors used for hospital unit costs (Public District Hospitals)
Step down apportionment to direct patient departments is then applied successively first to overhead and then the support/clinical support. Apportionment factors are specified in the model. The default is to use space (for overhead costs), activity (where available) for clinical support and bed-days or adjusted bed-days where other data are not available. Most information was available for public hospitals while much less information was available on private facilities. It should be noted that this difference in information affects the allocation of spending by department and final unit cost. It does not affect the overall cost of these facilities or spending by level and provider. There is separate step down module for each provider type-level including administration (Figure 4).

13
Table 3: Generalised unit costs by facility level
Unit Costs (K.Sh) Outpatient visit
Admission Bed-days Adjusted Bed-days
CI (% average)
2. Dispensary (Public) 174 - - 868 63%
3. Health Centre (Public) 223 3,500 3,500 1,207 29%
4. District Hospital (Public) 518 12,970 2,186 2,322 85%
5. Provincial Hospital (Public) 434 12,953 1,885 1,944 41%
6. Tertiary Hospital (Public) 1,405 48,474 4,921 5,162 0%
7.Nursing Home /Enhanced Health Centre (Public) 202 1,767 1,419 1,075 77%
2/3 Health Centre/Dispensary (FBO/NGO) 633 2,242 4,194 3,223 51%
4. District Hospital (FBO/NGO) 947 15,110 3,746 3,958 59%
2/3 Health Centre/Dispensary (Private) 850 5,614 11,871 4,584 53%
4. District Hospital (Private) 1,592 47,491 8,300 8,195 89%
6. Tertiary Hospital (Private) 2,277 96,857 18,704 16,241 0% 7. Nursing Home/Enhanced Health Centre (Private) 1,431 16,252 4,531 5,285 45%
The results (Table 3) indicate that as expected the costs of tertiary (level 6) services are considerably higher than at other levels. The cost of private level 6 services is, in addition, roughly twice that of services provided in level 6 public facilities. The costs of services provided in public district and provincial (levels 4 & 5) and FBO/NGO district level hospitals are extremely similar. One reason why the costs in these public facilities are relatively low is that the facilities are often extremely crowded with occupancy rates of more than 100%. Table 4: Comparison of actual and optimised unit costs in district (level 4) hospitals (% relative to public)
Current Optimised
Admission Bed-day Admission
Bed-day
Public 12,970 2,186 12,032
2,106
NGO/FBO 15,110 3,746 13,658
2,865
116% 171% 114% 136%
Private 47,491 8,300 23,340
4,520
366% 380% 194% 215%
Differences in unit costs are likely to be a combination of a difference in case-mix, inherent differences in productivity and quality variation. The model allows the effect of differences in productivity based on patient throughput to be reduced by providing an optimised scenario which varies capacity so that bed-occupancy adjusts to a target figure (default is
14
80%) The effect of this change is that difference between public level four hospitals and similar non-public hospitals declines; from 116% to 114% in the case of NGO/FBO and from 366% to 194% in the case of private hospitals (Table 4). It will also be noted that the gap between public and non-public bed-day costs are substantially higher than for admissions. Patients in the NGO/FBO sector in general spend a much shorter time in hospital in comparable departments. So whilst the occupancy in FBO/NGO level 4 is around 60% and public hospitals have occupancy of more than 100% the throughput per bed is similar (55 per bed/year in public Level 4 & Level 5 and 54 per bed/year in FBO/NGO Level 4). This suggests that patients in the NGO/FBO sector may be given similar treatment to those in public hospitals but treatment is compressed into a rather shorter stay in hospital. It is not clear whether the reason for the remaining differences in costs by sector is that patients presenting at public facilities have more complex conditions , whether technology available and protocols utilised in the non-government sector ensure a faster but more expensive discharge or whether they reflect differences in non-medical aspects of care . More exploration of this issue would be beneficial. Variations in unit costs arise for a number of reasons. One is that high levels of activity mean that existing facilities are worked hard relative to the overall fixed cost of services. This leads to low unit costs although where occupancy levels exceed 80 or 90%, as they do in district and provincial public hospitals for example, this could be at the expense of a quality service. Conversely the higher costs seen in some sub-sectors are substantially the result of under utilisation of services. This has important policy implications. If, for example, the NHIF wishes to contract with private sector providers sending a small number of patients may be relatively expensive. However if the NHIF can guarantee a larger number (block contract) then the provider should be able to lower the price charged considerably as costs fall with increased utilisation of capacity. A second reason is that low unit costs could also arise because care given to patients is below an adequate level and is, therefore, cheaper. The bulk of essential outpatient care is undertaken by public sector dispensaries, health centres and district hospitals (71%), FBO/NGO dispensaries-health centres (10%) and private sector dispensaries-health centres (12%). The cost of public sector health centre and dispensary care is only 43% of the cost of NGO/FBO and a quarter of the cost of private sector services. High throughput is likely to constitute one reason for this difference but quality of appropriate services is also likely to be a factor. It is noticeable that the cost of dispensary level services based on a bottom up ingredients approach to KEPH is 171% of the cost of dispensary care based on a top down allocation of facility spending (including user payments). This suggests that dispensary care, which is almost 100% providing KEPH services does not provide adequate supplies in order to treat presenting conditions based on the facility based description of standard treatment. One possible reaction to under supply of medicines is that patients must buy their own at off site private pharmacies. Yet it is notable that even when information from the exit survey, which includes questions on payments made for drugs and other medical supplies, is factored in there still remains a substantial cost difference. This suggests that patients are either unable to pay for the additional supplies required to provide effective treatment or the actual practice of medical staff is to under-prescribe for these illnesses perhaps because they already know that these items are not physically or financially available to most patients.

15
Unit costs can be disaggregated by department level. For most facilities these relate to broad specialty areas (medicine, surgery, Obstetrics & Gynaecology) permitting a slightly more detailed comparison of unit costs across facilities.
4.3 Costs of the KEPH conditions
Unit and total costs of the KEPH conditions are composed of two components; direct and indirect. The direct component is the cost of medicines and supplies and key staff directly involved in the treatment of the condition (doctors, clinical officers and nurses). These were obtained through an ingredients approach by asking facilities to list the supplies required together with minutes of staff time (by type). A questionnaire was developed that collected information by condition and age group of patient for both outpatient and inpatient treatment (Annex 2). Drugs and medical supplies were quantified in terms of drug used, dosage and dosage frequency. Staff inputs were quantified in terms of minutes per visit (for outpatients) and per admission (for inpatients). The indirect component is based on an apportionment of the overall costs of running the facility to individual KEPH services based on a step down principle described earlier. The overhead includes an apportionment of all the costs of administration, support and clinical support services. It also includes the costs of direct departments (inpatient and outpatient) less the costs supplies and staffing included in the direct component. Costs of the KEPH component of services by level are shown in Annex Table 2. These suggest
that the KEPH constitutes around 74% of the total cost of services. In the public sector estimated costs represent more than 90% of the total whilst in the private and NGO/FBO sector the figure is closer to 60% of costs. One interpretation of this finding is that the FBO/NGO sector is less effective at targeting resources to policy priorities (KEPH package). An alternative view is that they may well be providing services that are classified by
patients as priority, including much essential acute surgery (e.g. appendectomy), trauma and essential medicine (e.g. treatment for infarction) which are not listed in the KEPH. The results permit a break-down of total costs of most KEPH services (Figure 5 & Annex Table 2). This suggests that Child services dominate the cost of KEPH services constituting around 48% of the cost with child malaria the single largest item contributing 14.5% to the
Figure 5: Total of costs of KEPH services by main condition

16
cost. Of the 32% going on adult services 13.5% is for Anti Retroviral drugs for HIV/AIDs. Safe delivery is the main item (7.4%) in the 14% of the costs of maternal health. The indirect element – outpatient visit or bed-day (net of the direct KEPH cost) of the KEPH costs varies substantially depending on which facilities are used (
Table 5). In some cases a use of a higher level facility ad resulting larger overhead to treat a particular condition is justified. Emergency obstetric should only be carried out in hospitals (level 4 and above) equipment with operating theatre, blood banking etc. In other cases services can be provided at a lower level because the higher technology of more sophisticated facilities is not needed. Finally, some services can be provided at a lower level provided there is provision for referral to more sophisticated services if required – normal delivery is one example of this case. Table 5: KEPH overhead costs for inpatient and outpatients
To obtain the approximate cost of treating a KEPH condition the direct cost of an episode (Table 5) should be added to the appropriate overhead. So, for example, the cost of a normal delivery at a level four facility is: Ksh. 825 (direct cost) + 1,5477 * (1.8 bed-day at level 4) = Ksh. 3,609 This cost does not include the cost of antenatal or post natal care. Nor does it take account of the costs of possible complications. The direct cost of a caesarean section, for example, is estimated to be more than Ksh. 5,000 plus perhaps 5 days hospital indirect cost. The data can be used to construct the expected cost of delivery care by multiplying the unit cost of pregnancy conditions by the probability of that condition (Table 6). So, for example, antental care is assumed to be required by 100% of women (probability 1) whilst caesarean section is provided to only 5% of women so that the actual cost is 14,445 but the expected cost (cost multiplied by probability) is only 722. This suggests that the expected cost is r Ksh 8,661 per delivery. Such calculations could be further developed by including the cost of
7 Includes patient costs of drugs and medical supplies purchased outside the facility and collected in
the exit survey.

17
opportunistic disease during the partum period that are often a significant cause of (indirect) maternal mortality. Table 6: The expected cost of delivery care given probability of complications (level 4 public)
Probability ALOS Direct Indirect Total Cost x prob
Antenatal care 1 438
1,041
1,479
1,479
Clean and safe delivery 0.95 1.8 825
2,784
3,609
3,429
Episiotomy 0.2 590
590
118
Caesarean section 0.05 5 5,164
9,281
14,445
722
Severe Anaemia 0.1 6.4 738
9,900
10,638
1,064
Eclampsia - severe convulsions 0.01 8 1,306
12,375
13,681
137
Management of haemorrhage 0.05 7 961
10,828
11,789
589
Management of Sepsis 0.08 4.8 181
7,425
7,606
608
Post-partum care 1 113
402
515
515
Expected cost 8,661
Similar calculations, either for individual KEPH conditions or packages of service can be undertaken with the model. It should be noted that for cases where continuous treatment is required such as for ARTs or family planning8 the direct KEPH cost reflects the annual cost of treatment. Otherwise the unit cost reflects the cost of one episode of illness.
8 Based on the supplies required to produce one couple year of protection – male and female
condoms 120, Injectibles 4 per year, oral pill 14 cyles per year. See http://www.usaid.gov/our_work/global_health/pop/techareas/cyp.html

18
5. Scenarios The second objective of the costing work is to develop scenarios that examine how much it would cost to deliver services to an increasing proportion of the core target groups. A rough comparison of the KEPH patients recorded in the survey with the expected number of patients based on full coverage9 of likely illness suggests that services covers around 44% of outpatient and only 17% of inpatient needs; even less in the case of some services such as obstetric care10. Scenarios in the model begin by specifying, for each KEPH condition, the target population (under five, pregnant women etc) the expected incidence/prevalence of the disease in target population, the proportion requiring treatment and inpatient admission rate (Figure 6). The user is also asked to specify a level of coverage by the target year. 100% will ensure that all the needs of the target group are covered but this may turn out to be unaffordable or considered unrealistic in terms of service take-up. The model cannot make these judgements but will show the user the implications in cost terms. A scenario year is also selected. The model is loaded with census projections to the year 2017 so will adjust the size of the target groups according to these projections. Figure 6: Specifying disease assumptions and target coverage
The user is also able to consider how the workload should be spread between public, NGO/FBO and private sectors for inpatient and outpatient care (Figure 6). For each condition
9 Full coverage is implies that all patients requiring treatment in target groups associated with each
condition are provided with services. 10
It is difficult to be exact about base-line coverage by condition since conditions within main groups are often misclassified. In particular, many conditions are mis-classified as Malaria in records. Overall coverage for the main KEPH groups (inpatient and outpatient combined) are estimated as Child Health 80% (average is increased by relatively high levels of vaccination that comprise a lot of the workload), Adult Health 13%, Maternal Health 28% and Other Reproductive Health (largely family planning) 62%.

19
the user is able to specify the target group to which the service is aimed and target coverage. The proportion with the condition is defined as the proportion of the target group with the condition in any year. For some conditions this may exceed 100%. So, for example, for childhood diarrhea children under 5 would be expected to have at least 3 episodes in a year, implying a probability of 300%. At the same time not all episodes require treatment. Many of these episodes will be self-limiting or require simple oral rehydration at home. The ‘% of the condition requiring treatment’ specifies what proportion of these episodes will require formal medical intervention. The default is the current pattern of services (Figure 7). At baseline this indicates that 75% of outpatient and 80% of public patients are treated in the public sector. Around 82% of outpatients are treated in dispensaries or health centres while 69% of inpatients care is provided in district hospitals or equivalent (level 4). For scenario modeling the user is able to vary these assumptions to assess the impact on costs.
Figure 7: Allocation of outpatient and inpatient loads by level and provider (baseline)
The finally part of the scenario building is to consider the number of facilities. Each facility type can be considered and an estimate of whether the facility is under or over utilized is given (Figure 8). Where there is over-utilisation preserving quality is likely to mean that the size of the facility needs to be enlarged and/or more facilities constructed. Alternatively or in addition it is possible to return to the scenario sheet and re-allocate the workload between facility types.

20
Figure 8: Specifying the numbers/size of facilities
The projected cost of scenarios depends on many factors described above. It is envisaged that a number of scenarios can now be constructed and costs computed. As a preliminary step an example scenario was undertaken for the year 2010. This year is chosen to illustrate the effect of coverage since much of the of the cost increase is associated with the increase in targets rather than population or inflation. The scenario is as follows: Year = 2010 Target = 100% Non-Keph utilisation: held constant at 2007 rates per 1000 (implies some increase in activity since the population is greater Pattern of provision: baseline distribution of workload between sectors Facility size: held constant This produces an estimate for the KEPH package of KSh 160 billion or about $57 per capita (Table 7). Table 7: Cost of extending KEPH to 100% of target population (2010 prices)
The first scenario indicates that there is insufficient capacity in the existing facilities to cope with the additional workload. Adjusting the scenario to eliminate this capacity constraint,

21
either by building new or extending existing facilities, leads to additional (overhead and capital) costs leading to an overall increase in the cost of KEPH to Ksh 190 Billion or $67 per capita (Table 7). ear = 2010 Target = 100% Non-Keph utilisation: held constant at 2007 rates per 1000 (implies some increase in activity since the population is greater Pattern of provision: baseline distribution of workload between sectors Facility size: increased to accommodate new workload Table 8: Cost of extending KEPH to 100% of target population (2010 prices, adjusted facility size)
The basis for all these scenarios are assumptions about the target population, incidence/prevalence of disease, need for treatment and target coverage (proportion of target population actually covered by KEPH. The data used are attached (Table 9). We would encourage readers of this report to review these data and suggest adjustments. We can then re-model the data based on revised disease assumptions.

22
Table 9: Assumptions of target population and coverage for scenarios

23
Conclusion and next steps This report is the first stage in documenting and disseminating the costing work. We anticipate that the model and accompanying data-set will be of use in a number of ways to inform policy including:
In-depth scenarios for the scaling up of KEPH services in Kenya in the context of the available resource envelope
Use the summary estimates of cost to inform development of budgets and the medium term budget framework. Comparison of the cost of services to budget available can be used to help focus policy attention on affordability of current and future policy promises.
Provide in-depth analysis of the costs of service areas such as maternal or child health aimed at specific user groups
A discussion of variations in facility productivity by level and type of provider
Discussion of the extent to which non-government capacity might be used to substitute for public capacity to deliver priority services through new systems of allocation including contracting and vouchers
Use of costing to develop case based pricing for services for use by public and non-public purchasers/insurer. The costs of services can be compared with current tariffs in order to help revise future prices.
Two further products accompany this report:
Manual describing how to use the model
Policy brief (s) on key findings arising from the costing It was intended from the outset that the model would be updated in two main ways. Firstly, information on costs could be updated to incorporate new survey or even regular administrative data on costs. As a next stage consideration might be given to developing a short-form version of the questionnaire that could be used to gather the most important data on costs and cost drivers. A second update would be to incorporate new conditions in the KEPH. It is clear that the epidemiology of the country will change and non-communicable diseases and trauma will become more important in contributing to the burden of disease. The costs of these emerging conditions can be calculated by incorporating more condition protocols of treatment into the model .
24
Annex tables Annex Table 1: Actual cost of services by function (baseline)

25
Annex Table 2: Cost of KEPH services by main group and condition (baseline)

26
Annex 1: Facility Questionnaire
REPUBLIC OF KENYA
Ministry of Health
HEALTH FACILITY SURVEY – KENYA 2007
TOOL FOR
DISTRICT AND PROVINCIAL HOSPITALS

27
INTRODUCTION
The Ministry of Health has embarked on a process of developing a long-term fiscally
sustainable, equitable and efficient approach to financing health services in Kenya. This
process is consultative and draws participation and representation from various
stakeholders in health development. To fast track the process, the Ministry has established
a Health Financing Task Force to ensure that a Health Sector Financing Strategy will be in
place by December 2007. The strategy will be informed by a number of activities that
include: Costing of Kenya Essential Package of Health (KEPH) and other Health Services;
National Health Accounts (NHA) and; Public Expenditure Tracking (PETS). To date, a
draft costing model is ready and has been discussed and disseminated widely for
consensus.
In view of the above, the Ministry is conducting a survey with a view to estimating the
costs of providing KEPH and other health services in the country. The exercise will be
conducted in health facilities (both public and private) selected randomly from eight
provinces in the country. Information gathered from this exercise will be used to inform
resource mobilization and allocation practices/investment decisions within the ministry of
health.
28
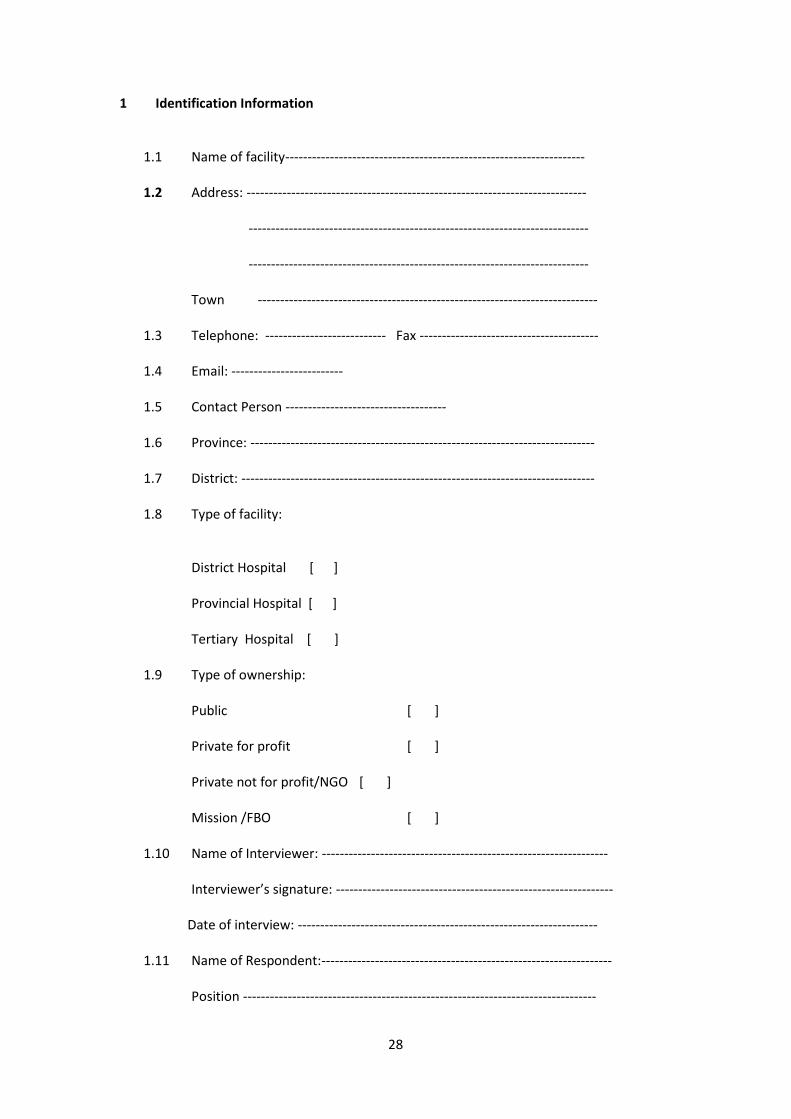
1 Identification Information
1.1 Name of facility------------------------------------------------------------------- 1.2 Address: ----------------------------------------------------------------------------
---------------------------------------------------------------------------- ----------------------------------------------------------------------------
Town ----------------------------------------------------------------------------
1.3 Telephone: --------------------------- Fax ---------------------------------------- 1.4 Email: -------------------------
1.5 Contact Person ------------------------------------
1.6 Province: ----------------------------------------------------------------------------- 1.7 District: -------------------------------------------------------------------------------
1.8 Type of facility:
District Hospital [ ] Provincial Hospital [ ] Tertiary Hospital [ ]
1.9 Type of ownership:
Public [ ] Private for profit [ ] Private not for profit/NGO [ ] Mission /FBO [ ]
1.10 Name of Interviewer: ----------------------------------------------------------------
Interviewer’s signature: --------------------------------------------------------------
Date of interview: -------------------------------------------------------------------
1.11 Name of Respondent:-----------------------------------------------------------------
Position -------------------------------------------------------------------------------

29
Signature -----------------------------------------------------------------------------
1.12 Control Data

30
2 Infrastructure and physical facilities 2.1 Year of establishment ----------------------------------------------------------- 2.2 Basis of accounts:
Cash [ ] Accruals [ ]
2.3 Last Completed financial year end (accounting period) ----------------------------------
----- 2.4 Total area of facility
a) Land in Acres ……………………………………………. b) Buildings in square metres ………………………………..
2.5 Physical facilities - Inpatients
Facility Available Number of wards
Number of beds
Area m2 Market Value/ Replacement cost ( KShs
Y N Inpatient - Female Medical
Inpatient - Female Surgery
Inpatient - Obstetrics
Inpatient - Gynaecology
Inpatient - Male Medical Inpatient - Male Surgery
Inpatient – Mixed General Ward
Inpatient - Paediatrics Inpatient - trauma & orthopaedics
Inpatient - Psychiatry
Inpatient - ENT Inpatient - NBU (new born unit)
Inpatient - burns unit
Others – please specify

31
2.6 Physical facilities - Outpatients
Facility Available Number Area m2 Replacement Cost ( KShs
Y N
Outpatient - dental Outpatient - A & E (Casualty)
Outpatient - General Outpatient clinic (filter clinic)
Outpatient - MCH/FP
Outpatient - CCC/VCT
Outpatient - STI
Outpatient - Sick child clinic Outpatient - Tuberculosis/respiratory
Outpatient - ENT
Outpatient - Eye Clinic
Outpatient - Specialist clinics
Outpatient - other
2.7 Physical Facilities – Clinical Support Services
Facility Available Number Area m2 Replacement Cost ( KShs)
Y N Clinical support - operating theatres
Clinical support - laboratories
Clinical support - imaging (X-ray etc)
Clinical support - ICU Clinical support - ICU with Paediatric facilities
Clinical support - medical records
Clinical support - Pharmacy Clinical support - obstetric theatres
Clinical support - physiotherapy & occupational health
Clinical support - EEG
Clinical support - ECG
Clinical support - ECT Clinical support - Blood Banking
Clinical support - CSSD
Clinical support - renal unit Clinical Support - ambulance
Clinical Support - other

32
2.8 Physical Facilities – Administration and general support
Facility Available Number Total Area m2
Replacement Cost ( KShs
Y N
Overhead - administration
Overhead - facilities
Overhead - transport civil
Overhead - IT
Overhead - other
Overhead - administration
Overhead - facilities
Overhead - Finance
Support - kitchen
Support - laundry
Support - mortuary Support - biomedical support / engineering / maintenance
Support - gas supply
Support - procurement
Support - Others
2.9 Technology Equipment Availability
Type Number available
Number non functional
Norm for Type of facility
Estimated value of requirement (KShs)
MRI
CT Scanner
General X-ray Equipment -Fixed
Mobile x-ray unit
Ultrasound Equipment
Mammography equipment
ECG Equipment
EEG Equipment
Radiotherapy Equipment
Cardiac Monitor
Echo
Cardiac Cathether Lab
ICU Monitors
ICU Ventilators
NICU Incubators
Cold Chain freezers
Specialised Lab equipment (please specify)
Other technologies (please specify)

33

34
3 Fixed Assets 3.1 Vehicles
Type Number (Qty)
Is the equipment functional? (Y/N)
Total Cost (KShs)
Replacement Value (KShs)
Ambulance
Vans
Bus
Trucks
Doctors Cars
Management Cars
Motor Cycles
Other vehicles
3.2 Medical Equipment - See separate sheet 3.3 Plant and Machinery
Type Available Y/N
Is the equipment functional? (Y/N)
Total Cost (KShs)
Estimated Replacement Values (KShs)
Notes – gaps in equipment availability
Maintenance equipment
Generator/ Own power source
Water supply e.g bore holes/storage tanks
Catering Equipment
Waste disposal plant
Laundry Equipment
Others (please specify)

35
3.4 Other Assets
Type Is the equipment functional? (Y/N)
Total Cost (KShs)
Estimated Replacement Values (KShs)
Notes – gaps in equipment availability
Computer equipment
Fixtures and Fittings
Office Equipment
Others (please specify)
4 Activity Details 4.1 Inpatient Activity
Department Available Beds
Admissions in year
Average Length of Stay (days)
Number of deaths
Occupied Bed days
Inpatient - Female Medical
Inpatient - Female Surgery
Inpatient - Obstetrics
Inpatient - Gynaecology
Inpatient - Male Medical
Inpatient - Male Surgery
Inpatient – Mixed General Ward
Inpatient - Paediatrics
Inpatient - trauma & orthopaedics
Inpatient - Psychiatry
Inpatient - ENT Inpatient - NBU (new born unit)
Inpatient - burns unit
Others – please specify

36
4.2 Outpatient Activity
Department Average Treatment/contact time per patient
Number of days per week open
Number of hours open per day
Number of attendances for year
N
Outpatient - dental Outpatient - A & E (Casualty)
Outpatient - General Outpatient clinic (filter clinic)
Outpatient - MCH/FP
Outpatient - CCC/VCT
Outpatient - STI Outpatient - Sick child clinic
Outpatient - Tuberculosis/respiratory
Outpatient - ENT
Outpatient - Eye Clinic Outpatient - Specialist clinics
Outpatient - other
4.3 Surgery/Theatre - Capacity
Type of Theatre Number of theatres available
Number of days per week open
Number of hours open per day
Number of minutes per major case
Number of minutes per each minor case
General Surgery
Orthopaedic Surgery
ENT Surgery
Obstetric Theatre
Others (please specify)
4.4 Theatre Activity
Number of cases for year
Minor Surgeries - Female
Major Surgeries - Female
Minor Surgeries -Male
Major Surgeries - Male
Orthopaedics
Trauma & Burns
Obstetrics -Minor
Obstetrics Major
Other procedures (please specify)

37
4.5 Consultant led Outpatient Clinics
Activity Type
Number of days per week open
Number of hours open per day
Number of minutes per attendance
Number of attendances for year
Medical Clinic
Neurology
Paediatrics
Dermatology
Psychiatry
Ophthalmology
General Surgery
Orthopaedics
Genitourinary
ENT
Neuro Surgery
Plastic Surgery
Gynaecology
Ante-Natal
Neo-natal
Rheumatology
Others (please specify)

38
4.6 Pharmacy prescriptions Analysis Please provide below details of the proportion of pharmacy scripts attributable to other departments: (a sample of scripts in a week)
Number of scripts
Value of scripts (KShs)
% by number of scripts
% by value of scripts
INPATIENT DEPARTMENTS
Inpatient - Female Medical
Inpatient - Female Surgery
Inpatient - Obstetrics
Inpatient - Gynaecology
Inpatient - Male Medical
Inpatient - Male Surgery
Inpatient – Mixed General Ward
Inpatient - Paediatrics
Inpatient - trauma & orthopaedics
Inpatient - Psychiatry
Inpatient - ENT
Inpatient - NBU (new born unit)
Inpatient - burns unit
Others – please specify
OUTPATIENT DEPARTMENTS
Outpatient - dental
Outpatient - A & E (Casualty)
Outpatient - General Outpatient clinic (filter clinic)
Outpatient - MCH/FP
Outpatient - CCC/VCT
Outpatient - STI
Outpatient - Sick child clinic
Outpatient - Tuberculosis/respiratory
Outpatient - ENT
Outpatient - Eye Clinic
Outpatient - Specialist clinics
Outpatient - other
PRESCRIPTIONS FROM OUTSIDE FACILITY

39
4.7 CSSD activity analysis from a sample of issues in a week
Number of issues
Value of issues (KShs)
% by issues
% by value
INPATIENT DEPARTMENTS
Inpatient - Female Medical
Inpatient - Female Surgery
Inpatient - Obstetrics
Inpatient - Gynaecology
Inpatient - Male Medical
Inpatient - Male Surgery
Inpatient – Mixed General Ward
Inpatient - Paediatrics
Inpatient - trauma & orthopaedics
Inpatient - Psychiatry
Inpatient - ENT
Inpatient - NBU (new born unit)
Inpatient - burns unit
Others – please specify
OUTPATIENT DEPARTMENTS
Outpatient - dental
Outpatient - A & E (Casualty)
Outpatient - General Outpatient clinic (filter clinic)
Outpatient - MCH/FP
Outpatient - CCC/VCT
Outpatient - STI
Outpatient - Sick child clinic
Outpatient - Tuberculosis/respiratory
Outpatient - ENT
Outpatient - Eye Clinic
Outpatient - Specialist clinics
Outpatient - other

40
4.8 Pathology Tests Activity Analysis from sample of tests in a week
Number of tests
Value of tests
% by tests % by Value
INPATIENT DEPARTMENTS
Inpatient - Female Medical
Inpatient - Female Surgery
Inpatient - Obstetrics
Inpatient - Gynaecology
Inpatient - Male Medical
Inpatient - Male Surgery
In patient – Mixed general ward
Inpatient - Paediatrics
Inpatient - trauma & orthopaedics
Inpatient - Psychiatry
Inpatient - ENT
Inpatient - NBU (new born unit)
Inpatient - burns unit
Others – please specify
OUTPATIENT DEPARTMENTS
Outpatient - dental
Outpatient - A & E (Casualty)
Outpatient - General Outpatient clinic (filter clinic)
Outpatient - MCH/FP
Outpatient - CCC/VCT
Outpatient - STI
Outpatient - Sick child clinic
Outpatient - Tuberculosis/respiratory
Outpatient - ENT
Outpatient - Eye Clinic
Outpatient - Specialist clinics
Outpatient - other
TESTS FROM OTUSIDE FACILITY

41
4.9 Radiology Examinations Analysis from sample of examinations in a week
Number of examinations
Value of examinations
% by number of examinations
% by Value
INPATIENT DEPARTMENTS
Inpatient - Female Medical
Inpatient - Female Surgery
Inpatient - Obstetrics
Inpatient - Gynaecology
Inpatient - Male Medical
Inpatient - Male Surgery
Inpatient - Paediatrics
Inpatient - trauma & orthopaedics
Inpatient - Psychiatry
Inpatient - ENT
Inpatient - NBU (new born unit)
Inpatient - burns unit
Others – please specify
OUTPATIENT DEPARTMENTS
Outpatient - dental
Outpatient - A & E (Casualty)
Outpatient - General Outpatient clinic (filter clinic)
Outpatient - MCH/FP
Outpatient - CCC/VCT
Outpatient - STI
Outpatient - Sick child clinic
Outpatient - Tuberculosis/respiratory
Outpatient - ENT
Outpatient - Eye Clinic
Outpatient - Specialist clinics
Outpatient - other
Examinations from outside facility

42
4.10 Physiotherapy Activity analysis from sample of examinations in a month
Number of examinations
Value of examinations
% by number of examinations
% by Value
INPATIENT DEPARTMENTS
Inpatient - Female Medical
Inpatient - Female Surgery
Inpatient - Obstetrics
Inpatient - Gynaecology
Inpatient - Male Medical
Inpatient - Male Surgery
Inpatient - Paediatrics
Inpatient - trauma & orthopaedics
Inpatient - Psychiatry
Inpatient - ENT
Inpatient - NBU (new born unit)
Inpatient - burns unit
Others – please specify
OUTPATIENT DEPARTMENTS
Outpatient - dental
Outpatient - A & E (Casualty)
Outpatient - General Outpatient clinic (filter clinic)
Outpatient - MCH/FP
Outpatient - CCC/VCT
Outpatient - STI
Outpatient - Sick child clinic
Outpatient - Tuberculosis/respiratory
Outpatient - ENT
Outpatient - Eye Clinic
Outpatient - Specialist clinics
Outpatient - other
Outpatient – Occupational therapy
Outpatient - Orthopaedics
Examinations from outside facility

43
4.11 ICU patient classification from sample of discharges in a month
Number of Discharges
ALOS OBD % by OBD
INPATIENT DEPARTMENTS
Inpatient - Female Medical
Inpatient - Female Surgery
Inpatient - Obstetrics
Inpatient - Gynaecology
Inpatient - Male Medical
Inpatient - Male Surgery
Inpatient - Paediatrics
Inpatient - trauma & orthopaedics
Inpatient - Psychiatry
Inpatient - ENT
Inpatient - NBU (new born unit)
Inpatient - burns unit
Others – please specify

44
5 Staff Information
5.1 Total Number of staff for year: …………… 5.2 Basis for staffing departments
Department Please indicate (ab) for available beds and (oc) for occupancy. If other basis please indicate
Consultants/Specialist
Medical officers
Clinical Officers
Nurses Support staff
Inpatient - Female Medical
Inpatient - Female Surgery
Inpatient - Obstetrics
Inpatient - Gynaecology
Inpatient - Male Medical
Inpatient - Male Surgery
Inpatient - Paediatrics Inpatient - trauma & orthopaedics
Inpatient - Psychiatry
Inpatient - ENT Inpatient - NBU (new born unit)
Inpatient - burns unit
Others – please specify
45
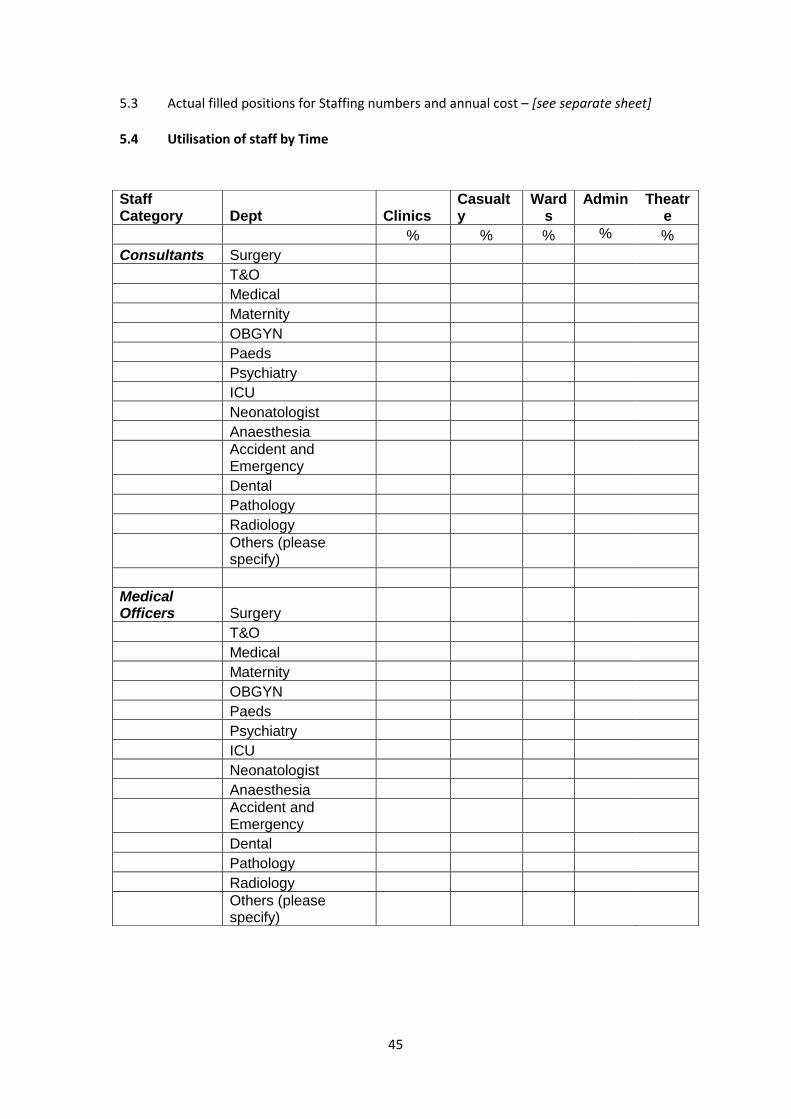
5.3 Actual filled positions for Staffing numbers and annual cost – [see separate sheet]
5.4 Utilisation of staff by Time
Staff Category Dept Clinics
Casualty
Wards
Admin Theatre
% % % % %
Consultants Surgery
T&O
Medical
Maternity
OBGYN
Paeds
Psychiatry
ICU
Neonatologist
Anaesthesia
Accident and Emergency
Dental
Pathology
Radiology
Others (please specify)
Medical Officers Surgery
T&O
Medical
Maternity
OBGYN
Paeds
Psychiatry
ICU
Neonatologist
Anaesthesia
Accident and Emergency
Dental
Pathology
Radiology
Others (please specify)

46
6 Other Recurrent Expenditure 6.1 Total recurrent expenditure for year excluding staffing costs: ………………… 6.2 Breakdown of recurrent costs
Expenditure
Annual expenditure (KShs)
Value of central store drugs received
Number of kits received
Value of unpaid expenses (KShs) –For cash accounting only
Clinical Supplies
Pharmacy Supplies
Pathology reagents and supplies
Dental supplies
Medical gases
Physiotherapy supplies
Radiology Supplies
CSSD Supplies
Theatre supplies
Food and beverage supplies
Others
Property Expenses
Rent and rates
Electricity
Fuel and Oil
Oxygen/Gas
Water Supplies
Waste Management
Maintenance Expenses
Maintenance of Medical Equipment
Maintenance of Cold Chain Equipment

47
Expenditure
Annual expenditure (KShs)
Value of central store drugs received
Number of kits received
Value of unpaid expenses (KShs) –For cash accounting only
Maintenance of Buildings
Maintenance of plant
Maintenance of dental equipment
Cleaning Expenses
Gardening costs
Laundry costs
Bedding and Linen Supplies
Catering Crockery
Others
Transportation and travel expenses
Travelling and Transportation expenses
Motor Vehicle Maintenance &Licences
Others
Communications:
Telephone Expenses
Internet/Other communications
Printing and stationery
Others
Other Expenses
Insurance
Professional and consultancy fees
Bank charges and interest
Advertising
Marketing and promotions
Miscellaneous expenses

48
Expenditure
Annual expenditure (KShs)
Value of central store drugs received
Number of kits received
Value of unpaid expenses (KShs) –For cash accounting only
Bad Debts, waiver and welfare
Others(please specify)
Depreciation
Buildings
Medical Equipment
Motor vehicles
Plant and Machinery
Fixtures and Fittings
Computer and office equipment

49
7 KEPH Activity details – See separate sheet Information to be collected for each KEPH condition
7.1 Inpatient KEPH Conditions
IN PATIENT KEPH INPUT SHEET
Name of Facility
KEPH Condition
Average Length of Inpatient Stay for condition (days)
Number of inpatient admissions for year with condition
Staffing Input
Please indicate below the staffing input used treat the KEPH condition above
Staff Category Average contact per day (mins)
Total contact for episode (mins)
Specialist
Medical Officers
Clinical Officers
Others (please specify)
Drugs, Medical supplies and Investigations:
Please indicate below the type of drugs medical supplies and Investigative tests used to treat the KEPH condition above
Drugs and Medical Supplies
Name of drug/Medical Supply Quantity Used
Investigative Tests
Name of Test Number of tests

50
51
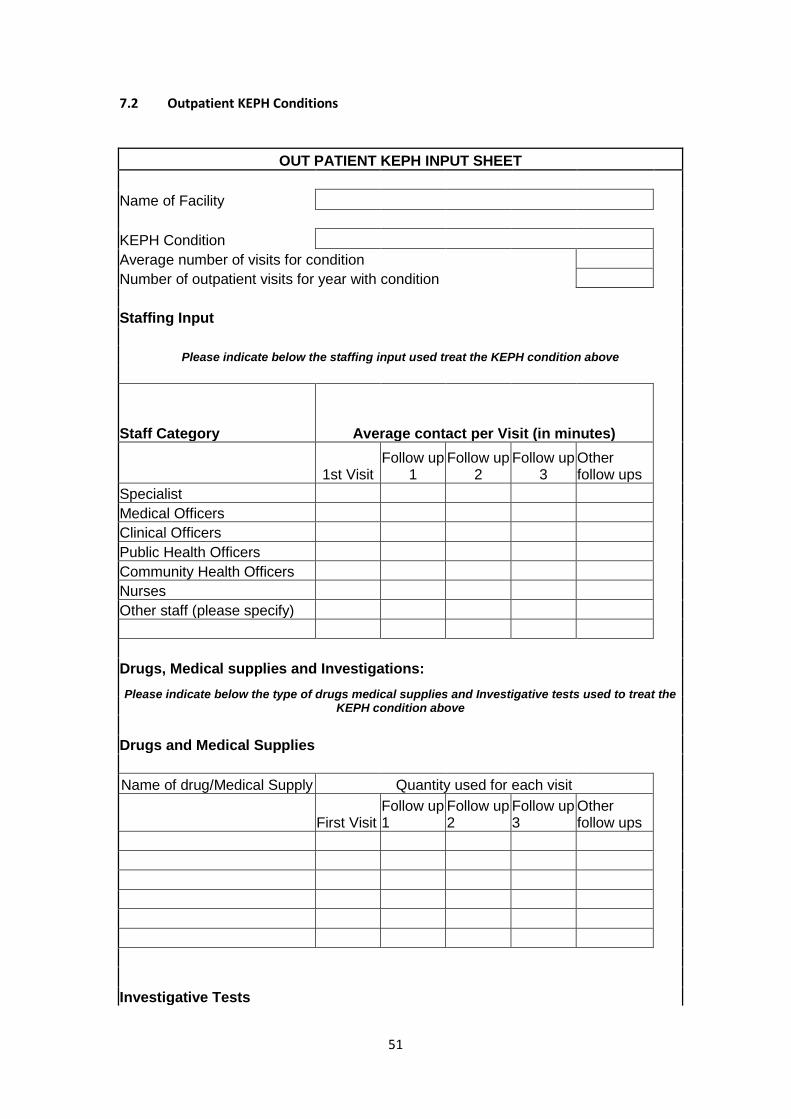
7.2 Outpatient KEPH Conditions
OUT PATIENT KEPH INPUT SHEET
Name of Facility
KEPH Condition
Average number of visits for condition
Number of outpatient visits for year with condition
Staffing Input
Please indicate below the staffing input used treat the KEPH condition above
Staff Category Average contact per Visit (in minutes)
1st Visit Follow up
1 Follow up
2 Follow up
3 Other follow ups
Specialist
Medical Officers
Clinical Officers
Public Health Officers
Community Health Officers
Nurses
Other staff (please specify)
Drugs, Medical supplies and Investigations:
Please indicate below the type of drugs medical supplies and Investigative tests used to treat the KEPH condition above
Drugs and Medical Supplies
Name of drug/Medical Supply Quantity used for each visit
First Visit Follow up 1
Follow up 2
Follow up 3
Other follow ups
Investigative Tests

52
Name of Investigation/test Number of investigations for each visit
First Visit Follow up 1
Follow up 2
Follow up 3
Other follow ups

53
National Health Accounts Survey specific Information 8.1 Sources of and applications of Funding
Funding Source Amount (KShs)
Uses of Funds (KShs) To expand to 6 classifications
Supplies Salaries Overheads
User Fees - Individuals
Corporate insurance schemes
Corporate direct payments
Individual Insurance schemes
NHIF Reumbursements
Grants from GOK in Cash and AIEs
Grants from GOK in Kind (specify)
Donations/Donors/NGOs
Community Funds
Harambee Efforts
Volunteer Labour
Other sources (please specify)

54
8.2 Expenditure on Preventive and Health Promotion Centres including MCH/FP
MCH/FP Type Quantity used (doses)
Value (KShs)
Vaccines BCG
DPTHep BHiB
OPV
Measles
TT
Yellow Fever
Needles and syringes
Safety box
FP Methods Condoms
IUDs
Injectables
Pills
8.3 Capital Expenditure Details – Equipment
Provide details of equipment purchased or received during the year
Name of Equipment Quantity Cost (KShs)
8.4 Motor Vehicles acquired or received
Type of Vehicle Quantity Cost (KShs)

55
8.5 Development expenditure
Type of Development Cost (KShs)
8.6 Buildings Constructed
Type of Building Cost (KShs)
8.7 TB & HIV Information Total number of sputum tests for year ____________ Total Number of Xrays for TB _____________ Total number of slides/polypots ______________ Total expenditure on TB Patients KShs -------------- HIV/AIDS Total number of HIV tests performed _____________

56
Annex 2: KEPH Questionnaire (outpatient)
OUT PATIENT KEPH INPUT SHEET
Name of Facility
KEPH Condition
Average number of visits for condition per illness episode
Number of outpatient visits for year with condition
Age distribution of patients with condition Number of patients
0-1
2-5
6-12
13+
INFANTS (0-under 1 year)
Attendance Proportion of infant (0-1 year) patients requiring visit Proportion of patients requiring admission
First 100%
Follow up 1
Follow up 2
Follow up 3
Other follow ups

57
taffing Input
Please indicate below the staffing input used treat the KEPH condition above
Staff Category Average contact per Visit (in minutes) and percentage seen
1st Visit
% of total patients
(infants 0-1year)
seen by specified
staff
Follow up 1
% of total patients
(infants 0-1year)
seen by specified
staff
Follow up 2
% of total patients
(infants 0-1year)
seen by specified
staff
Follow up 3
% of total patients (infants 0-1year) seen by specified staff
Other follow ups
% of total patients (infants 0-1year) seen by specified staff
Specialist
Medical Officers
Clinical Officers
Nurses
Public Health Officers
Community Health Officers
Other staff (please specify)

58
Drugs and Medical Supplies:
Please indicate below the type of drugs and medical supplies used to treat the KEPH condition above
0-1 year old patient
First visit
Follow up 1
Follow up 2
Name of drug/Medical Supply (drugs, gloves, needles, syringes, giving set, blood, swabs, etc)Name of drugs/Medical Supply/Investigative test
Quantity prescribed Dosage/day
Number
of days Quantity prescribed Dosage/day
Number of days
Quantity prescribed Dosage/day
Number of days

59
Investigations:
Please indicate below the type Investigative tests used to treat the KEPH condition above
Infant 0-1 year old patient
First visit
Follow up 1
Follow up 2
Name of Investigative Tests (lab, X-ray, others)
Number of the test done per infant (0-1 year) patient
% of total patients (infants 0-1 year) undertaking the test
Number of the test done per infant (0-1 year) patient
% of total patients (infants 0-1 year) undertaking the test
Number of the test done per infant (0-1 year) patient
% of total patients (infants 0-1 year) undertaking the test

60
If an operation is required, is this a minor or major procedure? Minor_______ Major ________ (mark as appropriate)
Time for operation in minutes ____________ CHILDREN (1-5 years)
Attendance Proportion of children (1-5 years) patients requiring visit Proportion of patients requiring admission
First 100%
Follow up 1
Follow up 2
Follow up 3
Other follow ups
Staffing Input
Please indicate below the staffing input used treat the KEPH condition above
Staff Category Average contact per Visit (in minutes) and percentage seen

61
1st Visit
% of total patients
(children 1-5 years) seen by
specified staff
Follow up 1
% of total patients
(children 1-5 years) seen by
specified staff
Follow up 2
% of total patients
(children 1-5 years) seen by
specified staff
Follow up 3
% of total patients (children 1-5 years) seen by specified staff
Other follow ups
% of total patients (children 1-5 years) seen by specified staff
Specialist
Medical Officers
Clinical Officers
Nurses
Public Health Officers
Community Health Officers
Other staff (please specify)

62
Drugs and Medical Supplies:
Please indicate below the type of drugs and medical supplies used to treat the KEPH condition above
1-5 years old patient
First visit
Follow up 1
Follow up 2
Name of drug/Medical Supply (drugs, gloves, needles, syringes, giving set, blood, swabs, etc) Name of drugs/Medical Supply/Investigative test
Quantity prescribed Dosage/day
Number
of days Quantity prescribed Dosage/day
Number of days
Quantity prescribed Dosage/day
Number of days
Investigations:

63
Please indicate below the type Investigative tests used to treat the KEPH condition above
1-5 year old patient
First visit
Follow up 1
Follow up 2
Name of Investigative Tests (lab, X-ray, others)
Number of the test done per child (1-5 years) patient
% of total patients (children 1-5 years) undertaking the test
Number of the test done per child (1-5 years) patient
% of total patients (children 1-5 years) undertaking the test
Number of the test done per child (1-5 years) patient
% of total patients (children 1-5 years) undertaking the test
If an operation is required, is this a minor or major procedure? Minor_______ Major ________ (mark as appropriate)
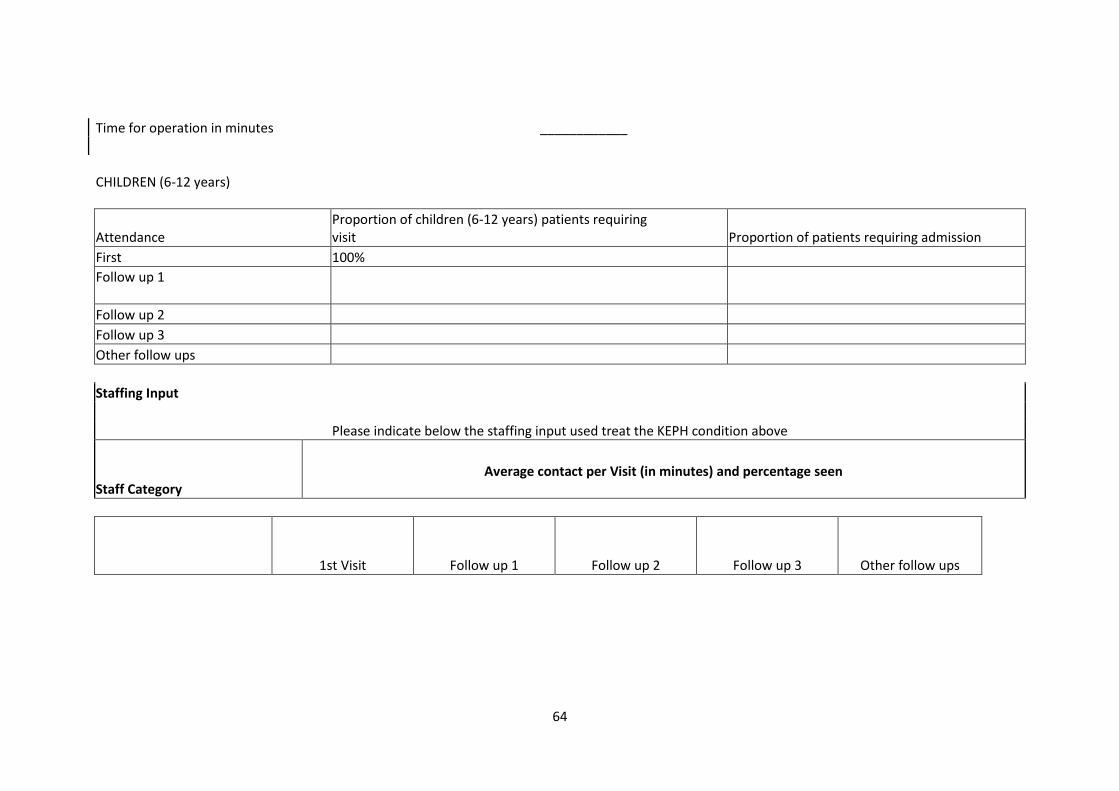
64
Time for operation in minutes ____________
CHILDREN (6-12 years)
Attendance Proportion of children (6-12 years) patients requiring visit Proportion of patients requiring admission
First 100%
Follow up 1
Follow up 2
Follow up 3
Other follow ups
Staffing Input
Please indicate below the staffing input used treat the KEPH condition above
Staff Category Average contact per Visit (in minutes) and percentage seen
1st Visit Follow up 1 Follow up 2 Follow up 3 Other follow ups

65
Contact time (minutes)
% of total
patients (children
6-12 years)
seen by specified
staff
Contact time (minutes)
% of total
patients (children
6-12 years)
seen by specified
staff
Contact time (minutes)
% of total
patients (children
6-12 years)
seen by specified
staff
Contact time (minutes)
% of total
patients (children
6-12 years)
seen by specified
staff
Contact time (minutes)
% of total patients (children
6-12 years)
seen by specified
staff
Specialist
Medical Officers
Clinical Officers
Nurses
Public Health Officers
Community Health Officers
Other staff (please specify)
Drugs and Medical Supplies:
Please indicate below the type of drugs and medical supplies used to treat the KEPH condition above
6-12 years old patient
First visit
Follow up 1
Follow up 2

66
Name of drug/Medical Supply (drugs, gloves, needles, syringes, giving set, blood, swabs, etc) Name of drugs/Medical Supply/Investigative test
Quantity prescribed Dosage/day
Number
of days Quantity prescribed Dosage/day
Number of days
Quantity prescribed Dosage/day
Number of days
Investigations:
Please indicate below the type Investigative tests used to treat the KEPH condition above
6-12 year old patient

67
First visit
Follow up 1
Follow up 2
Name of Investigative Tests (lab, X-ray, others)
Number of the test done per child (6-12 years) patient
% of total patients (children 6-12 years) undertaking the test
Number of the test done per child (6-12 years) patient
% of total patients (children 6-12 years) undertaking the test
Number of the test done per child (6-12 years) patient
% of total patients (children 6-12 years) undertaking the test
If an operation is required, is this a minor or major procedure? Minor_______ Major ________ (mark as appropriate)
Time for operation in minutes ____________

68
ADULTS (13 years and over)
Attendance Proportion of adult (13+ years) patients requiring visit Proportion of patients requiring admission
First 100%
Follow up 1
Follow up 2
Follow up 3
Other follow ups
Staffing Input
Please indicate below the staffing input used treat the KEPH condition above
Staff Category Average contact per Visit (in minutes) and percentage seen

69
1st Visit Follow up 1 Follow up 2 Follow up 3 Other follow ups
Contact time (minutes)
% of total patients
(adult 13+
years) seen by
specified staff Contact
time (minutes)
% of total patients
(adult 13+
years) seen by
specified staff Contact
time (minutes)
% of total patients
(adult 13+
years) seen by
specified staff Contact
time (minutes)
% of total patients
(adult 13+
years) seen by
specified staff Contact
time (minutes)
% of total patients
(adult 13+
years) seen by
specified staff
Specialist
Medical Officers
Clinical Officers
Nurses
Public Health Officers
Community Health Officers
Other staff (please specify)
Drugs and Medical Supplies:
Please indicate below the type of drugs and medical supplies used to treat the KEPH condition above
13 and over years old patient

70
First visit
Follow up 1
Follow up 2
Name of drug/Medical Supply (drugs, gloves, needles, syringes, giving set, blood, swabs, etc)Name of drugs/Medical Supply/Investigative test
Quantity prescribed Dosage/day
Number
of days Quantity prescribed Dosage/day
Number of days
Quantity prescribed Dosage/day
Number of days

71
Investigations:
Please indicate below the type Investigative tests used to treat the KEPH condition above
13 and over years old patient
First visit
Follow up 1
Follow up 2
Name of Investigative Tests (lab, X-ray, others)
Number of the test done per adult (13+ years) patient
% of total patients (adults 13+ years) undertaking the test
Number of the test done per adult (13+ years) patient
% of total patients (adults 13+ years) undertaking the test
Number of the test done per adult (13+ years) patient
% of total patients (adults 13+ years) undertaking the test
If an operation is required, is this a minor or major procedure? Minor_______ Major ________ (mark as appropriate)
Time for operation in minutes ____________

72
Annex 3: Exit Questionnaire COSTING HEALTH CARE SERVICES IN KENYA PATIENT EXIT INTERVIEW INSTRUMENT
Section 1: General Information 1. Name of facility
__________________________________________________________
2. Level of facility
Level 1 2 3 4 5 6
Tick as applicable
3. Type of ownership
Ownership Public Private for profit FBO/mission NGO
Tick as applicable
4. Province_______________________________________________________________
_
5. District_________________________________________________________________
_
6. Division________________________________________________________________
_
7. Location_______________________________________________________________
_
8. Interviewer’s
name________________________________________________________
9. Date of
interview__________________________________________________________
10. Checked and verified by___________________________________________________
11. Date of verification_______________________________________________________

73
Section 2: Patient’s Background Information 12. Name of the
patient________________________________________________________
13. Age of the patient (years)
___________________________________________________
14. What your highest level of education?
Level None Std 1-4 Std 5-8 Form 1-4 Form 5-6 University
Tick as applicable
15. What your main occupation? (Adults
only)_______________________________________
16. Type of patient
Type Outpatient Inpatient
Tick as applicable
If outpatient, go to Q18
17. If inpatient, for how many days was the patient admitted to this facility
______________
18. What mode(s) of transport did you use to travel to this facility for treatment?
Mode Walking Matatu Bus Taxi Others
(specify)
Tick as
applicable
19. Indicate the amount you paid for transport to reach this facility?
______________________
20. How long does it take in minutes to reach this facility by the above mode(s)
____________
21. What is the approximate distance from this facility to your residence?
__________________
22. Which mode of transport will you use to travel to your residence after this?
Mode Walking Matatu Bus Others (specify)
Tick as
applicable

74
23. Estimate the amount that you will pay for transport to reach home after
treatment_______
Section 3: Morbidity, Treatment and Related Costs 24. What the reason for outpatient visit or admission to this facility today? (MAY NOT BE
TODAY IF ADMISSION)
Reason Tick as applicable
Treatment for own illness
Treatment for child’s illness
Immunise child
Antenatal care
Family planning
Minor surgery
Major surgery
Lab tests
Delivery
Others (specify)
25. If it is an outpatient visit, is this the first visit for the present illness episode?
Response Yes No
Tick as applicable
26. If no, what is the visit number ___________________________________
27. Did you pay user fees for the services received at this facility?
Response Yes No
Tick as applicable
28. How much did you pay in total? (Ksh) ____________________________________
29. Were provided with drugs at this facility?
Response Yes No Not applicable
(N/A)
Tick as applicable
If No or N/A, go to Q33

75
30. If yes, provide the following information
Type of drugs Dosage
31. Did you pay for the drugs separately from other fees?
Response Yes No
Tick as applicable
If No, go to Q33
32. How much did you pay for the drugs? Ksh
______________________________________
33. Did you have to buy drugs from “outside” this facility?
Response Yes No Not applicable
(N/A)
Tick as applicable
If No, go to Q35
34. If yes, how much did you pay for drugs from outside? Ksh ______________________
35. Apart from drugs, which other services were provided during the visit or period of
admission at this facility?
Type of service Amount (Ksh) paid if separate fro
other fees

76
36. Apart from drugs and the services provided, did you have do buy other items or other
services from outside this facility during this visit or admission?
Item or type of service Amount (Ksh) paid Remarks
37. Did you pay some amount or gave a gift to staff in this facility for the services
provided, which were not part of the official fees?
Response Yes No
Tick as applicable
38. If yes, indicate how much and/ or the type of gift.
______________________________________________________________________
______________________________________________________________________
______